Brief Report

A Simple High-Throughput Procedure for Microscale Extraction of Bioactive Compounds from the Flowers of Saint John’s Wort (Hypericum perforatum L.)

1
Department of Agrobiotechnology, AgroBioInstitute, Agricultural Academy, 8 Dragan Tsankov Blvd., 1164 Sofia, Bulgaria
2
Centre of Competence “Sustainable Utilization of Bio-Resources and Waste of Medicinal and Aromatic Plants for Innovative Bioactive Products” (BIORESOURCES BG), 1000 Sofia, Bulgaria
*
Author to whom correspondence should be addressed.
Appl. Sci. 2025, 15(13), 7334; https://doi.org/10.3390/app15137334
Submission received: 1 June 2025 / Revised: 25 June 2025 / Accepted: 28 June 2025 / Published: 30 June 2025
(This article belongs to the Special Issue Biosynthesis and Applications of Natural Products)

Abstract

We report the development of a procedure for ultrasound-assisted microscale extraction of metabolites from the flowers of Saint John’s wort (Hypericum perforatum L.), designed for comparative metabolite analysis of plants from genetic resource collections and natural and segregating populations. The procedure involves high-throughput methanol extraction of metabolites from ground-frozen flowers at a selected stage of flower development, which is carried out in a standard 2 mL Eppendorf tube. A total of 18 compounds, including chlorogenic acid, catechins, glycosylated flavonoids, hypericins, and hyperforin, were identified based on LC/DAD/QTOF analysis, of which 16 could be detected in the UV-Vis spectrum. Two alternative versions of the procedure were evaluated: the “single-flower” procedure, including repeated collection and analysis of single flowers from the tested plant, and the “bulk-flower” procedure, employing the collection of a bulk flower sample from the tested plant and analysis of a portion of the ground sample. The results showed excellent technical reproducibility of the “single-flower” procedure when used with the suggested combination of the peak areas for the proto- and stable forms of pseudohypericin and hypericin. Application of the developed “single-flower” procedure for comparison of the plants derived from seed progeny of the apomictic line Hp93 revealed significantly lower metabolite variation among the apomictic progeny plants compared to the variation observed among plants belonging to different genotypes.

1. Introduction

St. John’s wort (Hypericum perforatum L.) is a perennial medicinal plant that has long been known for its antioxidant [1,2,3], antimicrobial [4,5,6], antiviral [6,7,8], antidepressant [6,9,10,11], anti-inflammatory [12,13], and anticancer [14,15] properties and, recently, for its antinociceptive [16], analgesic [17,18], and neuroprotective properties [19]. The species has a wide geographic distribution spanning Europe, North America, and Western Asia. Many of the biological activities of H. perforatum are related to its high content of biologically active compounds such as hypericin, hyperforin, and phenolic antioxidants [1,2,3,4,5,6,7,8,9,10,11,12,13,14,17,18]. The highest content of hypericin and hyperforin—two of the major compounds responsible for the biological activity of H. perforatum—is found in the plant buds and flowers [16,20,21,22,23,24]. The interest in developing natural products based on St John’s wort extracts has increased over the last decade, leading to many commercially available products on the market [25]. The growing interest in this species requires the development of elite cultivars based on the existing genetic and metabolic diversity in the natural populations. A modern breeding program in H. perforatum would require correct metabolite characterization of large plant sets, processing a large number of samples, and, therefore, the application of a highly reproducible, high-throughput procedure for comparative metabolite analysis of single plants from the populations and genetic resource collections.
In addition to the plant genotype, the plant metabolome is significantly influenced by several factors, including the developmental stage of the plant and the plant organ sampled [26,27,28], as well as by numerous other environmental factors. When comparing the performances of different genotypes, the influence of all other factors that could affect the composition of the plant metabolome should be excluded or minimized as much as possible. Ideally, in such cases, the plants should be planted in the same site or experimental field, and the plant material should be collected at the same stage of plant/organ development, within a short time, stored properly for further processing, and used for the extraction of metabolites in preferably smaller volumes when dealing with a large number of samples [29,30]. The sample preparation procedures currently applied for metabolite analysis of Hypericum species typically involve the processing of relatively large amounts of plant material (e.g., tens to hundreds of grams), dried beforehand [23,24,31,32,33,34,35]. This becomes a significant challenge when the number of samples exceeds a few hundred, making it impossible to conduct accurate comparative analyses of individual plants from large collections. Scaling down the sample preparation procedures to support the application of a highly reproducible, high-throughput analysis of the metabolite composition is crucial in such cases. The analytical methods employed for the quantitative and qualitative characterizations of Hypericum perforatum extracts are primarily designed to ensure quality control across various commercial products. The chemically diverse bioactive metabolites in St. John’s wort—most notably phloroglucinols and naphthodianthrones—necessitate the use of multiple chromatographic and detection techniques. Thin-layer chromatography (TLC) and high-performance thin-layer chromatography (HPTLC) serve as fundamental tools for routine qualitative analysis [36,37,38,39,40,41]. For quantitative assessment, high-performance liquid chromatography with diode array detector (HPLC-DAD) is the most widely utilized method due to its versatility [41,42,43]. Meanwhile, liquid chromatography–mass spectrometry (LC-MS) is gaining increasing significance, particularly in pharmacokinetic studies, owing to its superior sensitivity [44,45,46,47,48].
Apomixis is a form of asexual reproduction and a common phenomenon often observed in H. perforatum, where seeds are developed without fertilization. As a result of it, the offspring is genetically identical to the mother plant [49]. Since the progeny is genetically identical, it is expected that the variation in traits, including flower metabolite composition, would be low. Although apomixis has been extensively studied in H. perforatum, to our knowledge, only one study has reported on the variation in metabolites among H. perforatum plants developed through apomixis [32]. Accordingly, the impact of apomixis on the metabolite composition of offspring plants remains poorly studied.
Here, we present the development and testing of a highly repetitive, high-throughput procedure for comparative metabolite analysis of H. perforatum based on a microscale ultrasound-assisted extraction of biologically active compounds from flowers of single plants employing two sampling strategies and using an LC/DAD/MS analytical method. The developed procedure is applied for the characterization of the metabolite variation across three different genotypes and within the seed progeny of one apomictic line of H. perforatum.

2. Materials and Methods

2.1. Plant Material

Field-grown plants of Hypericum perforatum L., specifically lines 3_29, 90_44, 139_28, and 205, and seed progeny of the apomictic line Hp93, which were previously selected from different regions in Bulgaria and are currently part of the AgroBioInstitute’s collection (Kostinbrod, Bulgaria), were used in the experiments. The plants were cultivated in the experimental field during 2023 and 2024 and sampled in the second year at the active blooming phase.

2.2. Determination of Flower Fresh Weight

Three buds or flowers representing each one of the developmental stages 1 to 5 (Figure 1) were collected in triplicate from plants 3_29, 90_44, and 139_28. Using tweezers, the samples were carefully picked and placed into pre-weighed 2 mL Eppendorf tubes (Eppendorf AG, Hamburg, Germany), which were immediately weighed on an analytical balance to determine their fresh weight.

2.3. Collection and Extraction of a Bulk Flower Sample

A bulk flower sample consisting of flowers at developmental stage 4 (Figure 1) was collected from line 205 in the following manner: Fifty to sixty flowers were carefully picked with tweezers and snap-frozen in a 50 mL Falcon™ tube (Falcon, Corning Inc., Corning, NY, USA) immersed in liquid nitrogen in a Cryogenic Dewar flask. The bulk sample was transported to the lab, ground for 1 min at 25 Hz in stainless steel jars using TissueLyser II (QIAGEN AG, Steinhausen, Switzerland), and stored at −80 °C until extraction. Seventy milligrams of frozen ground material were weighed in triplicate in precooled 2 mL Eppendorf tubes and kept frozen in liquid nitrogen until the addition of the solvent. For testing of the optimal proportion of the extracted material and the solvent, methanol (100%) (Macron Fine Chemicals™; VWR, Radnor, PA, USA) was added in a 1/5, 1/10, 1/15, 1/20, or 1/25 (weight/volume) ratio. The tubes containing the obtained mixtures were sonicated using a sweep mode in the dark in an ultrasound water bath (Elmasonic P70H, Elma Schmidbauer GmbH, Singen, Germany) set at 30 °C, 37 kHz, and a power of 100 W. Testing of the extraction duration included periods of 10, 20, 30, 40, 50, and 60 min. During ultrasonic treatment, an external cooling water bath (WCR-8, WITEG Labortechnik GmbH, Wertheim, Germany) was used for the circulation of water cooled down to 4 °C through a hose placed in the ultrasound bath, thus preventing the temperature in the ultrasound bath from exceeding 34 °C. After each extraction, the 2 mL Eppendorf tubes with the obtained methanol extracts were centrifuged at 10,000 rpm for 5 min at room temperature (2-16PK, Sigma Laborzentrifugen GmbH, Osterode am Harz, Germany). The supernatants were filtered through 45 µm membrane filters (CHROMAFIL® PTFE-45/15 MS, Macherey-Nagel GmbH & Co. KG, Düren, Germany) and transferred to 1.5 mL amber vials (Macherey-Nagel GmbH & Co. KG, Düren, Germany) for LC/DAD/MS analysis.

2.4. Collection and Extraction of Single Flower Samples

From each of the plants (3_29, 90_44, 139_28, and apomictic line Hp93) in quadruple repetition, a single fully open flower (stage 4) was placed in a 2 mL Eppendorf tube containing two grinding 3 mm Tungsten Carbide Beads (QIAGEN AG, Steinhausen, Switzerland). The samples were snap-frozen in liquid nitrogen and stored at −80 °C until extraction. Before the extraction, the samples were finely ground using the 2 mL Adapter Sets of TissueLyser II (QIAGEN AG, Steinhausen, Switzerland) at 25 Hz for 30 s and maintained frozen until the solvent addition. One thousand and fifty microliters of 100% methanol was added to each sample, and the ultrasound-assisted extraction was conducted as described in Section 2.3 for the bulk-flower sample procedure, with a duration of 20 min. The obtained extracts were prepared for LC/UV-Vis analysis following the steps described in Section 2.3 for sample preparation for LC/DAD/MS analysis in batches of 16 samples and immediately loaded on the LC autosampler.

2.5. LC/DAD/MS Analysis

LC/DAD/MS analysis was carried out using an Agilent Technologies 1260 Infinity II LC system (Agilent Technologies, Inc., Santa Clara, CA, USA), equipped with a quaternary pump, autosampler, multicolumn thermostat, WR Diode Array Detector (DAD), and an Agilent 6546 Quadrupole Time-Of-Flight (QTOF) mass spectrometer. ESI-MS spectra were acquired in negative ion mode ([M−H]), over an m/z range of 50 to 1500, with the fragmentor voltage set to 120 V. For MS/MS analyses, collision energies of 10, 20, and 40 V were applied. Chromatographic separation was performed on a Knauer Eurospher II 100-2 C18 column (150 × 2 mm, 2 μm particle size; Knauer Wissenschaftliche Geräte GmbH, Berlin, Germany). The column temperature was maintained at 25 °C. The autosampler temperature was set to 10 °C. The mobile phase consisted of eluent A, 0.1% aqueous formic acid (Merck, KGaA, Darmstadt, Germany), and eluent B, 0.1% formic acid in acetonitrile (Macron Fine Chemicals™; VWR, Radnor, PA, USA). The eluent flow rate was set at 0.2 mL/min, and the injection volume was 2 µL. The gradient elution program was as follows: 0–50 min, 10% B; 50–62 min, 100% B; and 62–72 min, 10% B. The DAD monitored wavelengths from 190 to 950 nm, with peak detection at 270 nm and 590 nm. Chromatograms were visualized using Agilent MassHunter Qualitative Analysis software, version 10.0. Compound identification was based on the UV absorption profile, the exact mass of the pseudomolecular ion (as referenced in the Agilent METLIN master accurate mass compound database and accurate mass MS/MS spectral library v.B.08.00, Agilent Technologies, Inc., Santa Clara, CA, USA), and external databases such as the Human Metabolome Database (HMDB) (http://www.hmdb.ca, accessed on 23 January 2025), MassBank (https://massbank.eu/MassBank/, accessed on 23 January 2025), PubChem (https://pubchem.ncbi.nlm.nih.gov/, accessed on 21 January 2025) and the MS/MS fragmentation patterns.

2.6. LC/UV-Vis Analysis

LC/UV-Vis analysis was performed on an Agilent Technologies 1260 Infinity II LC system (Agilent Technologies, Inc., Santa Clara, CA, USA) including a quaternary pump, autosampler, multicolumn thermostat, and an Agilent 1260 Infinity II Multiple Wavelength Detector. Detection of the compounds was performed at 270 and 590 nm. The chromatographic conditions were as for the LC/DAD/MS analysis. OpenLab CDS ver. 2.6 (Agilent Technologies, Inc., Santa Clara, CA, USA) was used to visualize the chromatograms and integrate the chromatographic peaks.

2.7. Statistical Analysis

Each experimental variant in the study was performed as a parallel extraction, with three replicates for the bulk-flower procedure and four replicates for the single-flower procedure. Statistical analyses were conducted using IBM SPSS Statistics version 26 (IBM, Armonk, NY, USA). Mean values were compared using one-way ANOVA and the Tukey post hoc test to assess the variations in fresh weights at different flowering stages, as well as to evaluate the effects of different w/v ratios and extraction durations. Mass Profiler Professional 15.1 (Agilent Technologies, Inc., Santa Clara, CA, USA) was used for statistical analyses applying ANOVA and Student’s t-test.

3. Results

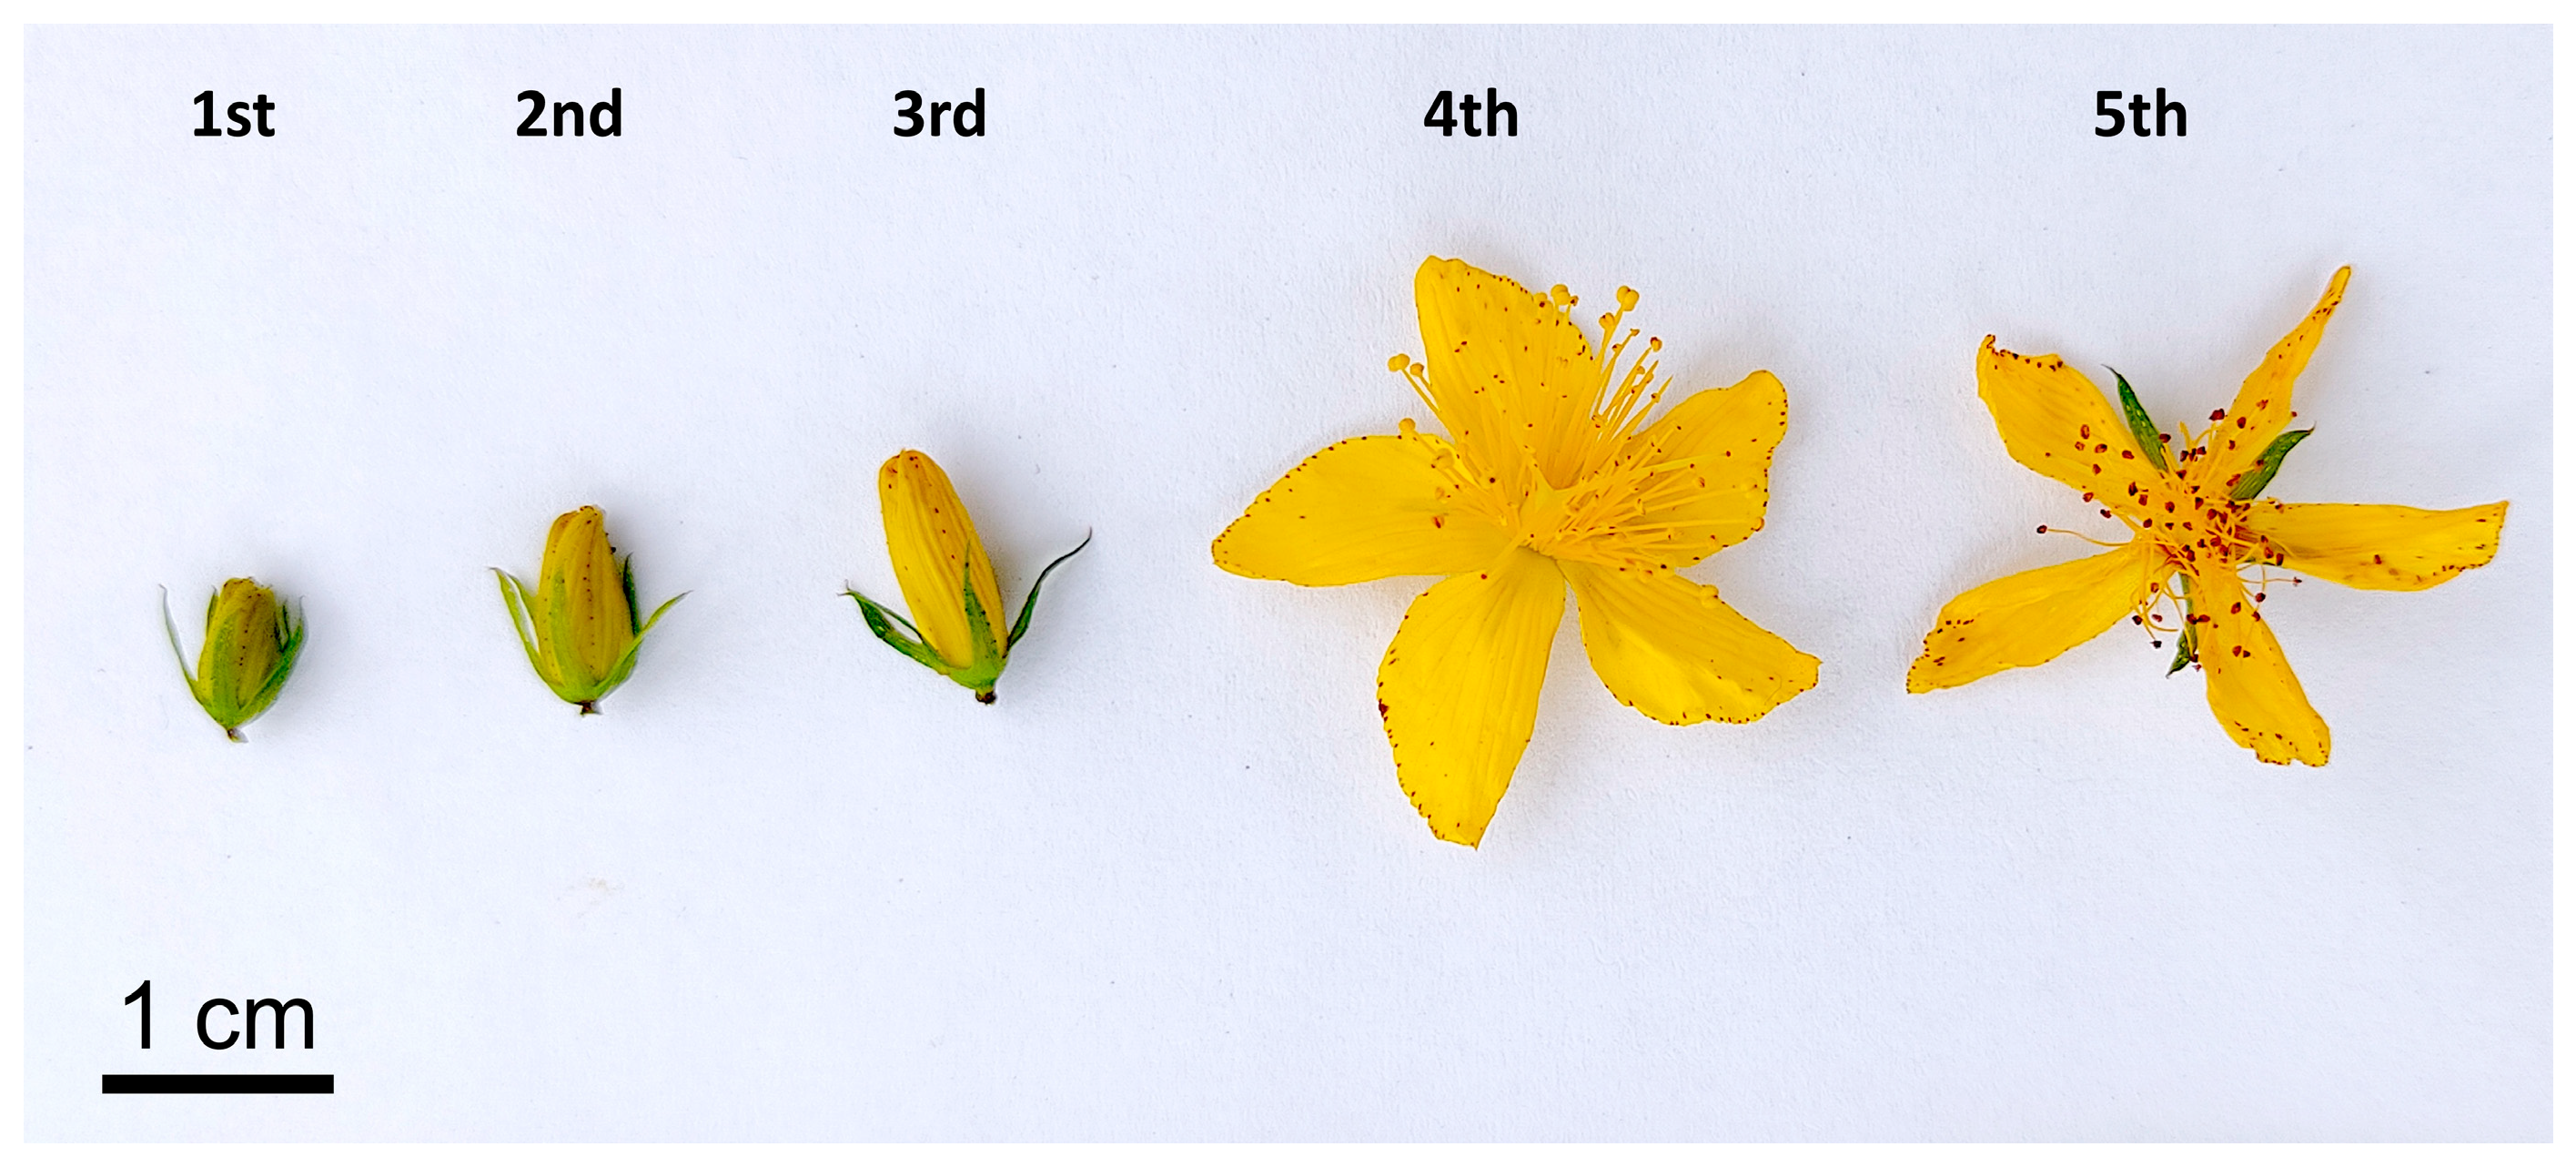
3.1. Selection of the Stage of Flower Development for Analysis

To select the stage of flower development, we assessed the variation in fresh weight of flowers across five different stages according to Tekel’ová et al. [16] for three different genotypes. Stage 4 showed the lowest intra- and inter-genotypic variation in flower weight (Table 1). H. perforatum flowers at stage 4 were reported to accumulate higher levels of bioactive phenolics, characteristic of this species [16]. Moreover, stage 4 is morphologically easy to distinguish from the other sampled stages because of the fully open flower compared to stages 2 and 3, and the light-yellow color of the anthers, which sets it apart from stage 5, where flowers are overblown with brown anthers. Therefore, flowers at stage 4 of development were used for further analysis.

3.2. Bulk-Flower Extraction and LC-DAD-QTOF Analysis

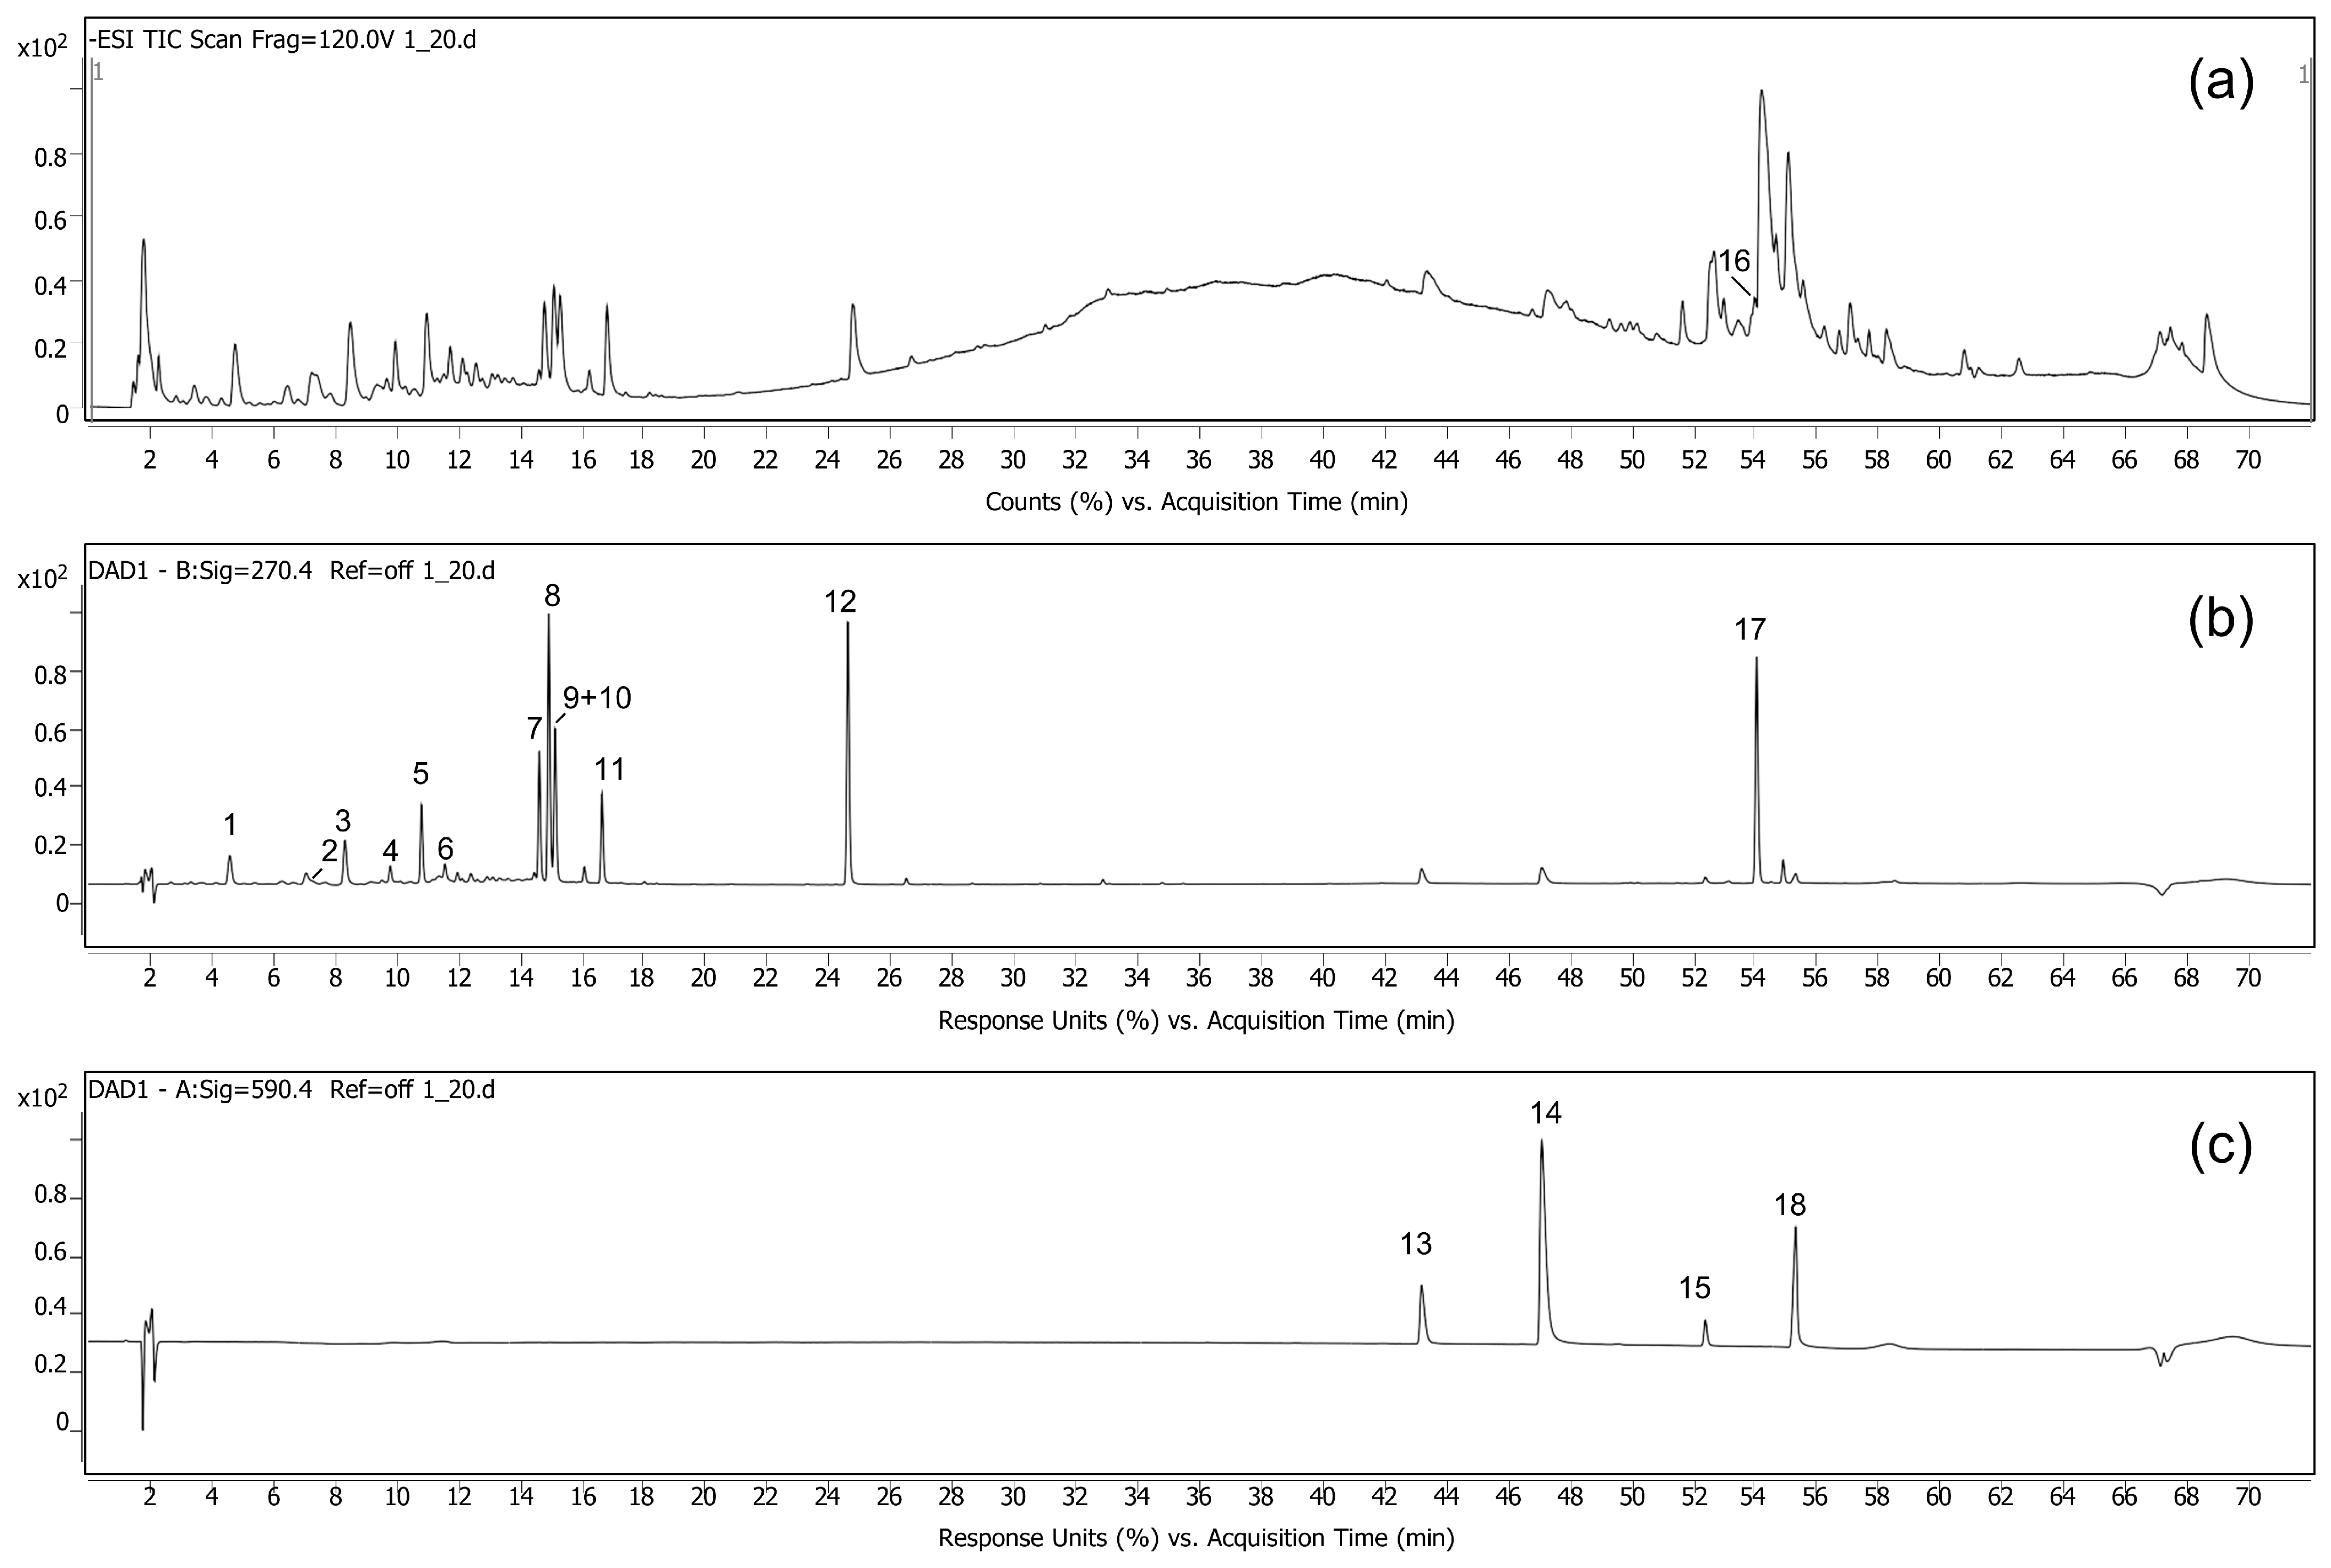
3.2.1. LC-DAD-QTOF Analysis and Identification of the Compounds

The procedure for LC-DAD-QTOF analysis was developed using bulk-flower extraction of flowers at stage 4. A total of 18 compounds were identified based on their exact mass, molecular ion fragmentation, and UV/Vis absorption spectrum, as presented in Table 2. Out of them, 16 were detected in the UV/Vis spectrum, allowing for their use in a comparative analysis applying only a UV/Vis detector (Table 2 and Figure 2). These compounds were well separated except for the collective peak of querciturone + isoquercitrin (compounds 9 and 10, Figure 2). Accordingly, the two compounds were reported collectively in the comparative LC/UV-Vis analysis.

3.2.2. Testing Different Material-to-Solvent Ratios

The possible impact of the proportion of the extracted plant material to the volume of the applied solvent was evaluated by testing different w/v ratios (Table S1). The lowest variation and calculated average relative standard deviation (RSD) in the relative abundances of the analyzed compounds was observed for the 1/15 ratio, which was then selected for further application in the bulk-flower extraction procedure.

3.2.3. Testing Different Durations of the Extraction

Using the bulk flower sample, six different extraction durations were tested (Table S2). The area of each peak/compound was normalized to the sum of all 16 detected compounds. The calculated means and RSD values of compound abundances obtained after each extraction duration are shown in Table S2. The lowest variation and calculated average RSD value were observed for the 20 min duration, which was selected for both the “bulk” and “single-flower” extraction procedures. The observed overall RSD values for all tested variants were below 15%, indicating low deviation from the mean and high reproducibility of the procedure.

3.3. Single-Flower Extraction

The reproducibility of this procedure was evaluated by comparing the results of the LC/UV-Vis analysis of plants from three different genotypes. The results for the mean values of the 16 compounds for each genotype, represented as a percentage of the sum of the peak areas of the analyzed compounds, are shown in Table 3. In terms of differences among the three tested genotypes, the performed ANOVA with a Tukey post hoc test showed significant differences for all compounds except for quercitrin, protopseudohypericin, and pseudohypericin.

3.4. Analysis of Plants Obtained Through Apomixis Using the “Single-Flower” Procedure

We further applied the developed “single-flower” procedure to study the variation in metabolites in the flowers at stage 4 in 19 plants grown from seeds derived from the apomictic line H. perforatum Hp93. The apomixis origin of the plants was proven by analysis with 10 SSR markers, which resulted in uniform SSR profiles. Individual extractions from four flowers at stage 4 were performed for each plant using the developed procedure. A summary of the obtained results is presented in Table 4. As can be seen from Table 4, eleven of the identified compounds showed low variation among the samples with RSD values below 15%, including chlorogenic acid, catechin, procyanidin B2, epicatechin, procyanidin C1, hyperoside, querciturone + isoquercitrin, quercitrin, pseudohypericin, hyperforin, and hypericin. The highest RSD value was observed for protopseudohypericin (compound 13) and protohypericin (compound 15), with values of 37.29% and 45.01%, respectively, followed by I3 II8 biapigenin (compound 12) and rutin (compound 7), with RSD values of 27.52% and 15.33%. Table 4 also shows the data for the percentage based on the combined peak areas of protopseudohypericin and pseudohypericin (compounds 13+14) as well as protohypericin and hypericin (compounds 15+18), which results in a significant reduction of the observed variation for these compounds based on the calculated RSD values.

4. Discussion

The flowers and flower buds of H. perforatum contain the highest concentrations of hypericin and hyperforin [21,62,63,64,65], making them the preferred targets for metabolite analysis in comparisons between individual plants. The abundance of various floral phenolics fluctuates with the stage of flower development [16]. Therefore, a reliable procedure for comparative metabolite analysis in individual plants requires the collection of flowers at the same developmental stage.
In this study, two sampling and processing approaches (Supplementary Figure S1) were evaluated for comparative flower metabolite analysis in individual plants. The “single-flower” procedure involved the collection and direct processing of a single flower sample without prior weighing. The second approach, referred to as the “bulk-flower” method, entailed harvesting multiple flowers at the same developmental stage from a given plant, grinding them, and processing a fixed, pre-weighed amount of the resulting bulk sample. The ideal developmental stage for sampling should (i) be associated with elevated levels of target metabolites, (ii) be easily identifiable by morphological traits, and (iii) exhibit minimal variation in individual flower weight, thereby reducing variability in the “single-flower” approach due to differences in sample mass.
Although the “bulk-flower” extraction method yielded highly reproducible results for analyzing the accumulation of target phenolics in H. perforatum flowers, its practical application in large-scale comparative analyses is limited. The process is time consuming, requiring milling and weighing of bulk flower samples, and demands a sufficient number of flowers at a specific developmental stage from each plant, a particularly challenging task when dealing with large populations. Conversely, this extraction method tolerates variations in plant material-to-solvent ratios. Combined with the observed relatively low variation in the weight of stage 4 flowers collected from either the same plant or different genotypes, this presents an opportunity for high-throughput extraction. This streamlined “single-flower” procedure involves collecting and freezing a single flower in a plastic tube, followed by ball milling in the same tube and direct extraction using a fixed volume of solvent, eliminating the need for weighing.
The composition and accumulation of metabolites in H. perforatum flowers and other organs have been extensively studied [22,66]. With few exceptions [67], most analyses use dried plant material, which facilitates measurements on a “per dry weight” basis and supports herb quality evaluation. However, this approach is less suitable for precise comparative analysis across a large number of individual plants, where precision is critical for population characterization, genetic resource assessment, and breeding programs. Drying introduces variability due to the photo- and thermo-sensitivity of several metabolites [68] and complicates the timely collection of samples to minimize diurnal variation. It also hinders the efficient processing of large sample batches. Furthermore, bulk samples typically contain flowers and other organs at various developmental stages, limiting reproducibility due to organ- and stage-specific metabolite profiles.
To address these limitations, we tested two extraction procedures that share a common workflow: collecting flowers at the same developmental stage, rapid freezing in liquid nitrogen, cryogenic ball milling at low temperature, and allowing for long-term storage before processing. The two differ in sampling strategy and offer complementary advantages. The “bulk-flower” method involves collecting 50–60 stage 4 flowers per plant, immediately freezing them, milling them to a fine powder, and extracting metabolites using the developed protocol. In contrast, the “single-flower” method entails collecting individual stage 4 flowers (in several replicates) per plant, placing each in an Eppendorf tube, and following the same freezing, milling, and extraction steps.
Our findings showed that while the “single-flower” method (Table 3) had slightly but significantly lower reproducibility (p < 0.001) compared to the “bulk-flower” approach (Tables S1 and S2), it still exhibited low intra-plant variability. The relative standard deviation (RSD) for 12 out of 16 identified compounds was below 15%, indicating limited variation among single flowers from the same genotype. However, elevated RSD values were observed for protopseudohypericin and protohypericin (compounds 13 and 15), exceeding 20% on average and reaching 34.92% and 36.51%, respectively, in genotype 139_28. Table 3 also presents combined data for the protoforms and their stable counterparts, pseudohypericin and hypericin (compounds 13+14 and 15+18). When protoform peak areas were summed with their corresponding stable forms, the RSD values decreased significantly and fell below 15% (Table 3).
The protoforms protopseudohypericin and protohypericin are known to be highly sensitive to light, rapidly converting to pseudohypericin and hypericin upon sunlight exposure [69]. The increased variation observed for these compounds may be attributed to differential light exposure among individual flowers in the field. Similar variability in the levels of protohypericins was previously reported in fresh buds, flowers, and leaves exposed to sunlight [69]. A common practice in H. perforatum extract analysis involves light exposure of extracts to promote the conversion of protoforms to stable forms, thereby improving consistency in naphthodianthrone quantification [70]. However, this also induces compositional changes, including hyperforin degradation, which necessitates the analysis of both light-exposed and unexposed samples for accurate profiling [68]. Alternatively, Baugh et al. proposed a single assay based on mathematical models that estimates hypericin composition from protoform levels, avoiding light exposure and preserving hyperforin from oxidative degradation [68].
Our study demonstrated that combining the peak areas of protoforms with their stable counterparts significantly reduces variability, and we recommend this approach, particularly when using the “single-flower” method in comparative metabolomic analyses. While the “bulk-flower” method offers lower variability, it also requires larger flower quantities and slower sample processing. The choice between methods should depend on the specific research objectives. Both approaches are suitable for comparative analysis of metabolite composition in individual plants.
Given that secondary metabolite accumulation reflects the plant’s biosynthetic network activity, microscale extraction and comparative analysis of relative compound levels can be valuable for various research applications, including biodiversity assessment [30], QTL mapping, and the identification of loci linked to specific compound accumulation [71,72]. However, the variability introduced by sample weighing or direct extraction from individual flowers limits the use of these methods for precise quantification of compound abundance based solely on peak area measurements. This represents the primary limitation of the proposed methods for accurate quantification.
Using the “single-flower” approach, we also compared metabolite variation among plants derived via apomixis and observed significantly lower variation compared to a group comprising three different genotypes (Table 4). This finding underscores the benefit of working with genetically identical material, such as that obtained via apomixis, which yields more homogeneous compound profiles compared to genetically diverse plants.

5. Conclusions

This study presents two ultrasound-assisted microscale extraction procedures for isolating bioactive compounds from fresh H. perforatum flowers, both of which are suitable for comparative metabolomics in population studies of this species. The “bulk-flower” procedure offers slightly higher reproducibility but is less practical for large-scale sampling due to the substantial quantity of floral material required from each plant. In contrast, the “single-flower” procedure enables high-throughput processing while preserving a high degree of reproducibility. It requires only a few flowers at the target developmental stage to be collected from each plant, making it well suited for the comparative analysis of large plant sets.
Combining the peak areas of proto- and stable forms of pseudohypericin and hypericin further enhances the reproducibility of these compounds’ quantification. Application of the “single-flower” procedure to flower extracts from individual apomictic plants resulted in significantly lower variability compared to a small group of plants representing distinct genotypes. This finding underscores the benefit of cultivating genetically identical plants produced through apomixis for generating metabolically uniform material.

Supplementary Materials

The following supporting information can be downloaded at: https://www.mdpi.com/article/10.3390/app15137334/s1, Table S1: Mean value in percent (±SD) and RSD values (%), reflecting the variation between 5 different w/v ratios used for the extraction of a bulk sample of flowers at stage 4 from line 205; Table S2: Mean value (±SD) in % and RSD values (%), reflecting the variation between 6 different durations used for the extraction of a bulk sample of flowers at stage 4 and w/v ratio of 1/15 from a single plant of line 205; Figure S1: Flow diagram of “bulk-flower” and “single-flower” procedures.

Author Contributions

Conceptualization, I.A.; methodology, I.A., K.R., M.R. and L.G.; software, K.R.; formal analysis, M.R., M.A., P.G. and T.Z.; resources, M.R. and I.A.; data curation, K.R.; writing—original draft preparation, M.R.; writing—review and editing, K.R. and I.A.; visualization, K.R.; project administration, M.R.; funding acquisition, M.R. and I.A. All authors have read and agreed to the published version of the manuscript.

Funding

This research was funded by the Bulgarian National Science Fund, grant KP-06-M66/2, as well as by the Centre of Competence “Sustainable Utilization of Bio-resources and Waste of Medicinal and Aromatic Plants for Innovative Bioactive Products” (BIORESOURCES BG) project BG16RFPR002-1.014-0001, funded by the Program “Research, Innovation and Digitization for Smart Transformation” 2021–2027, co-funded by the EU.

Institutional Review Board Statement

Not applicable.

Informed Consent Statement

Not applicable.

Data Availability Statement

The original contributions presented in this study are included within the article and the Supplementary Materials.

Acknowledgments

The authors would like to thank Rumyana Velcheva and Sonya Ivanova (AgroBioInstitute, Sofia, Bulgaria) for the excellent technical assistance.

Conflicts of Interest

The authors declare no conflicts of interest. The funders had no role in the design of the study; in the collection, analyses, or interpretation of data; in the writing of the manuscript; or in the decision to publish the results.

Abbreviations

The following abbreviations are used in this manuscript:
SSRSimple sequence repeat
LC-MSLiquid chromatography–mass spectrometry
DADDiode array detector
QTOFQuadrupole time of flight
ESIElectrospray ionization
TICTotal ion current
RSDRelative standard deviation
UV-VisUltraviolet–visible

References

  1. Hunt, E.J.; Lester, C.E.; Lester, E.A.; Tackett, R.L. Effect of St. John’s wort on free radical production. Life Sci. 2001, 69, 181–190. [Google Scholar] [CrossRef] [PubMed]
  2. Franchi, G.G.; Nencini, C.; Collavoli, E.; Massarelli, P. Composition and antioxidant activity in vitro of different St. John’s Wort (Hypericum perforatum L.) extracts. J. Med. Plants Res. 2011, 5, 4349–4353. [Google Scholar]
  3. Muzykiewicz, A.; Florkowska, K.; Nowak, A.; Zielonka-Brzezicka, J.; Klimowicz, A. Antioxidant activity of St. John’s Wort extracts obtained with ultrasound-assisted extraction. Pomeranian J. Life Sci. 2019, 65, 89–93. [Google Scholar] [CrossRef]
  4. Avato, P.; Raffo, F.; Guglielmi, G.; Vitali, C.; Rosato, A. Extracts from St John’s wort and their antimicrobial activity. Phytother. Res. Int. J. Devoted Pharmacol. Toxicol. Eval. Nat. Prod. Deriv. 2004, 18, 230–232. [Google Scholar] [CrossRef]
  5. Schempp, C.M.; Pelz, K.; Wittmer, A.; Schöpf, E.; Simon, J.C. Antibacterial activity of hyperforin from St John’s wort, against multiresistant Staphylococcus aureus and gram-positive bacteria. Lancet 1999, 353, 2129. [Google Scholar] [CrossRef]
  6. Barnes, J.; Anderson, L.A.; Phillipson, J.D. St John’s wort (Hypericum perforatum L.): A review of its chemistry, pharmacology and clinical properties. J. Pharm. Pharmacol. 2001, 53, 583–600. [Google Scholar] [CrossRef] [PubMed]
  7. Jacobson, J.M.; Feinman, L.; Liebes, L.; Ostrow, N.; Koslowski, V.; Tobia, A.; Cabana, B.E.; Lee, D.-H.; Spritzler, J.; Prince, A.M. Pharmacokinetics, safety, and antiviral effects of hypericin, a derivative of St. John’s wort plant, in patients with chronic hepatitis C virus infection. Antimicrob. Agents Chemother. 2001, 45, 517–524. [Google Scholar] [CrossRef]
  8. Gulick, R.M.; McAuliffe, V.; Holden-Wiltse, J.; Crumpacker, C.; Liebes, L.; Stein, D.S.; Meehan, P.; Hussey, S.; Forcht, J.; Valentine, F.T. Phase I studies of hypericin, the active compound in St. John’s wort, as an antiretroviral agent in HIV-infected adults: AIDS clinical trials group protocols 150 and 258. Ann. Intern. Med. 1999, 130, 510–514. [Google Scholar] [CrossRef]
  9. Linde, K.; Ramirez, G.; Mulrow, C.D.; Pauls, A.; Weidenhammer, W.; Melchart, D. St John’s wort for depression—An overview and meta-analysis of randomised clinical trials. BMJ 1996, 313, 253–258. [Google Scholar] [CrossRef]
  10. Bilia, A.R.; Gallori, S.; Vincieri, F.F. St. John’s wort and depression: Efficacy, safety and tolerability-an update. Life Sci. 2002, 70, 3077–3096. [Google Scholar] [CrossRef]
  11. Gaster, B.; Holroyd, J. St John’s wort for depression: A systematic review. Arch. Intern. Med. 2000, 160, 152–156. [Google Scholar] [CrossRef]
  12. Tedeschi, E.; Menegazzi, M.; Margotto, D.; Suzuki, H.; Förstermann, U.; Kleinert, H. Anti-inflammatory actions of St. John’s wort: Inhibition of human inducible nitric-oxide synthase expression by down-regulating signal transducer and activator of transcription-1α (STAT-1α) activation. J. Pharmacol. Exp. Ther. 2003, 307, 254–261. [Google Scholar] [CrossRef]
  13. Novelli, M.; Masiello, P.; Beffy, P.; Menegazzi, M. Protective role of St. John’s wort and its components hyperforin and hypericin against diabetes through inhibition of inflammatory signaling: Evidence from in vitro and in vivo studies. Int. J. Mol. Sci. 2020, 21, 8108. [Google Scholar] [CrossRef] [PubMed]
  14. Schempp, C.M.; Kirkin, V.; Simon-Haarhaus, B.; Kersten, A.; Kiss, J.; Termeer, C.C.; Gilb, B.; Kaufmann, T.; Borner, C.; Sleeman, J.P. Inhibition of tumour cell growth by hyperforin, a novel anticancer drug from St. John’s wort that acts by induction of apoptosis. Oncogene 2002, 21, 1242–1250. [Google Scholar] [CrossRef] [PubMed]
  15. Garg, A.D.; Krysko, D.V.; Vandenabeele, P.; Agostinis, P. Hypericin-based photodynamic therapy induces surface exposure of damage-associated molecular patterns like HSP70 and calreticulin. Cancer Immunol. Immunother. 2012, 61, 215–221. [Google Scholar] [CrossRef]
  16. Tekel’ová, D.; Repák, M.; Zemková, E.; Tóth, J. Quantitative Changes of Dianthrones, Hyperforin and Flavonoids Content in the Flower Ontogenesis of Hypericum perforatum. Planta Medica 2000, 66, 778–780. [Google Scholar] [CrossRef]
  17. Galeotti, N. Hypericum perforatum (St John’s wort) beyond depression: A therapeutic perspective for pain conditions. J. Ethnopharmacol. 2017, 200, 136–146. [Google Scholar] [CrossRef] [PubMed]
  18. Koeberle, A.; Rossi, A.; Bauer, J.; Dehm, F.; Verotta, L.; Northoff, H.; Sautebin, L.; Werz, O. Hyperforin, an anti-inflammatory constituent from St. John’s wort, inhibits microsomal prostaglandin E2 synthase-1 and suppresses prostaglandin E2 formation in vivo. Front. Pharmacol. 2011, 2, 7. [Google Scholar] [CrossRef]
  19. Hofrichter, J.; Krohn, M.; Schumacher, T.; Lange, C.; Feistel, B.; Walbroel, B.; Heinze, H.-J.; Crockett, S.; Sharbel, T.F.; Pahnke, J. Reduced Alzheimer’s disease pathology by St. John’s Wort treatment is independent of hyperforin and facilitated by ABCC1 and microglia activation in mice. Curr. Alzheimer Res. 2013, 10, 1057–1069. [Google Scholar] [CrossRef]
  20. Shabani, A.; Karapandzova, M.; Karanfilova, I.C.; Stefkov, G.; Crcarevska, M.S.; Kulevanova, S. Distribution of total phenols, flavonoids and hypericin in different plant organs of wild-growing St. John’s-wort (Hypericum perforatum L., Hypericaceae) from North Macedonia. Maced. Pharm. Bull. 2019, 65, 39–47. [Google Scholar] [CrossRef]
  21. Umek, A.; Kreft, S.; Kartnig, T.; Heydel, B. Quantitative phytochemical analyses of six Hypericum species growing in Slovenia. Planta Medica 1999, 65, 388–390. [Google Scholar] [CrossRef]
  22. Çirak, C.; Radusiene, J.; Janulis, V.; Ivanauskas, L. Pseudohypericin and hyperforin in Hypericum perforatum from Northern Turkey: Variation among populations, plant parts and phenological stages. J. Integr. Plant Biol. 2008, 50, 575–580. [Google Scholar] [CrossRef]
  23. Cirak, C.; Radusiěnë, J.; Karabük, B.; Janulis, V.; Ivanauskas, L. Variation of bioactive compounds in Hypericum perforatum growing in Turkey during its phenological cycle. J. Integr. Plant Biol. 2007, 49, 615–620. [Google Scholar] [CrossRef]
  24. Çirak, C.; Radušienė, J.; Karabük, B.S.; Janulis, V. Variation of bioactive substances and morphological traits in Hypericum perforatum populations from Northern Turkey. Biochem. Syst. Ecol. 2007, 35, 403–409. [Google Scholar] [CrossRef]
  25. Klemow, K.M.; Bilbow, E.; Grasso, D.; Jones, K.; McDermott, J.; Pape, E. Medical attributes of St. John’s wort (Hypericum perforatum). Oxidative Stress Dis. 2004, 14, 757–780. [Google Scholar]
  26. Zagorcheva, T.; Rusanov, K.; Rusanova, M.; Aneva, I.; Stancheva, I.; Atanassov, I. Genetic and flower volatile diversity in two natural populations of Hyssopus officinalis L. in Bulgaria. Biotechnol. Biotechnol. Equip. 2020, 34, 1265–1272. [Google Scholar] [CrossRef]
  27. Rusanov, K.E.; Kovacheva, N.M.; Atanassov, I.I. Comparative GC/MS analysis of rose flower and distilled oil volatiles of the oil-bearing rose Rosa damascena. Biotechnol. Biotechnol. Equip. 2011, 25, 2210–2216. [Google Scholar] [CrossRef]
  28. Zagorcheva, T.; Stanev, S.; Rusanov, K.; Atanassov, I. Comparative GC/MS analysis of lavender (Lavandula angustifolia Mill.) inflorescence and essential oil volatiles. Agric. Sci. Technol. 2013, 5, 459–462. [Google Scholar]
  29. Zagorcheva, T.; Rusanov, K.; Stanev, S.; Atanassov, I. A simple procedure for comparative GC-MS analysis of lavender (Lavandula angustifolia Mill.) flower volatile composition. IOSR J. Pharm. Biol. Sci. 2016, 11, 9–14. [Google Scholar] [CrossRef]
  30. Alekseeva, M.; Zagorcheva, T.; Rusanova, M.; Rusanov, K.; Atanassov, I. Genetic and flower volatile diversity in natural populations of Origanum vulgare subsp. hirtum (Link) Ietsw. in Bulgaria: Toward the development of a core collection. Front. Plant Sci. 2021, 12, 679063. [Google Scholar] [CrossRef]
  31. Bagdonaitė, E.; Mártonfi, P.; Repčák, M.; Labokas, J. Variation in concentrations of major bioactive compounds in Hypericum perforatum L. from Lithuania. Ind. Crops Prod. 2012, 35, 302–308. [Google Scholar] [CrossRef]
  32. Koperdáková, J.; Košuth, J.; Čellárová, E. Variation in the content of hypericins in four generations of seed progeny of Hypericum perforatum somaclones. J. Plant Res. 2007, 120, 123–128. [Google Scholar] [CrossRef] [PubMed]
  33. Xenophontos, M.; Stavropoulos, E.; Avramakis, E.; Navakoudis, E.; Dörnemann, D.; Kotzabasis, K. Influence of the developmental stage on the (proto)-hypericin and (proto) pseudohypericin levels of Hypericum plants from Crete. Planta Medica 2007, 73, 1309–1315. [Google Scholar] [CrossRef] [PubMed]
  34. Verma, V.; Smelcerovic, A.; Zuehlke, S.; Hussain, M.A.; Ahmad, S.M.; Ziebach, T.; Qazi, G.N.; Spiteller, M. Phenolic constituents and genetic profile of Hypericum perforatum L. from India. Biochem. Syst. Ecol. 2008, 36, 201–206. [Google Scholar] [CrossRef]
  35. Kaplan, M.; Köprü, S.; Say, R.; Karaman, K.; Yılmaz, M.M. Characterization of in vitro bioactive performance of Hypericum perforatum using response surface methodology. Sigma J. Eng. Nat. Sci. 2021, 39, 392–403. [Google Scholar] [CrossRef]
  36. Frommenwiler, D.A.; Reich, E.; Sudberg, S.; Sharaf, M.H.; Bzhelyansky, A.; Lucas, B. St. John’s wort versus counterfeit St. John’s wort: An HPTLC study. J. AOAC Int. 2016, 99, 1204–1212. [Google Scholar] [CrossRef]
  37. Huck-Pezzei, V.; Bittner, L.; Pallua, J.; Sonderegger, H.; Abel, G.; Popp, M.; Bonn, G.; Huck, C. A chromatographic and spectroscopic analytical platform for the characterization of St John’s wort extract adulterations. Anal. Methods 2013, 5, 616–628. [Google Scholar] [CrossRef]
  38. Wuthold, K.; Roos, G.; Simmen, U.; Kovar, K.-A. Analytical study of extracts of St John’s wort (Hypericum perforatum), evaluation of HPTLC plates by multivariate data analysis. JPC-J. Planar Chromatogr.-Mod. TLC 2003, 16, 15–18. [Google Scholar] [CrossRef]
  39. Kitanov, G.M. Hypericin and pseudohypericin in some Hypericum species. Biochem. Syst. Ecol. 2001, 29, 171–178. [Google Scholar] [CrossRef]
  40. Maleš, Ž.; Plazibat, M.; Vundać, V.; Žuntar, I.; Pilepić, K. Thin-layer chromatographic analysis of flavonoids, phenolic acids, and amino acids in some Croatian Hypericum taxa. JPC-J. Planar Chromatogr.-Mod. TLC 2004, 17, 280–285. [Google Scholar] [CrossRef]
  41. Mulinacci, N.; Bardazzi, C.; Romani, A.; Pinelli, P.; Vincieri, F.F.; Costantini, A. HPLC-DAD and TLC-Densitometry for quantification of hypericin in Hypericum perforatum L. Extracts. Chromatographia 1999, 49, 197–201. [Google Scholar] [CrossRef]
  42. Tolonen, A.; Hohtola, A.; Jalonen, J. Fast high-performance liquid chromatographic analysis of naphthodianthrones and phloroglucinols from Hypericum perforatum extracts. Phytochem. Anal. 2003, 14, 306–309. [Google Scholar] [CrossRef] [PubMed]
  43. Ang, C.Y.; Cui, Y.; Chang, H.C.; Luo, W.; Heinze, T.M.; Lin, L.J.; Mattia, A. Determination of St. John’s wort components in dietary supplements and functional foods by liquid chromatography. J. AOAC Int. 2002, 85, 1360–1369. [Google Scholar] [CrossRef] [PubMed]
  44. Agapouda, A.; Booker, A.; Kiss, T.; Hohmann, J.; Heinrich, M.; Csupor, D. Quality control of Hypericum perforatum L. analytical challenges and recent progress. J. Pharm. Pharmacol. 2019, 71, 15–37. [Google Scholar] [CrossRef]
  45. Brolis, M.; Gabetta, B.; Fuzzati, N.; Pace, R.; Panzeri, F.; Peterlongo, F. Identification by high-performance liquid chromatography–diode array detection–mass spectrometry and quantification by high-performance liquid chromatography–UV absorbance detection of active constituents of Hypericum perforatum. J. Chromatogr. A 1998, 825, 9–16. [Google Scholar] [CrossRef]
  46. Mauri, P.; Pietta, P. High performance liquid chromatography/electrospray mass spectrometry of Hypericum perforatum extracts. Rapid Commun. Mass. Spectrom. 2000, 14, 95–99. [Google Scholar] [CrossRef]
  47. Chandrasekera, D.H.; Welham, K.J.; Ashton, D.; Middleton, R.; Heinrich, M. Quantitative analysis of the major constituents of St John’s wort with HPLC-ESI-MS. J. Pharm. Pharmacol. 2005, 57, 1645–1652. [Google Scholar] [CrossRef]
  48. Keller, J.H.; Karas, M.; Müller, W.E.; Volmer, D.A.; Eckert, G.P.; Tawab, M.A.; Blume, H.H.; Dingermann, T.; Schubert-Zsilavecz, M. Determination of hyperforin in mouse brain by high-performance liquid chromatography/tandem mass spectrometry. Anal. Chem. 2003, 75, 6084–6088. [Google Scholar] [CrossRef]
  49. Matzk, F.; Meister, A.; Brutovská, R.; Schubert, I. Reconstruction of reproductive diversity in Hypericum perforatum L. opens novel strategies to manage apomixis. Plant J. 2001, 26, 275–282. [Google Scholar] [CrossRef]
  50. Velkoska-Markovska, L.; Jankulovska, M.S.; Petanovska-Ilievska, B.; Hristovski, K. Development and validation of RRLC–UV method for determination of chlorogenic acid in green coffee. Acta Chromatogr. 2020, 32, 34–38. [Google Scholar] [CrossRef]
  51. Sun, L.; Wei, H.; Zhang, F.; Gao, S.; Zeng, Q.; Lu, W.; Chen, W.; Chai, Y. Qualitative analysis and quality control of Traditional Chinese Medicine preparation Tanreqing injection by LC-TOF/MS and HPLC-DAD-ELSD. Anal. Methods 2013, 5, 6431–6440. [Google Scholar] [CrossRef]
  52. Wang, L.; Yamashita, Y.; Saito, A.; Ashida, H. An analysis method for flavan-3-ols using high performance liquid chromatography coupled with a fluorescence detector. J. Food Drug Anal. 2017, 25, 478–487. [Google Scholar] [CrossRef] [PubMed]
  53. Farag, M.A.; Wessjohann, L.A. Metabolome classification of commercial Hypericum perforatum (St. John’s Wort) preparations via UPLC-qTOF-MS and chemometrics. Planta Medica 2012, 78, 488–496. [Google Scholar] [CrossRef]
  54. Smith, C.A.; O’Maille, G.; Want, E.J.; Qin, C.; Trauger, S.A.; Brandon, T.R.; Custodio, D.E.; Abagyan, R.; Siuzdak, G. METLIN: A metabolite mass spectral database. Ther. Drug Monit. 2005, 27, 747–751. [Google Scholar] [CrossRef]
  55. Wishart, D.S.; Guo, A.; Oler, E.; Wang, F.; Anjum, A.; Peters, H.; Dizon, R.; Sayeeda, Z.; Tian, S.; Lee, B.L. HMDB 5.0: The human metabolome database for 2022. Nucleic Acids Res. 2022, 50, D622–D631. [Google Scholar] [CrossRef]
  56. Cioffi, E.; Comune, L.; Piccolella, S.; Buono, M.; Pacifico, S. Quercetin 3-O-glucuronide from Aglianico vine leaves: A selective sustainable recovery and accumulation monitoring. Foods 2023, 12, 2646. [Google Scholar] [CrossRef] [PubMed]
  57. Kim, S.; Chen, J.; Cheng, T.; Gindulyte, A.; He, J.; He, S.; Li, Q.; Shoemaker, B.A.; Thiessen, P.A.; Yu, B.; et al. PubChem 2025 update. Nucleic Acids Res. 2024, 53, D1516–D1525. [Google Scholar] [CrossRef] [PubMed]
  58. Horai, H.; Arita, M.; Kanaya, S.; Nihei, Y.; Ikeda, T.; Suwa, K.; Ojima, Y.; Tanaka, K.; Tanaka, S.; Aoshima, K. MassBank: A public repository for sharing mass spectral data for life sciences. J. Mass Spectrom. 2010, 45, 703–714. [Google Scholar] [CrossRef]
  59. Tusevski, O.; Krstikj, M.; Petreska Stanoeva, J.; Stefova, M.; Gadzovska Simic, S. Phenolic compounds composition of Hypericum perforatum L. wild-growing plants from the Republic of Macedonia. Agric. Conspec. Sci. 2019, 84, 67–75. [Google Scholar]
  60. Heinrich, M.; Daniels, R.; Stintzing, F.; Kammerer, D. Comprehensive phytochemical characterization of St. John’s wort (Hypericum perforatum L.) oil macerates obtained by different extraction protocols via analytical tools applicable in routine control. Die Pharm.-Int. J. Pharm. Sci. 2017, 72, 131–138. [Google Scholar] [CrossRef]
  61. Lyles, J.T.; Kim, A.; Nelson, K.; Bullard-Roberts, A.L.; Hajdari, A.; Mustafa, B.; Quave, C.L. The chemical and antibacterial evaluation of St. John’s Wort oil macerates used in Kosovar traditional medicine. Front. Microbiol. 2017, 8, 1639. [Google Scholar] [CrossRef] [PubMed]
  62. Bruni, R.; Sacchetti, G. Factors affecting polyphenol biosynthesis in wild and field grown St. John’s Wort (Hypericum perforatum L. Hypericaceae/Guttiferae). Molecules 2009, 14, 682–725. [Google Scholar] [CrossRef] [PubMed]
  63. Rizzo, P.; Altschmied, L.; Ravindran, B.M.; Rutten, T.; D’Auria, J.C. The biochemical and genetic basis for the biosynthesis of bioactive compounds in Hypericum perforatum L., one of the largest medicinal crops in Europe. Genes 2020, 11, 1210. [Google Scholar] [CrossRef]
  64. Filippini, R.; Piovan, A.; Borsarini, A.; Caniato, R. Study of dynamic accumulation of secondary metabolites in three subspecies of Hypericum perforatum. Fitoterapia 2010, 81, 115–119. [Google Scholar] [CrossRef]
  65. Kladar, N.; Mrđanović, J.; Anačkov, G.; Šolajić, S.; Gavarić, N.; Srđenović, B.; Božin, B. Hypericum perforatum: Synthesis of active principles during flowering and fruitification—Novel aspects of biological potential. Evid.-Based Complement. Altern. Med. 2017, 2017, 2865610. [Google Scholar] [CrossRef]
  66. Ayan, A.K.; Çirak, C. Hypericin and Pseudohypericin contents in some Hypericum. species growing in Turkey. Pharm. Biol. 2008, 46, 288–291. [Google Scholar] [CrossRef]
  67. Couceiro, M.; Afreen, F.; Zobayed, S.; Kozai, T. Variation in concentrations of major bioactive compounds of St. John’s wort: Effects of harvesting time, temperature and germplasm. Plant Sci. 2006, 170, 128–134. [Google Scholar] [CrossRef]
  68. Baugh, S.F. Simultaneous Determination of Protopseudohypericin, Pseudohypericin, Protohypericin, and Hypericin Without Light Exposure. J. AOAC Int. 2005, 88, 1607–1612. [Google Scholar] [CrossRef] [PubMed]
  69. Poutaraud, A.; Di Gregorio, F.; Tin, V.C.; Girardin, P. Effect of light on hypericins contents in fresh flowering top parts and in an extract of St. John’s Wort (Hypericum perforatum). Planta Medica 2001, 67, 254–259. [Google Scholar] [CrossRef]
  70. Kopleman, S.H.; NguyenPho, A.; Zito, W.S.; Muller, F.X.; Augsburger, L.L. Selected physical and chemical properties of commercial Hypericum perforatum extracts relevant for formulated product quality and performance. AAPS PharmSci 2001, 3, 26. [Google Scholar] [CrossRef]
  71. Rusanov, K.; Vassileva, P.; Rusanova, M.; Atanassov, I. Identification of QTL controlling the ratio of linalool to linalyl acetate in the flowers of Lavandula angustifolia Mill var. Hemus. Biotechnol. Biotechnol. Equip. 2023, 37, 2288929. [Google Scholar] [CrossRef]
  72. Georgieva, P.; Rusanov, K.; Rusanova, M.; Kitanova, M.; Atanassov, I. Construction of Simple Sequence Repeat-Based Genetic Linkage Map and Identification of QTLs for Accumulation of Floral Volatiles in Lavender (Lavandula angustifolia Mill.). Int. J. Mol. Sci. 2025, 26, 3705. [Google Scholar] [CrossRef] [PubMed]
Figure 1. Stages of H. perforatum flower development used in the experiments.
Applsci 15 07334 g001
Figure 2. LC/DAD/QTOF chromatogram of an extract from stage 4 flowers. (a) ESI-TIC in negative mode, (b) UV/Vis trace at 270 nm, and (c) UV/Vis trace at 590 nm. Compound numbering corresponds to Table 2.
Applsci 15 07334 g002
Table 1. Mean fresh weight (FW, mg) and relative standard deviation (RSD, %) of single flowers at 5 stages of flower development based on data from 3 plants representing different genotypes. Means that share a letter do not differ significantly at p < 0.05.
Flower StagePlant 3_29Plant 90_44Plant 139_28Across Genotypes
Mean FW RSD Mean FW RSD Mean FW RSD Mean FW RSD
1st15.144.8323.2412.0519.043.8619.14 ± 4.05 a21.16
2nd21.794.6641.9214.5834.167.9332.62 ± 10.15 a31.13
3rd47.362.3653.631.2452.586.0251.19 ± 3.36 b6.57
4th62.275.9666.9113.9065.234.3064.80 ± 2.35 b3.63
5th43.484.3248.922.4360.084.3150.83 ± 8.46 b16.65
Table 2. Compounds identified in the methanol extract of Hypericum perforatum after LC-DAD-QTOF analysis.
CompoundtR
min
IdentityTrivial NameUV λ Max
nm
[M−H]
m/z
ΔppmMS2 FragmentsReference
1 *5.1caffeoylquinic acidchlorogenic acid218, 300, 325353.08851.96191.06, 179.03, 135.05[50,51]
27.3procyanidin B1-279577.135831.17425.09, 407.08, 289.07, 125.02[52,53]
3 *8.8catechin-278289.07211.16245.08, 205.05, 125.02[54]
4 *10.2procyanidin B2-280577.13570.94425.09, 407.08, 289.07, 125.02[52,53]
5 *11.2epicatechin-279289.07200.82245.08, 205.05, 125.02[54]
6 *11.9procyanidin C1-280865.19870.19695.14, 577.13, 407.08, 287.06, 125.02[55]
7 *14.8quercetin-3-O-rutinosiderutin257, 358609.14721.79300.03, 271.02, 255.03, 179.00, 151.00[54]
8 *15.2quercetin-3-O-galactosidehyperoside255, 355463.08922.15300.03, 271.02, 255.03, 179.00, 151.00[54]
9 **15.4quercetin-3-O-glucoronidequerciturone255, 355477.06831.75301.03, 179.00, 151.00[56]
10 **15.5quercetin-3-O-glucosideisoquercitrin255, 355463.08891.5300.03, 271.03, 255.03[57,58]
11 *16.9quercetin-3-O-rhamnosidequercitrin255, 345447.09411.81300.03, 271.02, 255.03, 179.00, 151.00[58]
12 *24.9I3, II8-biapigeninamentoflavone268, 330537.08341.26443.04, 385.07, 151.00[53]
13 *43.0protopseudohypericin--521.0875−0.59477.10, 423.09[59]
14 *47.1pseudohypericin-592519.07220.08487.05, 475.08, 503.04, 449.07, 421.07[59]
15 *52.1protohypericin--505.09391.99461.10, 407.09[60]
1654.0furohyperforin--551.3733−1.63411.25, 482.30, 329.18[61]
17 *54.7hyperforin-223, 272535.3789−0.72466.11, 398.24, 383.22, 315.16[61]
18 *55.54hypericin-592503.07730.12459.09, 487.04, 443.07, 405.08[61]
* Compounds detected applying UV/Vis detector. ** Compounds detected as a collective peak applying UV/Vis detector.
Table 3. Mean values ± standard deviations (SDs) as well as the relative standard deviation (RSD) for the abundance of the identified compounds presented as a percentage of the sum of peak areas of the same compounds among three different genotypes (3_29, 90_44, and 139_28). Mean RSD values for each compound were calculated across the three genotypes. The numbering of compounds corresponds to Table 2 and Figure 2. Means sharing a letter along each horizontal line do not vary significantly at p < 0.05.
3_2990_44139_28Mean RSD (%)
per Compound
CompoundMean (%)RSDMean (%)RSDMean (%)RSD
13.18 ± 0.40 b12.701.82 ± 0.2 a11.032.08 ± 0.08 a3.719.15 ± 4.78
34.15 ± 0.28 a6.831.45 ± 0.08 b5.532.81 ± 0.19 c6.866.41 ± 0.76
41.16 ± 0.0.14 a12.101.42 ± 0.04 b3.151.17 ± 0.06 a4.956.73 ± 4.73
53.88 ± 0.35 a3.095.34 ± 0.3 b5.694.51 ± 0.23 c5.014.60 ± 1.35
61.04 ± 0.03 a3.130.82 ± 0.01 b0.900.93 ± 0.05 c5.753.26 ± 2.43
713.37 ± 0.90 a6.730.08 ± 0.07 b7.834.78 ± 0.38 c7.997.52 ± 0.69
813.24 ± 0.75 a5.6721.14 ± 1.73 b8.2514.54 ± 0.85 a5.826.58 ± 1.45
9+108.26 ± 0.91 a11.0314.80 ± 0.68 b4.6210.52 ± 0.85 c8.057.90 ± 3.21
115.41 ± 0.58 a10.695.90 ± 0.44 a7.625.55 ± 0.65 a11.7210.01 ± 2.13
1211.26 ± 1.74 b15.457.78± 0.67 a8.629.68 ± 1.48 ab15.2713.11 ± 3.89
130.97 ± 0.10 a10.370.56 ± 0.13 a22.970.86 ± 0.3 a34.9222.75 ± 12.28
146.60 ± 0.71 a10.818.17 ± 0.89 a10.987.38 ± 0.66 a8.9410.24 ± 1.13
150.41 ± 0.05 ab11.340.55 ±0.15 b27.060.29 ± 0.1 a36.5124.97 ± 12.71
1723.38 ± 3.04 a12.9921.94 ± 2.94 a13.5330.93 ± 2.42 b7.8311.45 ± 3.15
183.68 ± 0.50 a13.658.21 ± 0.94 b11.533.98 ± 0.25 a6.1710.45 ± 3.86
Mean RSD per plant 9.77 ± 3.79 9.95 ± 7.01 11.30 ± 10.3310.34 ± 6.08
13+14 *7.58 ± 0.81 a10.748.74 ± 0.86 a9.807.38 ± 0.66 a8.949.66
15+18 *4.10 ± 0.55 a13.358.76 ± 0.92 b10.528.24 ± 0.53 b6.389.33
* Mean values ± SDs and RSDs for the collective detection of peaks corresponding to compounds 13 and 14 as well as 15 and 18.
Table 4. Summary of the compositions of single-flower extracts from 19 H. perforatum plants from the apomictic line Hp93 and 3 plants representing 3 different genotypes (3_29, 90_44, and 139_28). Mean values represent the mean for the percentage of the respective compound calculated as a percentage of the sum of peak areas of the 16 identified compounds. We present the minimum (MIN), maximum (MAX), and relative standard deviation (RSD), as well as percentage of the minimum and maximum from the mean.
Compound Apomictic Line Hp93Three Independent Genotypes
MEANRSDMINMAXMIN/MEANMAX/MEANMEANRSDMINMAXMIN/MEANMAX/MEAN
12.068.011.792.3486.67113.552.3630.491.823.1877.22134.64
31.388.081.191.6486.81119.042.8048.071.454.1551.77147.91
41.778.801.482.2083.71124.711.2511.771.161.4292.63113.57
55.009.134.556.1790.95123.494.5816.023.885.3484.83116.75
61.5311.831.271.9882.78129.550.9312.190.821.0487.82112.20
70.1215.330.090.1680.06136.356.08110.850.0813.371.33219.95
815.488.6013.8018.3389.15118.3916.3126.0013.2421.1481.18129.66
9+1016.047.8413.8917.9886.61112.1011.2029.678.2614.8073.82132.23
116.3412.635.348.2984.25130.715.624.515.415.9096.23105.00
1211.4027.526.5916.3257.82143.139.5718.197.7811.2681.29117.62
130.3837.290.210.6355.22165.870.8026.820.560.9770.10126.06
144.5410.723.765.9882.88131.547.3910.636.608.1789.40109.85
150.5045.010.260.8651.68172.700.4231.600.290.5568.59131.42
1727.397.6821.0429.7676.81108.6525.4218.9921.9430.9386.32121.68
186.1513.115.228.2284.82133.595.2947.943.688.2169.59155.60
13+14 *4.9211.744.086.5582.79133.098.197.097.588.7492.58106.71
15+18 *6.6514.115.498.9882.61135.135.7146.404.108.7671.78153.55
* Mean values ± SD and RSD for the collective detection of peaks corresponding to compounds 13 and 14 as well as 15 and 18.
Disclaimer/Publisher’s Note: The statements, opinions and data contained in all publications are solely those of the individual author(s) and contributor(s) and not of MDPI and/or the editor(s). MDPI and/or the editor(s) disclaim responsibility for any injury to people or property resulting from any ideas, methods, instructions or products referred to in the content.

