3.1. Initial Characterization of the Adsorbent
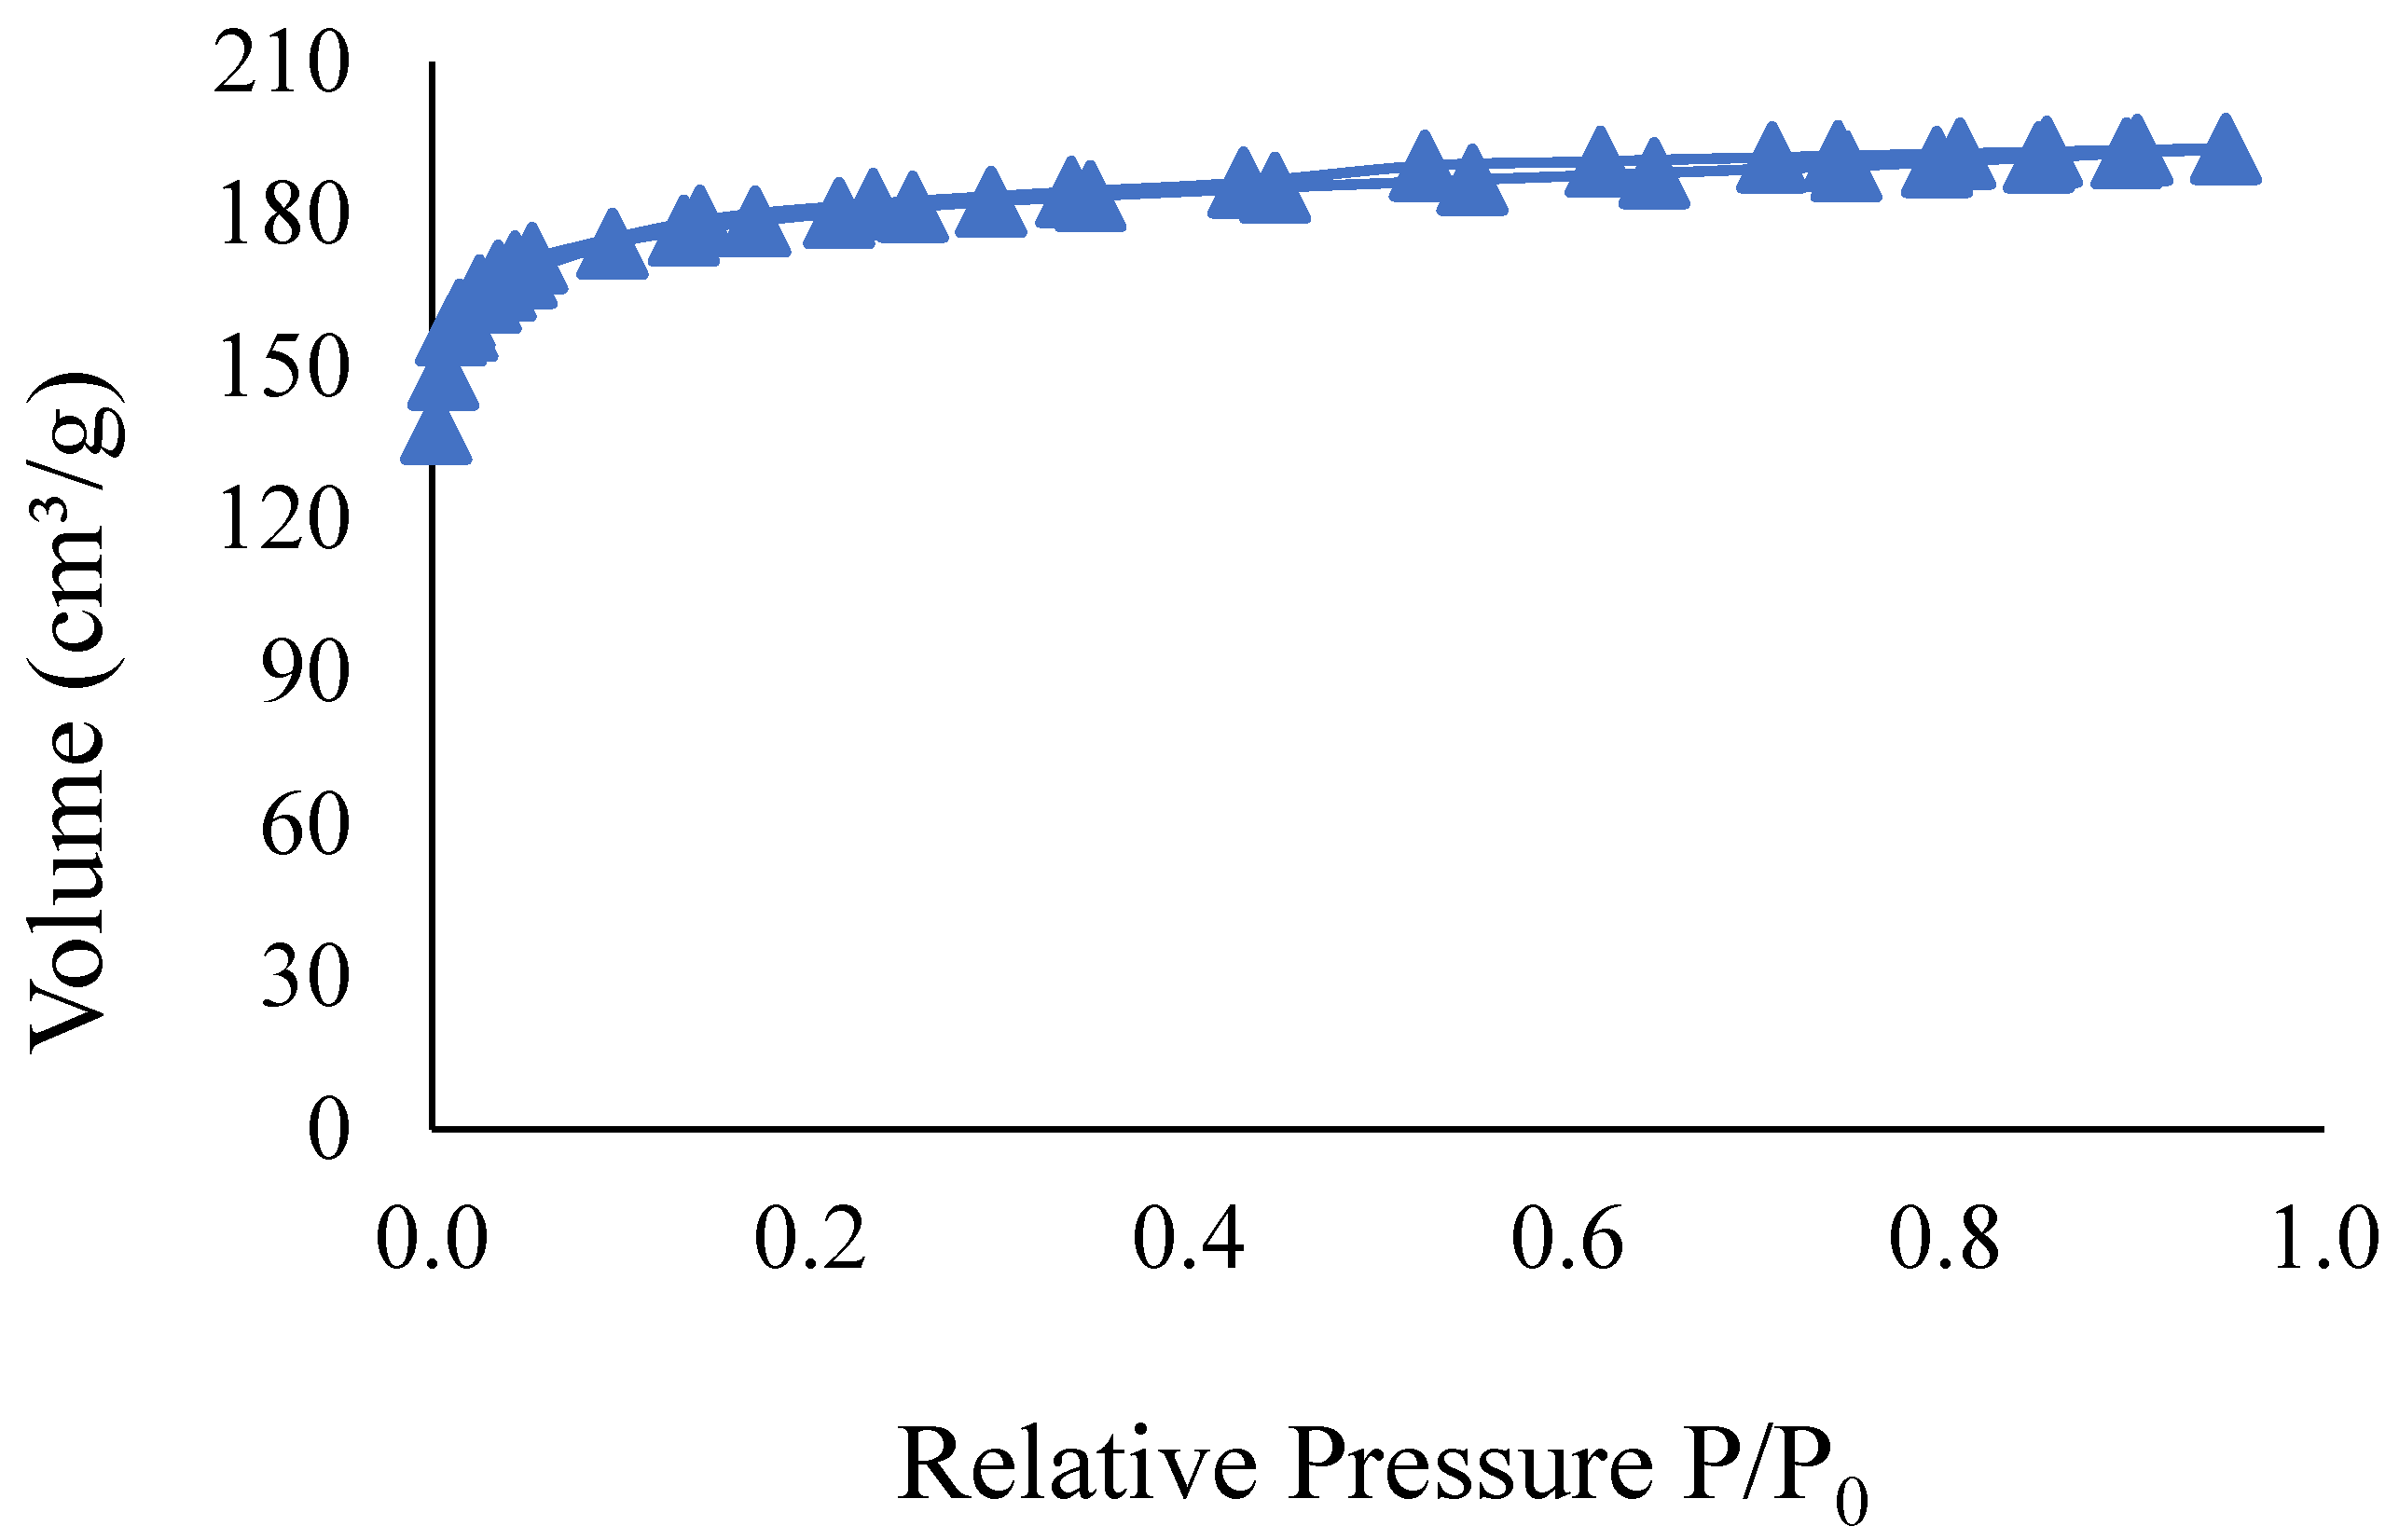
Figure 1 presents the textural characterization for the activated carbon used in the present study. The specific surface area and pore distribution of the materials were determined through N
2 adsorption/desorption. Subsequently, the specific values obtained from this characterization step are shown.
As shown in
Figure 1, the samples do not display a steep slope, indicating that adsorption does not significantly increase at high values of P/P
0. Additionally, there is a trend toward stabilization of adsorption at these values. All curves exhibited distinct paths for adsorption and desorption, which is characteristic of hysteresis [
48]. According to Costa and Féris [
49], the presence of hysteresis suggests a tendency toward mesopore formation.
The specific surface area of the granular activated carbon used in this study was estimated at 582.60 m
2/g, comparable to other commercial activated carbons reported in previous studies [
36,
37,
46]. In terms of surface area, volume, and mean pore diameter, the sample exhibited values of 348.67 m
2/g, 0.13 cm
3/g, and 4.83 Å, respectively, indicating that it is suitable for microporous materials [
48]. According to the classification by the International Union of Pure and Applied Chemistry (IUPAC), the isotherm curves displayed behavior characteristic of type I isotherms, which indicates micropore adsorption. Based on the empirical classification of hysteresis curves, the observed hysteresis can be classified as type H4, typical of materials with ordered and uniform pores, often found in complex materials that contain both micropores and mesopores.
The XRD profile of the adsorbent before the adsorption of pollutants is illustrated in
Figure 2. Two peaks of graphite carbon diffraction can be observed in the reflections at angles of 2θ near 25° and 45°, indicating that an amorphous phase is formed, and the activated carbons are ordered by the stacking of micrographs [
50].
Figure 3 shows the FTIR spectrum of the activated carbon before adsorption process, in terms of percentage of transmittance (%T) and wave number (cm
−1).
From
Figure 3 it is possible to observe peaks between the 2300 and 2000 cm
−1 bands and also small changes between the 1700 and 1500 cm
−1 lengths. The 2360 and 1645 cm
−1 peaks are indicative of carboxylic structures (C=O), while the 1629 cm-1 band is related to the presence of C=C in the aromatic rings, and 1558 cm
−1 corresponds to the elongation of the C=O bonds, present in the structure of the solid. The absence of significant peaks at 2800–3000 cm
−1 may indicate little presence of aliphatic residues or adsorbed organic compounds, which is expected before the adsorption process [
48].
3.2. Batch Adsorption Evaluation
Table 4 displays the experimental matrix along with the responses obtained for the simultaneous adsorption of pharmaceuticals in the batch process.
Figure 4 illustrates the response surface plots of the variable interactions derived from the applied experimental design.
The results indicate the impact of the independent variables on the effectiveness of the adsorption process. Overall, it appears that the pH effect does not lead to significant variations in the removal rates and adsorption capacity, suggesting an indirect relationship between the medium pH and the response variables (
Figure 4a–e). The mass of the adsorbent does not show a clear trend concerning the adsorption capacity results (Q
e;
Figure 4d–f), revealing a non-linear relationship between mass and adsorption efficiency. However, when assessing the removal of pharmaceuticals, it is observed that the interaction between solid mass and solution pH (
Figure 4a) results in the highest removal rates, with values approaching 98% as the amount of solid increases. A similar trend can be noted in the interaction between solid mass and process time (
Figure 4c).
Costa et al. [
39] investigated the adsorption of TC on commercial activated carbon similar to that used in this study. They found that the efficiency of TC removal increased gradually with the concentration of the adsorbent, reaching a maximum removal rate of 92.7% at a concentration of 3 g/L. Likewise, Jurado-Davila et al. [
51] reported that the percentage of pharmaceutical removal rose with an increase in GAC concentration, with pollutant removal gradually increasing until equilibrium was reached. These findings can be attributed to the adsorption behavior of porous materials with a high specific surface area.
Contact time consistently affects all experiments, with a general increase in removal efficiency and adsorption capacity as contact time lengthens (
Figure 5b,c,e,f). This behavior is expected and is characteristic of adsorption processes, where longer contact times facilitate more complete interactions between the adsorbent and adsorbate [
24,
52].
Jurado-Davila et al. [
50] found that during the evaluation of batch adsorption for the pharmaceuticals paracetamol and atenolol, both compounds exhibited rapid kinetics on activated carbon, reaching equilibrium at 60 min, with removal rates of 98% for PAR and 95% for ATL. The authors noted that prior to this time, the removal rates were approximately 50%, and after 60 min, the removal occurred at a much slower pace, with minimal changes in residual concentration over time. Similarly, de Oliveira et al. [
41] observed that an increase in contact time resulted in higher pollutant removal rates and adsorption capacities, ultimately reaching process equilibrium. They attributed these results to the characteristics of the batch process, where initially, all active sites on the carbon activated surface are available facilitating rapid mass transfer. Over time, as these sites become occupied, their availability diminishes, leading to equilibrium.
After evaluating the influence of various parameters on the adsorption process, the optimal conditions for simultaneous pharmaceutical degradation were established. Based on the proposed design, an ideal solution pH of 7, a solid mass of 2.0 g, and a contact time of 60 min were selected, resulting in a removal rate of over 98.1% and an adsorption capacity of 4.0 mg/g for the pharmaceuticals. These findings underscore the significance of careful planning and optimization of process variables to achieve high removal rates and adsorption capacities in water or effluent treatment applications.
The results of the ANOVA analysis for the statistical model can be found in the
Supplementary Material, specifically in
Table S1. Significant variables and interactions were identified by examining the
p-value at a 95% confidence level (
p < 0.05), and these are highlighted in red in the table. Additionally, the Pareto chart is presented in
Figure S1 (Supplementary Material).
The analysis indicates that the pH parameter (x
1) does not show significant evidence for pharmaceutical removal or batch adsorption capacity, regardless of the conditions applied, which aligns with the observations in
Figure 5. In contrast, solid mass (x
3) and contact time (x
2) demonstrate significant evidence for both response factors, particularly for Q
e. These findings are illustrated in the Pareto diagram, where the parameters that interfered with the system and exceeded the 95% confidence level were process time and solid mass (
Figure S1, Supplementary Material). Under these conditions, the model effectively captured the relationship between the variables and the responses. Additionally, the values of the coefficient of determination (R
2) and the adjusted coefficient of determination (R
2Adj) were R
2 = 0.9754; R
2Adj = 0.9569 for %R and R
2 = 0.8893; R
2Adj = 0.8063 for Q
e (mg/g), respectively, indicating strong agreement between actual and predicted values and further confirming the satisfactory relationship among the data.
To approximate the mathematical relationship of the experimental matrix, two second-order polynomial equations were derived: the first relates to removal efficiency (R%; Equation (12)), and the second pertains to adsorption capacity (Q
e; Equation (13)). These equations are applicable solely under the conditions employed in this study and take into account only the significant factors involved in their formulation.
where R% and Q
e (mg/g) are, respectively, the removal and adsorption capacity, x
2 is time (min), and x
3 is solid mass (g).
The experimental results obtained were R% = 98.1, while the model predictions indicated R% = 167.93 and Qe = 2.406mg/g. Although the determination coefficients (R2) for both equations show that the model performs well overall, the comparison between the experimental and predicted values suggests that the model does not adequately capture all the variables and interactions of the process. The overestimation of R% and the underestimation of Qe indicate that there are experimental factors or interactions between the variables that are not properly represented by the model.
The significant difference between the experimental and predicted values for R% may be attributed to a limitation of the model in relation to the actual experimental conditions, such as nonlinear interactions or effects of unconsidered variables. For Qe, the underestimation may reflect the complexity of the adsorption process, which is not fully addressed by the second-order polynomial model. Therefore, a revision of the model, including the consideration of additional variables or more complex interactions, is necessary to improve its accuracy. Furthermore, adjustments to the experimental design may be important to explore a wider range of factors that influence removal efficiency and adsorption capacity.
However, in addition to the statistical aspects, it is also essential to consider all the experimental factors that may influence the results. The experimental data obtained were as expected, showing the desired behavior and aligning with the theoretical foundations of adsorption. The removal efficiency and adsorption capacity observed confirm that, despite the model’s limitations, the underlying processes of adsorption occur as predicted, validating the experimental approach adopted. The integration of experimental and theoretical aspects is crucial for the development of more accurate models and for the optimization of adsorption processes.
Based on the results presented, it was possible to conclude that the adsorption of paracetamol (PAR) on the GAC column is predominantly governed by specific interaction mechanisms, including electrostatic forces, hydrophobic interactions, hydrogen bonding (dipole–dipole), n-π interactions, van der Waals forces, π-π interactions, and pore-filling processes [
51,
53,
54,
55,
56]. These mechanisms align with the Langmuir isotherm and pseudo-second-order kinetics, indicating strong and specific interactions between PAR molecules and the adsorbent surface. In contrast, the adsorption of MTZ is primarily driven by physical processes, exhibiting a lower adsorption affinity on activated carbon [
57,
58]. The behavior aligns with the Freundlich isotherm and is characterized by pseudo-stationary kinetics, where the rate-limiting step is attributed to mass transfer resistance in the external film.
These findings highlight the distinct adsorption behaviors of PAR and MTZ, demonstrating the varying roles of specific interactions and mass transfer dynamics in the adsorption process. The study underscores the effectiveness of GAC for removing pharmaceutical and organic compounds, providing valuable insights into the adsorption mechanisms that govern fixed-bed column systems.
3.3. Fixed-Bed Column Adsorption Evaluation
Similar to batch adsorption,
Table 5 presents the experimental conditions and results obtained for each run in the fixed-bed column experiments. The breakthrough curves for each run can be viewed in
Figure S2 (Supplementary Material). The findings indicate that the highest maximum adsorption capacities for both pharmaceuticals (q
maxPAR = 49.49 mg/g and q
maxMTZ = 43.64 mg/g) were achieved in Experiment 1 (C
0 = 30 mg/L; Q = 5 mL/min; W = 0.50 g).
To identify the optimal operational conditions, the simultaneous adsorption of the pharmaceuticals was analyzed. As shown in
Table 5, most runs exhibited similar behavior, with values of maximum adsorption capacity in comparable orders of magnitude. Additionally, in many cases, the adsorption of paracetamol was slightly favored, resulting in a higher q
max compared to metronidazole. This suggests a stronger interaction between the carbon activated and paracetamol.
Nadour et al. [
59] studied the removal of paracetamol, metronidazole, and diclofenac using carbon-polymeric membranes, finding that diclofenac removal reached 44%, while paracetamol and metronidazole had removal rates of 4% and 8%, respectively. These differences can be attributed to variations in molecular weight and solubility among the compounds. The authors also noted that the removal efficiency varied according to the concentrations of the compounds applied in the process, particularly for paracetamol and metronidazole, a trend observed in the present study as well. Additionally, they found that incorporating activated carbon into the membranes significantly increased removal rates by 34% for paracetamol and 28% for metronidazole, helping to explain the higher values recorded in this work.
Bouarroudj et al. [
60] compared three removal methods for metronidazole and paracetamol in a batch process, observing that photocatalysis had a significant impact on the photodegradation of both compounds, while adsorption and photolysis were less effective. This indicates that achieving effective adsorption of these compounds can be challenging using this method. However, the present study achieved high adsorption efficiencies with continuous adsorption, recording q
max values of 49.49 mg/g for paracetamol and 43.64 mg/g for metronidazole.
Comparing the results with the adsorption of only PAR in batch process, also using GAC, by Haro et al. [
61], the authors obtained q
maxPAR = 31.5 mg/g, and Ilavský et al. [
62] evaluated the adsorption of specific pharmaceuticals (paracetamol, carbamazepine, metronidazole, and caffeine) in a single and batch approach and observed that the removal capacity for PAR ranged between 0.071 and 0.434 µg/g, while for MTZ it was 0.11 to 0.539 µg/g using different activated carbon materials, showing a high efficiency of removal rate in this study when applying the continuous adsorption, an industrial approach, even in a multi-compound system. In addition, through the batch experiments, also applied in this work, in item 3.2, the removal efficiencies were between 71% and 98%, showing that the operational conditions applied in the process significantly impact on the feasibility of the technique by simultaneously treating the adsorption of these compounds.
Thus, it can be concluded from the results that the best adsorption capacities were obtained at the lowest concentration of the pharmaceuticals, suggesting a faster saturation of the solid when the concentration is higher, also observed by other works reported in the literature [
55,
58,
60]. Therefore, the best conditions obtained in the present work refer to Experiment 1, at lower concentration of pollutants, flow rate, and bed height, in which, under these conditions, the process control is facilitated, and there is a smaller amount of adsorbent required, resulting in the minimization of waste generation and lower process costs.
The analysis of the breakthrough curves (
Figure S2, Supplementary Material) revealed that all curves deviate from the ideal sigmoid (S) shape characteristic of breakthrough curves. The S-shape indicates a vertical alignment of the adsorbed species and is associated with cooperative adsorption. When the breakthrough curve deviates from this format, traditional models commonly used in the literature (such as Thomas, Yan, and Yoon-Nelson) often fail to accurately predict the outcomes due to their inability to account for the curve’s asymmetry. This limitation can be addressed by using the Gompertz models [
61,
62], which were used in this study, proposed by Hu et al. [
40] for multicomponent adsorption systems.
It is noteworthy that, as observed in
Figure S2, some curves do not reach the saturation point, defined as when 95% of the initial compound concentration is achieved. This is particularly true for the lower concentration mixtures (C
0 = 30 mg/L and 40 mg/L), including the optimal point. Additionally, better column performance is indicated by more favorable parameters, resulting in longer saturation times [
50]. This suggests that, for industrial applications, the adsorbent can be utilized for extended periods before requiring replacement or regeneration. It is significant to note that the optimal point corresponds to the lowest adsorbent mass used in this study (W = 0.5 g). It is worth mentioning that Haro et al. [
61] also investigated the removal of paracetamol in a fixed-bed column system, finding that the best operating condition was achieved with 0.5 g of GAC, resulting in extended saturation times for the column. They pointed out that increasing the bed mass indefinitely would eventually limit operation due to dispersion effects caused by the increased interstitial spaces within the adsorbent [
63].
In
Figure 5, the surface area and contour plots for simultaneous pharmaceutical removal by fixed-bed column adsorption are presented, depicting the response factors studied in this work (q
maxPAR (mg/g) and q
maxMTZ (mg/g)).
According to
Figure 5, the bed height significantly influences the response factors evaluated, particularly in relation to the process flow rate. While some authors in the literature have indicated that a greater bed height increases the total surface area of the adsorbent [
50], the adsorption capacity for pharmaceuticals tends to decrease with higher mass. For the conditions assessed, it appears that smaller masses combined with lower flow rates are adequate to achieve optimal adsorption capacity (
Figure 5b,e).
This behavior can be attributed to three primary factors: (1) not all binding sites may be accessible to adsorbate molecules at greater bed heights, potentially due to overlapping active sites, which leads to the underutilization of certain particles [
64]; (2) the channeling effect, where the solution flows preferentially near the column wall where there is more void space [
65]; (3) the axial dispersion phenomenon, which can dominate during mass transfer and hinder solute diffusion into the adsorbent pores [
66]. Therefore, a shallower bed depth has proven more advantageous for achieving optimal pharmaceutical adsorption capacity.
The initial concentration of pharmaceuticals has a proportional effect on the mass present in the process. Lower concentrations of pharmaceuticals at a shallower bed height (
Figure 5a,d) were sufficient to yield favorable process responses without the need for higher concentrations. A similar trend was noted for the flow rate (
Figure 5c,f). This was expected, as an increase in feed flow rate reduces the contact time between the adsorbate and the adsorbent, which in turn decreases bed capacity [
67,
68]. Scheufele et al. [
69] observed that while increasing the initial pollutant concentration generally enhances adsorption capacity, it can also reduce process efficiency (bed utilization). This finding aligns with the present study, where higher concentrations of pharmaceuticals led to decreased process efficiency.
An ANOVA analysis and a Pareto diagram were conducted for the two response factors to assess the significance of the variables applied in the process (see
Table S2 and Figure S3 in the Supplementary Material). The validity of the polynomial model was evaluated by calculating the coefficient of determination (R
2). By examining the Pareto chart, one can determine the magnitude and importance of the effects within the process.
This analysis revealed that only the q
maxPAR response factor was influenced by the evaluated variables in the process, specifically the initial concentration (C
0) and the interaction between the solid mass (W) and flow rate (Q). The R
2 and adjusted R
2 values for this factor were 0.5297 and 0.0, respectively. In contrast, for the q
maxMTZ response factor, although no significant variables were identified, it yielded R
2 and adjusted R
2 values of 0.811 and 0.526, respectively. These values raise questions about the reliability of the relationship between predicted and experimental data, and in some cases, they may be considered statistically unsatisfactory. Furthermore, when investigating each parameter and their interactions individually (
Figure S3), it was noted that parameters with negative coefficients corresponded to undesirable or antagonistic effects, while those with positive coefficients indicated desirable and/or synergistic effects on the efficiency of the adsorption process.
To confirm the previous statements and approximate the mathematical relationship of the experimental matrix, as in batch adsorption, two second-order polynomial equations were obtained. The first equation refers to q
maxPAR (Equation (14)), and the second equation to q
maxMTZ (Equation (15)). These equations are valid only for the conditions applied in the present study, and only the significant factors were considered.
where q
maxPAR and q
maxMTZ (mg/g) represent the maximum adsorption capacity for paracetamol and metronidazole, respectively; x
1 is the initial concentration of the pharmaceuticals; x
2 represents the mass (W; g); and x
3 is the feed flow rate (Q; mL/min).
Considering these equations and the optimal experimental conditions obtained through the experimental procedure, it can be observed that the values of qmaxPAR = 32.665 mg/g and qmaxMTZ = 133.046 mg/g are derived from the model, with the latter showing that the variables involved do not significantly influence the adsorption of the compound. When analyzing these results in conjunction with the R2 value obtained in this study, it becomes evident that the experimental design and the applied model do not statistically support the proposed experiment. The R2 value indicates that the model does not account for a sufficient amount of variability in the data, meaning that the relationship between the factors and the response (qmax of the compounds) may not be accurately represented by the current model. Additionally, the experimental design, while based on established methodologies, may not fully capture the complexity or the interactions of the variables, leading to less reliable conclusions. Therefore, a reassessment of the model or potential refinement in the experimental design is necessary to improve the statistical robustness and ensure that the findings are both valid and reliable. However, since only significant factors were considered in the model, the difference in the values of qmax also may be attributed to the conditions that were not statistically significant, which are inherently included in the experimental setup.
Even though the interaction between W and Q is statistically significant only for the paracetamol (q
maxPAR), as presented, a similar phenomenon is observed when considering metronidazole (
Figure 5d–f). This insight underscores the complexity of multicomponent adsorption phenomena and emphasizes the need for tailored experimental and modeling approaches to effectively characterize and predict these interactions.
Table 6 shows the comparison of the maximum adsorption capacity of organic molecules at different adsorbents and GAC present in the literature.
The results in
Table 6 highlight significant variations in the maximum adsorption capacity (q
max) of organic compounds on GAC, depending on the compound’s physicochemical properties and specific interactions with the adsorbent surface. In this study, paracetamol (49.5 mg/g) and metronidazole (43.6 mg/g) showed moderate adsorption capacities compared to other compounds. For instance, salicylic acid (205.1 mg/g) [
70] exhibited much higher q
max, likely due to stronger hydrophobic or electronic interactions with GAC, while tetracycline (2.08 mg/g) [
74] had the lowest capacity, indicating less favorable interactions. Compounds such as atenolol (79.9 mg/g) [
75] and carbamazepine (56.1 mg/g) [
69] displayed adsorption capacities closer to the values observed in this study. These findings emphasize that GAC interactions with organic compounds depend on factors like polarity, functional groups, molecular size, and hydrophobicity.
Mathematical Modeling of Breakthrough Curves
Table 7 presents the parameter values and statistical metrics derived using the MCMC method for the adsorption of paracetamol and metronidazole, respectively, under the optimal operational conditions (run order 1). The values presented in
Table 7 are the posteriori means of the parameters, containing the lower and upper limits, according to the confidence interval applied (99%) in the present study.
Figure 6 illustrates the breakthrough curve modeling for the simultaneous adsorption of the two pharmaceuticals in a fixed bed column during Experiment 1, with the Logistic and Gompertz models applied to the multicomponent adsorption system.
From
Table 7 it is observed that the Gompertz model for multicomponent adsorption provided the best fit for both compounds, with the following statistical metrics: PAR: R
2 = 0.754, adjusted R
2 = 0.736, AIC = 1301.10, AIC
C = 1301.20, and BIC = 1302.20; MTZ: R
2 = 0.760, adjusted R
2 = 0.742, AIC = 1207.10, AIC
C = 1207.20, and BIC 1208.30. The logistic model represents a more symmetric and idealized breakthrough curve, making it suitable for systems with an even progression from low to high concentration. In contrast, the Gompertz model is more flexible and better suited for systems with delayed breakthroughs, where the transition from low to high concentration is asymmetric.
In this study, the Gompertz model was found to better represent the experimental data due to the pronounced asymmetry observed in the breakthrough curves. Furthermore, as shown in
Figure 5, the rapid transition from low to high concentrations in the experimental data aligns more closely with the estimates produced by the MCMC technique for the Gompertz model. To verify the convergence of the posterior distributions and confirm the viability of the Gompertz model, the MCMC chains for both paracetamol and metronidazole are presented in
Figure 7 and
Figure 8, respectively.
From
Figure 7 and
Figure 8 it is possible to observe the convergence of the Markov chains for all parameters estimated from both models through Bayesian inference. This result indicate that the technique is applicable to multicomponent adsorption systems, since the method was able to adequately explore the parameter space. Thus, the MCMC technique is capable of dealing with the complexity of the modeled system, which presents complex interactions between parameters, reinforcing the reliability of the estimated values and allowing the assessment of uncertainties associated with the parameters, being essential to validate the model in complex experimental conditions.
These results reinforce the conclusion that the methodology employed in this study, alongside with practical models for multicomponent adsorption systems, is advantageous for scaling up the implementation of the processes. The use of asymmetric models derived from Gompertz [
72] can further enhance the prediction of experimental data, supporting their application in various adsorption processes for practical implementation. In addition, Hu et al. [
40] also concluded that the Gompertz model is superior to the logistic model in terms of the fitting accuracy.
Hu et al. [
40] observed that, in multicomponent adsorption systems, the concentration of a compound in the treated effluent may exceed its initial concentration in the feed effluent. The authors attributed this phenomenon to the removal of strongly binding ions in the upper sections of the column, which consequently leads to the release of an equivalent amount of weaker ions. However, in the present study, the typical behavior of multicomponent adsorption was not observed. This discrepancy could be attributed to differences in the adsorption dynamics resulting from the specific experimental conditions used. Longer process times may be required to observe this effect fully. Additionally, variations in the feed composition and/or the adsorption properties of the adsorbent could prevent the displacement of weaker ions by those with a higher affinity for the adsorbent. These findings emphasize that each multicomponent system requires a careful evaluation of its unique process dynamics.
It is important to note that the parameters of Gompertz models do not provide specific insights into the dominant mechanisms of the adsorption process, as the model was originally developed for different applications. However, Juela et al. [
65] observed that the parameters vary with changes in the operational conditions of the fixed-bed column, making the model particularly useful for scale-up studies. Hu et al. [
40] concluded that the parameters c, k, τ, k*, and τ* are essential for tailoring the logistic and Gompertz models to accurately describe adsorption processes. They allow for the adjustment of curve steepness, position, and interaction effects, making the models applicable to multicomponent systems. The observed asymmetry in breakthrough curves arises from differences in adsorption mechanisms, reactant reactivity, and intraparticle diffusion, highlighting the complexity of real-world adsorption systems.
By comparing the results by Hu et al. [
40] with the ones found in this work is possible to conclude that the parameter’s values are in the same order of magnitude for binary fixed-bed adsorption, in which a higher k value implies a steeper curve, indicating more favorable adsorption and τ shifts the position of the breakthrough curve along the time axis, aligning with the experimental data. However, it is important to note that the model adjustments to the experimental data yielded R2 ≈ 0.70 for both compounds and models. This moderate fit may be attributed to the fact that the breakthrough curves only reach approximately 50–60% of the initial pharmaceutical concentrations. Despite this, the methodology demonstrates its suitability for modeling multicomponent fixed-bed adsorption systems effectively.


 ,
, 


