Article

The Thermal Properties of Gliadins and Glutenins Fortified with Flavonoids and Their Glycosides Studied via Thermogravimetry (TGA) and Differential Scanning Calorimetry (DSC)

by
Magdalena Krekora
1,2,
Karolina Halina Markiewicz
3,
Agnieszka Zofia Wilczewska
3 and
Agnieszka Nawrocka
1,*
1
Institute of Agrophysics Polish Academy of Sciences, Doświadczalna 4, 20-290 Lublin, Poland
2
Institute of Earth and Environmental Sciences, Faculty of Earth Sciences and Spatial Management, Maria Curie-Sklodowska University, al. Kraśnicka 2cd, 20-718 Lublin, Poland
3
Faculty of Chemistry, University of Białystok, Ciołkowskiego 1K, 15-245 Białystok, Poland
*
Author to whom correspondence should be addressed.
Appl. Sci. 2025, 15(13), 7303; https://doi.org/10.3390/app15137303
Submission received: 8 May 2025 / Revised: 25 June 2025 / Accepted: 26 June 2025 / Published: 28 June 2025

Abstract

Thermal analyses (TGA and DSC) were used to determine the thermal properties of gliadins and glutenins extracted from a model wheat dough fortified with flavonoids and their glycosides. As flavonoids, quercetin; naringenin; hesperetin; and their glycosides, rutin, naringin, and hesperidin, were used in amounts of 0.05%, 0.1% and 0.2%. An analysis of TGA parameters showed that samples fortified with flavonoids/glycosides led to an increase in the weight loss of gliadin. The thermal behavior of gliadins enriched in polyphenols depended on the structure and size of the added compound. The weight loss of glutenin did not change in the presence of the studied polyphenols. An analysis of the difference TGA thermograms showed that quercetin, rutin, and naringin interacted with gliadins through the OH group located at the B ring in the 4’ position. Additionally, quercetin formed chemical bonds with the polypeptide chains of glutenins. The DSC thermograms were consistent with the TGA results, which suggest interactions between gliadin and quercetin.

1. Introduction

Gliadins and glutenins account for approximately 30% and 50% of the total protein in the wheat grain, respectively. These proteins are collectively referred to as gluten and are classified as the storage proteins of wheat. These proteins are important for determining the quality of common wheat food products, such as bread and pasta, as they are responsible for the elastic properties of the bread dough. Gliadin affects its viscosity and extensibility, whereas glutenin affects its elasticity and strength [1].
Flavonoids are the most abundant phenolic compounds in plants. These polyphenols are a large group of compounds that, due to their chemical structure, have health-promoting properties. Therefore, they can also be excellent food modifiers. The use of plant proteins and their modified forms is increasingly being investigated in order to improve the nutritional and physicochemical properties of food products. It should be emphasized that polyphenols, thanks to their antioxidant properties, exhibit antiviral, antibacterial, anti-inflammatory, anticancer, and anti-allergic properties, as well as other biological effects attributed to them by Panche et al. [2]. Świeca et al. [3] showed that the enrichment of wheat bread with raw materials rich in phenols is an effective technique to improve the antioxidant potential of preserved bread. Han & Koh [4] enriched breads with phenolic acids, and they clearly showed that phenolics responsible for the antioxidant potential of enriched breads are already strongly bound to bread components in the mixing stage of dough. The formation of protein–polyphenol complexes may affect the rheological, functional, and biological properties of the dough.
From a technological point of view, it is also important to examine the impact of added ingredients on the thermal properties of the gluten network, as these modifications may significantly affect the quality and thermal stability of wheat dough. Khatkar et al. [5] used thermogravimetry (TGA) and differential scanning calorimetry (DSC) to examine the thermal properties of the gluten network after adding 5% and 10% of gliadin to it. These studies showed a reduction in the stability of the gluten network as a result of gliadin addition. Liu et al. [6] checked how the interactions of phenolic compounds (naringin, cyanidin-3-O-glucoside, and proanthocyanidin) with gluten affect the physicochemical properties of active films with antibacterial and free radical scavenging properties. They observed an improvement in the thermal stability of the film in the presence of proanthocyanidin. Ma et al. [7] studied the interactions between wheat bran and gluten proteins. The results of thermostability analyses showed a reduced weight loss and degradation temperature of both glutenin and gliadin proteins at high fiber concentrations. Nawrocka et al. [8] used TGA and DSC to study changes in the thermal properties of gluten proteins influenced by dietary fiber polysaccharides. TGA measurements showed that the gluten network remained thermally stable after the addition of polysaccharides, while DSC thermograms showed a shift of the denaturation temperature to a higher temperature, demonstrating the aggregation of gluten proteins in the presence of added polysaccharides. Rumińska et al. [9] used TGA and DSC methods to observe that the gluten network remained thermally stable after adding oil pomaces obtained from black cumin, pumpkin, hemp, milk thistle, and primrose seeds to the model dough. In previous studies, using TGA and DSC techniques, we investigated the effect of selected flavonoids and their glycosides on the thermal properties of the gluten network in a model system [10]. Continuing these studies, we also wanted to check how fortification with polyphenolic compounds affects each of these proteins separately. Therefore, the aim of this research was to determine the thermal properties and thermal transformations occurring in individual gluten proteins (gliadins and glutenins) extracted from a model wheat dough, which was enriched with selected flavonoids and their glycosides. These studies may help develop new wheat products with better health and sensory properties.
The research results presented in this article are part of a research project aimed at learning and understanding the interactions of flavonoids and their glycosides with gluten proteins (gliadins and glutenins). At the same time, spectroscopic studies using FTIR and FT-Raman were performed, some of which have already been published [10,11], and some related studies are being prepared for publication.

2. Materials and Methods

2.1. Materials

Wheat gluten, wheat starch, sodium chloride, quercetin (QUE), rutin (RUTG), naringenin (NAR), naringin (NARG), hesperetin (HET), and hesperidin (HEDG) were purchased from Merck Poland (Poznań, Poland). Ethanol was purchased from Avantor Performance Materials Poland S.A. (Gliwice, Poland). All chemicals were used as received. Double-distilled water was used. The structure of the flavonoids and their glycosides is shown in Figure S1 in the Supplementary Material.

2.2. Model Dough—Flavonoid/Glycoside Sample Preparation

Model dough supplemented with selected flavonoids and their glycosides (quercetin, naringenin, hesperetin, rutin, naringin, and hesperidin) was prepared in a farinograph-E (Brabender, Duisburg, Germany) according to the method described by Krekora et al. [12]. Gluten samples were obtained according to the method described by Krekora et al. [12].

2.3. Extraction of Gliadins and Glutenins from Gluten Samples

Gliadins were extracted from powdered gluten according to a slightly modified Booth and Ewarth method [13]. As a result of gliadin extraction, precipitation was obtained in 70% ethanol. The precipitate was regarded as glutenins. The obtained gliadins and glutenins were lyophilized (freeze-drier Free Zone 2.5, Labconco, Kansas City, MO, USA). The gliadins and glutenins samples in the powdered form were stored in Eppendorf tubes protected with parafilm at room temperature. The powdered material was used in the experiment.

2.4. Thermogravimetric Analysis of Gliadins and Glutenins (TGA)

Thermogravimetric analysis (TGA) was performed on a Metler Toledo Star TGA/DSC1 unit (Metler Toledo Corp., Zurich, Switzerland) according to the method proposed by Nawrocka et al. [8].
To determine differences in the thermal behavior of gliadin and glutenin complexes with flavonoids and their glycosides, difference thermograms were calculated according to the procedure outlined by Rumińska et al. [9] using ORIGIN (v. 9.0 PRO, OriginLab Corporation, Northampton, MA, USA).

2.5. Differential Scanning Calorimetry of Gliadins and Glutenins (DSC)

Differential scanning calorimetry (DSC) was performed on a Mettler Toledo StarDSC system (Mettler Toledo Corp., Zurich, Switzerland) according to a modified method described by Leon et al. [14] and Nawrocka et al. [8].

2.6. Statistical Analysis

For all tests, results were carried out using a one-way analysis of variance (ANOVA) followed by Tukey’s test (α = 0.05). In all tables, the result is presented as means with standard deviations of five replications. Statistical analysis was performed using Statistica software (v. 13.1, TIBCO Software Inc., Tulsa, OK, USA).

3. Results and Discussion

3.1. Thermogravimetric Analysis (TGA)

The thermogravimetric parameters (weight loss (WL) and degradation temperature (Td)) of gliadins and glutenins are presented in Table 1. The thermal degradation profiles and their first derivatives for both types of proteins are depicted in Figures S2 and S3 in the Supplementary Material, respectively. The weight loss and degradation temperature for gliadins are 68.7% and 310 °C, respectively. Sharif et al. [15] obtained a degradation temperature for gliadins of about 322 °C. The difference in degradation temperature can be attributed to the structural form of the studied gliadins, because Sharif et al. [15] obtained this parameter for gliadin fibers obtained via electrospinning. Similar results for weight loss for gliadins were obtained by Ma et al. [7]. In contrast, lower weight loss (54.5%) for gliadins was reported by Qiu et al. [16], who studied deaminated gliadins. In the case of glutenins, the weight loss and degradation temperature were 70.8% and 301 °C, respectively. Similar values of both parameters for glutenins were obtained by Ma et al. [7]. A comparison of the TGA parameters for both gluten proteins showed that they did not differ in the weight loss, whereas gliadins had a higher degradation temperature. According to Ma et al. [7], this difference is related to the structure of the studied proteins, especially the type of disulfide bridges formed. Gliadins only formed intrachain disulfide bridges (seven bonds) that required more energy to be cleaved. Glutenins formed two kinds of disulfide bridges, intra- (four bonds) and interchain (six bonds) [17]. Additionally, gluten, as a mixture of gliadins and glutenins, is characterized by similar weight loss but a higher degradation temperature (318 °C) [10]. The higher degradation temperature indicates a higher amount of different chemical bonds, including disulfide bridges, hydrogen bonds, ionic bonds, etc.
The addition of flavonoids/glycosides caused changes in the thermal parameters of gliadins (see Table 1). The presence of these compounds led to an increase in the weight loss. The greatest weight loss was observed after 0.05% addition of QUE, RUTG, and NAR. For QUE and NAR, a slight decrease in weight loss was observed with an increase in their concentration. In contrast, the increase in the concentration of RUTG, NARG, HET, and HEDG in the dough sample did not affect the weight loss of gliadin-flavonoid/glycoside samples. An increase in gliadin WL as a result of flavonoid/glycoside presence may indicate that the polyphenols interact with gliadins during the dough mixing process, preventing the formation of an adequate gliadin structure. The results show that the WL parameters increase depending on the structure and size of the used compound. The biggest increase in WL was observed for QUE, RUTG, and NAR, which are characterized by the smallest spatial size (see Figure S1 in the Supplementary Material). They can form hydrogen bonds between gliadin chains because they have OH groups on both sides of the molecule. In the case of NARG and HEDG, the glycosidic linkage is at position 7. For this reason, the size of both glycosides is greater compared to that of rutin, in which the glycosidic linkage is at position 3. Additionally, HET and HEDG have one methoxyl group at the B ring, which may hinder the formation of hydrogen bonds on both sides of the molecule. As seen in Table 1, the weight loss of glutenin does not change in the presence of the studied polyphenols. This parameter also did not change in the case of gluten network modified by the same compounds [10]. Taking the above-mentioned results into account, it can be concluded that glutenins are responsible for the thermal stability of the gluten network.
The first derivatives of TGA thermograms, presented in Figures S2 and S3 in the Supplementary Material for gliadins and glutenins, respectively, show two peaks. The first peak (Td1), localized in the temperature range of 50–150 °C, is related to the loss of free and bound water by the sample as a result of sample heating [18]. In the case of gliadins and glutenins samples, the value of this degradation temperature was not shifted after polyphenol addition. This suggests that polyphenols did not interact with water during dough mixing. Similar results concerning this peak were obtained for the gluten network modified by the same polyphenols [10], dietary fiber preparations [19], and fiber polysaccharides [8,20]. The second peak (Td2) is related to the degradation of gluten proteins. In the case of gliadins, this peak is localized at 310 °C. Interactions between gliadins and the polyphenols induced a shift of this peak to 319 °C. An increase in the degradation temperature (Td2) indicates that the gliadin–polyphenol complex is more thermally stable than gliadin alone. The temperature Td2 for glutenins was observed at 301 °C, and it did not change in the presence of flavonoids/glycosides. This indicates that glutenins do not interact with polyphenols. The lower degradation temperature of glutenins compared to gliadins suggests that glutenins are less thermally stable than gliadins. On the other hand, the gluten network, which is a mixture of gliadins and glutenins, is the most thermally stable among these proteins because its degradation temperature is ca. 320 °C [10]. The present results contradict the assumption of Wang et al. [18] that the thermal properties of the gluten network in dough are connected with glutenins. The present results may also provide an explanation as to why the dough breakdown phenomenon was observed during the mixing process of wheat dough modified by small-sized polyphenols, e.g., phenolic acids [12]. A comparison of changes in the secondary structure of the gluten network between samples taken before dough breakdown and at the end of mixing showed slight differences, probably because phenolic acids interacted with gliadins, not glutenins. Interactions between gliadins and phenolic acids, as changes in the secondary and tertiary structure of gliadins, were also observed by Welc et al. [21]. Additionally, difference TGA thermograms were calculated to describe differences in the thermal behavior of gliadin/glutenin–flavonoid/glycoside complexes in more detail. The difference thermograms are presented in Figure 1 and Figure 2 for gliadins and glutenins, respectively. The TGA thermograms of gliadin samples show two peaks—negative and positive. The negative peak is located at ca. 293 °C and is probably connected with gliadin degradation. Rumińska et al. [9] also observed one negative peak for all gluten samples modified by oil pomaces in the difference thermograms that was located at ca. 305 °C. The positive peak is observed at a different temperature depending on the phenolic compound used and its concentration. In the case of QUE, the positive maxima are observed at 370, 323, and 337 °C for a 0.05%, 0.1%, and 0.2% QUE concentration, respectively. The peak at 337 °C can be assigned to the degradation of free QUE, because a similar peak is observed in Figure S2g for free QUE. The peak at 370 °C can be connected with the gliadin-QUE complex because a shoulder at a similar temperature is observed for higher QUE concentrations. The peak at 322 °C is also observed for the gliadin–RUTG samples. These observations suggest that QUE can interact with gliadins through OH groups localized at different positions, whereas RUTG forms chemical bonds with the gliadin proteins through precisely defined OH groups due to the presence of the glycosidic part. Similar assumptions to RUTG can be made for HEDG. Thermograms of gliadin–HEDG samples show one peak at 333 °C, whereas peaks at 342 and 371 °C were observed for samples modified by HET. The peak at 371 °C is connected with the degradation of free HET because a similar peak is observed in the thermogram of free HET (see Figure S2k). The difference in the degradation temperature for gliadin–HET and gliadin–HEDG complexes indicates that HET and HEDG may interact with gliadins through different OH groups. In the case of NAR and NARG, a few peaks are observed. Gliadin-NAR thermograms show two peaks at ca. 330 and 358 °C, whereas peaks at 322, 335, and 364 °C are present on the gliadin-NARG thermograms. None of these peaks can be assigned to free NAR or NARG (see Figure S2i,j). The presence of the peak at ca. 330 °C indicates that NAR and HEDG interact with gliadins in a similar way (see Figure 1c,f). Similarly, RUTG and NARG can form chemical bonds with gliadins through the same OH group (see Figure 1b,d). An analysis of the RUTG and NARG structure shows that they can interact through two hydroxyl groups located in the ring B at position 4’ or in the ring A at position 5. In the case of NAR and HEDG, a possible place of interaction is localized in the ring A at position 5. These results suggest that the peak at 322 °C can be connected with gliadin-QUE/RUTG/NARG interactions through the OH group localized in ring B at position 4’. In contrast, the degradation of chemical bonds formed between the OH group in the ring A at position 5 and gliadins can be observed at ca. 330 °C for gliadin-NAR, NARG, and HEDG.
The difference thermograms of glutenins modified by flavonoids and their glycosides, presented in Figure 2, are more structured in comparison with gliadins. This may be related to the more complicated structure of glutenins, which are polymeric proteins. Thermograms of glutenin-QUE show only three peaks—two negatives at 263 and 337 °C, and one positive at 302 °C. The positive peak is connected with the degradation of unmodified glutenins (see Table 1). A decrease in the intensity of this peak with increasing QUE concentration indicates that QUE forms chemical bonds with the polypeptide chains of glutenins. The peak at 337 °C can be assigned to free QUE (see Figure S2g). Its negative orientation suggests that all QUE added to the model dough may be incorporated into the glutenin polymeric network. The fact that the glutenin-QUE thermograms are the least structured, i.e., we observe only three peaks, may be related to the unbranched structure of QUE (i.e., all aromatic rings and functional groups lie in the same plane). Therefore, the QUE molecule can incorporate into the glutenin network and stabilize it. In the case of other flavonoids and glycosides, whose structure is more branched (i.e., some functional groups and/or aromatic rings lie out of plane), the thermal behavior is less ordered compared to the glutenin-QUE complex. However, a comparison of the difference thermogram shows similarities in thermal behavior between RUTG and NARG and NAR and HEDG. Similar results were obtained for gliadins. The thermograms of glutenin-RUTG/NARG 0.05 and 0.1 samples show a negative peak at ca. 300 °C, whose intensity increases with increasing RUTG concentration. This increase suggests the incorporation of both glycosides into the glutenin network. In contrast, the difference thermograms of glutenin-RUTG/NARG 0.2 samples are similar to the difference thermograms of glutenin-QUE samples. This similarity may indicate that some glutenin polypeptide chains interact with QUE, RUTG, and NARG in the same way as gliadins. However, these results do not enable the determination of the place of chemical bond formation. An analysis of the difference thermograms for glutenin-NAR 0.1 and all glutenin-HEDG samples also suggests a similar method of interaction, but there is too little information to determine the place of the interaction.
These studies show that the addition of flavonoids and their glycosides to gluten proteins affects their thermal properties, which may affect the quality of bread. TGA and DSC analyses have shown that flavonoids such as quercetin, naringenin, hesperetin, and their glycosides (rutin, naringin, and hesperidin) caused changes in the secondary and tertiary structure of gluten, modifying disulfide bridges and the amino acid environment, as well as influencing the thermal stability of the gluten network [10]. During baking, flavonoids mainly interact with gluten proteins through hydrogen and hydrophobic bonds, leading to changes in the protein structure, which may affect the texture, volume, and sensory properties of bread [22].
The incorporation of polyphenols into the gluten network may have a beneficial effect on the nutritional quality of the final product, improving its health and functional properties. Although it is known that polyphenols are thermally degraded under the influence of high temperature, which reduces their bioactivity [23], they can remain thermally stable in the gluten network after binding to gluten proteins. Such an interaction may protect polyphenols from degradation. It has been confirmed that flavonoids retain their biological activity after baking, and their bioavailability is high, which translates into an increase in antioxidant activity in the blood after the consumption of such bread [24].

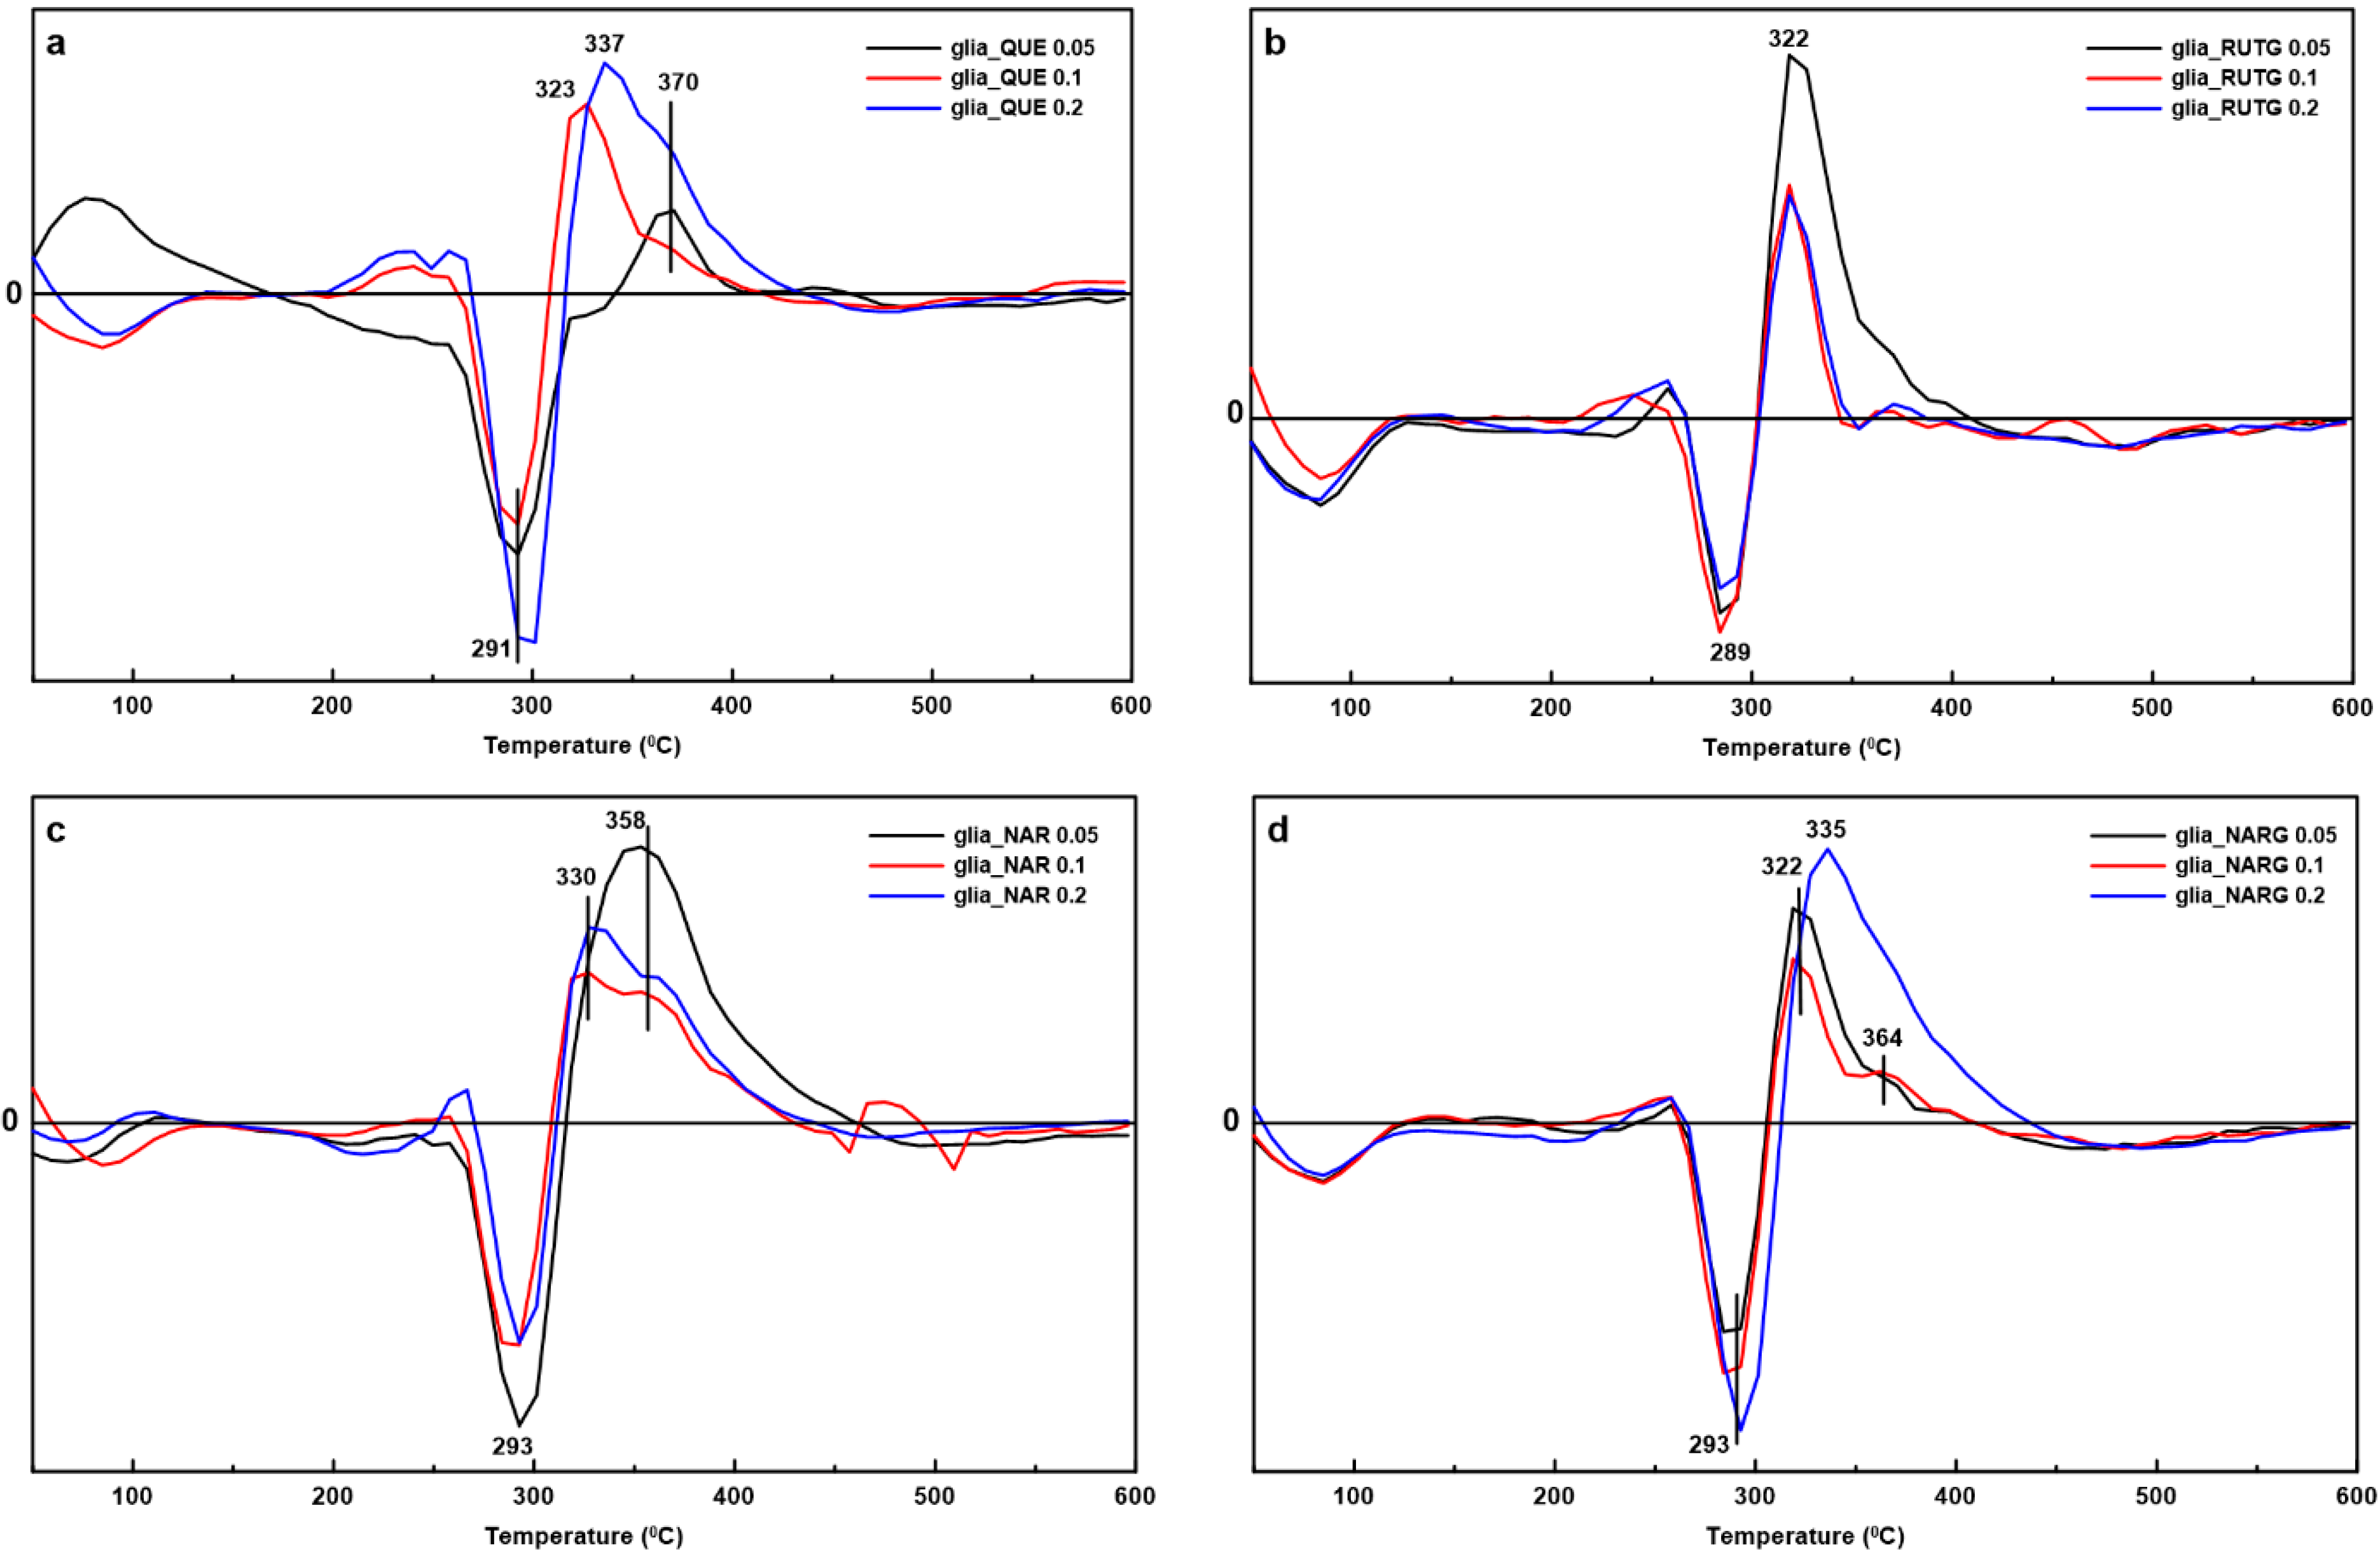
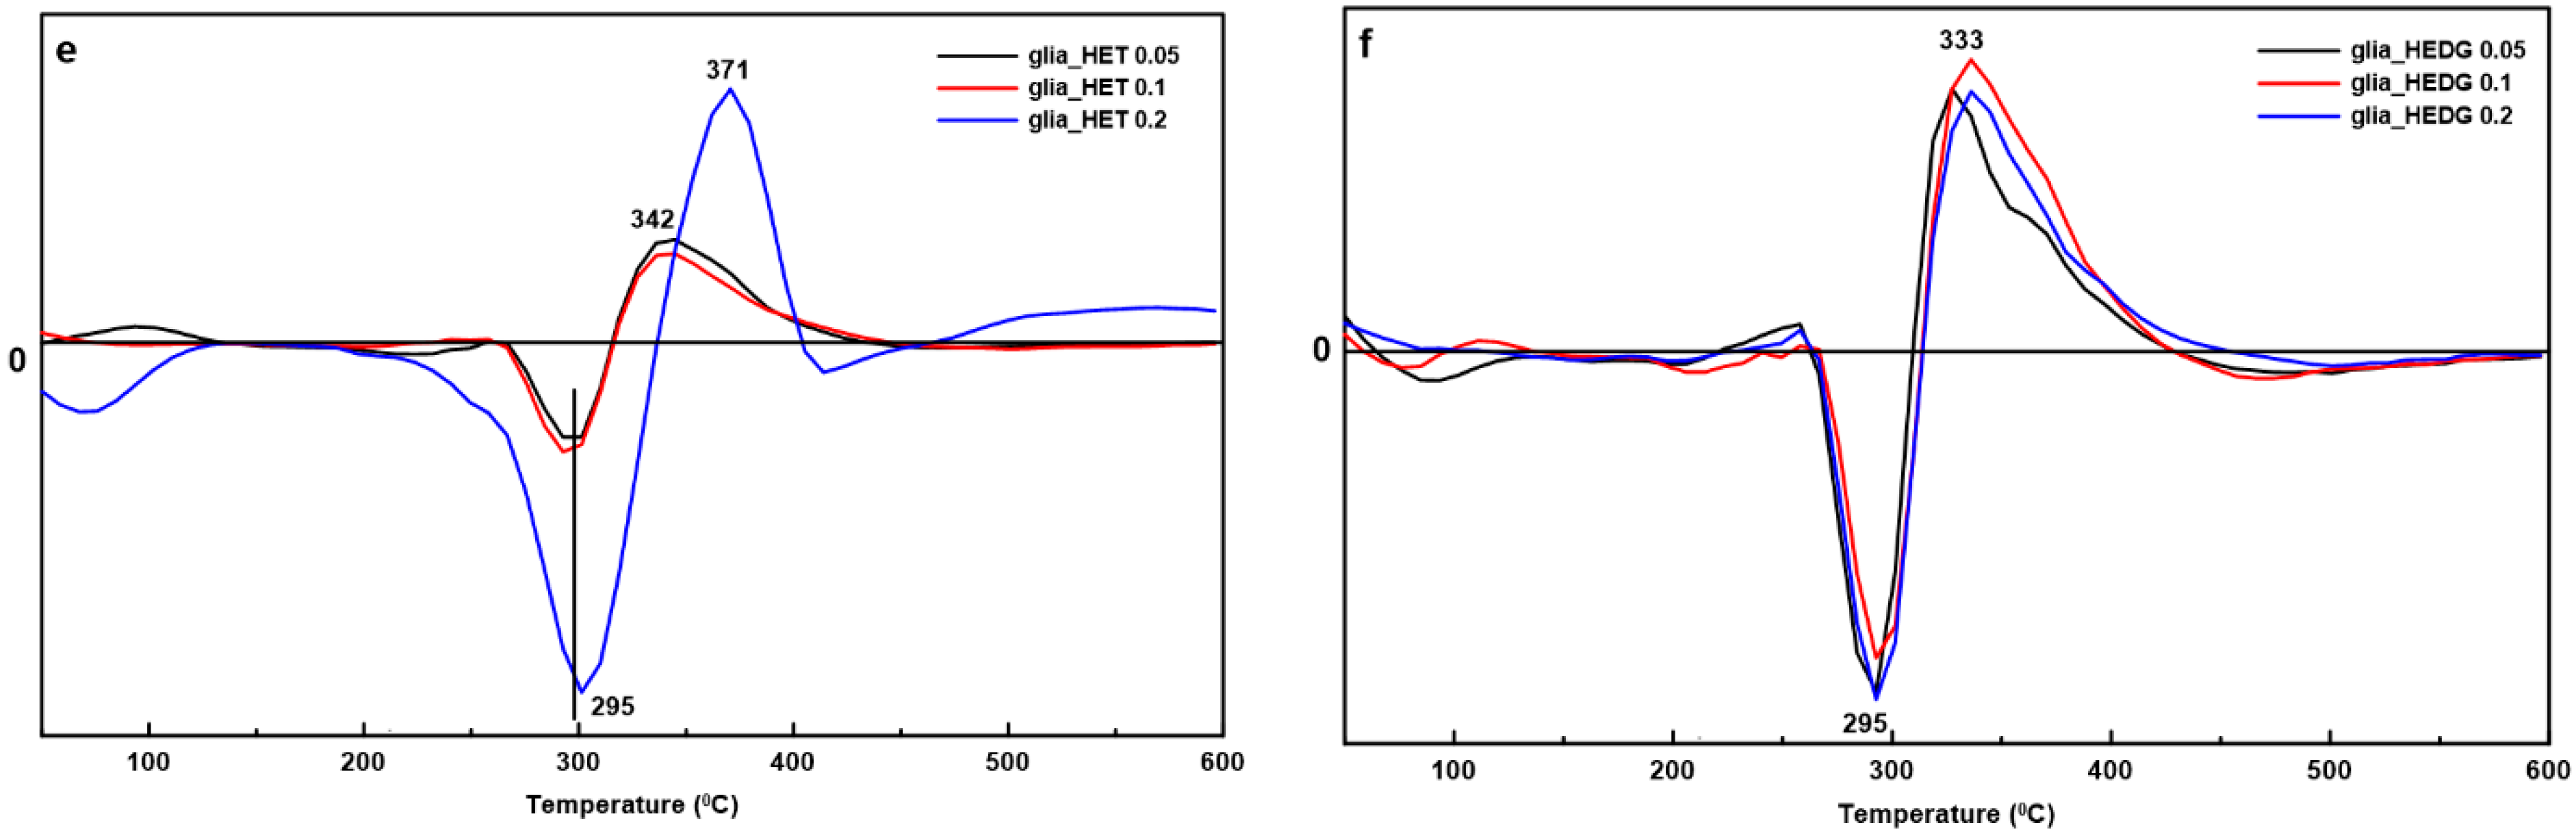
3.2. Differential Scanning Calorimetry (DSC)

The DSC parameters (denaturation peak temperature (T) and transition enthalpy (ΔH)) and DSC thermograms of both gluten proteins are presented in Table 2 and Figures S4 and S5 in the Supplementary Material, respectively. The DSC thermograms showed two negative peaks at 76 and 308 °C for gliadins (see Figure S4), and one negative and one positive peak at 91 and 302 °C, respectively, for glutenins (see Figure S5). The first peak for both kinds of proteins is exothermic (ΔH ≅ 180 J·g−1) and connected with water evaporation. The second peak is connected with protein decomposition [25]. In the case of gliadins, this peak is exothermic, with a transition enthalpy of 263 J·g−1, whereas glutenins show an endothermic peak, and the enthalpy value is ca. 29 J·g−1. In the case of gluten, which consists of gliadins and glutenins, the authors of [9] observed an exothermic peak connected with gluten decomposition at ca. 305 °C.
The DSC thermograms of all modified protein samples also show an exothermic peak related to the water evaporation in the temperature range of 70–100 °C (peak T1). In the case of gliadin samples, this temperature is ca. 15 °C lower compared to glutenin samples (see Table 2). This difference can be attributed to the molecular weight of the studied proteins, since gliadins are monomeric proteins with a low molecular weight (30–80 kDa), whereas glutenins are polymeric and characterized by a high molecular weight (500–10,000 kDa) [17]. Polymeric proteins contain more water molecules that are bound inside the protein complex, and therefore, more energy is needed to release them. This peak is not observed in the DSC thermograms of pure flavonoids and their glycosides.
The unmodified gliadin decomposition is observed at 308 °C as an exothermic peak. The addition of the QUE shifts this peak toward higher temperatures to ca. 320 °C. An increase in the QUE concentration to 0.2% causes the decomposition temperature to be similar to that recorded for the gliadin control sample. Additionally, the presence of the QUE changes the character of the thermal transition to endothermic, and its enthalpy decreases by about five times. The peak at 320 °C could be assigned to free QUE decomposition since the thermogram of the free QUE has a sharp, intensive peak at this temperature (see Figure S4a). However, the QUE decomposition is exothermic, while the decomposition of gliadin-QUE samples is endothermic. Moreover, the DSC thermograms of gliadin-QUE 0.05 and 0.1 samples show an additional endothermic peak at ca. 265 °C (T3), which is shifted to 249 °C with an increase in the QUE concentration to 0.2%. Simultaneously, the enthalpy of this transition decreases with an increasing QUE concentration. These results are in agreement with the TGA results presented above, which suggest interactions between gliadins and QUE. Krekora et al. [10] also observed a shift in the decomposition temperature toward lower temperatures for gluten samples obtained from a model dough modified by QUE, with an increase in the flavonoid concentration. The addition of the RUTG to the model dough does not affect the decomposition temperature and transition enthalpy of the gliadins. NAR, NARG, HET, and HEDG caused a shift in the decomposition temperature toward lower temperatures with an increase in their concentration. Most of the observed transitions exhibit an exothermic character with slight changes in enthalpy. Endothermic transitions are only observed for gliadin–HET 0.1 and 0.2 samples, with a significant increase in the value of transition enthalpy. A change in the transition character from exothermic to endothermic may indicate the formation of a more ordered structure of gliadins [9] in gliadin–polyphenol complexes. According to Tsioptsias & Tsivintzelis [26], compounds that are capable of forming an increased number of hydrogen bonds simultaneously require increased thermal energy to break up the vast number of specific intermolecular interactions, and the absorption of increased amounts of heat can also lead to the breaking of chemical bonds. Hence, it can be claimed that only QUE interacts with gliadins through hydrogen bonds because the addition of this polyphenol causes an increase in the decomposition temperature of the gliadin-QUE samples. A similar assumption was presented by Qiu et al. [16], who also observed a shift in the decomposition temperature toward higher temperatures after the addition of hydrochloric and citric acids to gliadin. The authors claimed that modified gliadins contained more chemical bonds than native gliadins and hence formed a more compact structure.
The thermal parameters and DSC thermograms of glutenins are presented in Table 2 and Figure S5 in the Supplementary Material, respectively. The addition of flavonoids and glycosides does not affect the decomposition temperature and transition enthalpy for the modified glutenin samples. A lack of changes in the thermal parameters does not mean that the studied polyphenols do not interact with glutenin polypeptide chains. They can interact, but these changes are probably very small. The DSC technique has too low a sensitivity to show these changes, and glutenins form a complex matrix.
In previous studies, we observed that unenriched gluten (gliadins and glutenins) had a lower decomposition temperature (283 °C) than the gliadins and glutenins extracted from it. Additionally, the gluten decomposition process was endothermic, and the enthalpy of this process was 12 J/g (similarly to glutenins extracted from the gluten network) [10]. However, the decomposition temperature of gliadins was higher (308 °C) compared to gluten and glutenins extracted from it. This indicates the greater thermal stability of the extracted gliadins. Differences in thermal stability between gluten, gliadins, and glutenins extracted from it may result from the ability of each of these objects to form disulfide bonds. The bonds formed between two SH groups (disulfide bridges) are covalent bonds that are difficult to break. Gliadins, due to the small number of cysteine residues in their structure, form significantly fewer SS bonds, and they are mainly intramolecular bonds. Most α- and γ-gliadins contain six and eight cysteine residues, respectively, and form three or four homologous intrachain SS bonds [27]. Glutenins have more cysteine in their amino acid sequence, which makes them capable of forming many disulfide bonds both intra- and intermolecularly [28]. Waga [29] claims that disulfide bonds increased the resistance of proteins to thermal denaturation. However, temperatures above 55 °C break these bonds. Kieffer et al. [30] observed in their research that temperature is one of the factors that reduces the strength of gluten. As a result of temperature increase, disulfide bonds are split and rearranged. The presence of the intrachain disulfide bonds in gliadins may increase the folding of the amino acid chain [31]. Therefore, these bonds may be less accessible, and the temperature needed to break the bonds and decompose gliadins is slightly higher, even though they have fewer SH residues and can form fewer disulfide bonds than glutenins. According to Lagrain et al. [32], interchain bonds formed by glutenin chains are easier to break than intrachain bonds in gliadins. Wang et al. [33] claims that glutenins are more sensitive to temperature than gliadins. As a result of temperatures above 60 °C, glutenin undergoes thermal denaturation, and inaccessible SH groups are exposed. At high temperatures, gliadins are capable of forming intermolecular SS bonds. Enriching these proteins with flavonoids and glycosides can lead to the formation of hydrogen bonds between gluten proteins and polyphenols, which are much weaker than disulfide bonds. The authors of Ref. [10] observed the formation of hydrogen bonds between quercetin and tyrosine present in the amino acid sequence of gluten proteins. At the same time, Girard & Awika [34] claimed that polyphenols, thanks to their antioxidant properties, can reduce disulfide bridges. Therefore, the tested compounds may not have had a significant impact on the thermal properties of glutenins. Even if the added polyphenols reduce a certain amount of SS bonds formed between or within the protein complex, their presence may not affect the thermal properties of glutenins due to their size and large number of H bonds. However, in the case of gliadins, which are smaller proteins, the presence of additional hydrogen bonds formed between the protein and the added polyphenol could influence the thermal properties of these proteins, increasing the degradation temperature. Li et al. [35] claimed that due to the spherical structure of gliadins, the hydrogen bonds built into the protein are difficult to break during heating, which results in a higher degradation temperature of gliadins. At the same time, the decrease in the gliadin degradation temperature, depending on the polyphenol concentration compared to the control, may be due to the primary reduction in disulfide bonds caused by polyphenols. Due to their properties, these compounds can reduce SS bonds in gliadins, which makes their structure weaker and easier to decompose.

4. Conclusions

The analysis of the TGA parameters of both gluten proteins (gliadin and glutenin) showed that they do not differ in weight loss, while gliadins show a higher degradation temperature. This difference can be related to the structure of the proteins examined, especially the type and number of disulfide bridges formed by these proteins. The addition of flavonoids/glycosides caused changes in the thermal parameters of gliadin. The presence of these compounds led to an increase in the weight loss. The weight loss values increase depending on the structure and size of the compound used. The greatest increase in weight loss was observed for quercetin, rutin, and naringenin, which are characterized by the smallest spatial size. Glutenin mass loss does not change in the presence of the tested polyphenols. On this basis, it was concluded that glutenins are responsible for the thermal stability of the gluten network.
The difference in TGA thermograms showed that quercetin can interact with gliadin through OH groups located in different positions, while rutin and hesperidin form chemical bonds with gliadin proteins through precisely defined OH groups due to the presence of the glycosidic part. Hesperetin and hesperidin can interact with gliadin through different OH groups. Naringin and hesperidin interact with gliadin in a similar way. Rutin and naringin can form chemical bonds with gliadin through the same OH group. Additionally, detailed analysis of the difference TGA thermograms shows that quercetin, rutin, and naringin interact with gliadins through the OH group located at the B ring in the 4’ position. Similar behavior of rutin, naringin and naringenin, and hesperidin was observed as a result of the analysis of the difference TGA thermograms of glutenin. Difference thermograms of quercetin-modified glutenins show that these flavonoids form chemical bonds with the polypeptide chains of glutenins. It was found that quercetin, due to its unbranched structure, can attach to the glutenin network and stabilize it.

Supplementary Materials

The following supporting information can be downloaded at: https://www.mdpi.com/article/10.3390/app15137303/s1. Figure S1: Structure of flavonoids and their glycosides: quercetin (QUE), rutin (RUTG), naringenin (NAR), naringin (NARG), hesperetin (HET), hesperidin (HEDG); Figure S2: Thermogravimetric profiles (left) and derivative thermogravimetric profiles (right) of gliadins (glia_control), gliadins modified by flavonoids and glycosides and pure flavonoids and their glycosides; Figure S3: Thermogravimetric profiles (left) and derivative thermogravimetric profiles (right) of glutenins (control), glutenins modified by flavonoids and glycosides and pure flavonoids and their glycosides; Figure S4: DSC thermograms of gliadins modified by flavonoids: (a) quercetin (QUE), (c) naringenin (NAR), (e) hesperetin (HET) and their glycosides: (b) rutin (RUTG), (d) naringin (NARG), (f) hesperidin (HEDG); Figure S5: DSC thermograms of glutenins modified by flavonoids: (a) quercetin (QUE), (c) naringenin (NAR), (e) hesperetin (HET) and their glycosides: (b) rutin (RUTG), (d) naringin (NARG), (f) hesperidin (HEDG).

Author Contributions

Conceptualization, M.K. and A.N.; methodology, M.K., A.Z.W., and A.N.; formal analysis, M.K.; investigation, M.K. and K.H.M.; writing—original draft preparation, M.K. and A.N.; writing—review and editing, A.Z.W. and A.N.; visualization, M.K.; supervision, A.N.; funding acquisition, M.K. All authors have read and agreed to the published version of the manuscript.

Funding

This research was funded by the NATIONAL SCIENCE CENTER, POLAND, grant number 2019/33/N/NZ9/02345.

Institutional Review Board Statement

Not applicable.

Informed Consent Statement

Not applicable.

Data Availability Statement

The raw data supporting the conclusions of this article will be made available by the authors on request.

Acknowledgments

Analyses were performed in the Centre of Synthesis and Analysis BioNanoTechno of the University of Bialystok. The equipment in the Centre was funded by the EU as part of the Operational Program Development of Eastern Poland 2007–2013, projects POPW.01.03.00-20-034/09-00 and POPW.01.03.00-20-004/11.

Conflicts of Interest

The authors declare no conflicts of interest.

References

  1. Urade, R.; Sato, N.; Sugiyama, M. Gliadins from wheat grain: An overview, from primary structure to nanostructures of aggregates. Biophys. Rev. 2017, 10, 435–443. [Google Scholar] [CrossRef] [PubMed]
  2. Panche, A.N.; Diwan, A.D.; Chandra, S.R. Flavonoids: An overview. J. Nutr. Sci. 2016, 5, e47. [Google Scholar] [CrossRef] [PubMed]
  3. Świeca, M.; Sęczyk, Ł.; Gawlik-Dziki, U.; Dziki, D. Bread enriched with quinoa leaves—The influence of protein–phenolics interactions on the nutritional and antioxidant quality. Food Chem. 2014, 162, 54–62. [Google Scholar] [CrossRef] [PubMed]
  4. Han, H.-M.; Koh, B.-K. Antioxidant activity of hard wheat flour, dough and bread prepared using various processes with the addition of different phenolic acids. J. Sci. Food Agric. 2010, 91, 604–608. [Google Scholar] [CrossRef]
  5. Khatkar, B.S.; Barak, S.; Mudgil, D. Effects of gliadin addition on the rheological, microscopic and thermal characteristics of wheat gluten. Int. J. Biol. Macromol. 2013, 53, 38–41. [Google Scholar] [CrossRef]
  6. Liu, X.; Xie, Y.; Li, C.; Xue, F. Comparative studies on physicochemical properties of gluten- and glutenin-based films functionalized by polyphenols. Cereal Chem. 2022, 99, 439–703. [Google Scholar] [CrossRef]
  7. Ma, S.; Han, W.; Li, L.; Zheng, X.; Wang, X. The thermal stability, structural changeability, and aggregability of the glutenin and gliadin proteins induced by wheat bran dietary fiber. Food Funct. 2018, 10, 172–179. [Google Scholar] [CrossRef]
  8. Nawrocka, A.; Szymańska-Chargot, M.; Miś, A.; Wilczewska, A.Z.; Markiewicz, K.H. Aggregation of gluten proteins in model dough after fibre polysaccharide addition. Food Chem. 2017, 231, 51–60. [Google Scholar] [CrossRef]
  9. Rumińska, W.; Markiewicz, K.H.; Wilczewska, A.Z.; Nawrocka, A. Effect of oil pomaces on thermal properties of model dough and gluten network studied by thermogravimetry and differential scanning calorimetry. Food Chem. 2021, 358, 129882. [Google Scholar] [CrossRef]
  10. Krekora, M.; Markiewicz, K.H.; Wilczewska, A.Z.; Nawrocka, A. Raman and thermal (TGA and DSC) studies of gluten proteins supplemented with flavonoids and their glycosides. J. Cereal Sci. 2023, 111, 103672. [Google Scholar] [CrossRef]
  11. Krekora, M.; Nawrocka, A. Interactions of gliadins with flavonoids and their glycosides studied with application of FT-Raman spectroscopy. J. Cereal Sci. 2024, 117, 103915. [Google Scholar] [CrossRef]
  12. Krekora, M.; Szymańska-Chargot, M.; Niewiadomski, Z.; Miś, A.; Nawrocka, A. Effect of cinnamic acid and its derivatives on structure of gluten proteins—A study on model dough with application of FT-Raman spectroscopy. Food Hydrocoll. 2020, 107, 105935. [Google Scholar] [CrossRef]
  13. Taddei, P.; Zanna, N.; Tozzi, S. Raman characterization of the interactions between gliadins and anthocyanins. J. Raman Spec. 2013, 44, 1435–1439. [Google Scholar] [CrossRef]
  14. Leon, A.; Rosell, C.M.; Benedito de Barber, C. A differential scanning calorimetry study of wheat proteins. Eur. Food Res. Technol. 2003, 217, 13–16. [Google Scholar] [CrossRef]
  15. Sharif, N.; Golmakani, M.-T.; Niakousari, M.; Hosseini, S.; Ghorani, B.; Lopez-Rubio, A. Active Food Packaging Coatings Based on Hybrid Electrospun Gliadin Nanofibers Containing Ferulic Acid/Hydroxypropyl-Beta-Cyclodextrin Inclusion Complexes. Nanomaterials 2018, 8, 919. [Google Scholar] [CrossRef]
  16. Qiu, C.; Sun, W.; Su, G.; Cui, C.; Zhao, M. Comparison of the conformational and nutritional changes of deamidated wheat gliadin by citric acid and hydrochloric acid. J. Cereal Sci. 2014, 60, 143–150. [Google Scholar] [CrossRef]
  17. Kłosok, K.; Welc, R.; Fornal, E.; Nawrocka, A. Effect of physical and chemical factors on the structure of gluten, gliadins and glutenins as studied with spectroscopic methods. Molecules 2021, 26, 508. [Google Scholar] [CrossRef]
  18. Wang, P.; Xu, L.; Nikoo, M.; Ocen, D.; Wu, F.; Yang, N.; Jin, Z.; Xu, X. Effect of frozen storage on the conformational, thermal and microscopic properties of gluten: Comparative studies on gluten-, glutenin- and gliadin-rich fractions. Food Hydrocoll. 2014, 35, 238–246. [Google Scholar] [CrossRef]
  19. Nawrocka, A.; Szymańska-Chargot, M.; Mis, A.; Wilczewska, A.Z.; Markiewicz, K.H. Dietary fibre-induced changes in the structure and thermal properties of gluten proteins studied by Fourier transform—Raman spectroscopy and thermogravimetry. J. Agric. Food Chem. 2016, 64, 2094–2104. [Google Scholar] [CrossRef]
  20. Nawrocka, A.; Szymańska-Chargot, M.; Miś, A.; Wilczewska, A.Z.; Markiewicz, K.H. Effect of dietary fibre polysaccharides on structure and thermal properties of gluten proteins—A study on gluten dough with application of FT-Raman spectroscopy, TGA and DSC. Food Hydrocoll. 2017, 69, 410–421. [Google Scholar] [CrossRef]
  21. Welc, R.; Luchowski, R.; Kłosok, K.; Gruszecki, W.I.; Nawrocka, A. How do phenolic acids change the secondary and tertiary structure of gliadin? Studies with an application of spectroscopic techniques. Int. J. Mol. Sci. 2022, 23, 6053. [Google Scholar] [CrossRef] [PubMed]
  22. Teng, J.; Liu, X.; Hu, X.; Zhao, Y.; Tao, N.-P.; Wang, M. Dihydromyricetin as a Functional Additive to Enhance Antioxidant Capacity and Inhibit the Formation of Thermally Induced Food Toxicants in a Cookie Model. Molecules 2018, 23, 2184. [Google Scholar] [CrossRef] [PubMed]
  23. Fan, H.; Yao, X.; Chen, Z.; Ma, R.; Wen, Y.; Li, H.; Wang, J.; Bao, S. Interaction of high amylose corn starch with polyphenols: Modulating the stability of polyphenols with different structure against thermal processing. Food Chem. 2023, 437, 137708. [Google Scholar] [CrossRef] [PubMed]
  24. Bedrníček, J.; Jirotková, D.; Kadlec, J.; Laknerová, I.; Vrchotová, N.; Tříska, J.; Samková, E.; Smetana, P. Thermal stability and bioavailability of bioactive compounds after baking of bread enriched with different onion by-products. Food Chem. 2020, 319, 126562. [Google Scholar] [CrossRef]
  25. Blecker, C.; Chevalier, J.P.; Fougnies, C.; Van Herck, J.C.; Deroanne, C.; Paquot, M. Characterisation of different inulin samples by DSC: Influence of polymerisation degree on melting temperature. J. Therm. Anal. Calorim. 2003, 71, 215–224. [Google Scholar] [CrossRef]
  26. Tsioptsias, C.; Tsivintzelis, I. On the thermodynamic thermal properties of quercetin and similar pharmaceuticals. Molecules 2022, 27, 6630. [Google Scholar] [CrossRef]
  27. Wiesser, H.; Koehler, P.; Scherf, K.A. Chemistry of wheat gluten proteins: Qualitative composition. Cereal Chem. 2022, 100, 23–35. [Google Scholar] [CrossRef]
  28. Ma, W.; Yu, Z.; She, M.; Zhao, Y.; Islam, S. Wheat gluten protein and its impacts on wheat processing quality. Front. Agric. Sci. Eng. 2019, 6, 279–287. [Google Scholar] [CrossRef]
  29. Waga, J. Structure and allergenicity of wheat gluten proteins—A review. Pol. J. Food Nutr. Sci. 2004, 13/54, 327–338. [Google Scholar]
  30. Kieffer, R.; Schurer, F.; Köhler, P.; Wieser, H. Effect of hydrostatic pressure and temperature on the chemical and functional properties of wheat gluten: Studies on gluten, gliadin and glutenin. J. Cereal Sci. 2007, 45, 285–292. [Google Scholar] [CrossRef]
  31. Müller, S.; Wieser, H. The location of disulphide bonds in monomeric γ-type gliadins. J. Cereal Sci. 1997, 26, 169–176. [Google Scholar] [CrossRef]
  32. Lagrain, B.; Thewissen, B.G.; Brijs, K.; Delcour, J.A. Mechanism of gliadin–glutenin cross-linking during hydrothermal treatment. Food Chem. 2008, 107, 753–760. [Google Scholar] [CrossRef]
  33. Wang, Z.; Ma, S.; Sun, B.; Wang, F.; Huang, J.; Wang, X.; Bao, Q. Effects of thermal properties and behavior of wheat starch and gluten on their interaction: A review. Int. J. Biol. Macromol. 2021, 177, 474–484. [Google Scholar] [CrossRef] [PubMed]
  34. Girard, A.L.; Awika, J.M. Effects of edible plant polyphenols on gluten protein functionality and potential applications of polyphenol–gluten interactions. Compr. Rev. Food Sci. Food Saf. 2020, 9, 2164–2199. [Google Scholar] [CrossRef]
  35. Li, M.; Yue, Q.; Liu, C.; Zheng, X.; Hong, J.; Li, L.; Bian, K. Effect of gliadin/glutenin ratio on pasting, thermal, and structural properties of wheat starch. J. Cereal Sci. 2020, 93, 102973. [Google Scholar] [CrossRef]
Figure 1. Difference TGA thermograms calculated by subtraction of the gliadin thermogram from thermogram of gliadin–polyphenol: (a) quercetin (QUE), (b) rutin (RUTG), (c) naringin (NAR), (d) naringenin (NARG), (e) hesperitin (HET), and (f) hesperidin (HEDG).
Applsci 15 07303 g001aApplsci 15 07303 g001b
Figure 2. Difference TGA thermograms calculated by subtraction of the glutenin thermogram from thermogram of glutenin–polyphenol: (a) quercetin (QUE), (b) rutin (RUTG), (c) naringin (NAR), (d) naringenin (NARG), (e) hesperitin (HET), and (f) hesperidin (HEDG).
Applsci 15 07303 g002
Table 1. TGA parameters (weight loss at 600 °C and degradation temperature (Td)) for unmodified gliadins/glutenins (glia_control/glu_control) and gliadins/glutenins modified by flavonoids and their glycosides: quercetin (glia_QUE/glu_QUE), naringenin (glia_NAR/glu_NAR), hesperetin (glia_HET/glu_HET), rutin (glia_RUTG/glu_RUTG), naringin (glia_NARG/glu_NARG), and hesperidin (glia_HEDG/glu_HEDG).
PolyphenolPolyphenol ContentWeight Loss (%)Td1 (°C)Td2 (°C)Td3 (°C)PolyphenolPolyphenol ContentWeight Loss (%)Td1 (°C)Td2 (°C)Td3 (°C)
glia_control068.7 (2.4) de69 (1) b310 (3) c glu_control070.8 (2.1) d72 (2) b301 (3) d
glia_QUE0.0579.3 (1.6) i76 (1) c310 (2) c glu_QUE0.0575.6 (2.8) d69 (3) c301 (1) d
0.172.4 (1.1) efg69 (1) b319 (2) d 0.172.5 (2.1) d76 (3) b301 (3) d
0.275.4 (1.9) fghi67 (2) b319 (1) d 0.273.9 (2.4) d59 (1) b301 (4) d
10048.5 (2.5) a 336 (3) e 10048.5 (2.2) a 336 (3) f
glia_RUTG0.0577.4 (1.5) hi67 (2) b310 (1) c glu_RUTG0.0573.1 (1.5) d75 (2) b301 (3) d
0.177.3 (1.8) hi59 (2) a310 (3) c 0.172.2 (3.2) d75 (2) a301 (2) d
0.277.3 (1.4) hi66 (2) b318 (1) d 0.274.4 (2.2) d68 (2) b301 (2) d
10061.5 (2.1) bc128 (2) f275 (2) a427 (2) c 10061.5 (2.8) bc128 (3) f275 (2) a427 (3) a
glia_NAR0.0577.0 (2.0) hi74 (2) c318 (1) d glu_NAR0.0572.9 (2.8) d68 (3) c301 (3) d
0.172.2 (1.9) ef66 (2) b318 (3) d 0.174.3 (1.0) d72 (2) b301 (2) d
0.274.5 (1.8) fgh74 (1) c318 (3) d 0.273.2 (2.5) d76 (3) c301 (4) d
10057.2 (1.9) b 318 (3) d 10057.2 (2.7) b 318 (4) e
glia_NARG0.0573.8 (2.2) fgh59 (2) a318 (2) d glu_NARG0.0573.1 (3.1) d61 (3) a301 (3) d
0.174.4 (1.3) fgh59 (1) a320 (2) d 0.171.5 (2.9) d75 (3) a319 (3) e
0.275.4 (1.7) fghi59 (2) a318 (2) d 0.272.6 (1.6) d71 (3) a293 (4) c
10064.4 (1.8) cd93 (2) d284 (3) b375 (2) b 10064.4 (2.5) c93 (2) d284 (2) b375 (2) b
glia_HET0.0575.4 (1.9) fghi76 (2) c319 (3) d glu_HET0.0573.7 (2.8) d72 (2) c301 (4) d
0.174.6 (1.1) fgh66 (3) b319 (2) d 0.173.9 (3.2) d71 (2) b301 (4) d
0.274.4 (2.4) fgh75 (1) c319 (1) d 0.272.7 (1.2) d59 (3) c301 (3) d
10061.7 (2.5) bc 371 (2) f 10061.7 (2.3) bc 371 (3) g
glia_HEDG0.0572.3 (1.8) efg69 (2) b319 (3) d glu_HEDG0.0572.4 (2.9) d67 (1) b301 (3) d
0.176.8 (2.1) ghi69 (1) b319 (3) d 0.171.4 (3.0) d72 (1) b301 (2) d
0.271.4 (2.1) ef69 (1) b319 (1) d 0.273.7 (2.5) d76 (2) b301 (3) d
10064.1 (2.4) c101 (1) e284 (2) b354 (3) a 10064.1 (1.0) c101 (1) e284 (2) b354 (3) a
Values in the same column followed by different superscript letters are significantly different from each other (α = 0.05).
Table 2. DSC parameters (enthalpy (ΔH) and denaturation peak temperature (T)) for unmodified gliadins/glutenins (glia_control/glu_control) and gliadins and glutenins modified by flavonoids and their glycosides: quercetin (glia_QUE/glu_QUE), naringenin (glia_NAR/glu_NAR), hesperetin (glia_HET/glu_HET), rutin (glia_RUTG/glu_RUTG), naringin (glia_NARG/glu_NARG), and hesperidin (glia_HEDG/glu_HEDG).
PolyphenolT1 (°C)ΔH1 (J·g−1)T2 (°C)ΔH2 (J·g−1)T3 (°C)ΔH3 (J·g−1)T4 (°C)ΔH4 (J·g−1)T5 (°C)ΔH5 (J·g−1)
glia_control76 (2) bcd−179 (2) f 308 (2) fg−263 (2) e
glia_QUE80 (2) def−180 (2) ef 267 (3) b136 (2) g324 (1) l44 (2) l
81 (1) ef−196 (2) c 262 (2) b89 (1) f320 (2) jkl60 (1) m
76 (2) bcd−190 (3) d 249 (3) e41 (2) e308 (1) fg55 (2) ł
105 (2) g−21 (2) j 322 (2) kl−154 (2) i347 (1) b68 (2) a
glia_RUTG81 (2) ef−215 (2) a 305 (3) ef−240 (2) g
81 (2) ef−203 (2) b 305 (1) ef−272 (2) d
80 (2) def−181 (2) ef 312 (3) ghi−267 (2) e
155 (2) a−104 (2) a220 (3) c−26 (1) d301 (3) de9 (2) j
glia_NAR80 (3) def−203 (3) b 308 (2) fg−286 (1) c
75 (1) bc−170 (1) g 312 (3) ghi−266 (1) e
73 (2) b−191 (2) d 284 (1) a−252 (0) f
255 (1) a−172 (2) a316 (3) hij204 (2) n
glia_NARG73 (2) b−180 (1) ef 292 (3) b−248 (2) f
74 (2) bc−177 (2) f 311 (2) gh−291 (2) b
66 (2) a−141 (1) h 291 (2) b−219 (1) h
102 (2) g−108 (2) i165 (2) b−13 (1) c 283 (3) a28 (2) k
glia_HET80 (2) def−180 (1) ef 298 (2) cd−338 (2) a
82 (1) ef−180 (2) ef 312 (2) ghi344 (2) o
78 (2) cde−193 (2) cd 298 (2) cd537 (2) p
230 (2) d−161 (2) b 342 (3) a112 (1) b
glia_HEDG83 (2) f−203 (2) b 312 (2) ghi−264 (2) e
72 (2) b−184 (2) e 317 (2) ijk−291 (1) b
83 (2) f−177 (2) f 294 (2) bc−291 (1) b
197 (1) c−101 (2) b257 (3) a−122 (2) c283 (3) a51 (2) ł
glu_control91 (2) e−190 (2) d 302 (3) bc29 (2) efg
glu_QUE92 (1) ef−152 (1) hi 303 (2) c48 (2) l
96 (2) fg−145 (2) j 303 (2) c35 (2) ij
90 (1) de−128 (3) k 301 (2) bc31 (2) fgh
105 (2) i−21 (2) n 321 (2) d−154 (2) a347 (4) b69 (3) a
glu_RUTG90 (1) de−178 (1) f 300 (2) bc34 (1) hij
85 (2) bc−150 (1) i 300 (3) bc29 (2) efg
83 (2) abc−160 (2) g 301 (1) bc85 (2) m
157 (2) a−104 (2) a220 (2) b−26 (1) d301 (2) bc9 (2) b
glu_NAR86 (2) cd−219 (2) b 296 (1) b117 (2) b
90 (2) de−202 (2) c 302 (3) bc55 (2) ł
99 (2) gh−159 (2) g 301 (3) bc32 (1) ghi
255 (1) a−173 (2) a318 (3) d205 (2) n
glu_NARG93 (2) ef−156 (2) gh 300 (3) bc40 (2) k
81 (2) ab−236 (2) a 300 (3) bc18 (2) cd
91 (1) e−151 (1) i 300 (2) bc37 (1) jk
102 (3) hi−108 (2) i165 (2) b−13 (2) b 283 (3) a28 (1) ef
glu_HET91 (1) e−183 (3) e 301 (2) bc35 (3) ij
92 (1) ef−114 (2) l 301 (3) bc33 (1) hi
92 (2) ef−112 (2) 300 (4) bc32 (2) ghi
232 (3) c−161 (2) b 341 (2) a109 (3) b
glu_HEDG85 (2) bc−216 (2) b 301 (3) bc15 (1) c
90 (2) de−94 (2) m 301 (2) bc27 (1) e
80 (2) a−233 (2) a 300 (3) bc20 (1) d
197 (3) c−101 (2) a257 (2) a−122 (2) c280 (3) a51 (2) l
Values in the same column followed by different superscript letters are significantly different from each other (α = 0.05).
Disclaimer/Publisher’s Note: The statements, opinions and data contained in all publications are solely those of the individual author(s) and contributor(s) and not of MDPI and/or the editor(s). MDPI and/or the editor(s) disclaim responsibility for any injury to people or property resulting from any ideas, methods, instructions or products referred to in the content.

