1. Introduction
Poultry meat contains significantly less fat, cholesterol, and protein than meat from other slaughtered animals. In addition, it is characterized by its versatility in culinary use, which has contributed to the increase in its consumption. Poultry products must meet food safety criteria. A constant threat to poultry meat is its contamination with the genera
Salmonella and
Campylobacter pathogenic bacteria. Given this, a system has been developed to monitor the safety of poultry products at the various stages of their formation and processing (from breeding to final products) and by all participants in these processes [
1,
2].
Modified atmosphere packaging (MAP) with elevated CO
2 levels (20–62% CO
2, balanced with N
2 and low or no O
2) has been shown to substantially extend the shelf life of poultry meat—including ground, raw, and precooked chicken—while preserving color and texture and controlling microbial populations such as
Pseudomonas, coliforms, and mesophilic bacteria. For example, CO
2 concentrations of 40% in MAP packaging of chicken fillets effectively doubled shelf life at refrigeration temperatures by inhibiting the growth of spoilage bacteria without promoting pathogens. In precooked chicken fillets, MAP formulations with 40–60% CO
2 extended shelf life from ~5 days (air-packaged) to at least 35–65 days under refrigerated storage, demonstrating significant shelf life improvements [
3,
4,
5].
The hygiene of the process or technological irregularities, and also the risks to consumer safety, necessitate the examination of the level of microbiological contamination of raw materials and final products. Microbiological analysis of raw material or product includes determining the presence of pathogenic microorganisms that cause food poisoning and determining the number of non-pathogenic microorganisms that may be responsible for the deterioration of taste and odor characteristics, resulting in product spoilage. However, traditional methods are time-consuming and costly [
6].
As a result, new methods are being explored to enable microbiological diagnostics in a much shorter time and with lower costs. A good solution being researched may be methods based on the relationship between the metabolism of microorganisms and the energy they produce. The metabolism of any living organism, including microorganisms, constantly transforms matter and energy, i.e., the processing of nutrients necessary for cell growth and proliferation. Metabolism involves two opposing processes, anabolism and catabolism, but due to the possibility of measuring the energy emitted as a result of a microorganism’s activity, catabolic transformations are of greater importance [
7,
8,
9]. However, most energy released during catabolic transformations goes as heat. During both aerobic respiration and fermentation processes, about 1/4–1/3 of the energy is lost through dissipation. The dissipated heat is emitted in relatively small portions, so it does not significantly increase the environment’s temperature. However, significant local temperature increases are observed when bacterial growth occurs in insulated environments, where heat loss is negligible due to weak convection and impeded radiation. In this case, temperature measurement followed by determination of the amount of energy released becomes a viable tool for detecting and quantifying the number of microorganisms [
10]. Through thermal imaging with devices such as thermal cameras, it is possible to record the infrared spectrum, which is invisible to the human eye, and to measure and compare the thermal energy values emitted by the objects under study [
11].
Modern microbial detection methods have significantly enhanced diagnostic speed and sensitivity through innovative technologies. Techniques such as electrochemical biosensors, SERS-based Raman spectroscopy with machine learning, molecularly imprinted polymers, MALDI-TOF MS, and microfluidic PCR platforms enable rapid, specific, and often cultivation-free identification of pathogens. These approaches are increasingly applied in clinical, environmental, and food safety settings, representing a shift toward real-time, point-of-care microbiological diagnostics [
12,
13,
14,
15,
16].
As a rapid microbial detection technique, thermography could overcome the limitations of conventional methods for assessing the microbiological quality of food [
17]. First and foremost, it is a non-destructive method that can be used to test samples in a non-invasive, non-contact manner, reducing the risk of food contamination and offering the possibility of immediate temperature measurement. The method comprises short processing times to obtain thermal images, no harmful radiation during measurements, ease of use, and low-complexity instrumentation. Unlike other methods, thermal imaging allows simultaneous monitoring of a large area (many samples) and temperature changes during real-time measurement [
18].
The infrared spectroscopy method requires tiny amounts of sample. A few milligrams are often sufficient for a single measurement. It is non-invasive, meaning it does not destroy the sample. It does not require specialized sample preparation; the sample only needs to be mixed with a carrier made of potassium bromide, forming a pallet. It is rapid. The entire measurement takes, at most, 5 min. It does not require specific chemical reagents, hence it is environmentally friendly. It can be used both where the final product inspection is performed (inline) and on a mobile production line, i.e., inflow (online). The results obtained are accurate and reproducible [
19,
20,
21].
This study aimed to develop a method for monitoring the microbiological quality of raw poultry meat (chicken fillets) in real-time using a thermal imaging camera with an uncooled microbolometer detector and Fourier-transformed infrared spectroscopy (FT-IR). This study assumed that the effect of the development of contaminating microflora would be not only an increase in temperature but also changes in the sample’s emissivity related to the secretion of metabolites and the consumption of nutrients from the tested material.
2. Materials and Methods
The study materials consisted of fresh chicken breasts cut under sterile conditions into 2 cm thick slices, which were then packed in 5 g portions in a protective atmosphere (MAP) and stored in a refrigerator at 4 °C ± 2 °C for 10 days. The sampling plan is presented in
Table 1. Each measurement was carried out in three technological replicates.
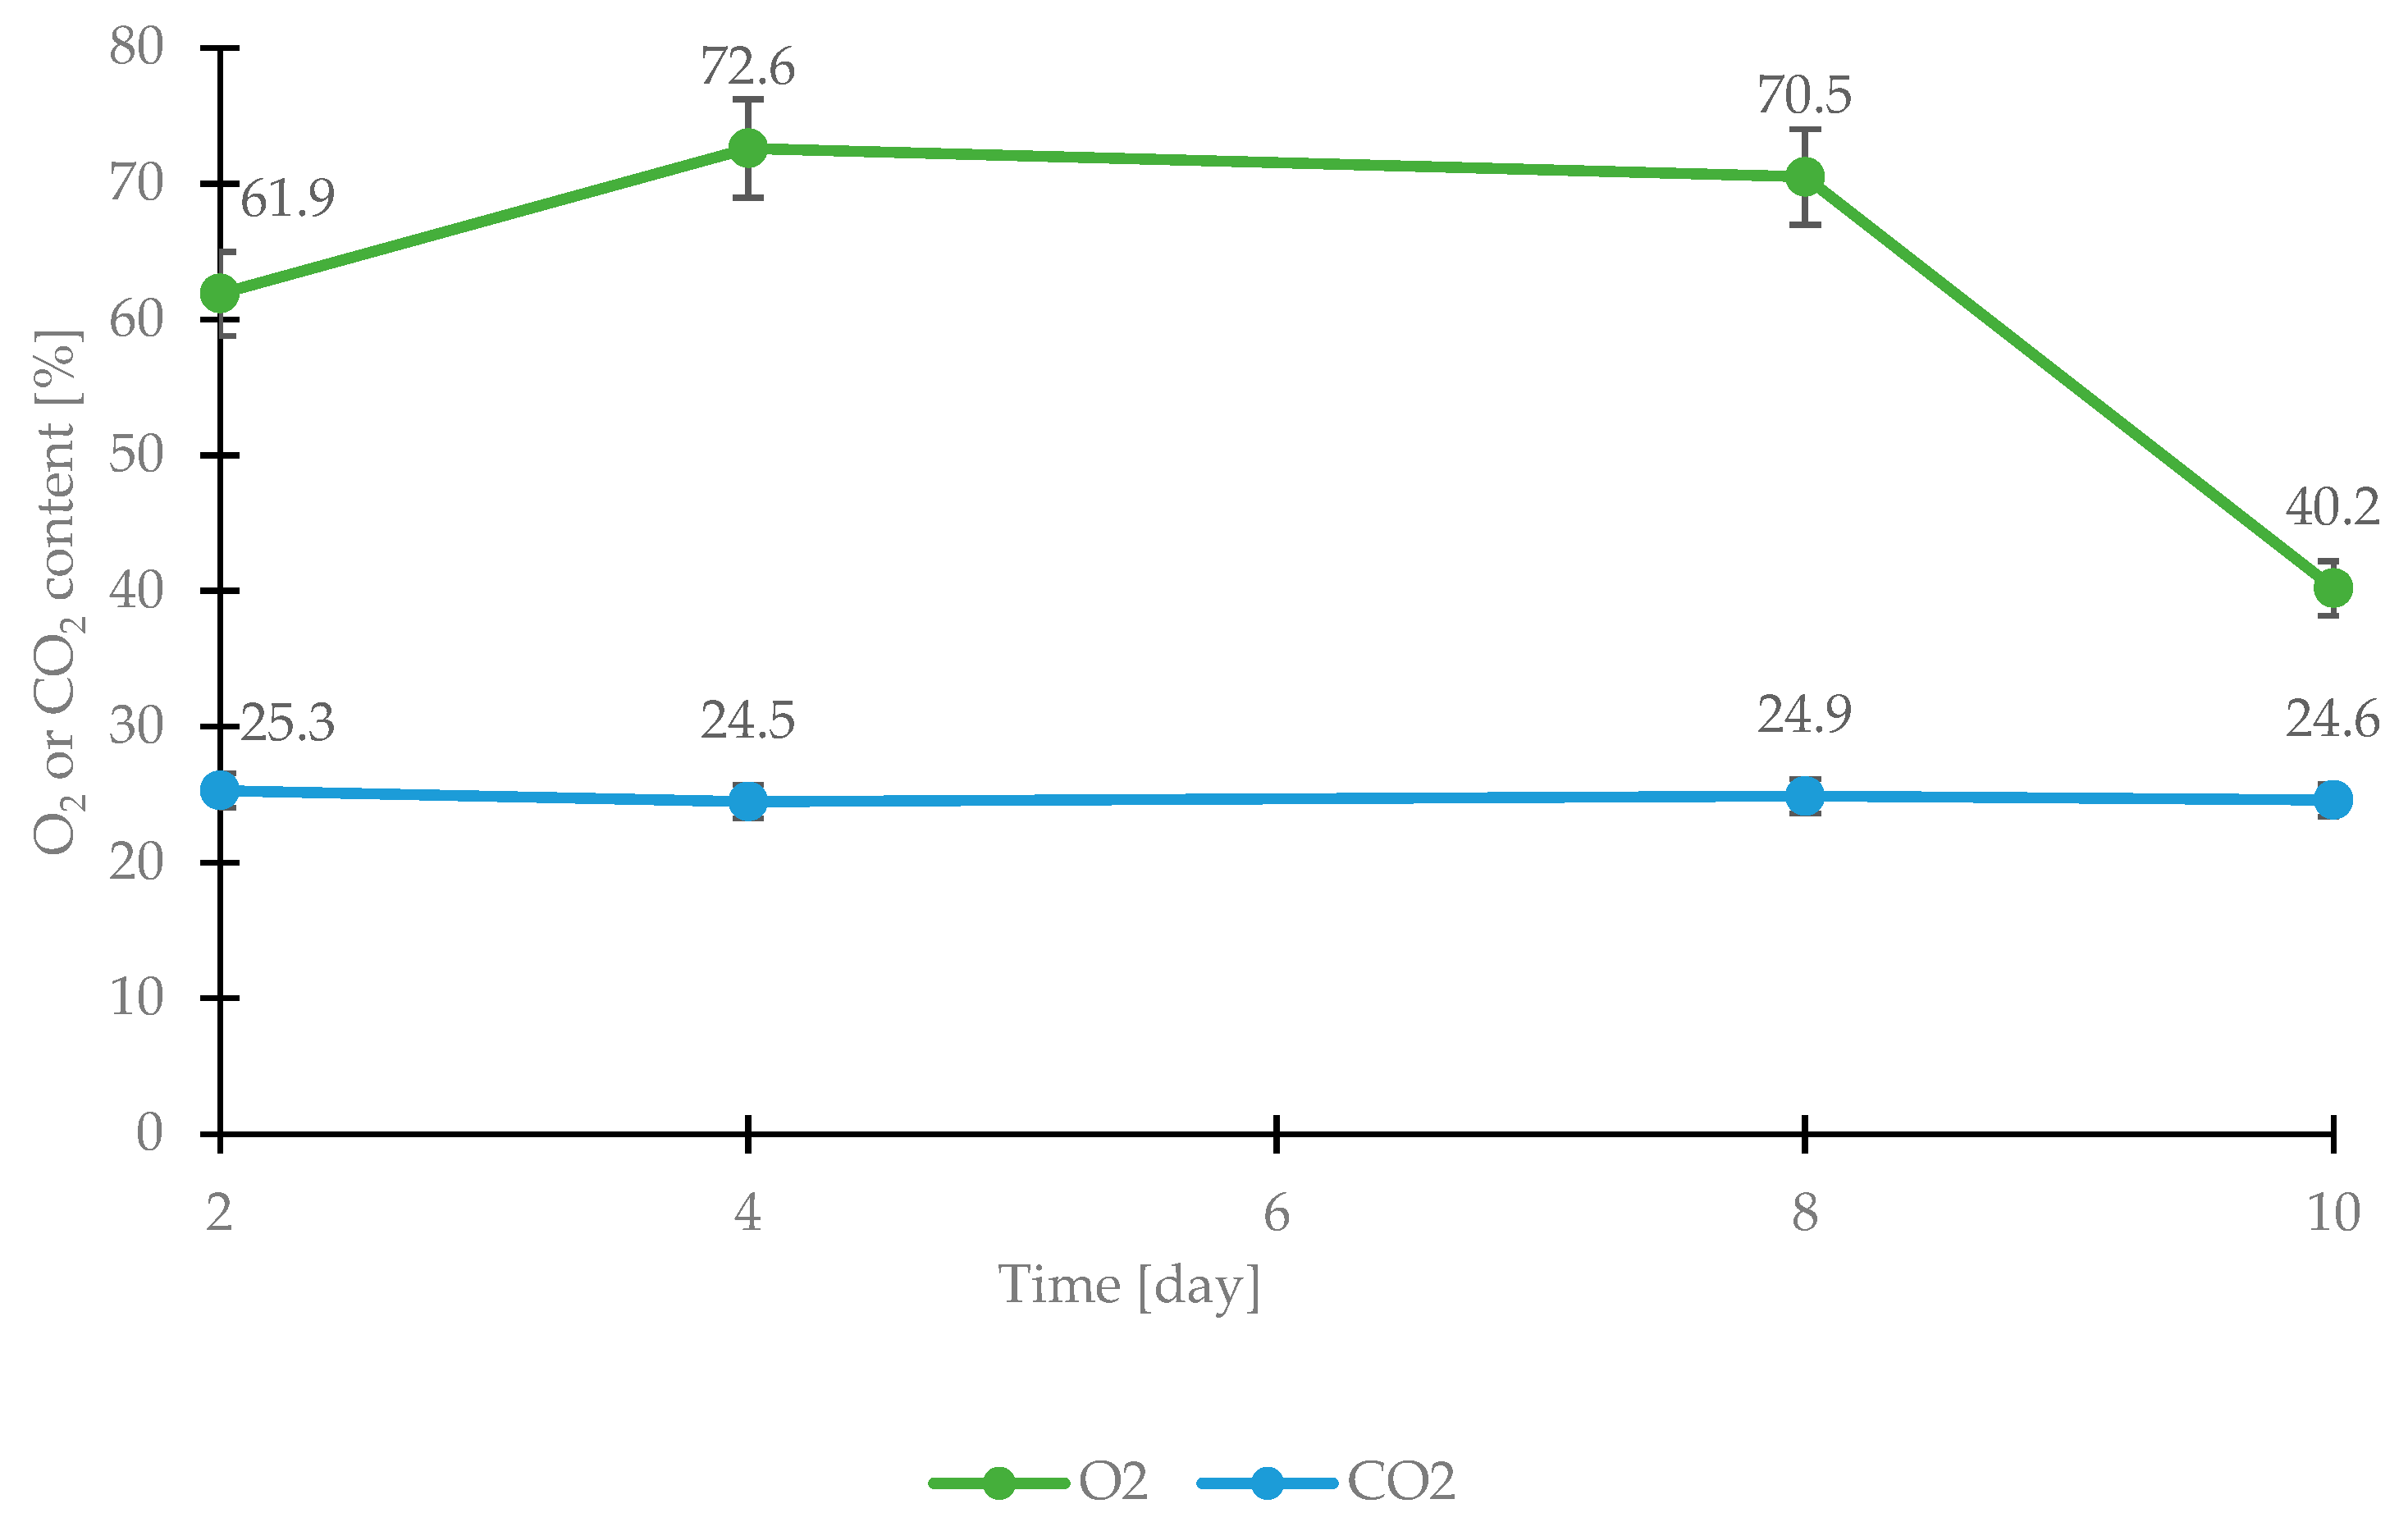
The atmosphere’s composition was 61.9% O2, 25.3% CO2, and 12.8 N2. At 48 h intervals, the gas content of the package was analyzed using a Dansensor CheckMate 3 (Tendring Pacific, Cambridge, UK). Due to the irregular shapes of these carcass fragments, the tests were conducted in three series, with three repetitions for each series.
2.1. Preparation of Poultry Meat Samples for Testing
Temperature measurements were taken on days 2, 4, 8, and 10 of storage using a VIGOcam v50 thermal imaging camera (VIGO System S.A., Ożarów Mazowiecki, Poland). The thermal imaging camera was calibrated using the method recommended by the device supplier. Validation was performed using blackbody references with known temperatures.
For thermal imaging, whole poultry meat portions (5 g, composed of 2 cm slices) were sterilely taken from the package and placed in sterile Petri dishes.
The temperature distribution was recorded using the active thermography method. The tested samples were placed for 15 min at a temperature of 20 °C ± 1 °C, and after that time, measurements were immediately taken with a thermal imaging camera for 6 min every 20 s. The device was placed on a tripod at a height of 30 cm above the surface of the tested sample. Emissivity was set to 0.96, and the image sharpness was adjusted manually by setting the lens. To eliminate interference caused by a non-uniform background, the samples were placed under the camera on a white sheet of paper. The studies included many measurement points on the surface of poultry meat, obtaining 80 results for each sample (which was intended to reduce the error of determination resulting from the natural variability of the sample).
The results are presented in the form of thermograms illustrating the temperature of the tested chicken breast sample. The obtained images were analyzed using Therm 2.29.3 software (Windows & Daylighting Berkeley LAB, Berkeley, CA, USA). The ambient temperature and humidity level during the measurements were 23 °C ± 0.1 °C and 27% ± 0.1%, respectively.
In parallel, microbiological analysis of poultry meat was carried out. The total number of microorganisms was determined on the PCA medium (Biomaxima, Lublin, Poland). In contrast, the number of Enterobacteriaceae family bacteria was determined on the VRBG medium (Biomaxima, Poland) to indicate contamination carrying the risk of dangerous pathogens. Plates with PCA medium were incubated at 30 °C for 72 h and with VRBG medium at 37 °C for 24 h. After 24 or 72 h of culture (depending on the medium), colony-forming units were counted using a ProtoCol-3 counter (Synbiosis, Bentonville, AR, USA). Interpretation of the results was carried out by ISO 4833-1:2013.
Poultry meat samples were also analyzed by FT-IR using a Perkin Elmer System 2000 spectrometer (Perkin Elmer, Inc., Shelton, CT, USA) operated by the GRAMS Research computer program. The device self-calibrates each time it is turned on using the built-in laser. After recording the background spectrum, the spectra of the actual samples were recorded in the spectral range of 4000–400 cm−1, with a resolution of 4 cm−1. Ten scans were taken for each pallet prepared for measurement. The pallets were prepared by mixing the sample with the KBr (potassium bromide) matrix at an approximate weight ratio of 1:300 and grinding into a fine powder in a laboratory mill. Spectra were recorded in transmittance mode. Analysis of the spectral data was carried out in T.Q. Analyst 8.0 software. Discriminant analysis was performed with the validation (leave-one-out) procedure.
2.2. Statistical Analysis
To test whether there were significant differences in the mean temperatures read from the thermographs corresponding to poultry meat samples from consecutive days of storage, a one-way analysis of variance (ANOVA) was performed using Tukey’s test in the STATISTICA 13.3 statistical program with an assumed significance level of α ≤ 0.05. Spectral data obtained by the FT-IR method were subjected to interpretation using the T.Q. Analyst 8 program. Discriminant analysis was used to distinguish samples stored at different times to indicate chemical changes caused by the formation, disappearance, or change in the structure of various chemical compounds in the poultry meat samples due to the increasing number and activities of microorganisms.
3. Results and Discussion
The reference sample (considered a control) concerning thermal imaging methods resulted from a study of microbiological quality using classical culture methods. Since this was a preliminary study on determining the suitability of thermal imaging camera and Fourier-transform infrared spectroscopy (FT-IR) for rapid (real-time) microbiological quality control of raw poultry meat (chicken fillet), tests on the presence of pathogenic microorganisms,
Salmonella spp., and
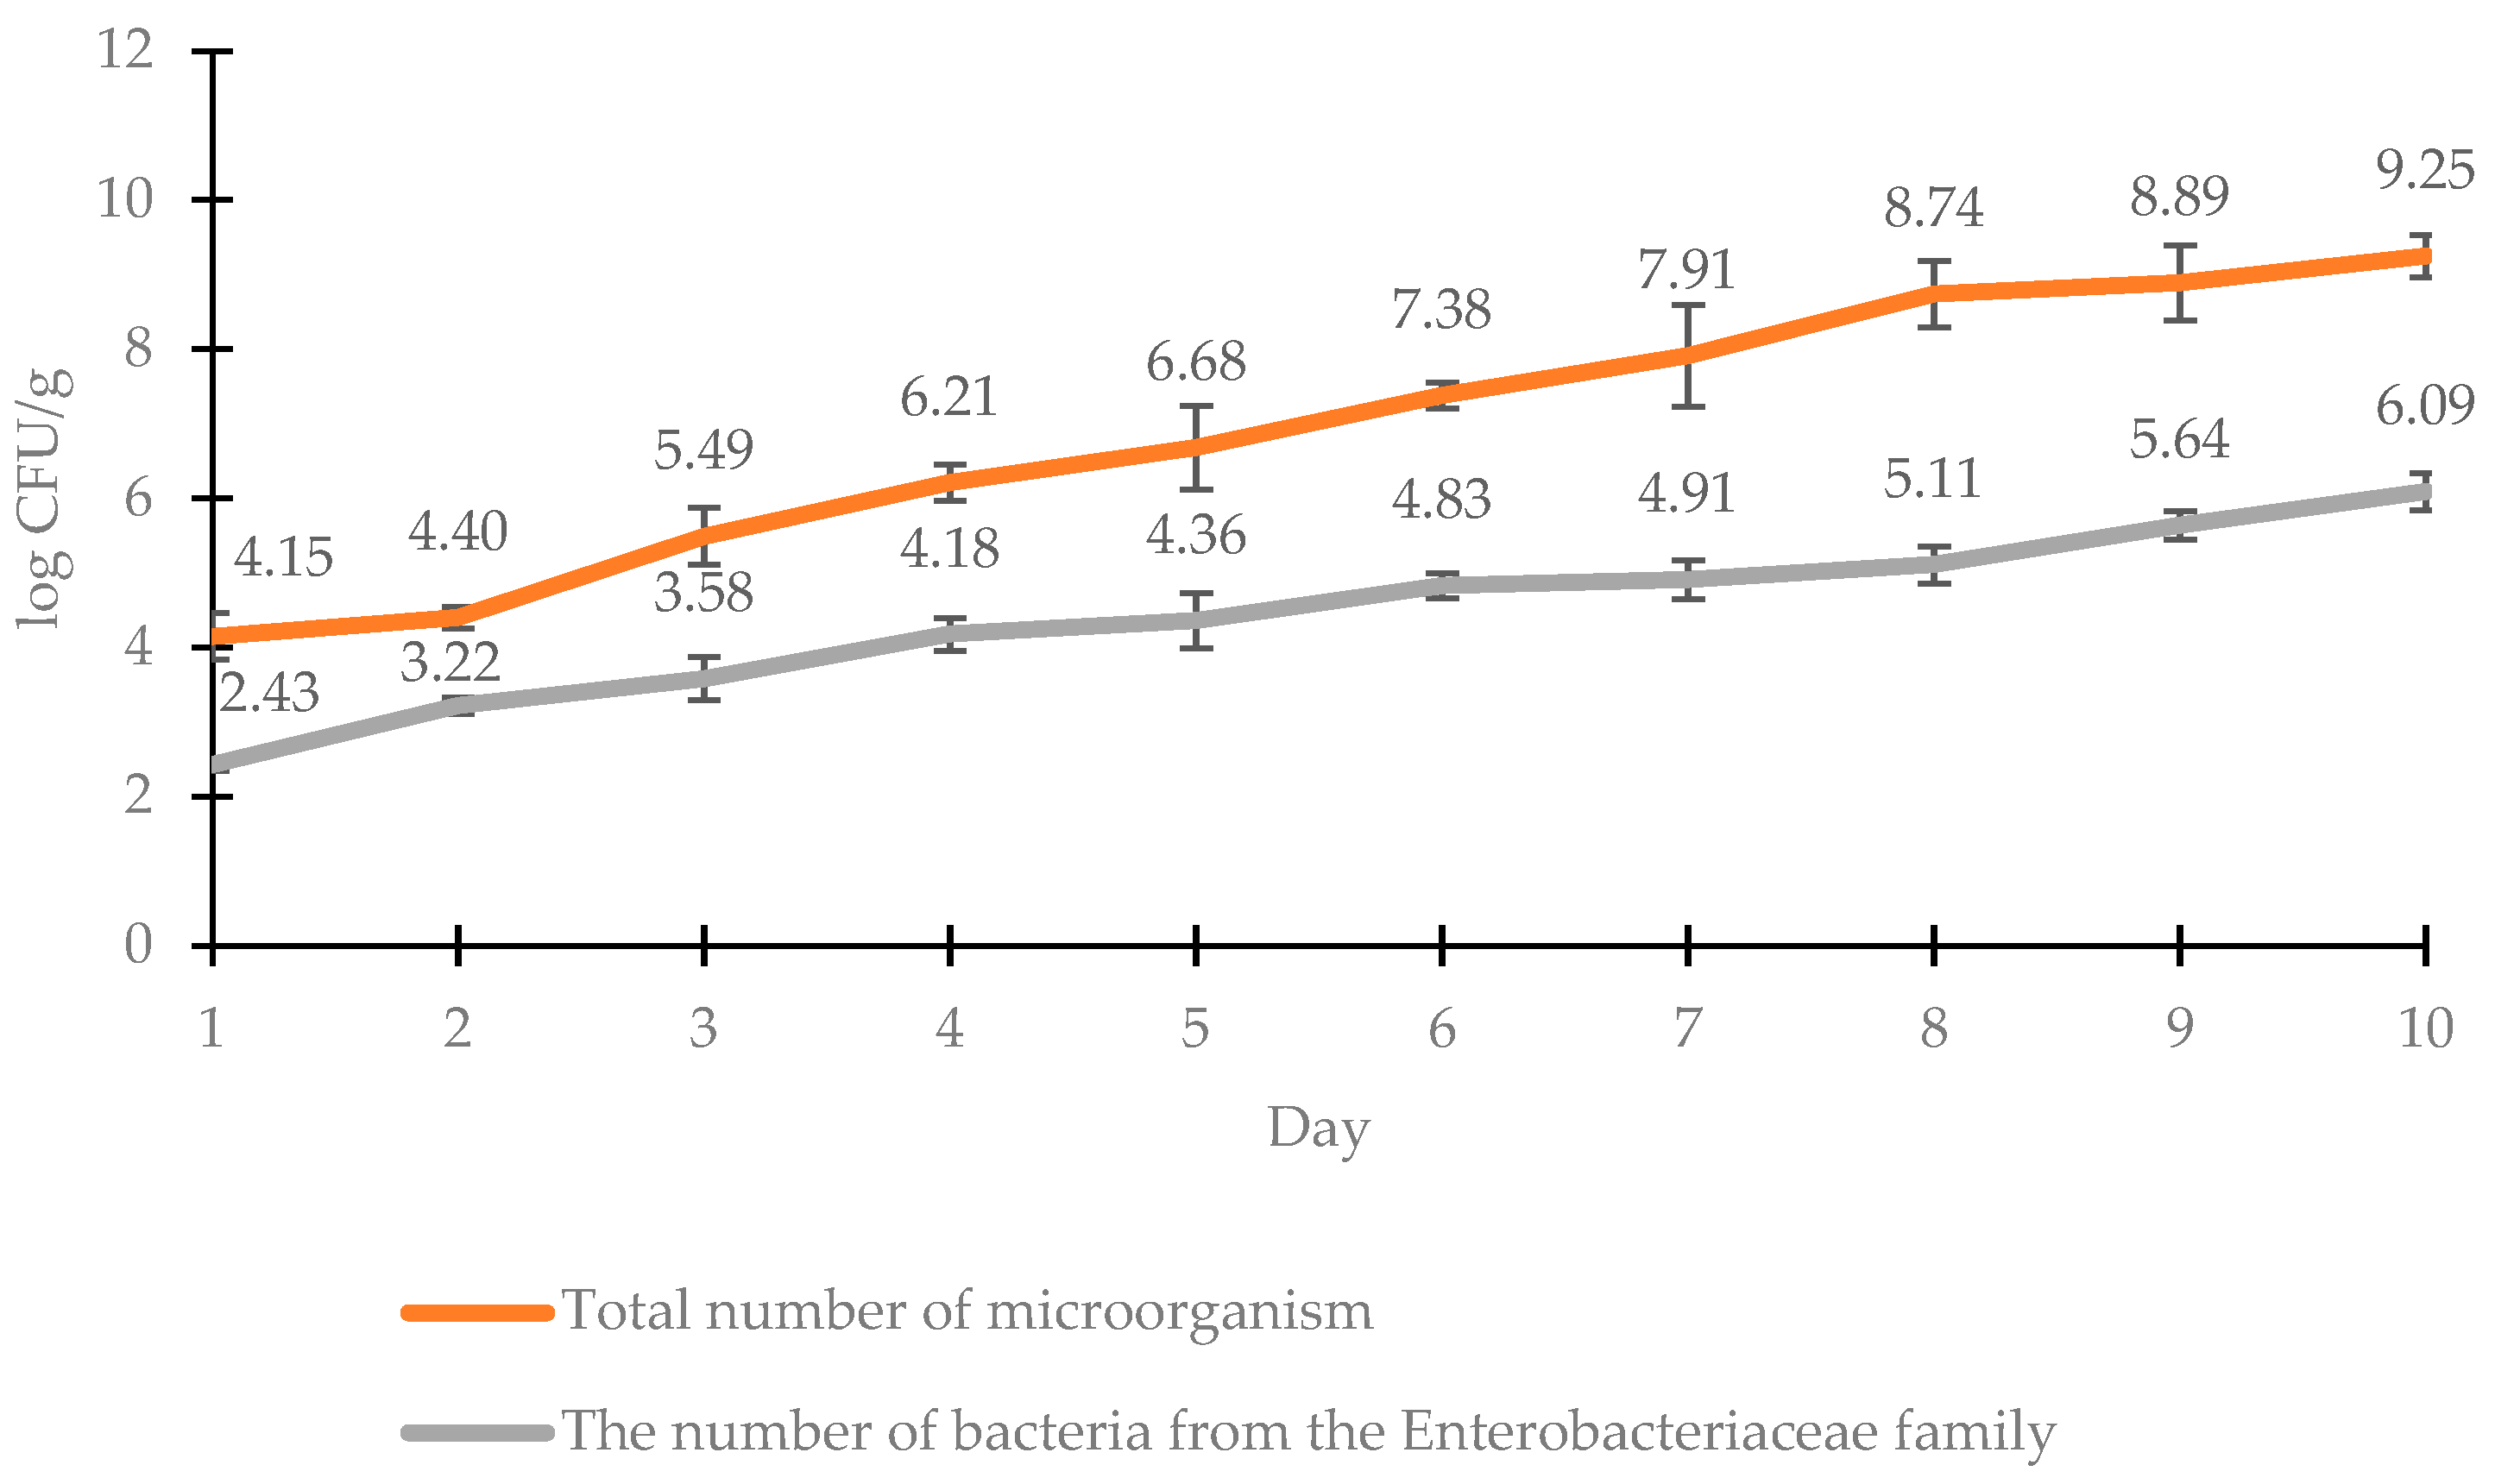
Listeria monocytogenes were not performed. Analyzing the results of the total microbial count for chicken breast meat samples, it was found that the log of the cell count on the first day of storage was 4.15 CFU/g (
Figure 1). This value was an acceptable level of microbial contamination; according to Commission Regulation (E.C.) no. 1441/2007 of 5 December 2007 on microbiological criteria for foodstuffs, the log of the total number of microorganisms should not exceed 6.70 CFU/g. It should also be noted that raw chicken fillets are characterized by initial contamination, which can be reduced by preliminary heat treatment. In subsequent days of storage, the number of microorganisms slowly increased, but on the fourth day, it was 6.21 log CFU/g, so it was within the established standard. A much higher microbial count of 7.38 log CFU/g was observed on day 6 and did not meet the recommended criteria. This indicates that it had spoiled and was not suitable for use. The number of
Enterobacteriaceae bacteria increased slowly during the 6 days of storage (
Figure 1). In the first three days, it did not exceed the permissible value of 4 log CFU/g for
E. coli, while from the 4th to the 6th day, it ranged from 4.18 to 4.83 log CFU/g and thus did not meet the criterion.
Modified atmosphere packaging involves replacing atmospheric air with a gas or mixture of gases, mainly carbon dioxide and nitrogen. By lowering the concentration of oxygen while increasing the concentration of carbon dioxide, the effect of food spoilage agents can be reduced [
22].
Figure 2 shows the changes in the content of individual gases during the storage of chicken fillets in packaging for 10 days under refrigerated conditions (4 °C). This study found that the oxygen content increased for the first four days (on day 4, it increased by 10.7% compared to day 2). For the following days up to day 8, the oxygen content leveled out at about 70.5%, and on the tenth day of storage (that is when the poultry meat had already shown signs of spoilage), it decreased to a level of 40.2%, that is, referring to the initial state by as much as 21.7%. Carbon dioxide content, on the other hand, remained stable, ranging from 25.3 to 24.6%. This likely indicates the development of aerobic bacteria in poultry meat stored in modified atmosphere packaging. This is confirmed by Rossaint et al. [
23], who state that the high oxygen content of packaging can contribute to aerobic microorganisms’ growth, which inhibits anaerobic bacteria’s growth. It also accelerates oxidative processes and makes it possible to preserve the attractive color of poultry meat.
Poultry meat stored in contact with air is fresh for only three days. In a modified atmosphere, its shelf life is extended by up to seven days. Storing poultry meat under modified atmosphere conditions offers many advantages, particularly better sensory and microbiological quality and lower weight losses than traditional methods [
24]. In the case of the study included in this paper, signs of spoilage were noted after 6 days of storage under modified atmosphere conditions at 4 °C (
Figure 1). However, considering that the poultry meat was purchased from a hypermarket and could have been stored there for several days, and adding the transportation time, it can be roughly estimated that the total time was about 9–10 days, which confirms the results of the authors mentioned earlier.
The course of the microbial growth curves (
Figure 1) shows a clear dependence of the curves on the time of storage under refrigeration conditions in a modified atmosphere package (
Figure 2). Thermal imaging analysis of the temperature distribution for a sample of chicken fillets stored in a modified atmosphere package is shown in
Figure 3. It was observed that the samples had a higher temperature over time.
As a result of the metabolic activity of microorganisms, catabolic processes involve exothermic reactions, involving the gradual breakdown and oxidation of macromolecular compounds into simple substances such as carbon dioxide, water, and nitrogenous compounds. These processes are inevitably accompanied by the release of energy, which is partially (40%) stored in the form of high-energy compounds, ATP and ADP. The remaining 60% of the energy is dissipated as heat [
10]. The VIGOcam V50, a thermal imaging camera used in this study, unequivocally confirmed that changes related to microbial metabolism had occurred in the poultry meat in the form of an increase in temperature, which was reflected in the results of microbial count determination by standard methods.
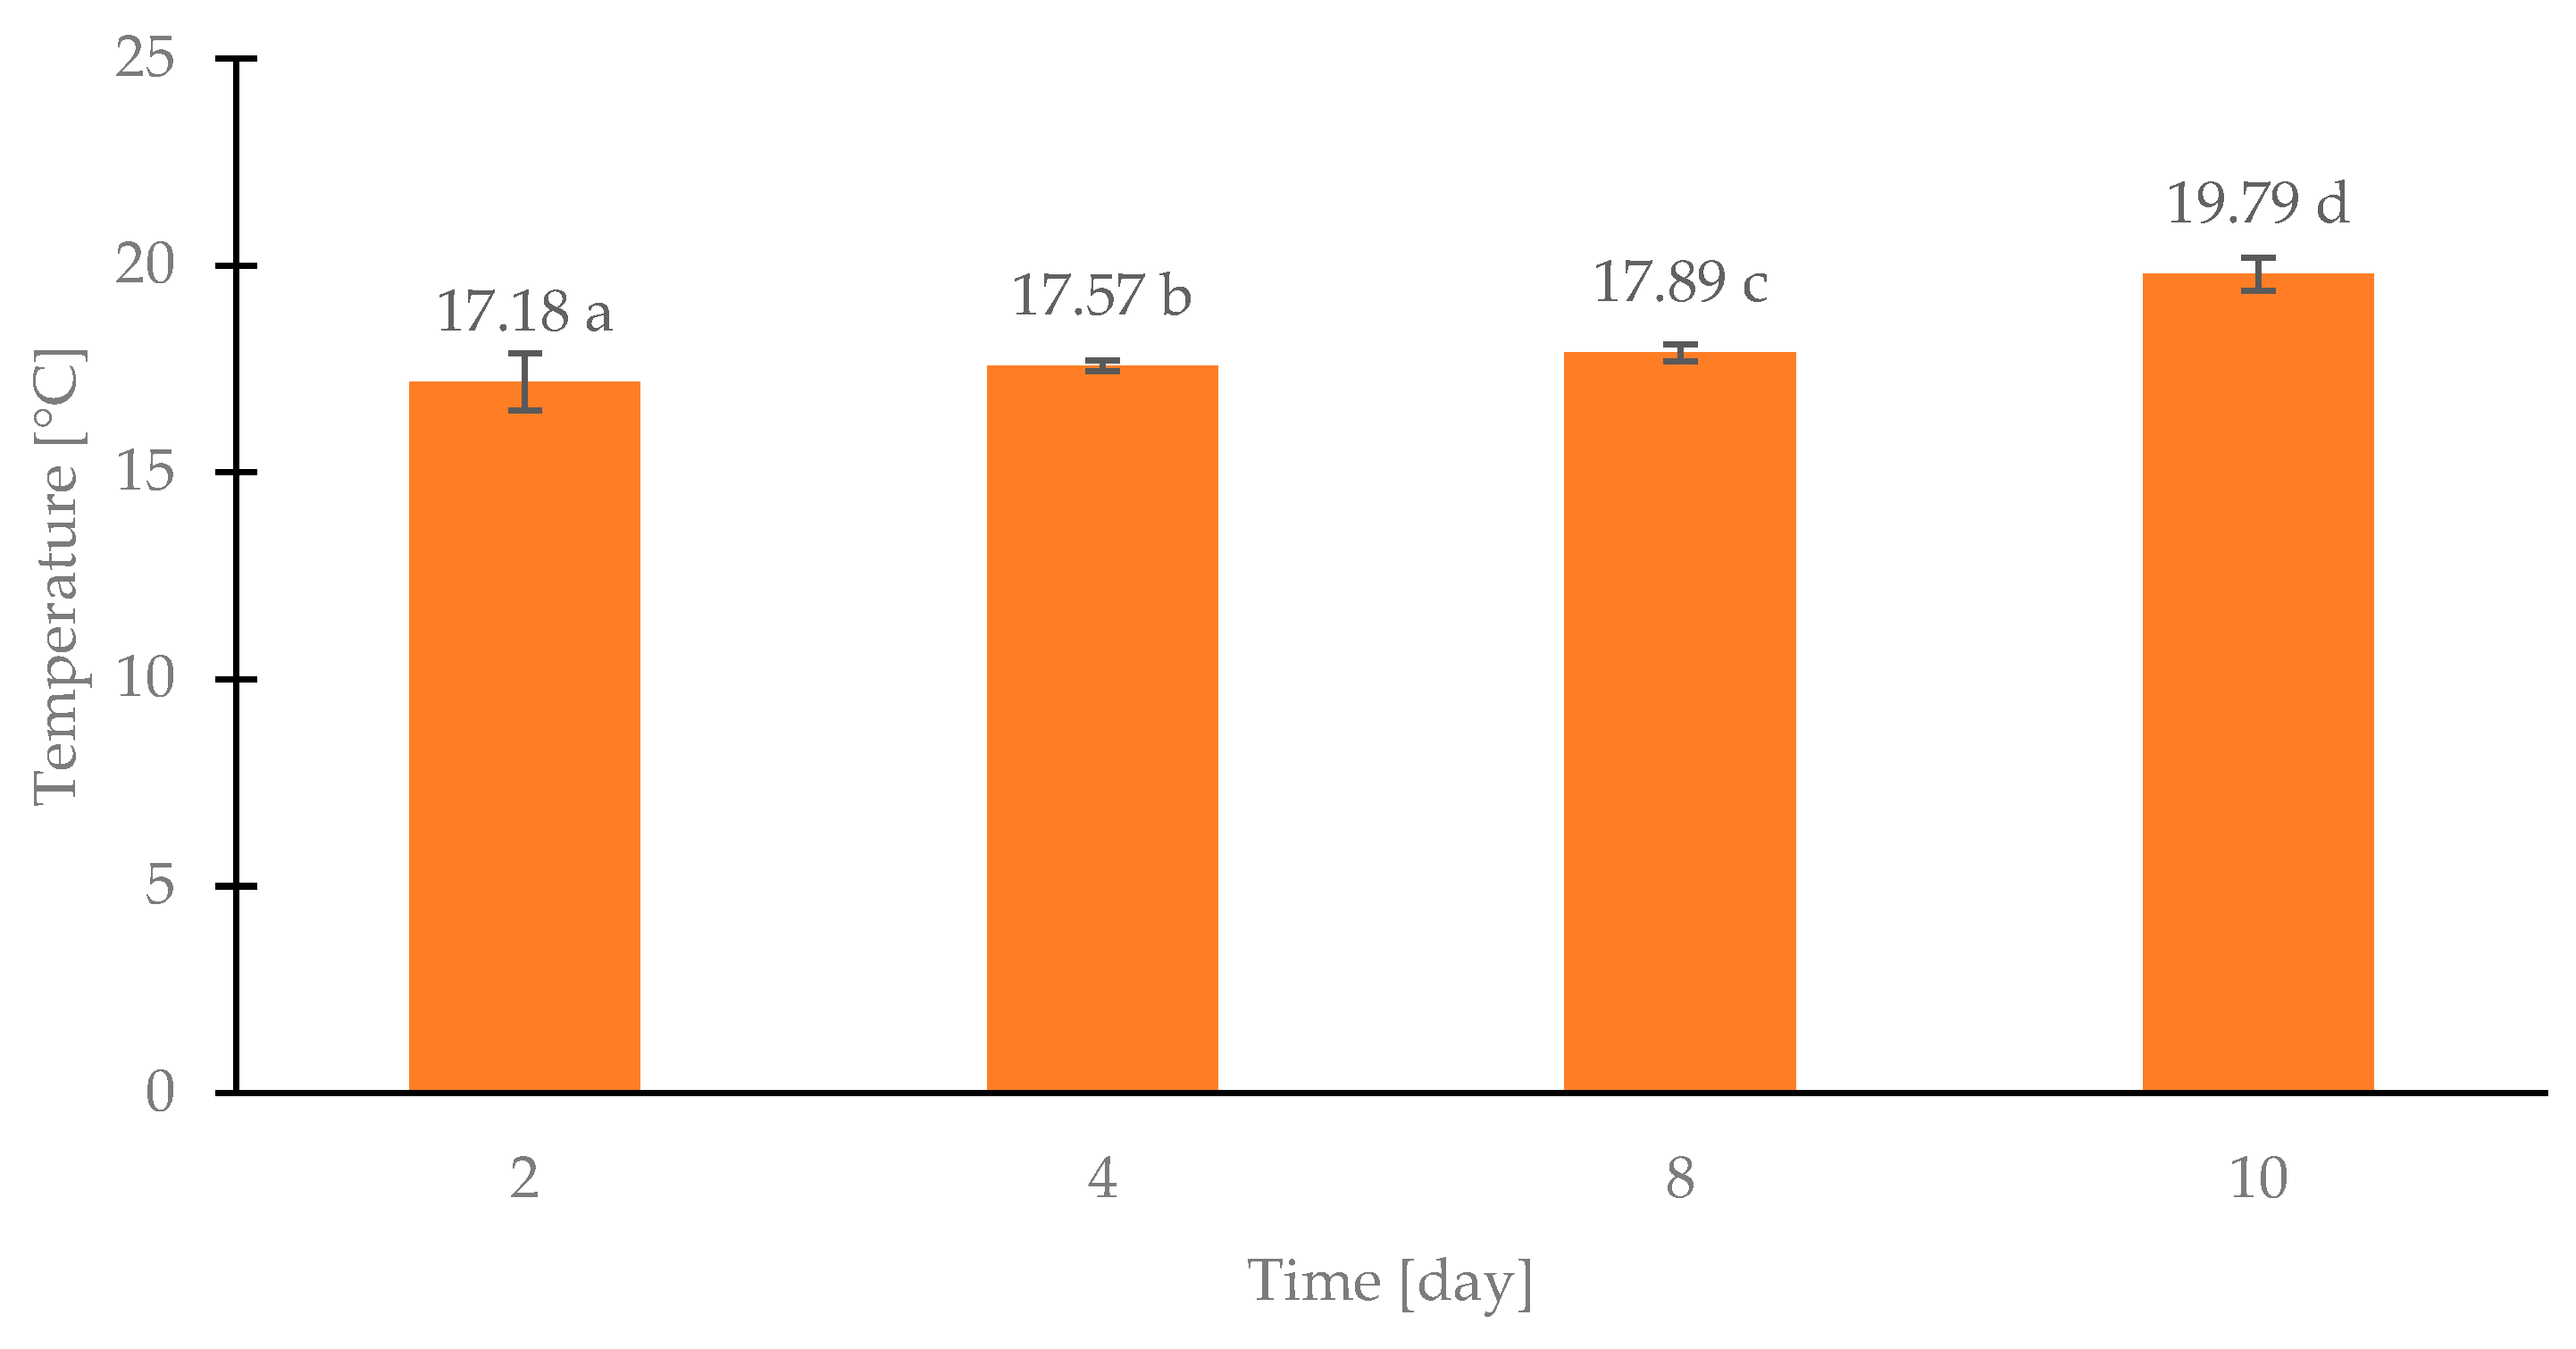
Figure 4 shows the dependence of the average temperature of samples from successive days of storage of poultry meat in modified atmosphere packaging. On days 2, 4, and 8, the samples’ temperature varied little, ranging from 17.15 °C to 17.88 °C. The most significant temperature difference between days 2 and 10 was 2.61 °C. Differences between the day’s measurements ranged from 0.30 to 1.91 °C (between days 8 and 10). Such a significant increase in temperature between days 8 and 10 can be explained by the intensified metabolism of the already multiplied microbial population. The above analysis shows that the VIGOcam V50 camera allows for the detection of microorganisms in chicken breast fillets but does not guarantee an accurate determination of the level of contamination of the tested sample.
Lipinska et al. [
9] developed a methodology for microbiological quality control using a thermal imaging camera with an uncooled microbolometer detector of mortadella samples inoculated with
Bacillus subtilis ATCC 6633 bacteria. Active thermography used in the study consisted of cooling the sample for 60 s at −18 °C ± 1 °C. The technique worked well for testing the microbiological quality of food, as a clear contrast was noted between the test sample and the background, highlighting the difference in heat emission between the two. It was also observed that thermal imaging measurements made distinguishing between contaminated and sterile samples possible. Mortadella uncontaminated with bacteria showed a slower rate of heat emission than samples with different degrees of contamination on the order of 10
6 to 10
9 CFU/g. However, the thermal imaging camera used did not accurately determine the degree of microbial contamination of the test sample.
In another study [
25] on thermal imaging to monitor the microbiological quality of poultry sausage, samples were contaminated with bacteria of the Proteus mirabilis species. It was then found that as the number of microorganisms increased, the temperature of the sausage increased, which raised the prospect of using thermography to assess the microbiological quality of the meat product.
The results presented here demonstrate the ability of the VIGOcam V50 to detect changes related to microbial metabolism in the food samples tested. Thanks to the thermal imaging technique, it was possible to assess the quality of the raw material. At the same time, it is possible to confirm the conclusions of the studies conducted by Lahiri et al. [
10] and Salaimeh et al. [
26,
27], saying that the increase in the number of bacteria in the sample was closely correlated with the thermal energy they produced and depended on the species. The emissivity of the materials and the reflectivity of the radiation emanating from the environment influenced the formation of errors during thermal imaging camera operation [
28].
In the future, a thermal imaging camera could be used to quickly and remotely inspect microbial contamination of food. In addition, examining products on production lines or during transport would reduce the risk of developing microbiological contamination. Wang et al. [
29] confirm that inspecting food quality using a thermal imaging camera is low-cost and has the potential to be applied in the food industry.
Fourier-transform infrared (FT-IR) spectroscopy is a promising modern technique that “measures” the overall chemical composition of a sample, thereby creating a spectral fingerprint (in this case, of a chemical mixture) that can be analyzed using various algorithms such as pattern recognition, or by comparing the spectra of individual samples. As an analytical tool, it is used in many industries and fields, including medical and microbiological diagnostics science, and food technology [
30]. The chemical changes in meat during storage, mentioned in the
Section 1 above, can be captured and represented by analyzing changes in infrared spectra and then used to correlate with actual bacterial contamination using statistical methods such as principal component analysis [
31].
Infrared spectra were recorded for poultry meat samples from the 3rd, 4th, 5th, and 6th day of storage (sample spectra are presented in
Figure 5). The course of the spectra is very similar, and it is impossible to distinguish them by visual inspection. For example, a minimal increase in intensity at a given wavenumber can be associated with a decrease in band intensity at another spectral range. There may also be minimal shifts in the wavenumbers of individual bands. The characteristic regions where the OH group’s vibration-generated bands, the C-H group’s vibration-generated bands, or the C = O group’s generated bands are shown in
Figure 5. However, detailed analysis of spectral changes that occur due to microbial changes is rather impossible without statistical tools. Therefore, based on the spectral data in these spectra (wavenumbers and band intensities), the samples were classified by discriminant analysis, one of the T.Q. Analyst modules. Using ten principal components, the applied procedure covers 100% of the total variability between samples.
Four homogeneous groups were distinguished using Mahalanobis distances, which were calculated based on spectral data of samples collected on different days of storage. This indicates statistically significant differences in the chemical composition of samples recorded on different days of storage. Since there were changes in the chemical composition of the stored poultry meat, the groups are separated, and each represents a unique, specific set.
Figure 5 shows that the samples from day 3 are farther apart (more considerable Mahalanobis distances) than the other samples from days 4, 5, and 6, which suggests that the presence of different chemical compounds or different amounts of the same chemical compounds present in the stored poultry fillets should be interpreted. In contrast, the samples from days 5 and 6 overlapped, indicating that the samples from these two storage periods were chemically more similar. During poultry meat storage, chemical changes in its components occur, which are closely related to the metabolism of developing bacteria. Proteolysis in meat provides free peptides and amino acids as a good energy source for microorganisms. In addition, several chemicals are produced, including alcohols, volatile esters, ketones, and sulfur-containing compounds. This complex mixture can contribute to unpleasant aftertastes [
32]. Meat spoilage is also characterized by the gradual formation of mucus due to the secretion of polysaccharides by some microorganisms [
31]. Before they are detected by the senses (taste, smell), these changes can be “observed” by spectral data, which are much more sensitive to the chemical changes that cause sensory changes. Thus, the spoilage process can be identified at an earlier stage. No visible changes in the form of mucus or color changes were observed in the studies conducted in the present work. Still, the high sensitivity of FT-IR spectrophotometry made it possible to distinguish the samples tested for each day. Also, it made it possible to identify the degree of progressive undesirable meat spoilage processes related to microbial metabolism. These changes are invisible to the human eye. The changes in chemical composition observed through I.R. spectral data were reflected and confirmed by the results of determining microbial counts by standard methods.
The research carried out in this study indicates that FT-IR spectroscopy can find applications for assessing the microbiological quality of products. It is a fast, non-invasive, and sensitive method. Samples from days 3, 4, and 5 were clearly separated (
Figure 6), indicating that the chemical composition of the samples changed significantly. In contrast, between days 5 and 6, the samples had almost similar chemical composition, indicating that the dynamics of changes caused by microbial activity were no longer as significant as in the initial storage period. The discriminant model constructed was cross-validated with the leave-one-out method.
The capabilities of NIR and FT-IR for use in assessing the freshness of chicken breast meat were investigated by Alexandrakis et al. [
33]. Their results showed that these methods failed to completely distinguish samples from day 0 and day 4 but correctly classified samples from day 8 and day 14, where signs of spoilage were evident. They also determined that the most crucial process detected by NIR FT-IR spectroscopies is proteolysis, which involves the enzymatic cleavage of a peptide bond with the involvement of proteolytic enzymes. They noted an increase in absorption in the wavelength signals corresponding to the absorption bands of amides and amines. This suggests an increase in free amino acids and low-molecular-weight peptides with increased sample storage time since the aerobic bacterial species responsible for meat spoilage proceed to hydrolyze proteins immediately after glucose depletion. Enzymatic degradation of proteins led to the production of free peptides and amino acids used as energy sources and various metabolites that are spoilage indicators [
33].
This study’s results suggest that NIR FT-IR spectroscopy can become a helpful, rapid, and non-destructive tool for detecting spoilage. Grunert et al. [
34] used FT-IR spectroscopy to differentiate between fresh and frozen chicken meat. To do so, they compared FT-IR spectra of chicken stored at 4 °C with those of chicken frozen and stored at −20 °C for 2, 5, 15, 30, 60, 70, and 85 days. Hierarchical cluster analysis of the spectra made distinguishing fresh samples from those frozen for more extended periods possible. It confirmed the potential of the FT-IR technique in this regard. The results obtained within the framework of the present study also show significant correlations between spectral data and changes occurring during the storage of chicken breast (
Figure 6).
Thermal imaging in microbiological studies faces a number of significant technical and environmental limitations. One of the primary challenges involves the variability and unreliability of emissivity, which often depends on the sample’s morphology and structure, thus affecting the accuracy of temperature measurement. Salaimeh et al. caution that surface emissivity may obscure bacterial signals and distort thermal readings. Another critical limitation is thermal drift of the infrared camera sensor—without regular calibration using blackbody references, measurement errors can reach ±1–2 °C, which significantly reduces reproducibility. Moreover, the sensitivity of thermal imaging is often insufficient for early detection of low-level microbial colonies, as it requires high cell density, extended incubation time, or forced cooling to differentiate samples by metabolic heat production. Additionally, environmental conditions—such as humidity, air flow, and surface geometry—introduce artifacts and instability in thermal readings, necessitating strictly controlled measurement environments. Finally, the insufficient spatial resolution and inability to detect internal temperatures of samples limit the method’s capacity to localize or identify microbiological reaction centers, greatly reducing the overall effectiveness of thermography in microbiological applications [
35,
36,
37,
38,
39,
40].


 ,
, 


