Article

Physicochemical Properties and Antioxidant Activities of Yanggaeng Added with Different Grape Varieties

1
Department of Food and Nutrition, Sunchon National University, Suncheon 57922, Republic of Korea
2
Department of Natural Cosmetics Science, Sunchon National University, Suncheon 57922, Republic of Korea
3
Natural Cosmetics Research Institute, Sunchon National University, Suncheon 57922, Republic of Korea
*
Author to whom correspondence should be addressed.
Appl. Sci. 2025, 15(13), 7291; https://doi.org/10.3390/app15137291
Submission received: 19 May 2025 / Revised: 24 June 2025 / Accepted: 25 June 2025 / Published: 28 June 2025
(This article belongs to the Section Food Science and Technology)

Abstract

In this study, we evaluated the antioxidant activity, physicochemical properties, and sensory characteristics of Yanggaeng made with grapes. Freeze-dried powders and juices were prepared from three grape varieties (Campbell Early, Kyoho, and Shine Muscat). Yanggaeng was then prepared at concentrations of 2, 4, and 8%. Antioxidant activity was evaluated by measuring total polyphenols and DPPH and ABTS radical-scavenging activities. The physicochemical properties measured included solid content, Brix, pH, total acidity, moisture content, color, and texture profile analysis (TPA). The results showed that the total polyphenol content increased as the number of grapes increased, with the 8% Shine Muscat juice (JS 8%) sample having the highest polyphenol content and ABTS radical-scavenging activity. The highest moisture content was observed in the control treatment. The L* value decreased, whereas the a* and b* values increased as the grape concentration increased. The 8% Campbell Early (JG 8%) sample exhibited extremely high a* and b* values. When freeze-dried powder was used, the pH decreased and the total acidity increased compared to that using the juice samples.

1. Introduction

With recent economic growth and increasing interest in health among consumers, the demand for health-oriented products containing functional ingredients rather than traditional materials has increased. Consequently, the food industry is experiencing a growing trend to emphasize both functionality and nutritional value, leading to active research on traditional food processing and the use of bioactive compounds [1]. Yanggaeng is a traditional Korean dessert made from agar and red beans. Modernization of traditional foods using naturally derived functional ingredients has been widely explored. For example, Yanggaeng products containing mugwort [2], black sesame [3], purple sweet potato [4], and ginger powder [5] have been developed [6]. Agar, a key ingredient of Yanggaeng, is a natural substance extracted from seaweed that promotes the growth of beneficial intestinal bacteria, improves bowel movement, inhibits cholesterol absorption, and regulates blood sugar levels, making it a valuable raw material for the development of health-oriented foods [7].
Grape (Vitis vinifera), a deciduous climbing plant belonging to the Vitaceae family of the order Rhamnales, is rich in organic acids such as tartaric, malic, and citric acids, as well as vitamins. A wide range of food development studies utilizing grapes has been conducted, including muffins containing grape powder [8], Yanggaeng with Juice grape juice [6], various grape-based products [9], baking using grape seeds [10], green grape konjac jelly [11], grape jelly [12], and grape vinegar [13,14]. Grapes contain abundant antioxidants, such as polyphenols and anthocyanins, contributing to enhanced immunity, anti-aging effects, and cardiovascular health [6]. These functional compounds are primarily found in the grape skin and seeds [15].
Flavonoids are key compounds that influence the color, taste, and health benefits of grapes and are mainly present in the skin and seeds. Flavonols protect grapes from ultraviolet radiation and contribute to the color stability of wine [16]. Flavanols are responsible for the bitterness and astringency of wine [17].
Although the development of grape-based food products has been actively pursued [9,11,12], only a few studies have reported Yanggaeng made with Juice grape juice. However, research comparing Yanggaeng formulated with grape juice and grape powder remains limited. It is necessary to investigate the functional and physicochemical properties of Yanggaeng depending on the form of grape used. Grape powder, which contains concentrated solids and bioactive compounds, offers advantages in terms of functionality, whereas grape juice contributes more to the flavor and aroma [18]. These differences may affect the final product characteristics in distinct ways.
Therefore, the aim of this study was to develop Yanggaeng using three commercially cultivated grape varieties in the Republic of Korea (Campbell Early, Kyoho, and Shine Muscat) [19] and to compare and evaluate the quality characteristics of products using grape juice (S) and freeze-dried grape powder (P). The grape varieties used in the present study exhibited distinct characteristics. Campbell Early is characterized by dark purple-black berries with a waxy bloom, thick but easily peelable skin, and abundant sweet juice. Kyoho features large, deep purple clusters with soft, sweet flesh that is rich in juice and nutrients. Shine Muscat has yellow-green seedless berries with a firm, crisp texture and a distinctive muscat aroma, making it suitable for transportation. This study aimed to promote awareness of Korean desserts and provide fundamental data for future product development.

2. Materials and Methods

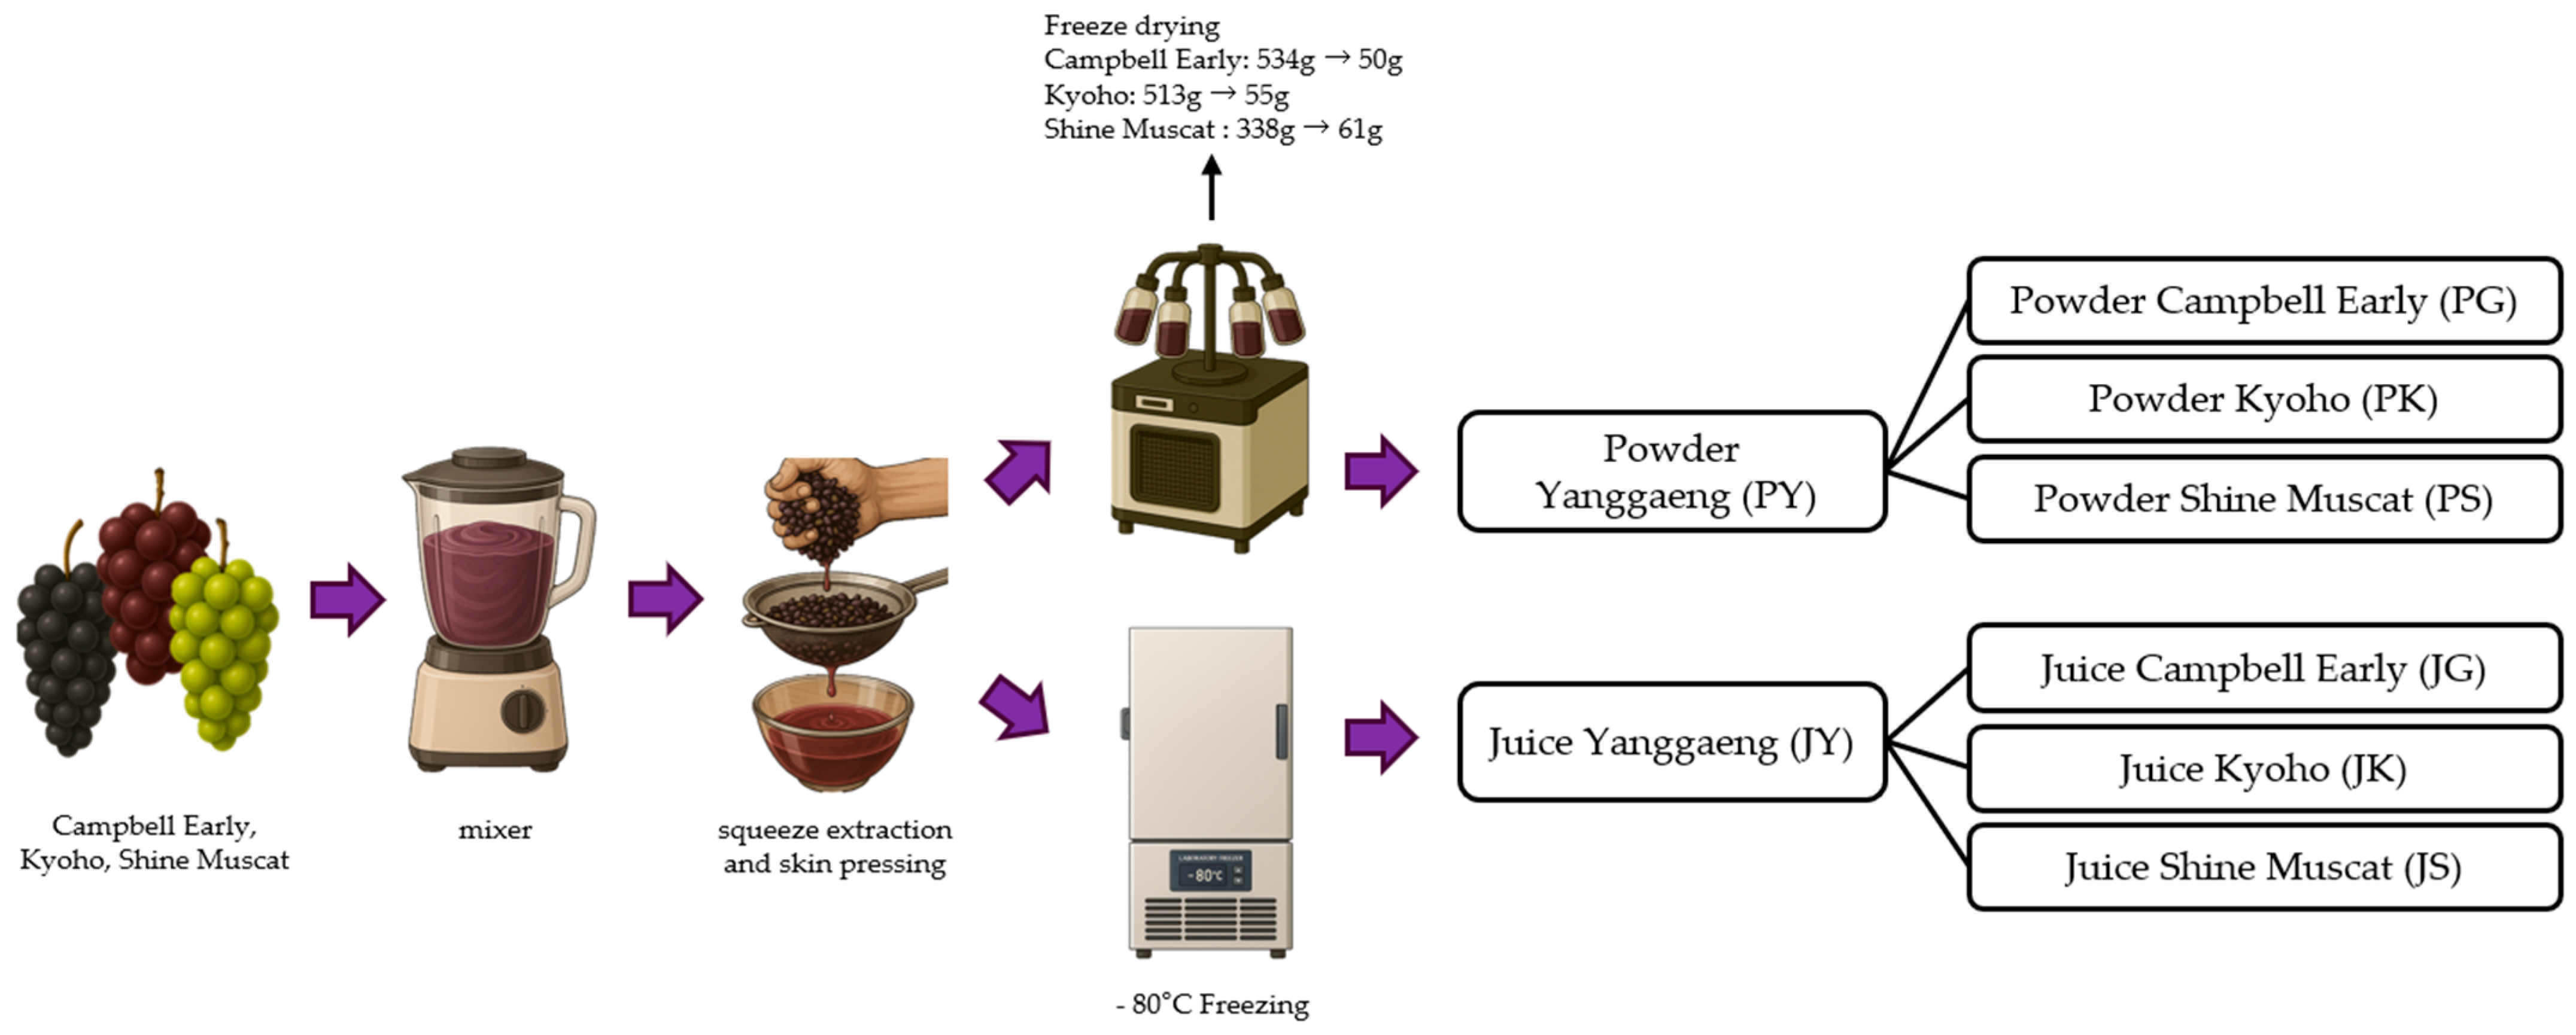
2.1. Preparation of Grape Extracts

A summary of the preparation of grape extracts is presented in Figure 1. Grapes were purchased from local markets in the Republic of Korea. Yanggaeng was prepared using three grape cultivars: Campbell Early, Kyoho, and Shine Muscat, which are the most widely cultivated varieties in the Republic of Korea as of 2024. The grape flesh was separated, and the skins and seeds were removed. The isolated grape flesh was then homogenized using a mixer (VO-TM02, VOAAS, Solingen, Germany) to prepare juice for grape juice Yanggaeng (JY). Subsequently, the separated grape skins were manually pressed to extract residual juice from the thin pulp layer adhering to the skin surface, ensuring maximum juice recovery. The extracted skin juice was then combined with the homogenized flesh juice and filtered through a sieve to obtain the final grape juice. The grapes were stored in a −80 °C freezer (IBK 500F; Infobiotech, Daejeon, Republic of Korea) prior to Yanggaeng preparation and thawed before use. Similarly, the flesh was separated, and the skins and seeds were removed to produce the freeze-dried powdered Yanggaeng (PY). The blended juice was filtered and then subjected to freeze-drying (HC3110; Hanil, Daejeon, Republic of Korea) at −110 °C for 72 h. The extraction yield of the freeze-dried powder from each grape juice was calculated based on the weight of the original raw material using the following formula: (after freeze-drying)/((the original) × 100), resulting in 9, 10, and 18% yields for Campbell Early, Kyoho, and Shine Muscat, respectively. Previous research [20] demonstrated that Shine Muscat grapes have thinner skins and are seedless in nature compared with other grape varieties, potentially accounting for the higher extraction yields observed. The overall process is summarized in Figure 1.

2.2. Preparation of Yanggaeng

White bean paste (Good Morning Seoul, Seoul, Republic of Korea), sugar (CJ, Seoul, Republic of Korea), and agar powder (Event Healthcare, Icheon, Republic of Korea) used in Yanggaeng preparation were purchased from a local market.
Yanggaeng was prepared by mixing white bean paste, water, grapes (juice or powder), sugars, and agar. The formulation was based on a previous study [21] and is detailed in Table 1. The agar powder was first soaked in water and then heated over the medium for 5 min to dissolve completely. Sugar was added, and the mixture was further heated for 4 min. White bean paste was then added, and the mixture was stirred while boiling for 4 min. Finally, Juice grape juice or freeze-dried grape powder was added, and the mixture was heated for 2 min. The mixture was poured into molds, allowed to cool to room temperature until fully solidified, and used as the test sample.

2.3. Analysis of Yanggaeng

Each sample (0.5 g) was homogenized in 50 mL of distilled water using a mixer (vo-tm02, voaas, Solingen, Germany) for all physicochemical, chemical, and antioxidant analyses. The homogenate was centrifuged at 2002× g for 10 min (MF300; Hanil, Gimpo, Republic of Korea), and the supernatant was collected for further analysis [22].

2.3.1. Physicochemical Properties of Yanggaeng

The pH was measured using a pH meter (Lab 845; SI Analytics, Mainz, Germany). Following previous methodologies for grape juice acidity determination [23], total acidity was measured by titration with 0.1 N NaOH (Samchun, Seoul, Republic of Korea), and the volume of NaOH consumed was converted into citric acid (Duksan, Ansan, Republic of Korea) equivalent (%).
The Brix was assessed using a refractometer (Sugar-1 Plus; CAS, Yangju, Republic of Korea), and the soluble solid content (SSC) was measured using a Digital Brix Refractometer (0–55% model; Soonda, Beijing, China). Moisture content (MC) was determined using the atmospheric heat-drying method. This was calculated using the following formula:
Moisture content (%) = [(W1 − W2)/(W1 − W0)] × 100, where W1 is the weight of the sample and weighing dish before drying, W2 is the weight after drying, and W0 is the weight of the empty dish.
The color values (L* for lightness, a* for redness, and b* for yellowness) were measured using a colorimeter (SC-10, 3 nh; Guangzhou, China). The surface of the Yanggaeng samples was measured in triplicate. Figure 2 shows a visual comparison of Yanggaeng.

2.3.2. Texture Profile Analysis (TPA)

TPA was conducted using a Food Texture Analyzer (TA-XTplusC, Stable Micro Systems, Godalming, UK) based on previously reported methods with modifications [22]. The Yanggaeng samples were cut into cubes of approximately 1.5 cm3 before testing. The tests were performed under the conditions listed in Table 2. The measured parameters included hardness, cohesiveness, springiness, adhesiveness, fracturability, chewiness, and gumminess. All measurements were repeated ten times, and the results were expressed as mean values.

2.3.3. Antioxidant Properties of Yanggaeng

The total polyphenol content was measured using a modified version of the Folin–Denis method. A 20 µL aliquot of the sample was mixed with 500 mL of Folin & Denis reagent (Sigma Aldrich, St. Louis, USA) and 7.5% Na2CO3 solution (Samchun, Seoul, Republic of Korea). The mixture was allowed to react in the dark for 30 min. The absorbance was measured at 765 nm using an ELISA reader (EPOCH2 Plate Reader/Spectrophotometer; BioTek, Winooski, VT, USA). The results are expressed as milligrams of gallic acid (Sigma Aldrich) equivalents (mg GAE) per gram of sample [24]. DPPH radical-scavenging activity was measured as previously described [25]. Briefly, 100 μL of the sample was mixed with 100 μL of 0.2 mM DPPH solution (Sigma Aldrich), and the mixture was allowed to react in the dark for 30 min. Absorbance was measured at 517 nm using an ELISA reader, following a previously published protocol [26]. The ABTS radical-scavenging activity was measured as previously described, with slight modifications [25]. Yanggaeng samples (0.5 g) were homogenized in 50 mL of distilled water using a blender, followed by centrifugation at 2002× g for 10 min. The supernatant was collected for further analysis. ABTS cation radicals were generated by mixing 7.4 mM ABTS with 2.6 mM potassium persulfate and incubating the mixture in the dark for 24 h. The ABTS solution was then diluted with distilled water to achieve an absorbance of 1.4 at 735 nm, using the molar extinction coefficient. For the assay, 40 μL of Yanggaeng extract was added to 140 μL of the diluted ABTS solution, incubated in the dark for 60 min, and absorbance was measured at 735 nm using an ELISA reader. Total polyphenol content (originally determined as mg GAE/g), DPPH radical-scavenging activity (originally determined as mg AAE/g), and ABTS radical-scavenging activity (originally determined as mg AAE/g) were all converted to μg GAE/mg and μg AAE/mg to provide more precise numerical representation of the relatively low antioxidant concentrations observed in the samples and to facilitate accurate statistical analysis.

2.3.4. Sensory Attributes of Yanggaeng

A sensory evaluation was conducted with 50 students and staff members from Sunchon National University to assess seven samples. This study was approved by the Institutional Review Board (IRB) of Sunchon National University (1040173-202409-HR-041-02). Based on previous studies [22], samples were evaluated for color, sweetness, sourness, aroma, hardness, chewiness, and overall acceptability (1 = “dislike extremely” to 9 = “like extremely”). The panelists tested seven types of Yanggaeng, including samples prepared with grape juice, grape powder, and control samples without any additives. Samples were prepared one day in advance, stored under refrigeration, and served the following day. Each sample was cut into 1 cm × 1 cm × 1 cm cubes and provided with water for palatal cleansing. The samples were coded using random three-digit numbers. Additionally, a check-all-that-apply (CATA) analysis was performed under identical conditions. Based on two previous studies [27,28], a questionnaire was provided regarding the following attributes: stickiness, sweetness, hardness, sourness, softness, grape taste, unpleasant aftertaste, fruit flavor, acerbity, and grape flavor. The panelists were instructed to mark all sensory terms perceived by them.

2.4. Statistical Analysis

The results were expressed as mean ± standard deviation (mean ± SD). Each experiment was conducted in triplicate, except for the TPA, which was performed with ten replicates. One-way analysis of variance (ANOVA) was performed using Minitab statistical software 22 to evaluate significant differences between groups, followed by Tukey’s post hoc test to determine statistical differences (p < 0.05). Statistical analysis was performed for CATA analysis and principal component analysis (PCA) using XLSTAT 2025 (Addinsoft, Inc., Paris, France). The data complies with statistical assumptions for parametric tests.

3. Results and Discussion

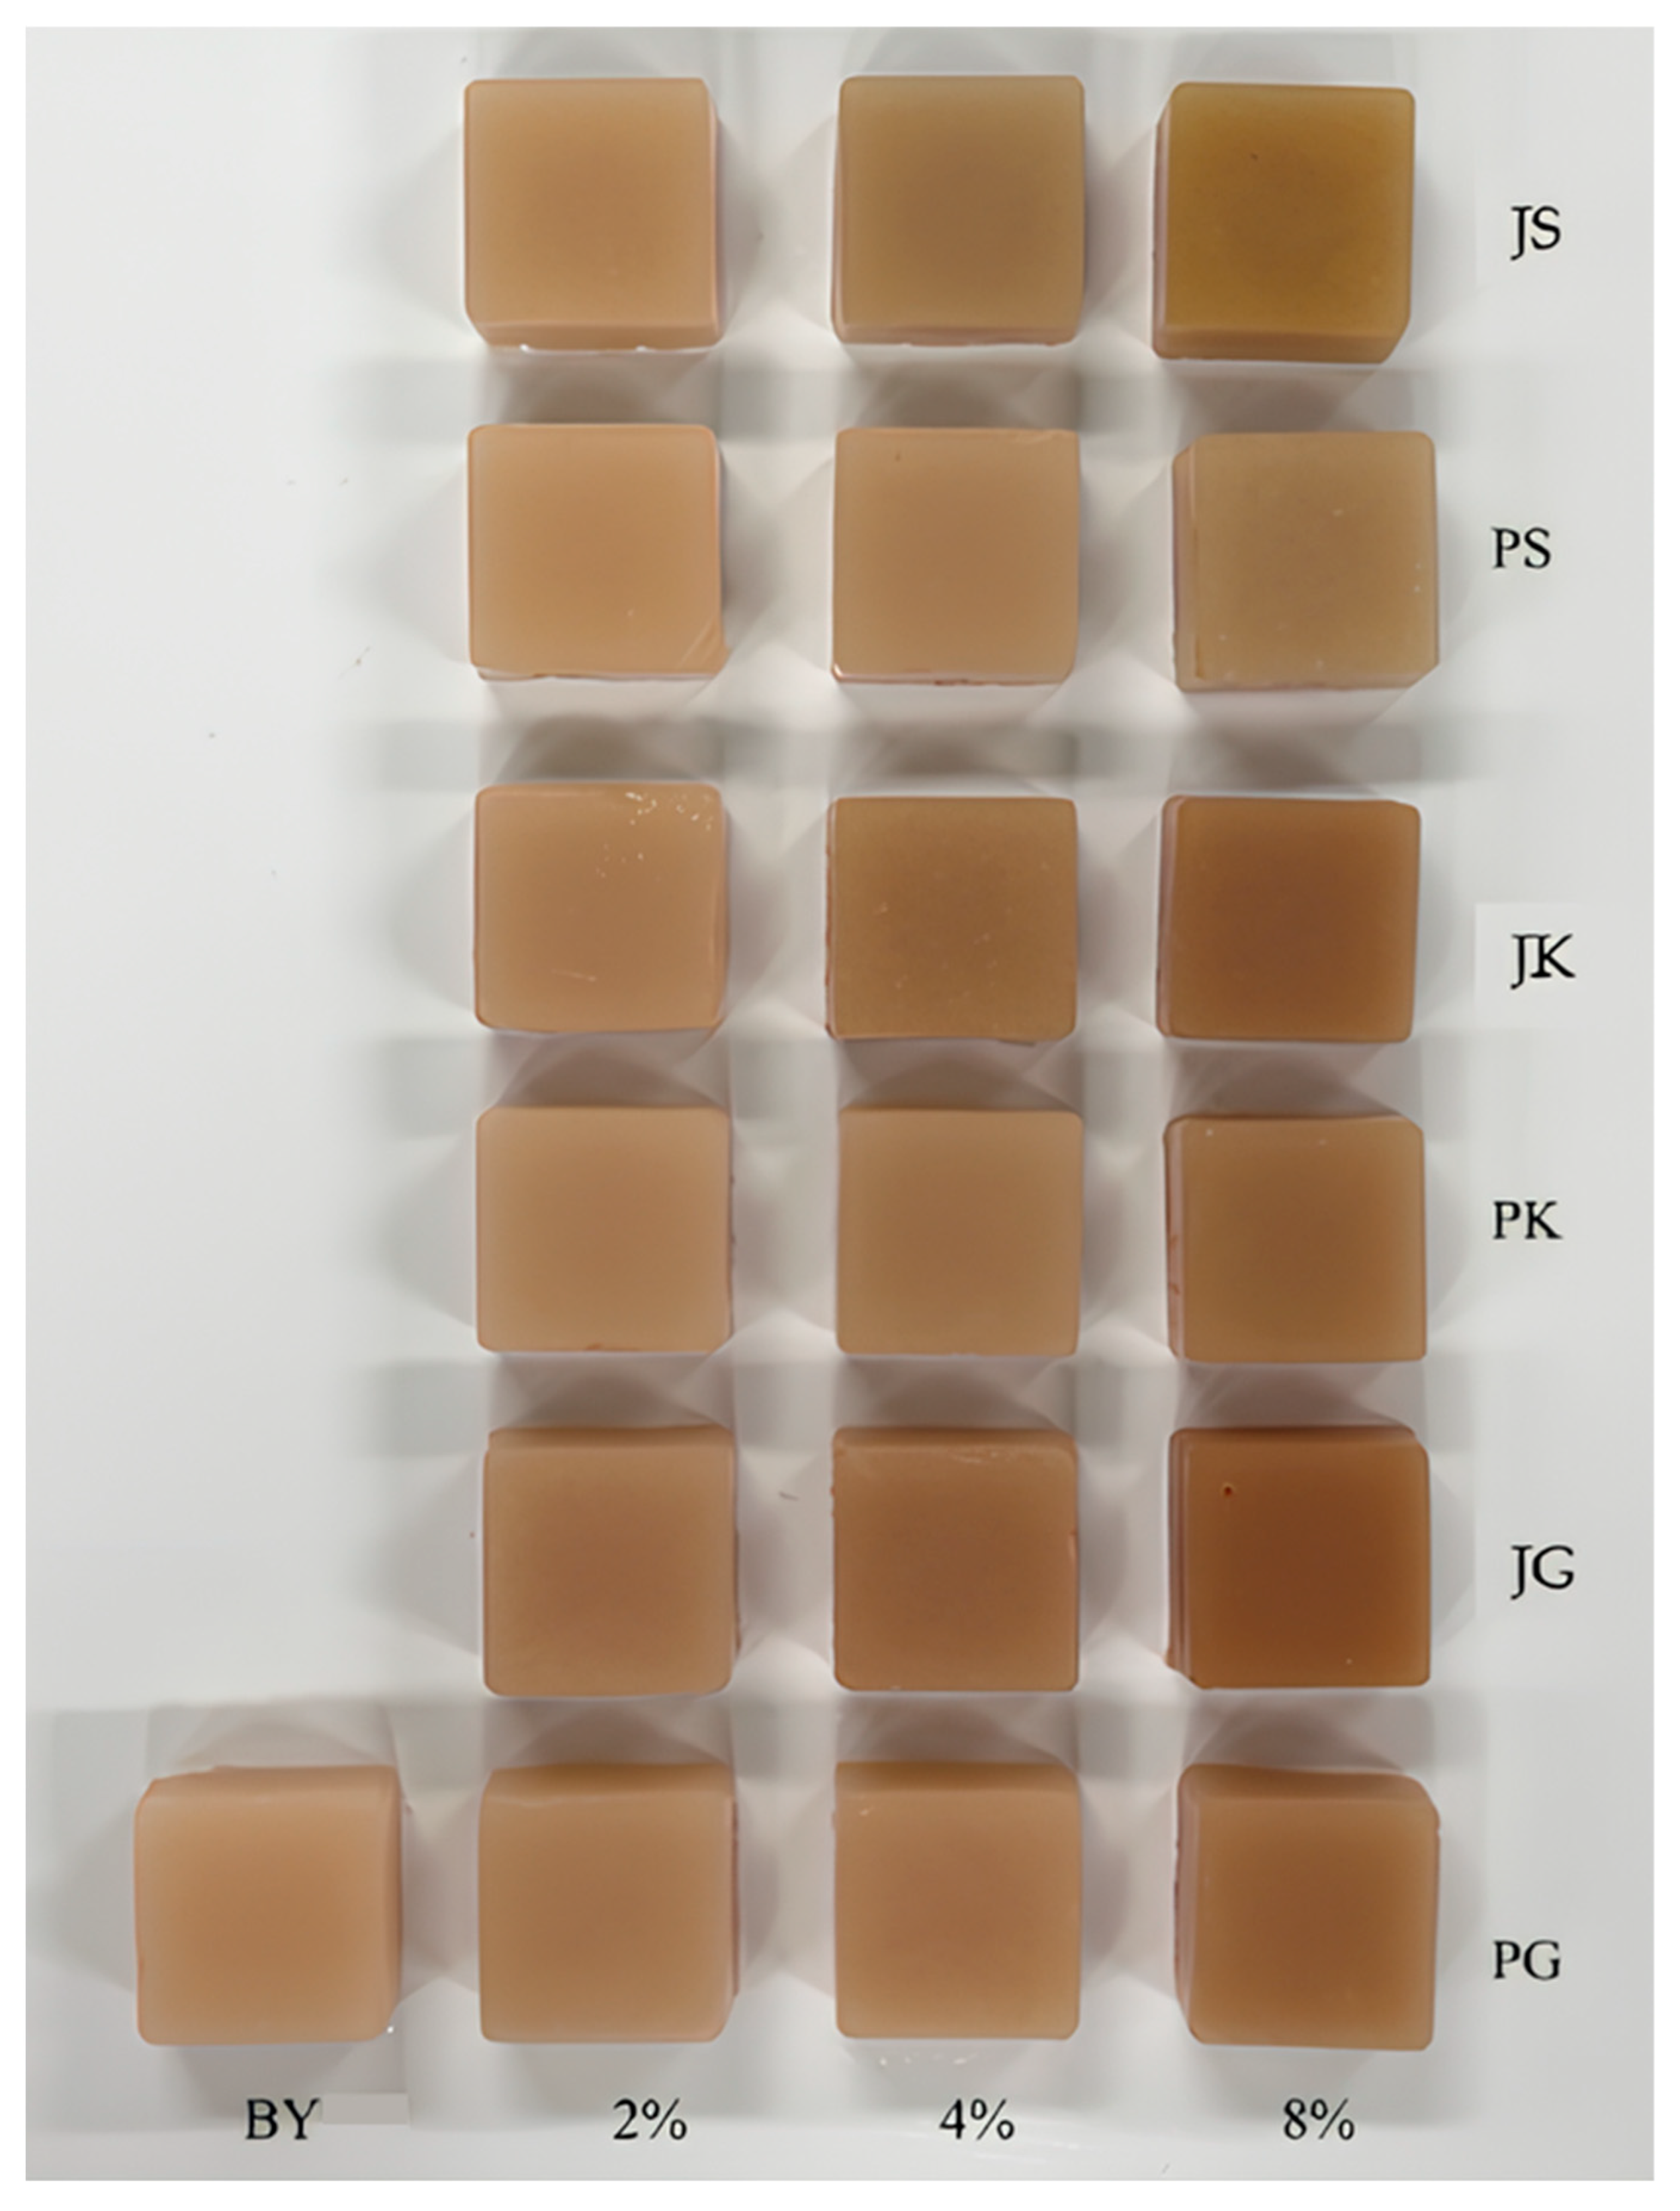
3.1. Indicated Color of Yanggaeng

The indicated color data of yanggaeng is presented in Table 3. In terms of the indicated color, the lightness (L*) of Yanggaeng showed a decreasing trend with increasing amounts of grape juice or grape powder compared with that of the control (BY). A notable decrease in L* was observed in samples containing 8% Juice grape juice (JG 8%). For the redness (a*) values, no significant differences were observed among most samples; however, JG 8% (17.06 ± 2.03) exhibited a higher a* value than the other samples, indicating a stronger red hue. The yellowness (b*) values showed an overall increasing trend with increasing grape content. Notably, JG 8% (15.67 ± 0.26) exhibited a high b* value, indicating a more pronounced yellow hue.
Grape color varies depending on the composition and content of anthocyanins across different grape cultivars [29], explaining the distinct colors observed in the three grape types used in this study. Statistical analysis revealed significant differences in L* values among samples with different grape concentrations within the same group (p < 0.05). Significant differences were observed between a* and b* values in some samples. Browning reactions in grape juice involve both enzymatic oxidation and non-enzymatic processes, which can concurrently produce red and yellow pigments. This overlapping mechanism plausibly explains the observed increases in redness (a*) and yellowness (b*) values [30], [31].
These results suggest that the addition of grape juice and freeze-dried grape powder influences the color characteristics of Yanggaeng and that the chromaticity differences become more pronounced depending on the grape cultivar and addition level. Despite using the same raw material (grapes), differences in color properties depending on the processing form indicate that the method of grape processing affects the color of the final product. The observed decreases in redness and yellowness of the freeze-dried samples were consistent with previous findings, which have attributed such changes to pigment degradation during the drying process [32].

3.2. SSC, Brix, and MC

Table 4 presents the data on SSC, Brix, and MC. The highest SSC was observed in the PS 2% sample (4.91 ± 0.17%), while the lowest was found in the control group BY (3.87 ± 0.05%). Additionally, the Brix value, representing sweetness, was highest in PS 2% (5.81 ± 0.00) and lowest in BY (4.04 ± 0.02). MC was found to be inversely related to SSC. This trend is consistent with the findings of a previous study [33]. The control group BY exhibited the highest MC (53.19 ± 1.46%), whereas JS 8% showed the lowest value (44.74 ± 0.80%). Overall, samples prepared with Juice grape juice (JY) had higher MC than those prepared with freeze-dried grape powder (PY).
These results were related to the physical properties of the freeze-dried powder, particularly its hygroscopicity. During cooking, the powder may promote evaporation from the surface, thereby contributing to reduced MC [34,35]. Furthermore, sugar content in fruit samples can increase water migration through osmotic pressure, leading to enhanced water evaporation during processing, as reported in osmotic dehydration studies of fruits and vegetables [36].

3.3. pH and Total Titratable Acidity (TTA)

Table 5 presents the data on pH and total titratable acidity (TTA). In most cases, the pH values were higher in the PY samples, whereas the total acidity was higher in the JY samples. This result is consistent with previous findings [37]. Because JY retains the natural composition of the fruit, including organic acids, the total acidity is higher, and the pH is relatively low. In contrast, in the PY samples, the freeze-drying process may have led to the loss of organic acids, resulting in higher pH and lower total acidity. The JG and JK samples exhibited a distinct pattern of pH reduction in response to increasing concentrations, showing the most significant acidification among all the tested samples.
Grape juice naturally contains various organic acids, such as tartaric acid, malic acid, and citric acid, which contribute to lowering the pH of the product. However, in freeze-dried grape powder, some of these acids may be lost (e.g., volatilized or degraded) during the drying process, increasing the pH. In addition, there are differences in the organic acid composition depending on the grape variety; however, it was confirmed that there was no significant difference in the organic acid composition when Shine Muscat was used to make Yanggaeng [38].
Significant differences were observed across the 2, 4, and 8% addition levels, with the most pronounced changes observed in the 8% group. Therefore, subsequent analyses were conducted using only the Yanggaeng samples with 8% grape content.

3.4. Antioxidant Activity

The data on antioxidant activity is presented in Table 6. The total polyphenol content was highest in JK (508.12 ± 12.04 μg GAE/mg) and JS (523.10 ± 5.72 μg GAE/mg), while the lowest values were observed in BY (451.94 ± 14.18 μg GAE/mg), PK (451.94 ± 4.32b μg GAE/mg) and PS (451.94 ± 11.44 μg GAE/mg). JK exhibited the highest activity (302.98 ± 84.98 μg AAE/mg) in the DPPH radical-scavenging activity assay, consistent with the total polyphenol content. PS showed the lowest DPPH activity (72.32 ± 17.86 μg AAE/mg), suggesting a potential loss of antioxidant compounds during the freeze-drying process. All samples showed similar ABTS radical-scavenging activity, with no statistically significant differences observed. Overall, the antioxidant activities, including total polyphenol content and DPPH and ABTS scavenging abilities, were higher in Yanggaeng prepared with grape juice (JY) than in those prepared with freeze-dried grape powder (PY). Of the three antioxidant indicators tested, JS exhibited the highest activity.
This effect has been attributed to hydrolysis reactions during the drying process. Additionally, freezing disrupts cell walls through ice crystal formation, facilitating the extraction of intracellular polyphenols. Consequently, freeze-dried materials exhibit higher polyphenol content than fresh fruit due to enhanced extraction efficiency. For these reasons, JY demonstrated higher polyphenol values.
This may be attributed to enhanced oxidation reactions owing to increased contact between oxidative enzymes and polyphenols as a result of cell structure disruption during juice extraction [39]. These findings aligned with previously reported trends for SSC, further supporting that JY samples had higher total phenolic content and stronger DPPH radical-scavenging activity than PY samples. This indicated a decline in antioxidant activity due to freeze-drying. Among the three grape varieties, Campbell Early (JK) showed relatively smaller differences between treatments, consistent with previous studies suggesting that the Campbell Early cultivar is less sensitive to antioxidant changes induced by specific processing methods [40]. Additionally, antioxidant activity was determined in grape juice extracted after removing inedible portions, indicating that antioxidant components can be detected without complete incorporation of grape peels. Furthermore, freeze-drying may lead to a slight loss of antioxidant activity [41]. Furthermore, freeze-drying may lead to a slight loss in antioxidant activity [42,43].

3.5. Textural Properties of Yanggaeng

The data on the textural properties of yanggaeng can be found in Table 7. The lowest springiness was observed in the PG sample, whereas fracturability, chewiness, and gumminess were the lowest in JK and highest in JS. Notably, the hardness was also the highest for the JS sample (840.40 ± 81.10), whereas JK exhibited the lowest (256.90 ± 33.50). For springiness, the BY and JG samples showed relatively high values (0.79 ± 0.09), whereas the PG sample recorded the lowest value (0.57 ± 0.07). The JS sample consistently showed the highest fracturability, chewiness, and gumminess values, whereas the JK sample generally recorded the lowest values. Overall, JS exhibited the most pronounced textural characteristics among all samples.
A comparative analysis of the parameters showed a positive correlation among hardness, fracturability, chewiness, and gumminess, indicating that these factors tended to increase together. In contrast, springiness and adhesiveness were negatively correlated, and an increase in springiness was associated with a decrease in adhesiveness. These findings are consistent with those of a previous study [44] that reported a strong positive correlation between hardness, gumminess, and chewiness.

3.6. Consumer Preferences for Yanggaeng

The data on consumer preferences for yanggaeng can be found in Table 8. No statistically significant differences (p > 0.05) were observed between the samples in terms of color, sweetness, sourness, aroma, hardness, or chewiness. However, the overall acceptability showed partial differences (p < 0.05). The control sample BY received the highest overall acceptability score (6.20 ± 1.76), while JG (4.88 ± 2.34) and JS (4.91 ± 2.49) had relatively lower ratings. For sweetness, the JK sample recorded the highest score (6.00 ± 1.97), while JG (5.98 ± 2.23) and JS (5.82 ± 2.10) showed slightly higher tendencies in hardness. The lack of significant differences in sensory attributes among the Yanggaeng samples may be attributed to individual preferences rather than objective quality characteristics. Nevertheless, the JG and JS samples consistently showed lower ratings for overall acceptability. Similar trends have been reported in previous studies involving ingredients added to Yanggaeng formulations [45].
These results suggest that grape supplementation did not significantly affect the sensory acceptability of Yanggaeng and that consumer perception of sensory characteristics remains largely unchanged regardless of the type or form of grapes added. Although both the hardness and chewiness parameters were measurable in the dataset, TPA and sensory evaluation yielded different results. This divergence can be attributed to the observation that texture perception during actual food consumption results from complex physiological phenomena including masticatory force, chewing velocity, dental configuration, intraoral viscosity changes (resulting from saliva incorporation), and thermal variations.

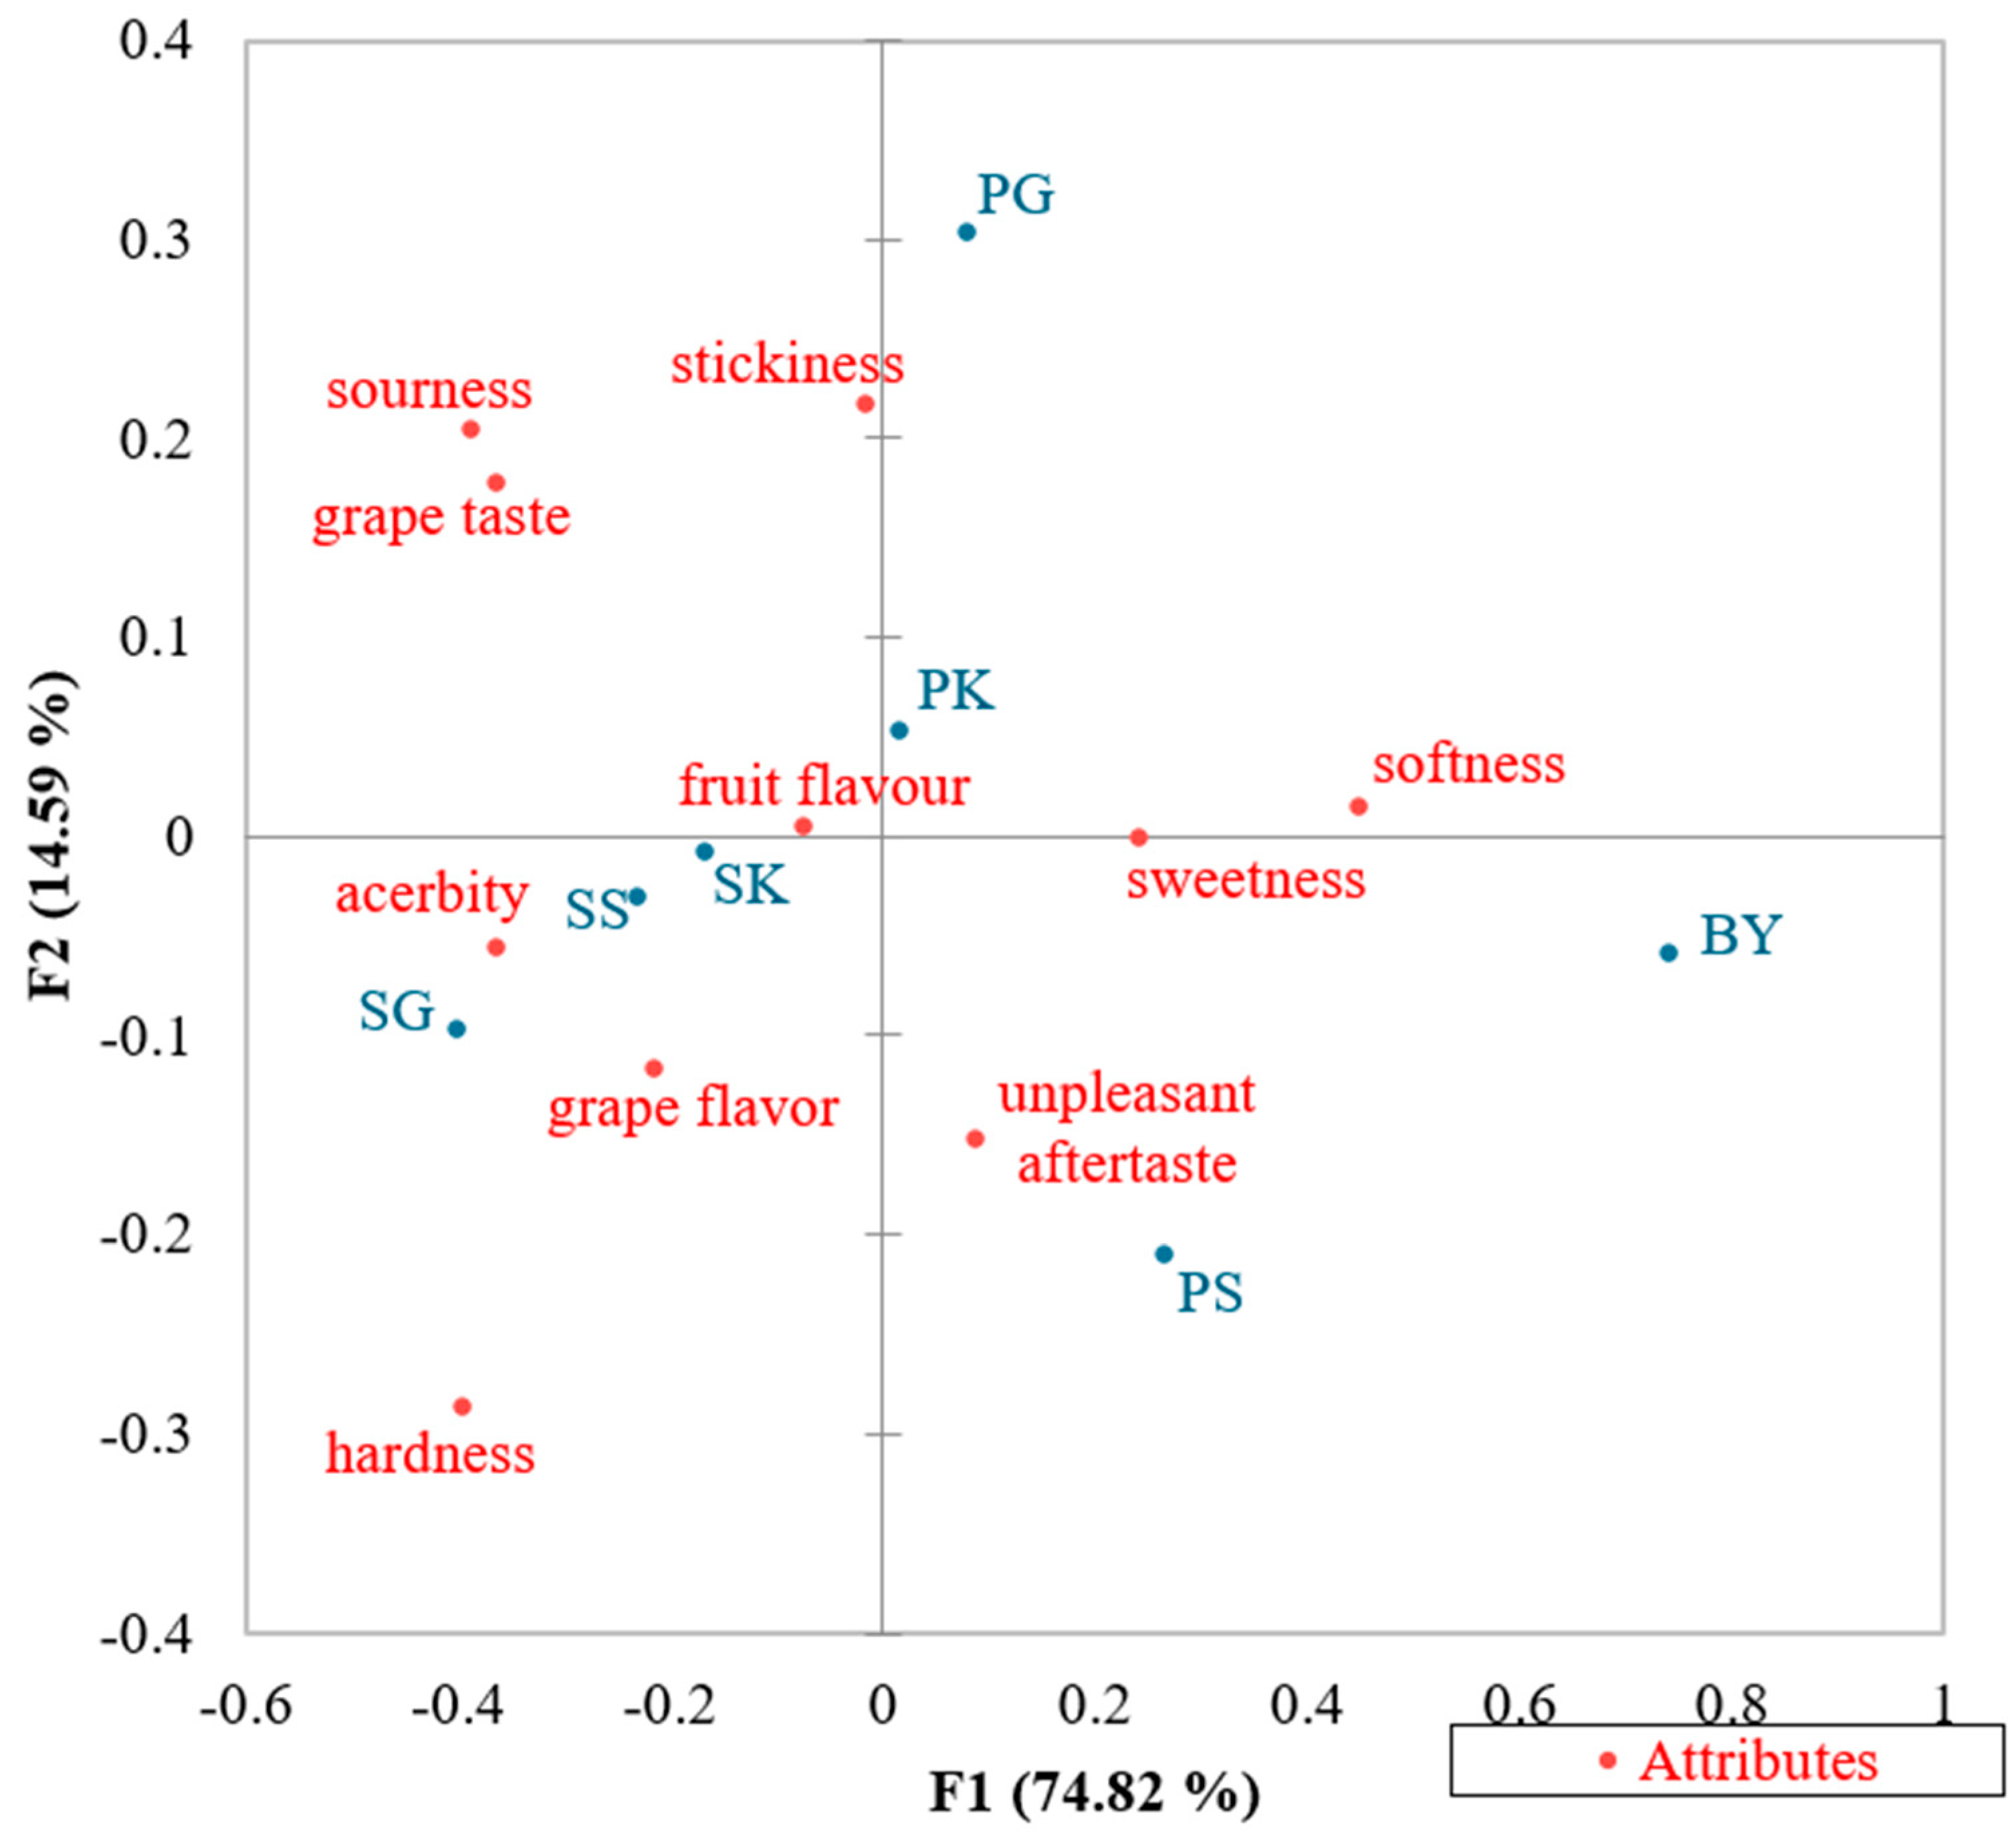
3.7. CATA Analysis and PCA

The CATA data are presented in Figure 3. The CATA was conducted according to the guidelines described in [46]. The CATA data illustrated the perceptual positioning of the sensory attributes for each Yanggaeng sample. The attributes positioned near a product in the correspondence analysis indicated a strong perception of these characteristics in that sample. For example, PG was positioned close to stickiness and sourness, indicating a strong perception of these attributes. BY was associated with softness and sweetness, whereas PS was associated with an unpleasant aftertaste. JK and JG were linked to acerbity and grape flavor. Notably, JK’s association of JK with acerbity and grape flavor aligned with the patterns observed in [47], where specific flavor attributes were correlated with overall acceptability, suggesting a potential contribution from these characteristics. Softness and sweetness were positively correlated in similar directions, whereas hardness and softness were negatively correlated in the opposite directions.
The F1 axis (74.82%) accounted for most of the total variance and was interpreted as a dimension contrasting the intensity of texture and flavor as well as positive versus negative sensory perceptions. The negative side of F1 (left side) included attributes such as hardness, acerbity, and grape flavor, which are related to its strong texture, astringency, and traditional grape aroma. By contrast, the positive side of F1 featured softness, sweetness, and an unpleasant aftertaste, reflecting a softer texture and more subdued or undesirable sensory impressions. This distribution suggested that F1 represents a fundamental axis for differentiating the basic product characteristics, including texture, taste, and sensory valence. The F2 axis (14.59%) was interpreted as representing auxiliary flavor and textural attributes. Attributes such as stickiness, sourness, and grape taste were found on the positive side (upper region), emphasizing the inherent grape flavor. In contrast, the attributes associated with hardness and acerbity partially overlapped, indicating that F2 captured subtle flavor nuances and secondary textural features among the samples.
Comprehensive interpretation of the sensory evaluation and CATA analysis revealed distinct differences in consumer preferences among the samples. The PG sample was characterized by pronounced sourness and grape-like taste in the CATA, consistent with the sensory evaluation showing relatively high sourness scores. In contrast, the JK sample was closely associated with a strong grape flavor in the CATA; however, the sensory evaluation indicated higher hardness, resulting in only moderate overall acceptability. Additionally, the JS and JG samples showed strong associations with astringency in the CATA and recorded the lowest scores in overall acceptability during sensory evaluation. This finding indicates that astringency is a major factor negatively affecting consumer preferences. For the PS sample, CATA indicated a relationship with an unpleasant aftertaste, but the sensory evaluation showed a moderate level of overall acceptability and a low aroma score. This suggested that the negative perception of the aftertaste may have been partially offset by a weaker aroma. Hardness was not strongly associated with any specific sample in the CATA, but sensory evaluation revealed higher hardness values for the JG and JS samples. These results suggested that the combination of hardness and flavor, rather than hardness alone, had a greater impact on consumer preference.
In summary, the balance between the sensory attributes and texture plays a crucial role in determining the consumer acceptability of each sample. Particularly, astringency and excessive hardness have been identified as key factors contributing to lower consumer preference.
The PCA data are presented in Figure 4. PCA was performed to visually analyze the correlations among the sensory attributes of the Yanggaeng samples. In a PCA biplot, the farther a sensory attribute is from the origin, the greater its contribution to the explanation of the data [48]. Additionally, the relative direction and distance between attributes indicate the nature of their correlations: attributes located in similar directions are positively correlated (i.e., they tend to increase or decrease together), whereas those positioned in opposite directions are negatively correlated (i.e., as one increases, the other tends to decrease). For example, softness and hardness were nearly the opposite, suggesting that products perceived as softer tended to have lower hardness. Similarly, sweetness and unpleasant aftertaste were placed in opposing directions, indicating that higher sweetness levels were associated with a reduced unpleasant aftertaste. In contrast, grape flavor and taste were clustered, reflecting the tendency for these attributes to be enhanced. While CATA visualizes the association between products and sensory attributes, PCA enables the interpretation of the relationships among the attributes themselves and their contributions to the overall variance in the dataset.

4. Conclusions

In terms of color, an increase in the content of juice or freeze-dried grape powder led to a decrease in lightness (L*) values. Yanggaeng prepared with grape juice (JY) showed higher total acidity and antioxidant activity than those prepared with freeze-dried powder (PY), which exhibited higher pH levels. Among all the samples, JS had the highest hardness, fracturability, chewiness, and gumminess values. Although the overall preference scores did not differ significantly among the samples, JY generally performed better in terms of color, sweetness, firmness, and chewiness. CATA revealed that the JY samples tended to cluster together and were associated with attributes such as grape flavor and astringency. Overall, JY showed superior SSC, Brix, and antioxidant activity. In particular, the superior antioxidant properties of JY highlight its potential use in developing functional Korean desserts. These findings may serve as a foundation for developing and commercializing grape Yanggaeng products.

Author Contributions

Conceptualization, I.K. and S.P.; methodology, S.P.; software, S.P.; validation, S.P., S.Y. and I.K.; formal analysis, S.P.; investigation, S.P. and S.Y.; resources, S.P. and S.Y.; data curation, S.P. and S.Y.; writing—original draft preparation, S.P.; writing—review and editing, S.P.; visualization, S.P.; supervision, I.K.; project administration, I.K.; funding acquisition, I.K. All authors have read and agreed to the published version of the manuscript.

Funding

This study received no external funding.

Institutional Review Board Statement

This study was conducted in accordance with the Declaration of Helsinki and approved by the Institutional Review Board of Sunchon National University (protocol code 1040173-202409-hr-041-02, approved on 10 November 2024).

Informed Consent Statement

Informed consent was obtained from all participants involved in the study.

Data Availability Statement

The original contributions of this study are included in this article. Further inquiries can be directed to the corresponding author.

Conflicts of Interest

The authors declare no conflicts of interest.

References

  1. Yang, J.-E.; Kim, J.Y.; Jang, E.Y.; Lee, J.H.; Lee, J.H.; Chung, L. Antioxidant Capacity and Effect of Storage Periods on Textures and Sensory Properties of Dasik (Korean Traditional Confectionaries). J. Korean Soc. Food Sci. Nutr. 2013, 42, 1211–1219. [Google Scholar] [CrossRef]
  2. Choi, I.K.; Lee, J.H. Quality Characteristics of Yanggaeng Incorporated with Mugwort Powder. J. Korean Soc. Food Sci. Nutr. 2013, 42, 313–317. [Google Scholar] [CrossRef]
  3. Seo, H.M.; Lee, J.H. Physicochemical and Antioxidant Properties of Yanggaeng Incorporated with Black Sesame Powder. J. Korean Soc. Food Sci. Nutr. 2013, 42, 143–147. [Google Scholar] [CrossRef]
  4. Lee, H.W.; Lee, S.Y.; Jung, Y.J.; Jo, Y.J.; Chung, M.N.; Lee, J.S.; Jeong, H.S. Quality Characteristics of Yanggaeng Prepared with the Addition of Colored Sweet Potato Powder. J. Korean Soc. Food Sci. Nutr. 2022, 51, 1238–1243. [Google Scholar] [CrossRef]
  5. Kwon, G.-H.; Kim, M.H.; Han, Y.S. Quality Characteristics and Antioxidant Activity of Yanggaeng Added with Black Ginger (Kaempferia parviflora). J. Korean Soc. Food Sci. Nutr. 2021, 50, 715–724. [Google Scholar] [CrossRef]
  6. Park, C.-H.; Kim, K.-H.; Yook, H.-S. Free Radical Scavenging Ability and Quality Characteristics of Yanggaeng Combined with Grape Juice. Korean J. Food Nutr. 2014, 27, 596–602. [Google Scholar] [CrossRef]
  7. Chen, X.; Fu, X.; Huang, L.; Xu, J.; Gao, X. Agar Oligosaccharides: A Review of Preparation, Structures, Bioactivities and Application. Carbohydr. Polym. 2021, 265, 118076. [Google Scholar] [CrossRef]
  8. Jeong, H.-C.; Jeon, H.-M. Quality Characteristics of Muffin with Added Grape Powder. J. Korean Soc. Food Cult. 2016, 31, 498–505. [Google Scholar] [CrossRef]
  9. Zhou, D.-D.; Li, J.; Xiong, R.-G.; Saimaiti, A.; Huang, S.-Y.; Wu, S.-X.; Yang, Z.-J.; Shang, A.; Zhao, C.-N.; Gan, R.-Y.; et al. Bioactive Compounds, Health Benefits and Food Applications of Grape. Foods 2022, 11, 2755. [Google Scholar] [CrossRef]
  10. Oprea, O.B.; Popa, M.E.; Apostol, L.; Gaceu, L. Research on the Potential Use of Grape Seed Flour in the Bakery Industry. Foods 2022, 11, 1589. [Google Scholar] [CrossRef]
  11. Jeon, J.-E.; Lee, I.-S. Effects of Adding Green Grape Juice on Quality Characteristics of Konjak Jelly. J. Korean Soc. Food Cult. 2019, 34, 629–636. [Google Scholar]
  12. Choi, E.J.; Lee, J.E.; Oh, M.K. The Quality Characteristics of Grape Jelly Made with Various Gelling Agents for Consumption by Elderly Women. Korean J. Food Cook. Sci. 2007, 23, 891–898. [Google Scholar]
  13. Kang, M.; Ha, J.-H.; Shin, E.; Choi, H.-W.; Lee, Y. Physicochemical Properties, Volatile Components, Sensory Characteristics, and Consumer Acceptability of Commercially Available Grape Vinegars. J. Korean Soc. Food Sci. Nutr. 2019, 48, 868–878. [Google Scholar] [CrossRef]
  14. Plantevin, M.; Merpault, Y.; Lecourt, J.; Destrac-Irvine, A.; Dijsktra, L.; van Leeuwen, C. Characterization of Varietal Effects on the Acidity and pH of Grape Berries for Selection of Varieties Better Adapted to Climate Change. Front. Plant Sci. 2024, 15, 1439114. [Google Scholar] [CrossRef]
  15. Elejalde, E.; Villarán, M.C.; Esquivel, A.; Alonso, R.M. Bioaccessibility and Antioxidant Capacity of Grape Seed and Grape Skin Phenolic Compounds After Simulated In Vitro Gastrointestinal Digestion. Plant Foods Hum. Nutr. 2024, 79, 432–439. [Google Scholar] [CrossRef]
  16. Lu, S.; Wang, J.; Zhuge, Y.; Zhang, M.; Liu, C.; Jia, H.; Fang, J. Integrative Analyses of Metabolomes and Transcriptomes Provide Insights into Flavonoid Variation in Grape Berries. J. Agric. Food Chem. 2021, 69, 12354–12367. [Google Scholar] [CrossRef]
  17. Shi, P.; Song, C.; Chen, H.; Duan, B.; Zhang, Z.; Meng, J. Foliar Applications of Iron Promote Flavonoids Accumulation in Grape Berry of Vitis Vinifera Cv. Merlot Grown in the Iron Deficiency Soil. Food Chem. 2018, 253, 164–170. [Google Scholar] [CrossRef]
  18. Martínez, R.; Valderrama, N.; Moreno, J.; de Bruijn, J. Aroma Characterization of Grape Juice Enriched with Grapevine by-Products Using Thermomaceration. Chil. J. Agric. Res. 2017, 77, 234–242. [Google Scholar] [CrossRef]
  19. Korea Rural Economic Institute (KREI). Fruit Observation Report, April 2024; Korea Agricultural Outlook Center: Naju, Repubic of Korea, 2024; Available online: https://aglook.krei.re.kr/main/uObserveMonth/OVR0000000013?queryType=2024&queryType2=7745 (accessed on 1 June 2024).
  20. Yamada, M.; Sato, A. Advances in table grape breeding in Japan. Breed. Sci. 2016, 66, 34–45. [Google Scholar] [CrossRef]
  21. Won Gab, L. Quality Characteristics of Yanggaeng Added with Freeze-Dried Peach Powder. Culin. Sci. Hosp. Res. 2016, 22, 67–77. [Google Scholar]
  22. Amelly, J.; Lee, H.; Jang, D.; Kang, I.K.; Ha, J.H. Physicochemical Properties of Yanggaeng with Added Tempeh Powder. Prev. Nutr. Food Sci. 2023, 28, 514–519. [Google Scholar] [CrossRef] [PubMed]
  23. Chung, H.-J. Comparison of Physicochemical Properties and Physiological Activities of Commercial Fruit Juices. Korean J. Food Preserv. 2012, 19, 712–719. [Google Scholar] [CrossRef]
  24. Folin, O.; Denis, W. On Phosphotungstic-Phosphomolybdic Compounds as Color Reagents. J. Biol. Chem. 1912, 12, 239–243. [Google Scholar] [CrossRef]
  25. Choi, Y.; Lee, S.M.; Chun, J.; Lee, H.B.; Lee, J. Influence of Heat Treatment on the Antioxidant Activities and Polyphenolic Compounds of Shiitake (Lentinus Edodes) Mushroom. Food Chem. 2006, 99, 381–387. [Google Scholar] [CrossRef]
  26. Blois, M.S. Antioxidant Determinations by the Use of a Stable Free Radical. Nature 1958, 181, 1199–1200. [Google Scholar] [CrossRef]
  27. da Costa, J.N.; Brito, S.A.; Leal, A.R.; da Costa Rodrigues, D.; Nascimento, L.G.L.; Figueiredo, R.W.; Mata, P.; de Sousa, P.H.M. Sensory Characteristics of Structured Guava (Psidium Guajava): Comparison of Optimized Descriptive Profile, Cata and Sensory Acceptance Methods. Food Sci. Technol. 2020, 40, 496–502. [Google Scholar] [CrossRef]
  28. Silva, M.M.D.N.; Menezes, L.M.; De Queiroz, A.F.; Melo, L. Sweetness Levels and Effects on Cata Sensory Profile and Acceptance of Peach Nectar. Bol. Do Cent. De Pesqui. De Process. De Aliment. 2016, 34, 151–164. [Google Scholar] [CrossRef]
  29. Seong-Jin, C. The Difference of Anthocyanin Pigment Composition and Color Expression in Fruit Skin of Several Grape Cultivars. Food Sci. Preserv. 2010, 17, 847–852. [Google Scholar]
  30. Wu, S. Glutathione Suppresses the Enzymatic and Non-Enzymatic Browning in Grape Juice. Food Chem. 2014, 160, 8–10. [Google Scholar] [CrossRef]
  31. Buglione, M.; Lozano, J. Nonenzymatic Browning and Chemical Changes during Grape Juice Storage. J. Food Sci. 2006, 67, 1538–1543. [Google Scholar] [CrossRef]
  32. Jakubczyk, E.; Jaskulska, A. The Effect of Freeze-Drying on the Properties of Polish Vegetable Soups. Appl. Sci. 2021, 11, 654. [Google Scholar] [CrossRef]
  33. Mihalcea, L.; Barbu, V.; Enachi, E.; Andronoiu, D.G.; Rapeanu, G.; Stoica, M.; Dumitrascu, L.; Stanciuc, N. Microencapsulation of Red Grape Juice by Freeze Drying and Application in Jelly Formulation. Food Technol. Biotechnol. 2020, 58, 20–29. [Google Scholar] [CrossRef] [PubMed]
  34. Park, Y.-O.; Choi, J.-H.; Choi, J.-J.; Yim, S.-H.; Lee, H.-C.; Yoo, M.-J. Physicochemical Characteristics of Yanggaeng with Pear Juice and Dried Pear Powder Added. Food Sci. Preserv. 2011, 18, 692–699. [Google Scholar]
  35. Varghese, K.S.; Radhakrishna, K.; Bawa, A.S. Moisture Sorption Characteristics of Freeze Dried Whey-Grape Beverage Mix. J. Food Sci. Technol. 2014, 51, 2734–2740. [Google Scholar] [CrossRef]
  36. Yadav, A.K.; Singh, S.V. Osmotic Dehydration of Fruits and Vegetables: A Review. J. Food Sci. Technol. 2014, 51, 1654–1673. [Google Scholar] [CrossRef]
  37. Hwang, E.-S.; Shon, E. Quality Characteristics and Antioxidant Activity of Stick Jelly Prepared with Aronia Juice. Korean J. Food Preserv. 2022, 29, 222–232. [Google Scholar] [CrossRef]
  38. Kunter, B.; Unal, O.B.; Keskin, S.; Hatterman-Valenti, H.; Kaya, O. Comparison of the Sugar and Organic Acid Components of Seventeen Table Grape Varieties Produced in Ankara (Turkiye): A Study over Two Consecutive Seasons. Front. Plant Sci. 2024, 15, 1321210. [Google Scholar] [CrossRef]
  39. Shofian, N.M.; Hamid, A.A.; Osman, A.; Saari, N.; Anwar, F.; Pak Dek, M.S.; Hairuddin, M.R. Effect of Freeze-Drying on the Antioxidant Compounds and Antioxidant Activity of Selected Tropical Fruits. Int. J. Mol. Sci. 2011, 12, 4678–4692. [Google Scholar] [CrossRef]
  40. Park, H.; Kwon, N.R.; Park, J.E.; Shin, H.; Kim, J.-H.; Eom, H.-J. Quality Characteristics of Campbell Early Added Korean Traditional Wines (Yakju) with Different Yeast and Pretreatment. Korean J. Food Nutr. 2024, 37, 57–66. [Google Scholar]
  41. Behfar, M.; Heshmati, A.; Mehri, F.; Khaneghah, A.M. Removal of Ochratoxin A from Grape Juice by Clarification: A Response Surface Methodology Study. Foods 2022, 11, 1432. [Google Scholar] [CrossRef]
  42. Thi, N.D.; Hwang, E.-S. Effects of Drying Methods on Contents of Bioactive Compounds and Antioxidant Activities of Black Chokeberries (Aronia Melanocarpa). Food Sci. Biotechnol. 2016, 25, 55–61. [Google Scholar] [CrossRef]
  43. Nayak, B.; Liu, R.H.; Tang, J. Effect of Processing on Phenolic Antioxidants of Fruits, Vegetables, and Grains—A Review. Crit. Rev. Food Sci. Nutr. 2015, 55, 887–918. [Google Scholar] [CrossRef] [PubMed]
  44. Zarzycki, P.; Ciolkowska, A.E.; Jablonska-Rys, E.; Gustaw, W. Rheological Properties of Milk-Based Desserts with the Addition of Oat Gum and Kappa-Carrageenan. J. Food Sci. Technol. 2019, 56, 5107–5115. [Google Scholar] [CrossRef] [PubMed]
  45. Jang, H.; Lee, J.; Kim, M.; Kim, I.; Ha, J.-H. Physicochemical Characteristics and Sensory Attributes of Yanggaeng Treated with Corni fructus Powder: A Pilot Study. Appl. Sci. 2023, 13, 2839. [Google Scholar] [CrossRef]
  46. Meyners, M.; Castura, J.C.; Carr, B.T. Existing and new approaches for the analysis of CATA data. Food Qual. Prefer. 2013, 30, 309–319. [Google Scholar] [CrossRef]
  47. Kwon, Y.; Ryu, J.; Ju, S. Sensory Attributes of Buckwheat Jelly (Memilmuk) with Mung Bean Starch Added to Improve Texture and Taste. Foods 2021, 10, 2860. [Google Scholar] [CrossRef]
  48. Næs, T.; Tomic, O.; Endrizzi, I.; Varela, P. Principal Components Analysis of Descriptive Sensory Data: Reflections, Challenges, and Suggestions. J. Sens. Stud. 2021, 36, e12692. [Google Scholar] [CrossRef]
Figure 1. Schematic diagram of the manufacturing process and classification of Yanggang.
Applsci 15 07291 g001
Figure 2. Visual comparison of Yanggaeng made with added grape powder or juice. BY: control, PG: Powder Campbell Early, PK: Powder Kyoho, PS: Powder Shine Muscat, JG: Juice Campbell Early, JK: Juice Kyoho, JS: Juice Shine Muscat. All samples contained either 2, 4, or 8% grape powder or juice.
Applsci 15 07291 g002
Figure 3. Correspondence analysis biplot based on CATA data for different Yanggaeng. The plot shows the relationships between products and sensory attributes along dimensions F1 (74.82%) and F2 (14.59%). BY: control, PG: Powder Campbell Early, PK: Powder Kyoho, PS: Powder Shine Muscat, JG: Juice Campbell Early, JK: Juice Kyoho, JS: Juice Shine Muscat. All samples contained 8% grape powder or juice. Statistical analysis was performed using XLSTAT 2025 software.
Applsci 15 07291 g003
Figure 4. Principal component analysis (PCA) correlation circle of sensory attributes of Yanggaeng products. The plot displays the distribution of active variables along the first two principal components: PC1 (20.88%) and PC2 (13.33%). BY: control, PG: Powder Campbell Early, PK: Powder Kyoho, PS: Powder Shine Muscat, JG: Juice Campbell Early, JK: Juice Kyoho, JS: Juice Shine Muscat. All samples contained 8% grape powder or juice. Statistical analysis was performed using XLSTAT 2025 software.
Applsci 15 07291 g004
Table 1. Formulation of Yanggaeng added with grape powder or juice.
Ingredients (g)Samples
BY (Control)Juice Yanggaeng (1)Powder Yanggaeng (2)
2%4%8%2%4%8%
Cooked White Bean100989692989692
Water8062448808080
Grape Powder0000248
Grape Juice0204080000
Sugar20202020202020
Agar2222222
(1) Juice Yanggaeng: JY. (2) Powder Yanggaeng: PY.
Table 2. Texture profile analysis conditions.
Texture Analyzer TPA (Texture Profile Analysis)
Probe type35 mm flat probe
Pre-test speed2 mm/s
Test speed2 mm/s
Post-test speed30 mm/s
Trigger force0.5 N
Table 3. Hunter’s color value of Yanggaeng containing grape powder or juice.
Sample (1)Hunter’s Color Values
L*a*b*
BY28.82 ± 2.43 (2)a3.21 ± 0.94 a6.52 ± 0.96 b
PG 2%27.19 ± 2.91 a3.84 ± 1.27 a7.12 ± 1.28 a
PG 4%26.19 ± 1.67 a4.42 ± 0.62 a7.52 ± 0.48 a
PG 8%20.62 ± 1.43 b7.57 ± 1.06 a10.31 ± 0.85 a
PK 2%22.05 ± 3.16 b5.91 ± 2.14 a9.00 ± 1.89 a
PK 4%24.82 ± 2.17 b4.16 ± 1.02 a6.97 ± 0.82 a
PK 8%21.48 ± 1.14 b6.13 ± 0.69 a8.82 ± 0.60 a
PS 2%26.58 ± 1.01 ab3.58 ± 0.43 a7.02 ± 0.49 a
PS 4%24.36 ± 0.48 b4.14 ± 0.18 a7.55 ± 0.25 a
PS 8%25.18 ± 3.14 ab3.80 ± 1.39 a8.06 ± 1.08 a
JG 2%19.50 ± 0.67 b7.21 ± 0.52 b9.67 ± 0.52 b
JG 4%23.15 ± 3.08 b5.26 ± 1.76 bc8.10 ± 1.23 bc
JG 8%10.11 ± 1.46 c17.06 ± 2.03 a15.67 ± 0.26 a
JK 2%24.76 ± 2.64 a3.86 ± 1.07 b6.79 ± 0.97 b
JK 4%16.74 ± 1.94 c8.33 ± 1.54 a10.73 ± 1.36 a
JK 8%19.49 ± 1.21 bc7.37 ± 0.83 a10.08 ± 0.58 a
JS 2%25.64 ± 1.60 ab3.90 ± 0.74 a7.56 ± 0.67 b
JS 4%20.84 ± 3.22 b5.78 ± 2.24 a9.45 ± 1.88 ab
JS 8%20.45 ± 2.02 b6.28 ± 1.36 a10.91 ± 1.19 a
(1) BY: control, PG: Powder Campbell Early, PK: Powder Kyoho, PS: Powder Shine Muscat, JG: Juice Campbell Early, JK: Juice Kyoho, JS: Juice Shine Muscat. All samples contained either 2, 4, or 8% grape powder or juice. (2) a~c Different superscripts within the same column differed significantly using Tukey’s honest significant difference (HSD) test at p < 0.05. All values are mean ± SD (n = 3).
Table 4. The solid content, Brix, and MC of Yanggaeng containing grape powder or juice.
Sample (1)Soluble Solids Content (%)Brix (%)MC (%)
BY3.87 ± 0.05 (2)f4.04 ± 0.02 h53.19 ± 1.46 ab
PG 2%4.52 ± 0.11 cde4.64 ± 0.01 cd52.18 ± 0.77 abcd
PG 4%4.71 ± 0.19 bcd4.72 ± 0.01 bcd52.08 ± 1.86 abcd
PG 8%4.45 ± 0.02 de4.23 ± 0.01 f48.96 ± 0.25 def
PK 2%6.01 ± 0.07 bc4.66 ± 0.02 bcd50.78 ± 0.83 abcde
PK 4%4.33 ± 0.13 b4.73 ± 0.02 bc52.68 ± 0.93 abc
PK 8%4.71 ± 0.05 bc4.72 ± 0.01 bcd48.43 ± 1.13 ef
PS 2%4.91 ± 0.17 a5.81 ± 0.00 a52.13 ± 0.86 abcd
PS 4%4.72 ± 0.13 e4.14 ± 0.00 fg52.12 ± 0.53 abcd
PS 8%4.62 ± 0.11 bcd4.65 ± 0.00 cd51.21 ± 1.03 abcde
JG 2%4.87 ± 0.09 bcd4.75 ± 0.02 b51.33 ± 0.44 abcde
JG 4%4.8 ± 0.01 de4.38 ± 0.07 e52.13 ± 1.31 abcd
JG 8%4.85 ± 0.14 bc4.75 ± 0.01 b49.38 ± 0.85 cdef
JK 2%4.77 ± 0.11 b4.75 ± 0.02 b53.87 ± 2.65 a
JK 4%4.42 ± 0.17 bcd4.62 ± 0.01 d48.19 ± 0.94 efg
JK 8%4.82 ± 0.15 bcde4.41 ± 0.01 e45.79 ± 0.27 efg
JS 2%4.75 ± 0.06 bcd4.63 ± 0.01 cd49.72 ± 1.3 bcde
JS 4%4.56 ± 0.12 cde4.47 ± 0.03 e49.46 ± 1.46 cde
JS 8%4.33 ± 0.08 e4.12 ± 0.10 gh44.74 ± 0.8 g
(1) BY: control, PG: Powder Campbell Early, PK: Powder Kyoho, PS: Powder Shine Muscat, JG: Juice Campbell Early, JK: Juice Kyoho, JS: Juice Shine Muscat. All samples contained either 2, 4, or 8% grape powder or juice. (2) a~h Different superscripts within the same column differed significantly using Tukey’s honest significant difference (HSD) test at p < 0.05. All values are mean ± SD (n = 3).
Table 5. pH and total acidity of Yanggaeng with added grape powder or juice.
Sample (1)pHTTA
BY6.74 ± 0.02 (2)ab0.13 ± 0.00 f
PG 2%6.91 ± 0.09 a0.13 ± 0.00 f
PG 4%6.69 ± 0.24 ab0.13 ± 0.00 f
PG 8%5.9 ± 0.12 d0.19 ± 0.00 def
PK 2%6.62 ± 0.1 ab0.13 ± 0.00 f
PK 4%6.52 ± 0.25 ab0.19 ± 0.00 def
PK 8%6.08 ± 0.07 cd0.26 ± 0.00 bcd
PS 2%6.78 ± 0.12 ab0.15 ± 0.04 ef
PS 4%6.62 ± 0.16 ab0.19 ± 0.00 def
PS 8%6.66 ± 0.15 ab0.21 ± 0.04 cde
JG 2%6.7 ± 0.2 ab0.19 ± 0.00 def
JG 4%6.05 ± 0.2 cd0.23 ± 0.04 bcd
JG 8%5.12 ± 0.03 e0.28 ± 0.04 bc
JK 2%6.38 ± 0.03 bc0.19 ± 0.00 def
JK 4%6.04 ± 0.05 cd0.26 ± 0.00 bcd
JK 8%5.36 ± 0.11 e0.36 ± 0.04 a
JS 2%6.55 ± 0.03 ab0.19 ± 0.00 def
JS 4%6.52 ± 0.07 ab0.23 ± 0.04 bcd
JS 8%6.52 ± 0.09 ab0.3 ± 0.04 ab
(1) BY: control, PG: Powder Campbell Early, PK: Powder Kyoho, PS: Powder Shine Muscat, JG: Juice Campbell Early, JK: Juice Kyoho, JS: Juice Shine Muscat. All samples contained either 2, 4, or 8% grape powder or juice. (2) a~f Different superscripts within the same column differed significantly using Tukey’s honest significant difference (HSD) test at p < 0.05. All values are mean ± SD (n = 3).
Table 6. Total phenol content and DPPH and ABTS radical-scavenging activities of Yanggaeng containing grape powder or juice.
Sample (1)Total Polyphenol Content (μg GAE/mg (3))DPPH Radical-Scavenging
Activity (μg AAE/mg)
ABTS Radical-Scavenging
activity (μg AAE/mg)
BY451.94 ± 14.18 (2)c249.40 ± 22.91 a629.33 ± 121.10
PG465.67 ± 9.43 bc213.69 ± 49.17 a635.05 ± 87.47
PK451.94 ± 4.32 bc210.71 ± 27.88 a665.52 ± 159.63
PS451.94 ± 11.44 c72.32 ± 17.86 b642.67 ± 150.14
JG480.65 ± 2.16 b222.62 ± 9.29 a650.29 ± 97.48
JK508.12 ± 12.04 a302.98 ± 84.98 a644.57 ± 155.55
JS523.10 ± 5.72 a189.88 ± 42.43 ab880.76 ± 180.01
(1) BY: control, PG: Powder Campbell Early, PK: Powder Kyoho, PS: Powder Shine Muscat, JG: Juice Campbell Early, JK: Juice Kyoho, JS: Juice Shine Muscat. All samples contained 8% grape powder or juice. (2) a~c Different superscripts within the same column differed significantly using Tukey’s honest significant difference (HSD) test at p < 0.05. All values are mean ± SD (n = 3). (3) GAE: gallic acid equivalent, AAE: ascorbic acid equivalent.
Table 7. Textural properties of Yanggaeng containing grape powder or juice.
Sample (1)HardnessCohesivenessSpringinessAdhesivenessFracturabilityChewinessGumminess
BY375.20 ± 32.40 (2)d0.22 ± 0.01 ab0.79 ± 0.09 a−66.47 ± 17.27 c193.38 ± 17.16 cd65.63 ± 11.26 c82.46 ± 9.32 cd
PG524.60 ± 71.20 c0.20 ± 0.02 ab0.57 ± 0.07 c−43.27 ± 15.75 ab320.30 ± 42.00 b61.02 ± 17.03 c106.34 ± 19.88 c
PK675.30 ± 51.10 b0.21 ± 0.01 ab0.71 ± 0.06 ab−30.44 ± 7.47 a325.24 ± 27.86 b102.06 ± 18.45 b143.37 ± 15.28 b
PS404.60 ± 90.50 d0.22 ± 0.03 ab0.70 ± 0.04 ab−37.23 ± 8.02 ab194.70 ± 74.20 cd63.37 ± 18.40 c90.20 ± 23.36 cd
JG367.84 ± 30.48 d0.21 ± 0.03 ab0.79 ± 0.09 a−46.75 ± 7.08 b198.50 ± 18.08 c61.63 ± 10.17 c77.55 ± 8.55 d
JK256.90 ± 33.50 e0.19 ± 0.03 b0.66 ± 0.12 bc−43.44 ± 10.28 ab138.58 ± 8.31 d33.39 ± 10.32 d49.43 ± 7.14 e
JS840.40 ± 81.10 a0.23 ± 0.04 a0.69 ± 0.09 ab−35.49 ± 5.35 ab470.00 ± 58.20 a136.90 ± 37.20 a195.50 ± 33.10 a
(1) BY: control, PG: Powder Campbell Early, PK: Powder Kyoho, PS: Powder Shine Muscat, JG: Juice Campbell Early, JK: Juice Kyoho, JS: Juice Shine Muscat. All samples contained 8% grape powder or juice. (2) a~e Different superscripts within the same column differed significantly using Tukey’s honest significant difference (HSD) test at p < 0.05. All values are mean ± SD (n = 3).
Table 8. Consumers’ preferences for Yanggaeng containing grape powder or juice.
Sample (1)ColorSweetnessSournessAromaHardnessChewinessOverall Acceptability
BY6.06 ± 2.075.90 ± 1.714.78 ± 2.465.22 ± 2.075.40 ± 2.066.12 ± 1.806.20 ± 1.76 (2)a
PG5.50 ± 1.975.92 ± 2.075.08 ± 2.064.94 ± 1.825.54 ± 1.735.70 ± 1.675.02 ± 2.28 ab
PK5.48 ± 1.855.44 ± 1.904.74 ± 2.024.30 ± 1.815.50 ± 1.335.74 ± 1.634.94 ± 2.14 ab
PS5.62 ± 1.895.36 ± 1.634.54 ± 2.084.60 ± 1.755.34 ± 1.485.26 ± 1.695.08 ± 1.94 ab
JG5.42 ± 1.805.84 ± 1.684.56 ± 2.114.58 ± 2.205.98 ± 2.235.74 ± 1.804.88 ± 2.34 b
JK5.63 ± 2.016.00 ± 1.974.70 ± 2.225.04 ± 1.965.72 ± 1.715.98 ± 1.585.54 ± 2.18 ab
JS5.66 ± 2.295.76 ± 1.925.00 ± 2.604.72 ± 2.135.82 ± 2.105.38 ± 2.114.91 ± 2.49 b
(1) BY: control, PG: Powder Campbell Early, PK: Powder Kyoho, PS: Powder Shine Muscat, JG: Juice Campbell Early, JK: Juice Kyoho, JS: Juice Shine Muscat. All samples contained 8% grape powder or juice. (2) a~b Different superscripts within the same column differed significantly using Tukey’s honest significant difference (HSD) test at p < 0.05.
Disclaimer/Publisher’s Note: The statements, opinions and data contained in all publications are solely those of the individual author(s) and contributor(s) and not of MDPI and/or the editor(s). MDPI and/or the editor(s) disclaim responsibility for any injury to people or property resulting from any ideas, methods, instructions or products referred to in the content.

