Abstract
The efficient separation of chalcopyrite from molybdenite is crucial for the utilization of copper–molybdenum ores and is inevitably influenced by the presence of metal ions in the pulp. However, the underlying impact mechanisms remain unclear. This study systematically investigated the influence of Cu2+ on the flotation separation of chalcopyrite and molybdenite, with sodium thioglycolate (STG) as a depressant. Flotation experiments revealed that Cu2+ in the STG system significantly reduced molybdenite recovery and hindered selective separation. Characterization using contact angle, zeta potential, and UV–Vis analysis demonstrated that the presence of Cu2+ triggered STG adsorption on the molybdenite surface, thereby increasing its hydrophilicity. XPS analysis showed that Cu2+ adsorbed onto the molybdenite surface as Cu(I), creating reactive sites for the –SH or –COO− groups in STG. This interaction forms a stable molybdenite–Cu(I)–STG complex through chemisorption, significantly suppressing molybdenite flotation. DFT calculations further demonstrated that Cu2+ enhanced the reactivity between STG and molybdenite. These findings provide a comprehensive understanding of the influences of Cu2+ on the flotation separation between chalcopyrite from molybdenite, providing valuable insights into further optimizing copper–molybdenum flotation separation processes.
1. Introduction
Molybdenum and copper are indispensable to modern industry, finding widespread applications in power transmission, electronics manufacturing, construction materials, and high-temperature alloys, owing to their outstanding mechanical strength, electrical conductivity, and corrosion resistance [1,2,3,4]. More than 75% of the world’s copper and a significant portion of molybdenum are extracted from porphyry copper deposits, which serve as the primary source for both metals [5,6]. The recovery of copper and molybdenum from porphyry deposits commonly employs a two-step flotation strategy. Bulk flotation is initially conducted to generate a mixed concentrate, then followed by selective flotation, where molybdenite (MoS2) is floated and chalcopyrite (CuFeS2) is depressed to achieve separation [7,8,9]. In practice, kerosene is commonly used as the collector, while depressants such as sodium sulfide or sodium thioglycolate (STG) are applied to selectively inhibit copper minerals [6,10,11]. The high efficiency and selectivity of the interaction between depressant and mineral emerges as the crucial point for successful chalcopyrite–molybdenite flotation separation.
On the other hand, the presence of metal ions in the pulp has been confirmed exhibiting significant impacts on flotation performance [12,13,14]. For instance, in lead–zinc sulfide ores containing zinc sulfate and ferrous sulfate, the addition of lime is typically restricted because it induces the precipitation of metal hydroxides such as Zn(OH)2, Fe(OH)2, and Fe(OH)3, which severely depress both sphalerite and galena [15,16,17]. Similarly, in alkaline seawater environments (pH > 9), Ca2+ and Mg2+ precipitation as insoluble carbonates and hydrophilic hydroxides on mineral surfaces adversely affect the flotation performance of chalcopyrite and molybdenite [18]. During the flotation of gold-bearing pyrite, hydroxide films from Cu2+, Fe2+, and Fe3+ hinder collector adsorption [19], while Fe2+ adsorption during smithsonite sulfidization produces hydrophilic FeOOH species that decrease reactive sites [20]. Moreover, ions like Cu2+, Pb2+, and Fe3+ tend to adsorb onto molybdenite surfaces as hydroxy complexes, elevating zeta potentials and generating precipitates that inhibit molybdenite flotation [5,21]. Although the effects of metal ions in various flotation systems have been extensively studied, relatively little attention has been paid to the specific impact of copper ions on the selective flotation of molybdenite in the presence of chalcopyrite, particularly under conditions involving STG as a depressant. This lack of understanding may hinder further optimization of copper–molybdenum separation processes.
This study systematically investigates the effect of Cu2+ (the primary metal ion in pulp) on the flotation behavior of chalcopyrite and molybdenite with kerosene as collector and STG as depressant. Flotation results demonstrated that Cu2+ exhibited negligible influence on the depressant performance of STG for chalcopyrite, while significantly affecting the molybdenite flotation. Detailed mechanism analysis revealed that Cu2+ was preferentially adsorbed onto the molybdenite surface as Cu(I), providing active sites for the chemisorption of STG molecules. This interaction formed a stable molybdenite–Cu(I)–STG surface complex, which significantly increased surface hydrophilicity and depressed molybdenite floatability. These findings clearly verify the influence of Cu2+ on the copper–molybdenum separation, conducive to developing more efficient separation techniques.
2. Experimental Section
2.1. Materials and Reagents
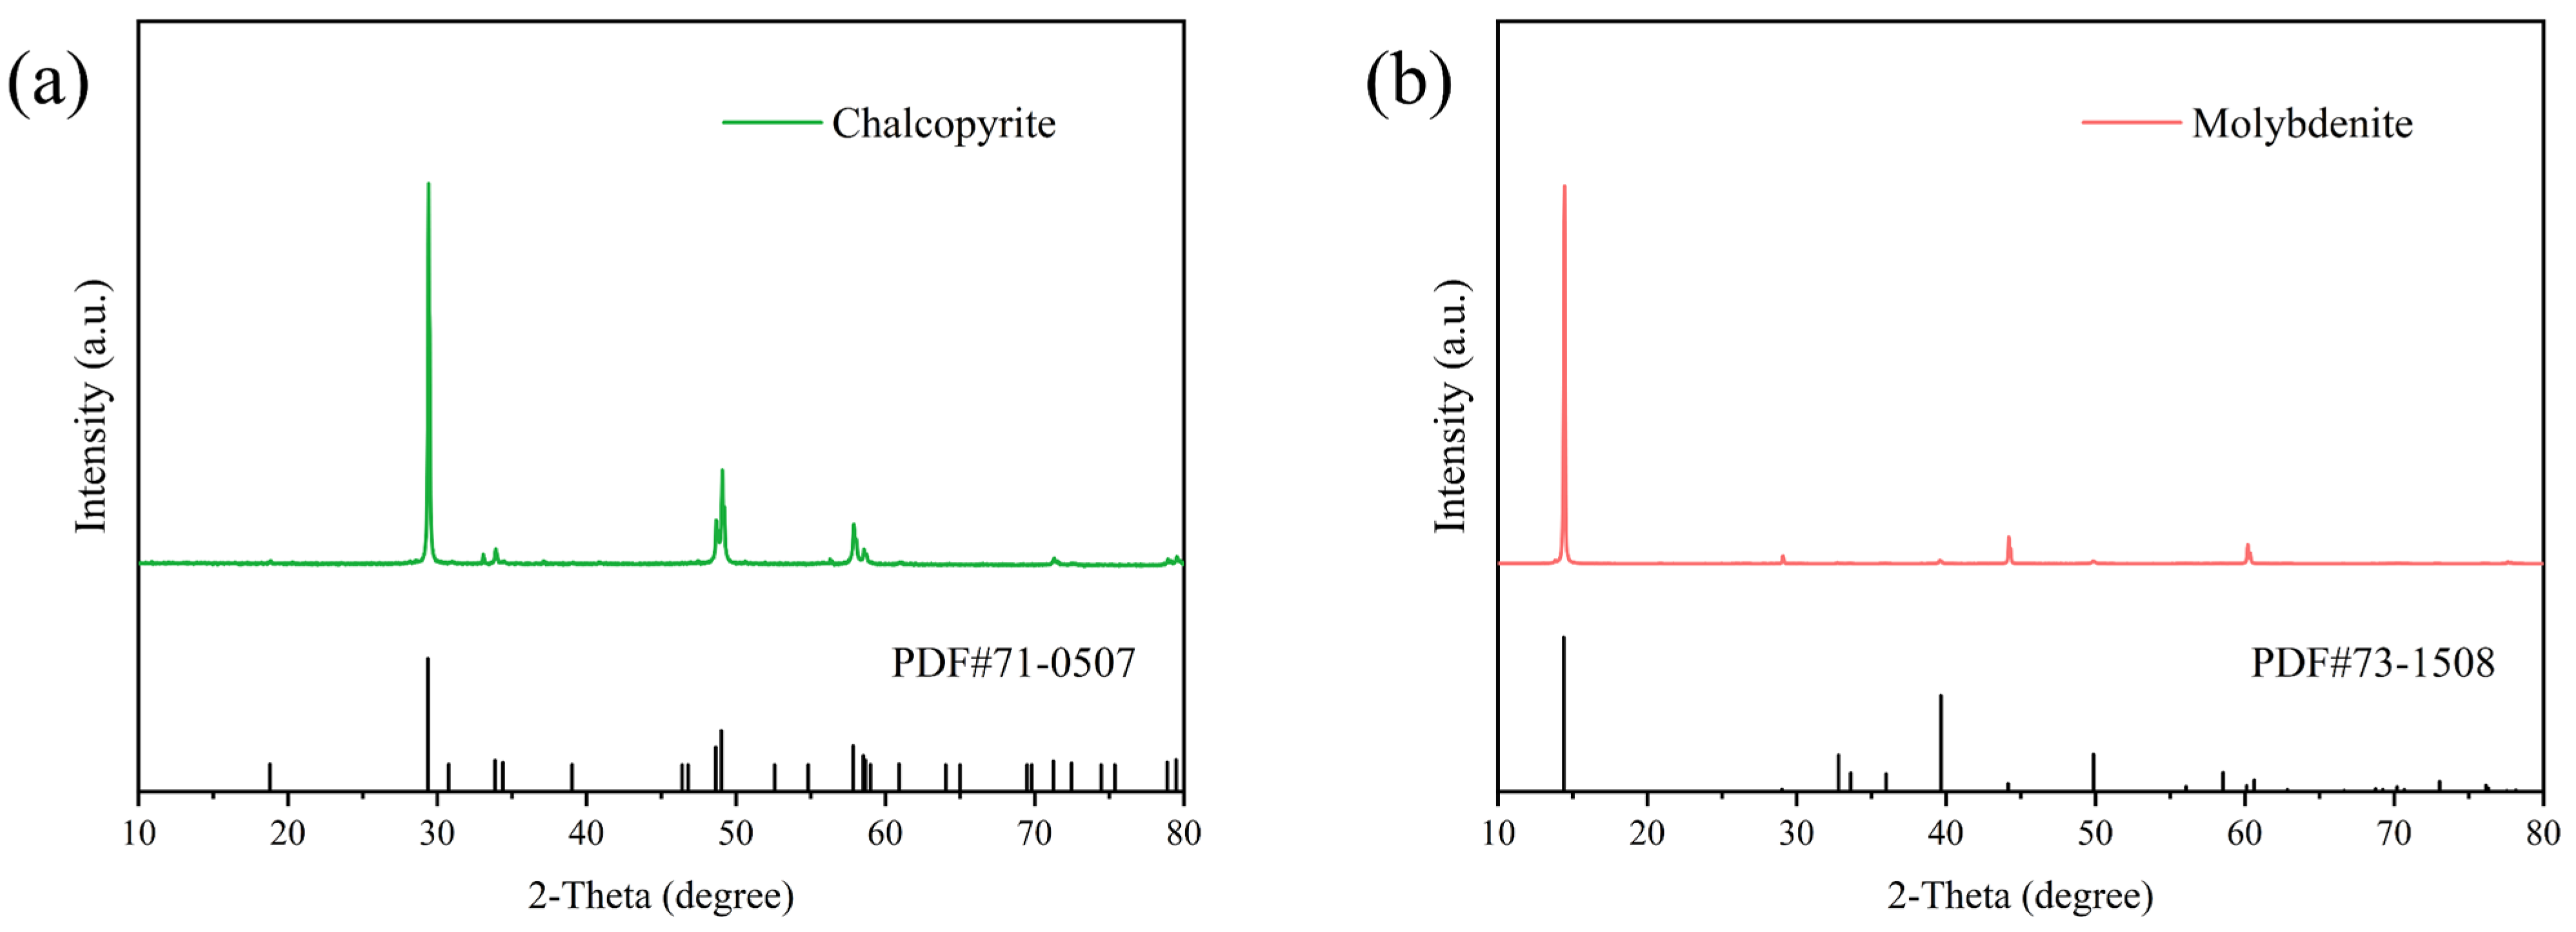
Raw chalcopyrite and molybdenite were procured from Yunnan and Jiangxi Province in China, respectively. The minerals were manually selected, crushed, ground, and then sieved to obtain various particle sizes. Particles in the −74 + 38 μm range were used for flotation experiments, while the finer particles (−38 μm) were reserved for XRD, contact angle, zeta potential and XPS analysis. XRD results (Figure 1) verified that the ores prepared were high purity, with no detectable impurity peaks, thereby meeting the quality standards for all experimental procedures.
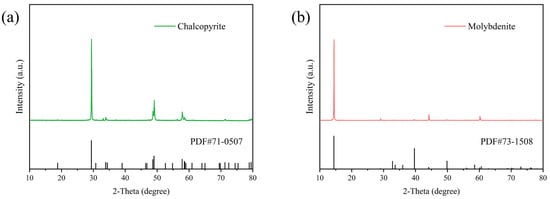
Figure 1.
XRD analysis of the minerals: (a) chalcopyrite and (b) molybdenite.
In each experiment, 18 MΩ·cm deionized (DI) water was used. Kerosene acted as the collector, while copper ions were introduced in the form of CuSO4·5H2O. Sodium thioglycolate (STG) and terpineol acted as the depressant and frother, respectively. The pulp pH was controlled with NaOH and HCl. Reagents such as kerosene, CuSO4·5H2O, STG, terpinol, NaOH, and HCl, were of analytical-grade and supplied by Aladdin.
2.2. Flotation Experiments
A micro-flotation machine (Jilin Mining Machinery Manufacturing Co., Ltd., Jilin, China) was employed to flotation experiments. In single-mineral tests, 2.0 g of individual mineral was placed in the flotation cell containing 40 mL of DI water. For the mixed ore tests, 1.0 g each of chalcopyrite and molybdenite was added to the flotation cell, following the same procedure. The suspension was then sonicated for 3 min to remove surface oxides. After cleaning, the pulp was stirred at 1680 r/min, and the pH was adjusted to 8.0, maintaining 3 min to ensure stability. Subsequently, copper ions were added and conditioned for 2 min, followed by depressant sodium thioglycolate (STG) (2 min), the collector kerosene (2 min), and frother terpinol (1 min), with continuous stirring throughout. Flotation was then performed for 3 min, during which the floated minerals were collected as concentrates along with the rising froth, while the remaining particles were recovered as tailings using filter paper.
2.3. Contact Angle Measurements
The contact angle of molybdenite samples was measured using a JC2000C contact angle goniometer (Zhongchen, Shanghai, China). For sample preparation, 40 mL of DI was combined with the mineral samples and reagents in a flotation cell, and the mixture was stirred for 10 min. After treatment, the samples were filtered, rinsed three times with DI water to eliminate residual reagents, and then vacuum dried at 30 °C for 8 h. The dried samples were subsequently compressed into pellets using a powder pellet press, with boric acid as the substrate, to ensure uniformity and stability during measurement. The contact angle was measured at three points on the pellet surface, and the average was recorded.
2.4. Zeta Potential Measurements
A Malvern analyzer (ZEN3600/Nano ZS, London, UK) determined the zeta potential of molybdenite before and after adsorption of Cu2+ and STG. In each test, 0.04 g of molybdenite was suspended in 40 mL of 1.0 × 10⁻³ mol/L KCl solution (pH 8.0). Cu2+ and STG were added successively, with each reagent mixed for 5 min, followed by an additional 5 min equilibration period to ensure adsorption equilibrium. After sedimentation, the clear supernatant was extracted using a syringe, avoiding disturbance of settled particles, and transferred into a zeta potential cuvette for measurement. All measurements were executed in triplicate, and both the corresponding mean value and standard deviation were recorded to ensure statistical reliability.
2.5. UV–Vis Spectrophotometer Measurement
A UV–Visible spectrophotometer (UV2600, Shimadzu, Japan) was used to measure the remaining concentration of STG in the solution after its interaction with molybdenite and Cu2+. The residual STG ratio was calculated by dividing the STG concentration in the solution after interaction with molybdenite and Cu2+ by the concentration of pure STG under identical conditions.
For the suspension preparation, 2.0 g molybdenite particles (−74 + 38 μm) were dispersed in 40 mL of DI water adjusted to pH 8.0. Then, a 1.0 × 10⁻³ mol/L STG was introduced to the suspension under varying conditions, with the treatment time consistent with that of the flotation experiments. After centrifuging for 10 min, the clear solution was carefully collected. The obtained solution was diluted 50 times, and the STG concentration was measured using the UV–Vis spectrophotometer.
2.6. XPS Analysis
XPS analysis was performed using a Thermo Fisher Scientific (Prague, Czech Republic) instrument equipped with a monochromatic Al Kα source. The analysis utilized an adjustable beam spot size ranging from 10 to 400 μm, operated at 15 kV and 10 mA. During data acquisition, the chamber pressure was maintained at 6 × 10⁻⁹ mbar. The system provided an energy resolution of 0.5 eV and a sensitivity of 4 Mcps at 1.0 eV. Sample preparation followed the same procedure as for contact angle measurements to ensure consistency.
2.7. DFT Calculation
The CASTEP program was employed to simulate how STG interacts with the molybdenite (001) surface, both with and without the presence of copper ions. This program offers an effective way to implement the DFT plane-wave pseudopotential approach [22,23,24,25], and is applied to optimize the geometry of adsorbate–surface systems. The PBE/GGA functional was adopted to treat exchange–correlation interactions [26]. An ultrasoft pseudopotential was employed to depict the electron–ion interactions [27,28,29]. In all calculations, the cutoff energy was selected to 500 eV, and the Monkhorst–Pack scheme was applied for k-space sampling. For electronic minimizer, the density mixing method was applied with a convergence tolerance of 2.0 × 10⁻⁶ eV/atom. The criteria for structure optimization and total energy calculations were set as follows: an energy tolerance of 2 × 10⁻⁵ eV/atom (a), a maximum force tolerance of 0.05 eV/Å (b), and a maximum displacement tolerance of 0.002 Å (c).
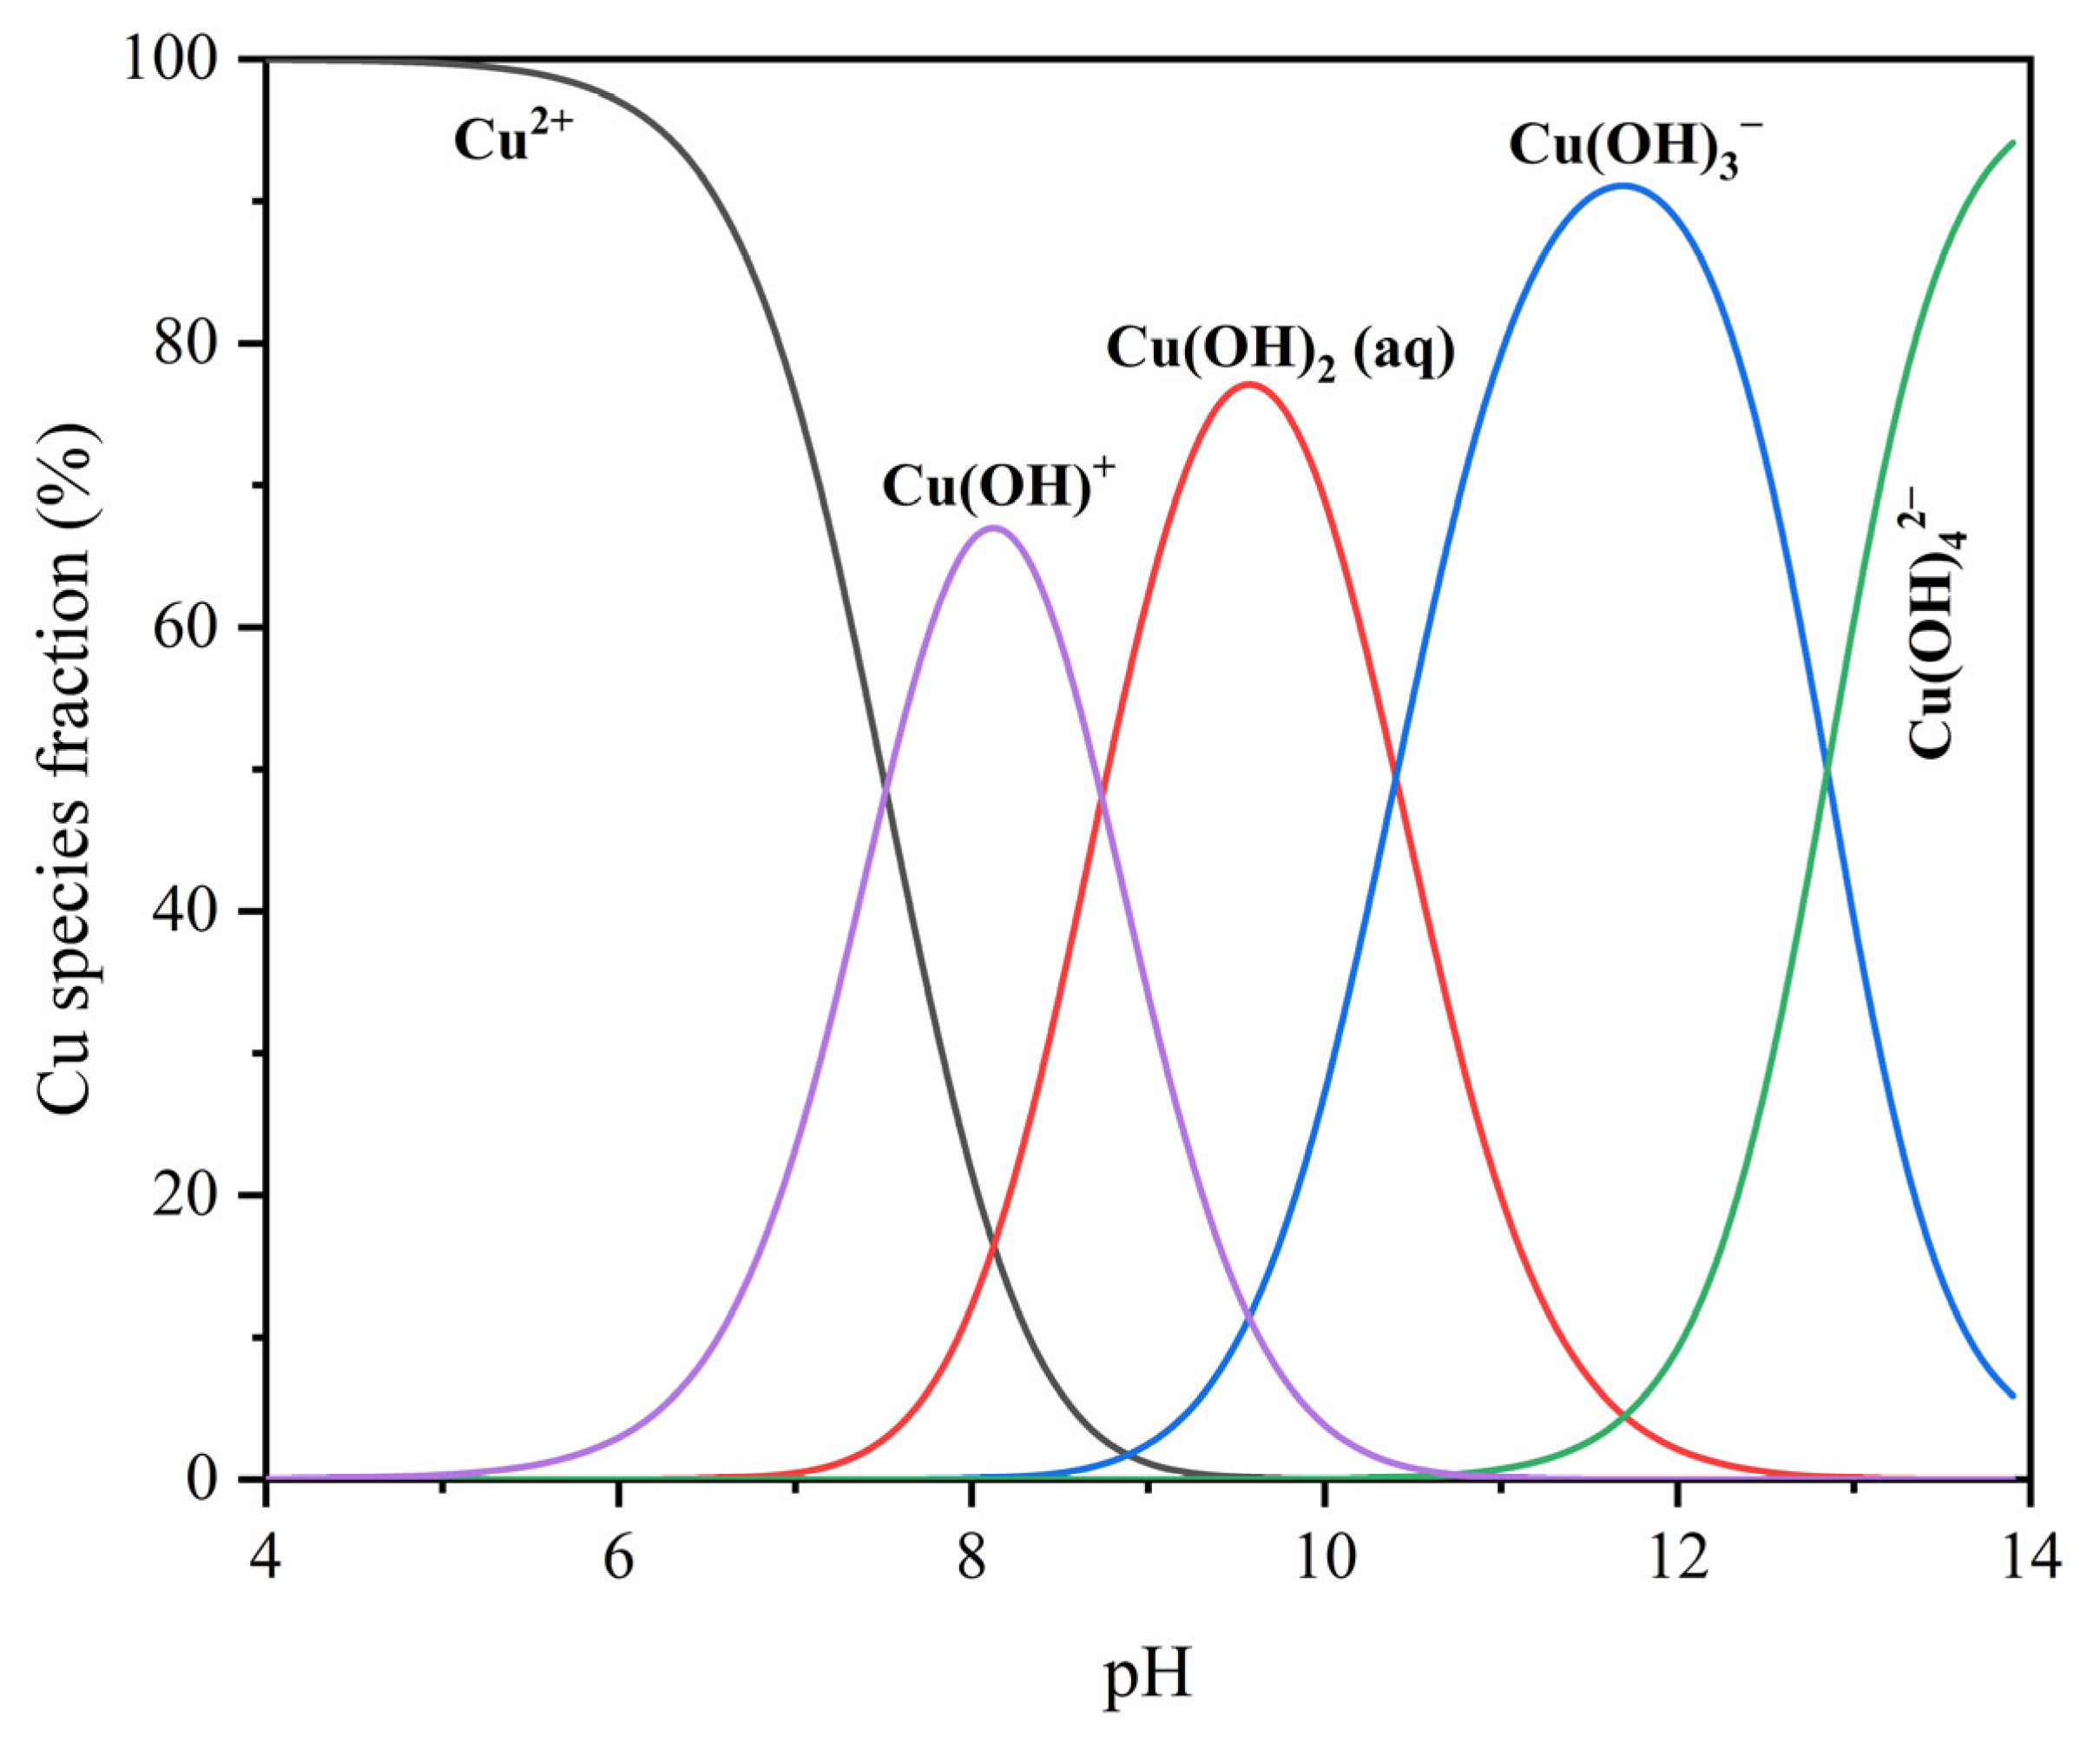
As shown in the distribution diagrams in Figure 2, the speciation calculations for 8 mg/L Cu2+ solution, as a function of pH, indicate that Cu2+ dominates under acidic conditions (pH < 6), while CuOH+ becomes the major species at approximately pH 8. At higher pH values, species such as Cu(OH)2(aq), Cu(OH)3−, and Cu(OH)42− gradually become dominant. Based on this trend, CuOH+ was selected as the representative hydrolyzed copper species under near-neutral conditions for subsequent DFT modeling.
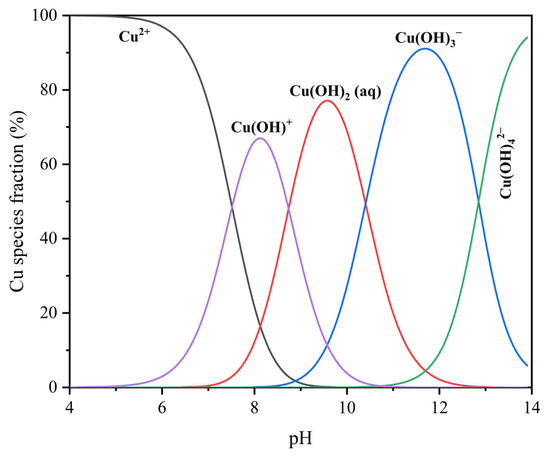
Figure 2.
Distribution diagrams of 8 mg/L Cu2+ solution as a function of pH.
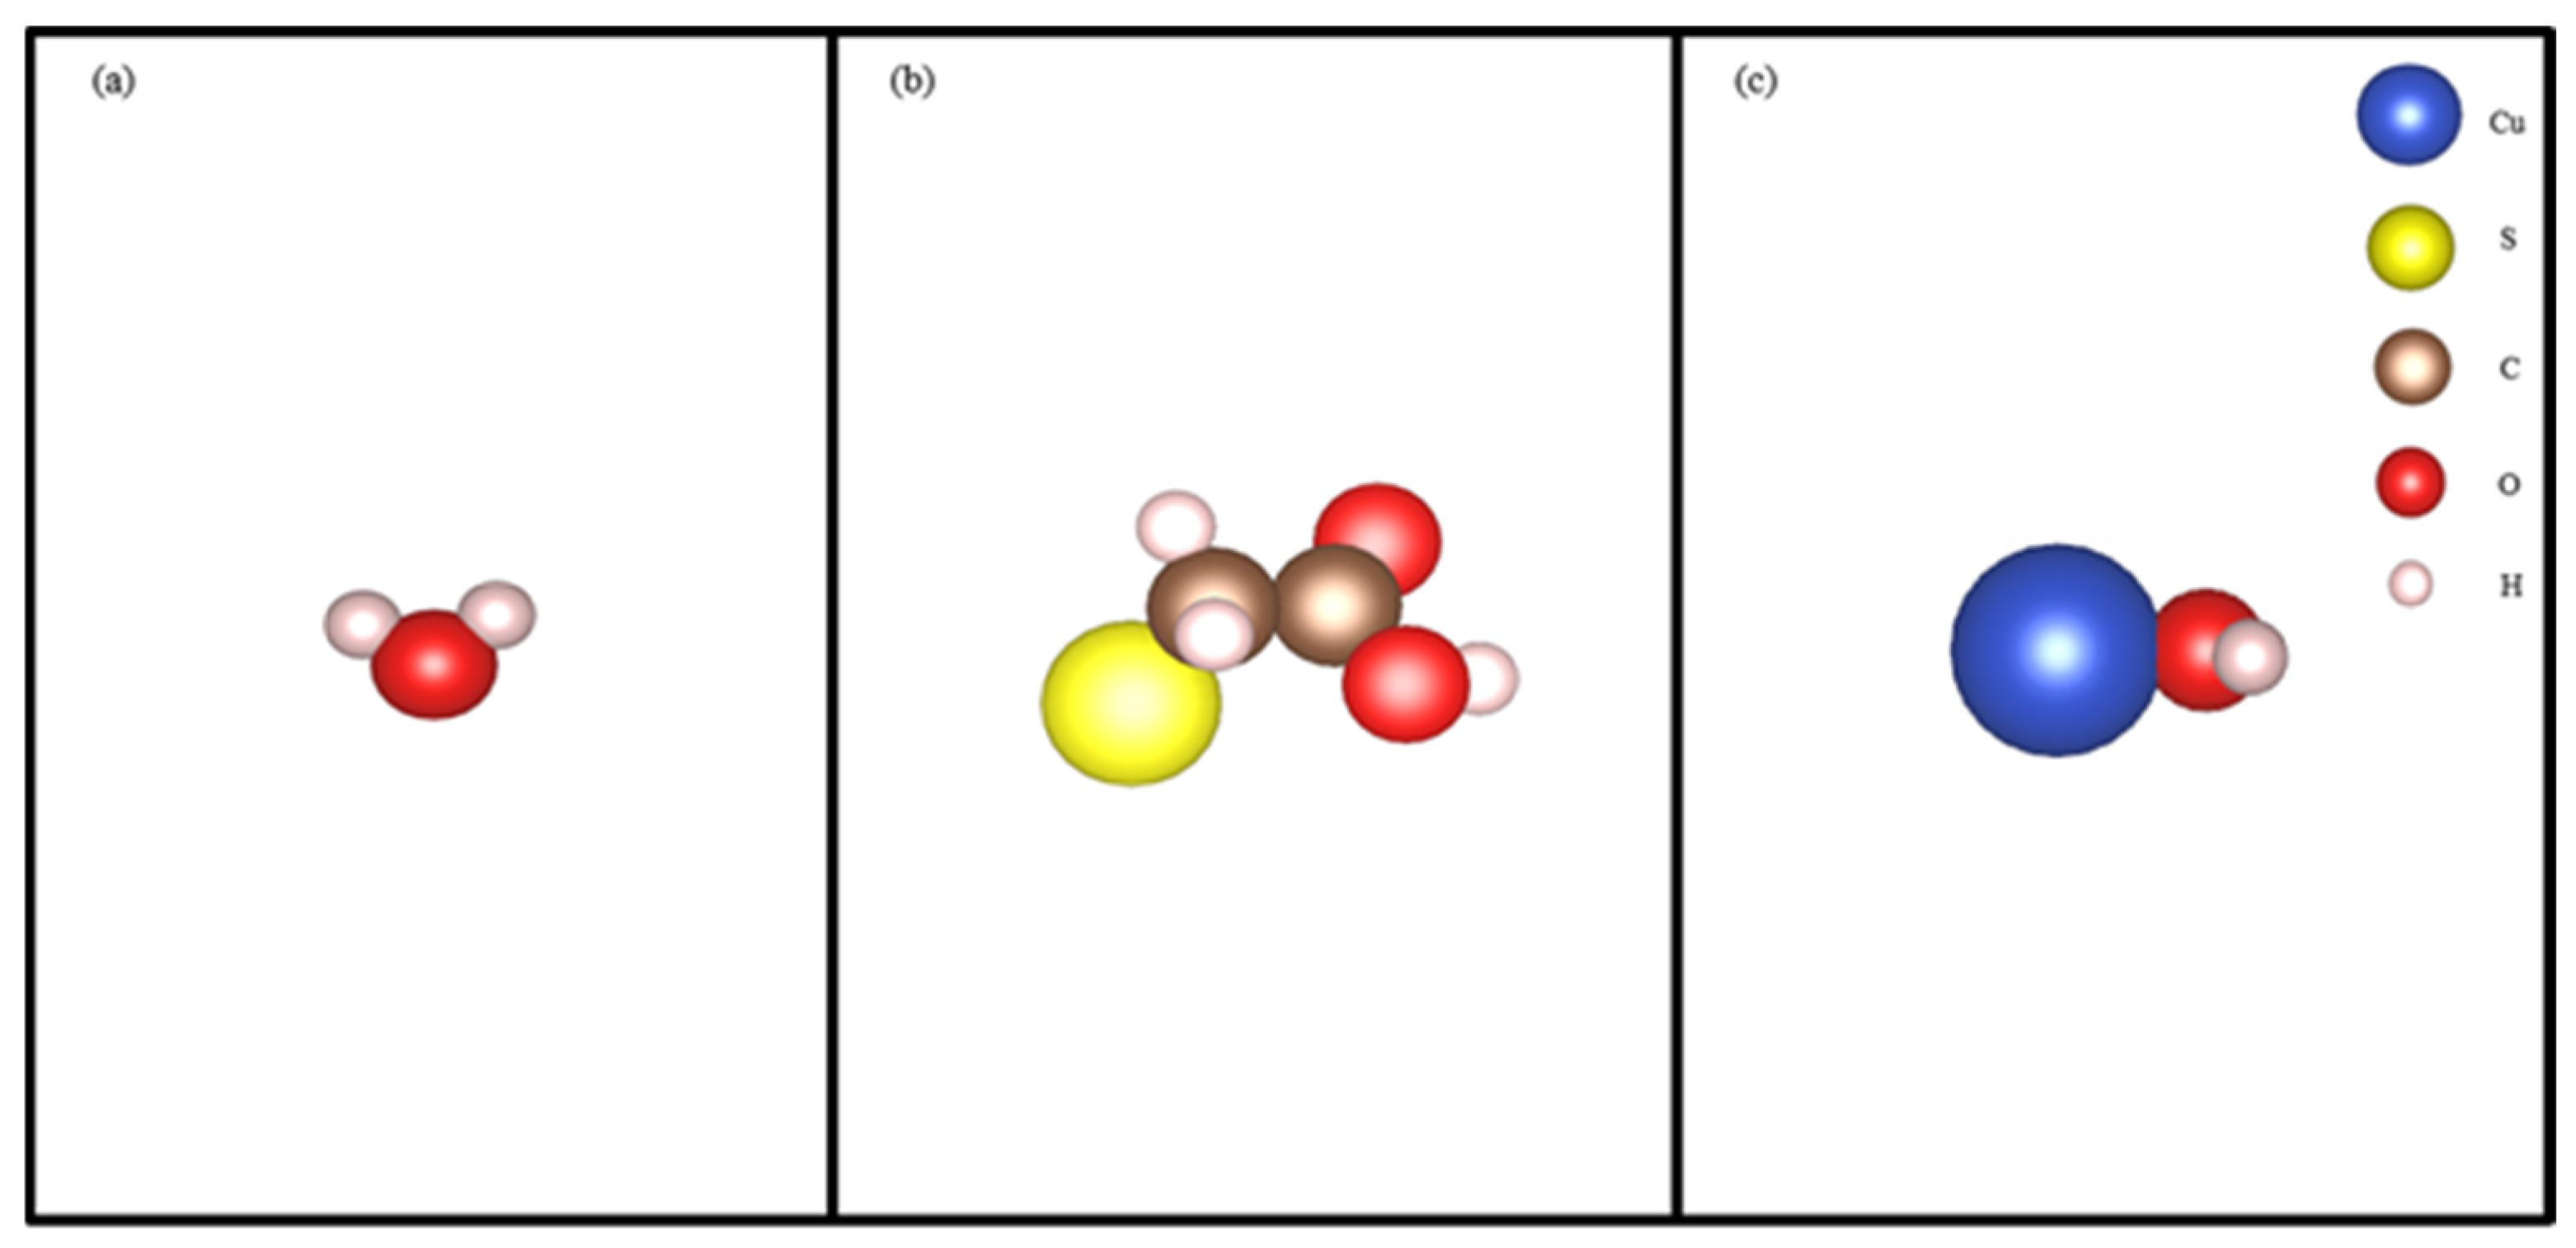
The optimized cell structure of molybdenite and the surface structure of molybdenite are shown in Figure 3. The molybdenite surface was modeled using a (7 × 3) MoS2 (001) surface supercell. This model included six atomic layers and a 30 Å vacuum region, which was sufficient to minimize any interaction between adjacent slabs. During the calculation, the three bottom atomic layers of the MoS2 (001) surface were fixed in place. The molecular structures of H2O, STG, and CuOH+ were pre-optimized and are shown in Figure 4. The hydrated structure of the molybdenite (001) surface, the STG adsorption structure on the hydrated molybdenite (001) surface, the CuOH+ adsorption structure on the hydrated molybdenite (001) surface, and the STG adsorption structure on the CuOH+-modified molybdenite (001) surface were further optimized on a one-by-one basis. The interaction energy between the adsorbate and the molybdenite (001) surface is expressed by the following equation:
Eads = Esurface + adsorbate − Esurface − Eadsorbate
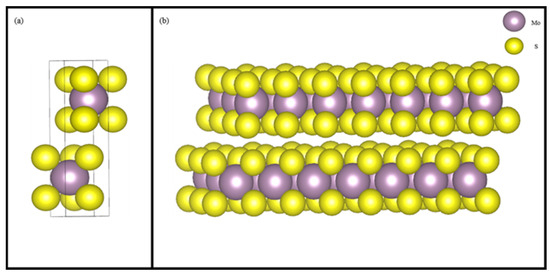
Figure 3.
Cell structure of molybdenite (a) and the (001) surface structure (b) of molybdenite.

Figure 4.
The molecular structure of H2O (a), STG (b), and CuOH+ (c).
Here, Esurface + adsorbate is the total energy before and after the interaction with the adsorbate, Esurface represents the surface, Eadsorbate is the adsorbate energy; and Eads is the adsorption energy between adsorbate and the molybdenite (001) surface. A more negative Eads implies a stronger adsorption tendency.
3. Results and Discussion
3.1. Flotation Experiments
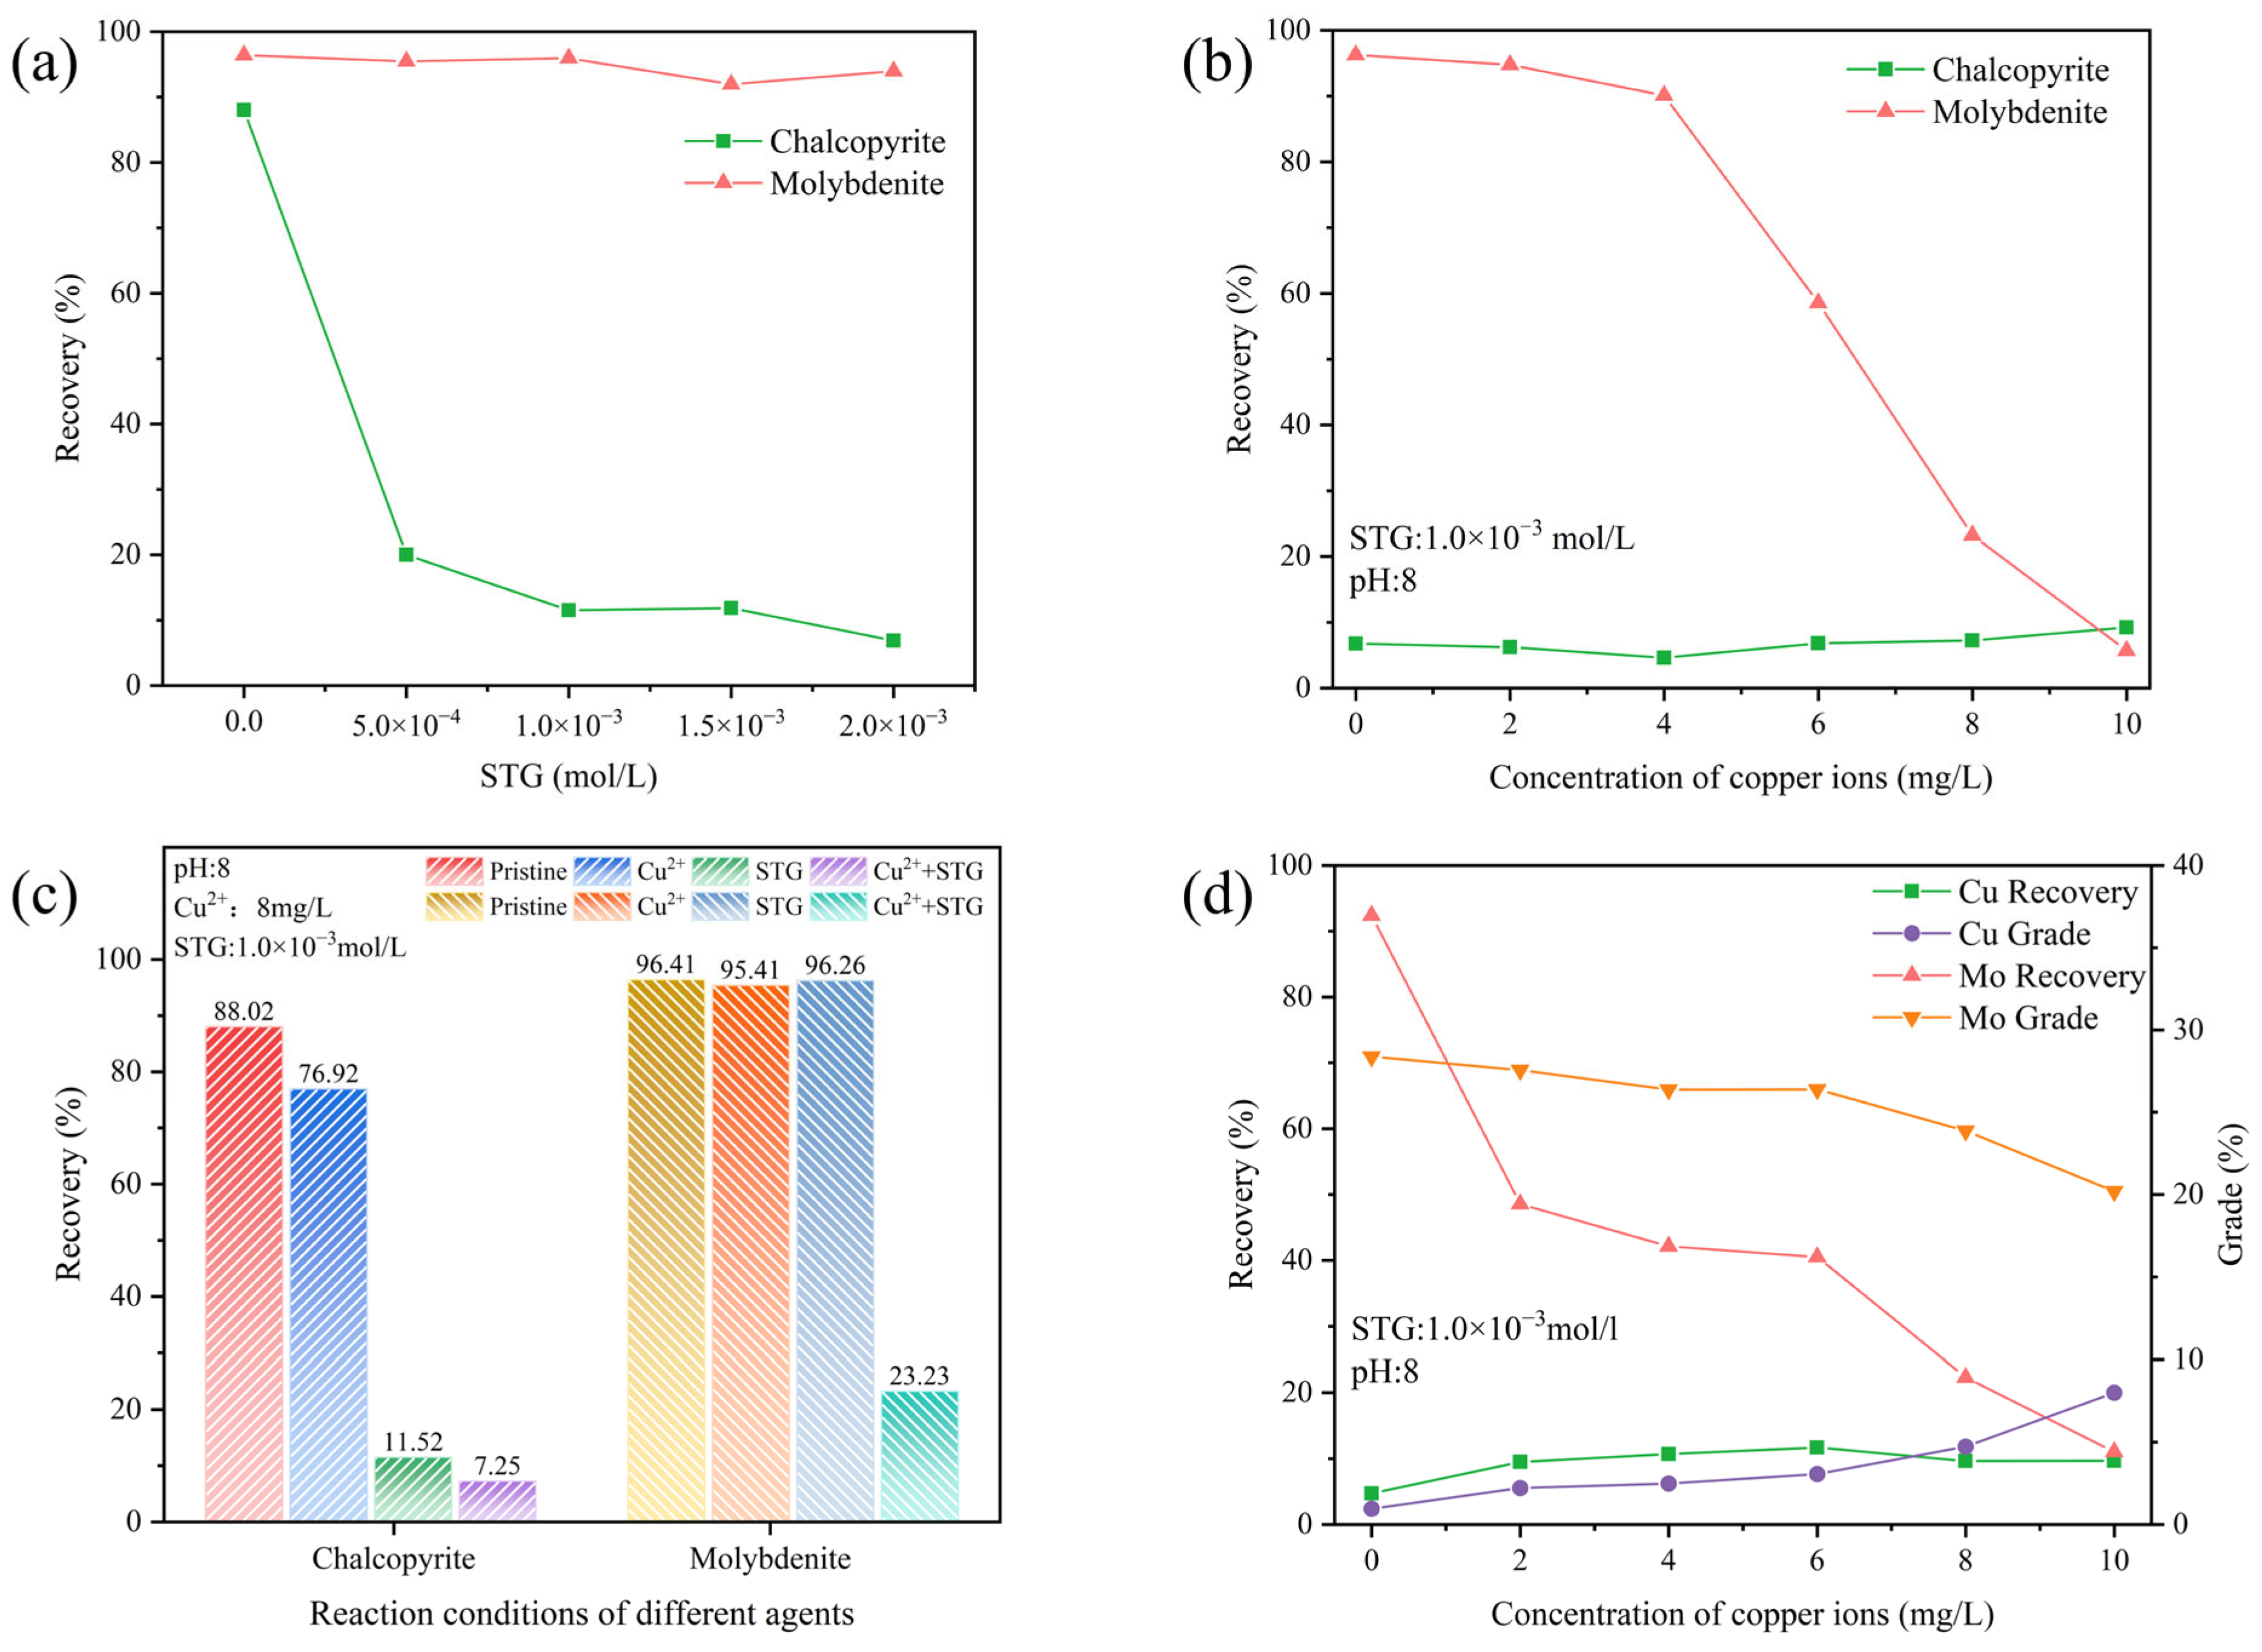
The impact of STG on the flotation behavior of chalcopyrite and molybdenite was explored through flotation tests, where the kerosene and terpinol concentrations were fixed at 2.0 × 10⁻⁴ mol/L and at 4.0 × 10⁻⁴ mol/L, respectively. Figure 5a illustrates that STG significantly inhibited the floatability of chalcopyrite, with its recovery progressively decreasing as the STG concentration increased. When the STG concentration reached 1.0 × 10⁻³ mol/L, chalcopyrite recovery declined to its lowest point, around 10%. In contrast, molybdenite recovery remained consistently above 90%, resulting in the largest observed separation between the flotation performances of the two minerals.
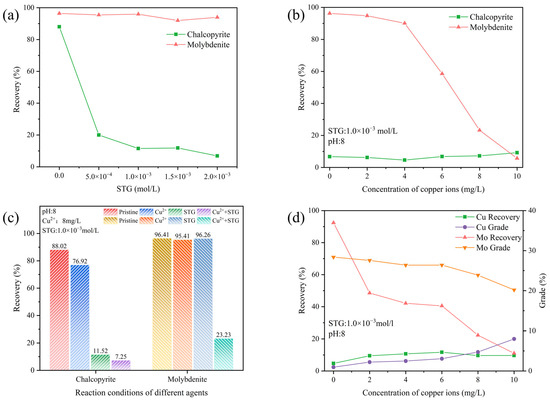
Figure 5.
Flotation behavior of chalcopyrite and molybdenite as affected by (a) STG concentration at natural pH; (b) Cu2+ concentration at pH 8 with 1.0 × 10⁻³ mol/L STG; (c) reagent conditions; and (d) Cu2+ concentration in an artificial mixed ore system at pH 8 with 1.0 × 10⁻³ mol/L STG.
To evaluate the impact of Cu2+ on the depressive action of STG on the flotation behavior of chalcopyrite and molybdenite, additional experiments were performed. The results, illustrated in Figure 5b, indicated that increasing Cu2+ concentration had little to no effect on chalcopyrite flotation, with its recovery consistently remaining below 10%. This stability suggested that chalcopyrite was already strongly depressed by STG, leaving minimal room for further suppression by Cu2+. In contrast, molybdenite exhibited significant sensitivity to Cu2+ addition. As Cu2+ concentration increased from 4 mg/L to 10 mg/L, molybdenite recovery drastically declined from over 90% to below 10%.
To further clarify whether the observed decrease in molybdenite recovery was solely attributed to Cu2+, various reagent conditions were tested through flotation experiments. Figure 5c shows that the recovery of pure chalcopyrite was 88.02% without metal ions or inhibitors. A slight decrease in recovery to 76.92% was observed following the addition of Cu2+ alone. However, when only STG was present, chalcopyrite recovery dropped significantly to 11.52%. The sequential addition of Cu2+ and STG still remained the chalcopyrite recovery below 10%, indicating that Cu2+ negligibly influenced the depression behavior of STG for chalcopyrite. For molybdenite, flotation recovery in the absence of metal ions or depressants was 96.41%. When either Cu2+ or STG was added separately, recovery remained high at 95.41% and 96.26%, respectively, indicating that molybdenite’s floatability was largely unaffected by these reagents individually. However, in the STG system with Cu2+, molybdenite recovery dropped sharply to 23.23% when the Cu2+ concentration was 8 mg/L. These findings revealed that the presence of Cu2+ in the STG system significantly suppressed the flotation performance of molybdenite, affecting the separation efficiency between molybdenite and chalcopyrite.
The impacts of Cu2+ on the flotation behavior of a chalcopyrite–molybdenite artificial mixture was further examined. As depicted in Figure 5d, increasing amount of Cu2+ resulted in a marked decrease in both recovery and grade of molybdenite. Notably, the depression of molybdenite in this mixed mineral system was more pronounced. At a Cu2+ concentration of 8 mg/L, molybdenite recovery decreased to 22.28%, with a corresponding grade of 23.87%. In contrast, chalcopyrite recovery remained relatively stable at approximately 10% as Cu2+ concentration increased, while its grade gradually improved. At 8 mg/L Cu2+, chalcopyrite recovery was 9.66%, with a grade of 4.73%. These results clearly demonstrated that Cu2+ exerted differential effects on the floatability of chalcopyrite and molybdenite in the STG system. In the absence of Cu2+, chalcopyrite exhibited low recovery, and this value did not change significantly with the introduction of Cu2+. In contrast, molybdenite recovery sharply declined, indicating that its floatability was heavily suppressed in the STG system containing Cu2+. Additionally, at lower Cu2+ concentrations, achieving effective flotation separation between chalcopyrite and molybdenite remained a notable challenge.
3.2. Contact Angle Test
The contact angle represents the intersection formed between a liquid droplet and the solid mineral substrate, offers crucial information about the surface’s hydrophobic characteristics and its behavior during flotation processes. In general, a higher contact angle suggests increased hydrophobicity and superior flotation performance, whereas a lower value reflects weaker hydrophobic tendencies and reduced flotation capacity [30,31,32,33]. Figure 6 illustrates the variation in the contact angle of molybdenite surface under different conditions. Pristine molybdenite exhibited an initial contact angle of 86°. Only a slight change in the contact angle occurred when treated with either Cu2+ or STG alone, with values of 87° and 84°, respectively, remaining close to the initial contact angle. However, when molybdenite was in the STG system with Cu2+, the contact angle decreased from 86° to 42°. This suggested that neither Cu2+ nor STG, when applied individually, substantially altered the floatability of molybdenite, whereas in the STG system with Cu2+, the floatability of molybdenite was significantly inhibited.
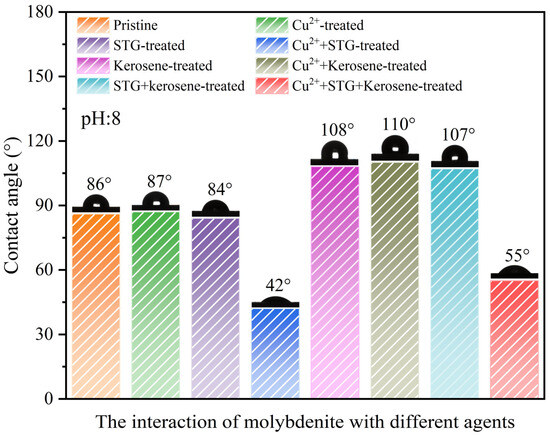
Figure 6.
Contact angles of molybdenite under different reagent conditions (Cu2+: 8 mg/L, STG: 1.0 × 10⁻³ mol/L, and kerosene: 2.5 × 10⁻⁴ mol/L) at a pulp pH of 8.0.
Further analysis revealed that the contact angle of molybdenite after kerosene treatment was 108°, whereas after the individual applications of Cu2+ or STG followed by kerosene treatment, the contact angles were 110° and 107°, respectively, indicating that either reagent alone had minimal impact on the hydrophobicity imparted by kerosene. In contrast, when kerosene was added to molybdenite in the STG system with Cu2+, the contact angle decreased to 55°, suggesting that Cu2+ in the STG system significantly weakened the hydrophobic effect induced by kerosene. These findings aligned with the flotation experiment results, implying that while Cu2+ or STG alone has limited influence on surface hydrophobicity, their combined presence exerts a synergistic inhibitory effect, markedly reducing the hydrophobicity of the molybdenite surface.
3.3. Zeta Potential Characterizations
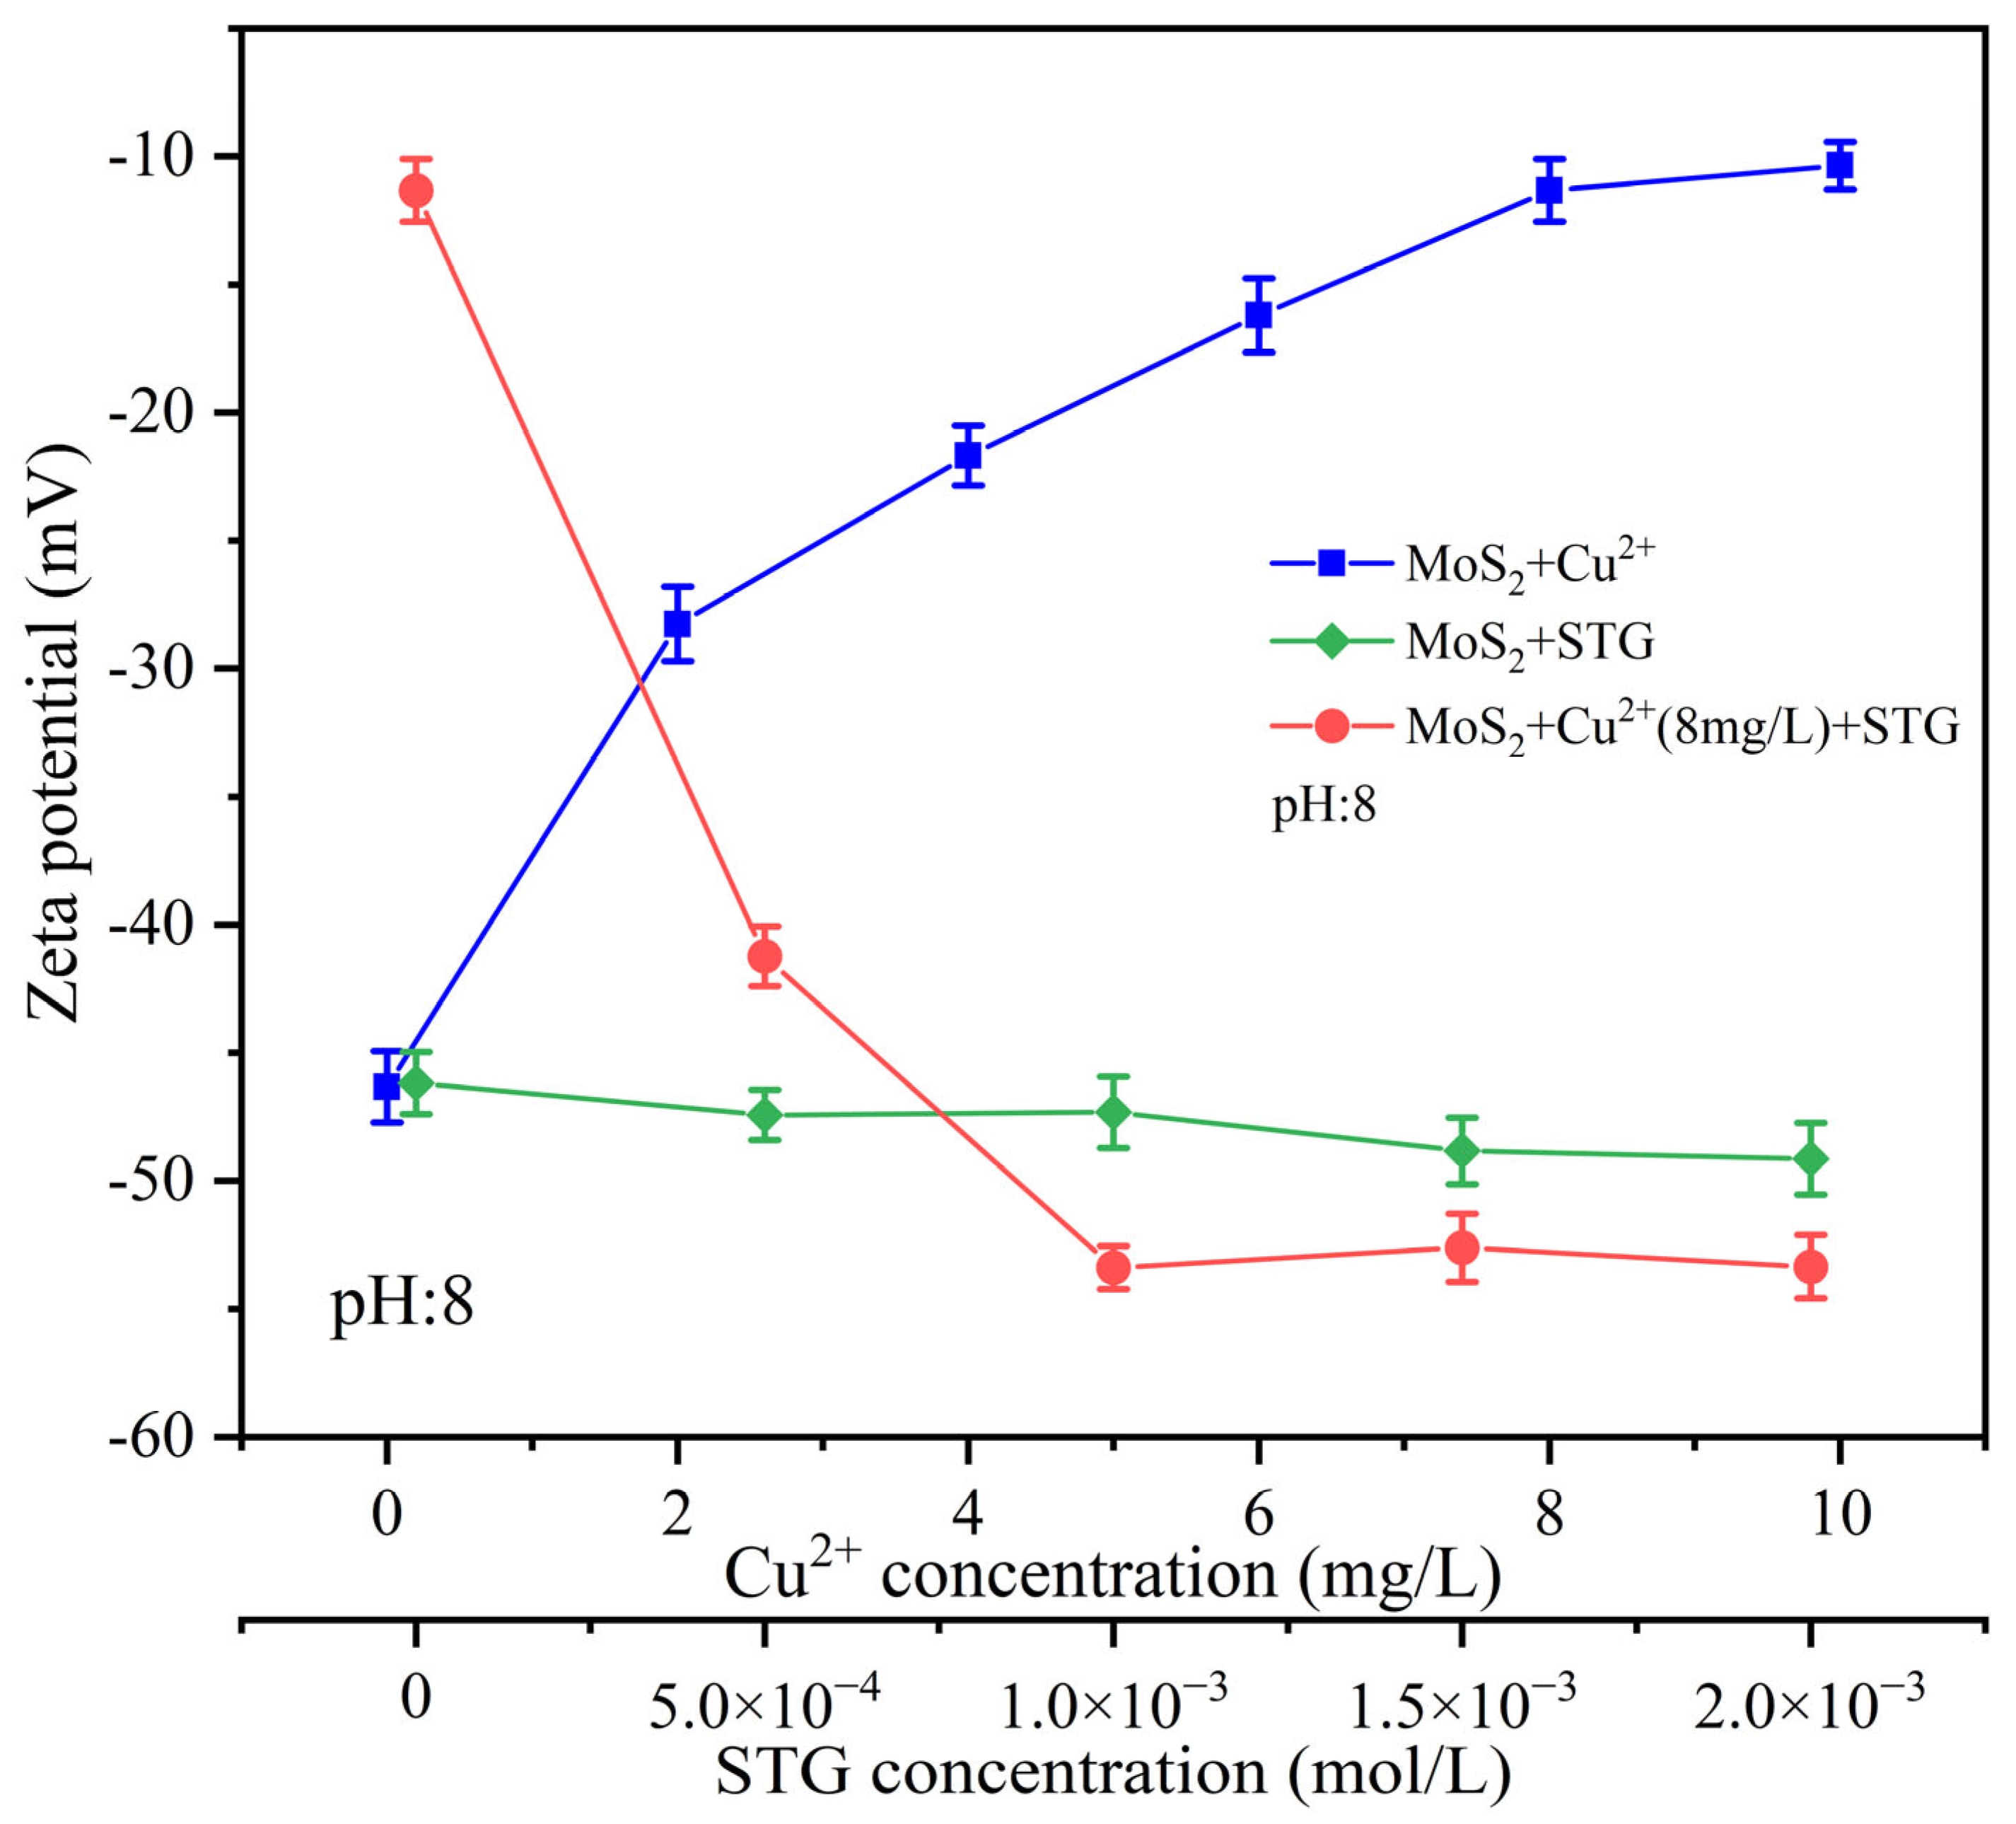
The adsorption of reagents and ions significantly influences the surface properties of minerals. As a key parameter for characterizing mineral surface charge properties, zeta potential provides critical insights into the interactions between mineral surfaces and major species in solution [34]. In this study, the zeta potential of molybdenite was measured at pH 8.0 to assess the individual and combined effects of Cu2+ and STG on its surface characteristics.
Figure 7 shows that the surface charge of molybdenite exhibited a noticeable positive shift with an increasing amount of Cu2+. At a Cu2+ concentration of 8 mg/L, the zeta potential stabilized at −11.33 mV, suggesting the surface had reached its adsorption capacity for Cu2+. In comparison, the addition of STG alone caused only a minimal change in zeta potential, even at higher concentrations, suggesting weak interactions between STG and the molybdenite surface under these conditions. However, when molybdenite was pre-treated with 8 mg/L Cu2+ before the introduction of STG, a marked reduction in surface potential with increasing STG concentration occurred. At 1.0 × 10⁻³ mol/L STG, the zeta potential reached a steady value of −53.39 mV. These results indicate that the prior adsorption of Cu2+ created reactive sites on the molybdenite surface, promoting subsequent STG adsorption.
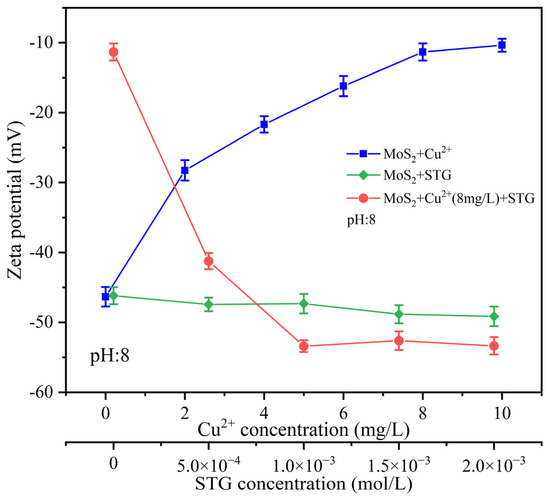
Figure 7.
Zeta potential of molybdenite with different reagent dosage.
3.4. UV–Vis Spectrophotometer Analysis
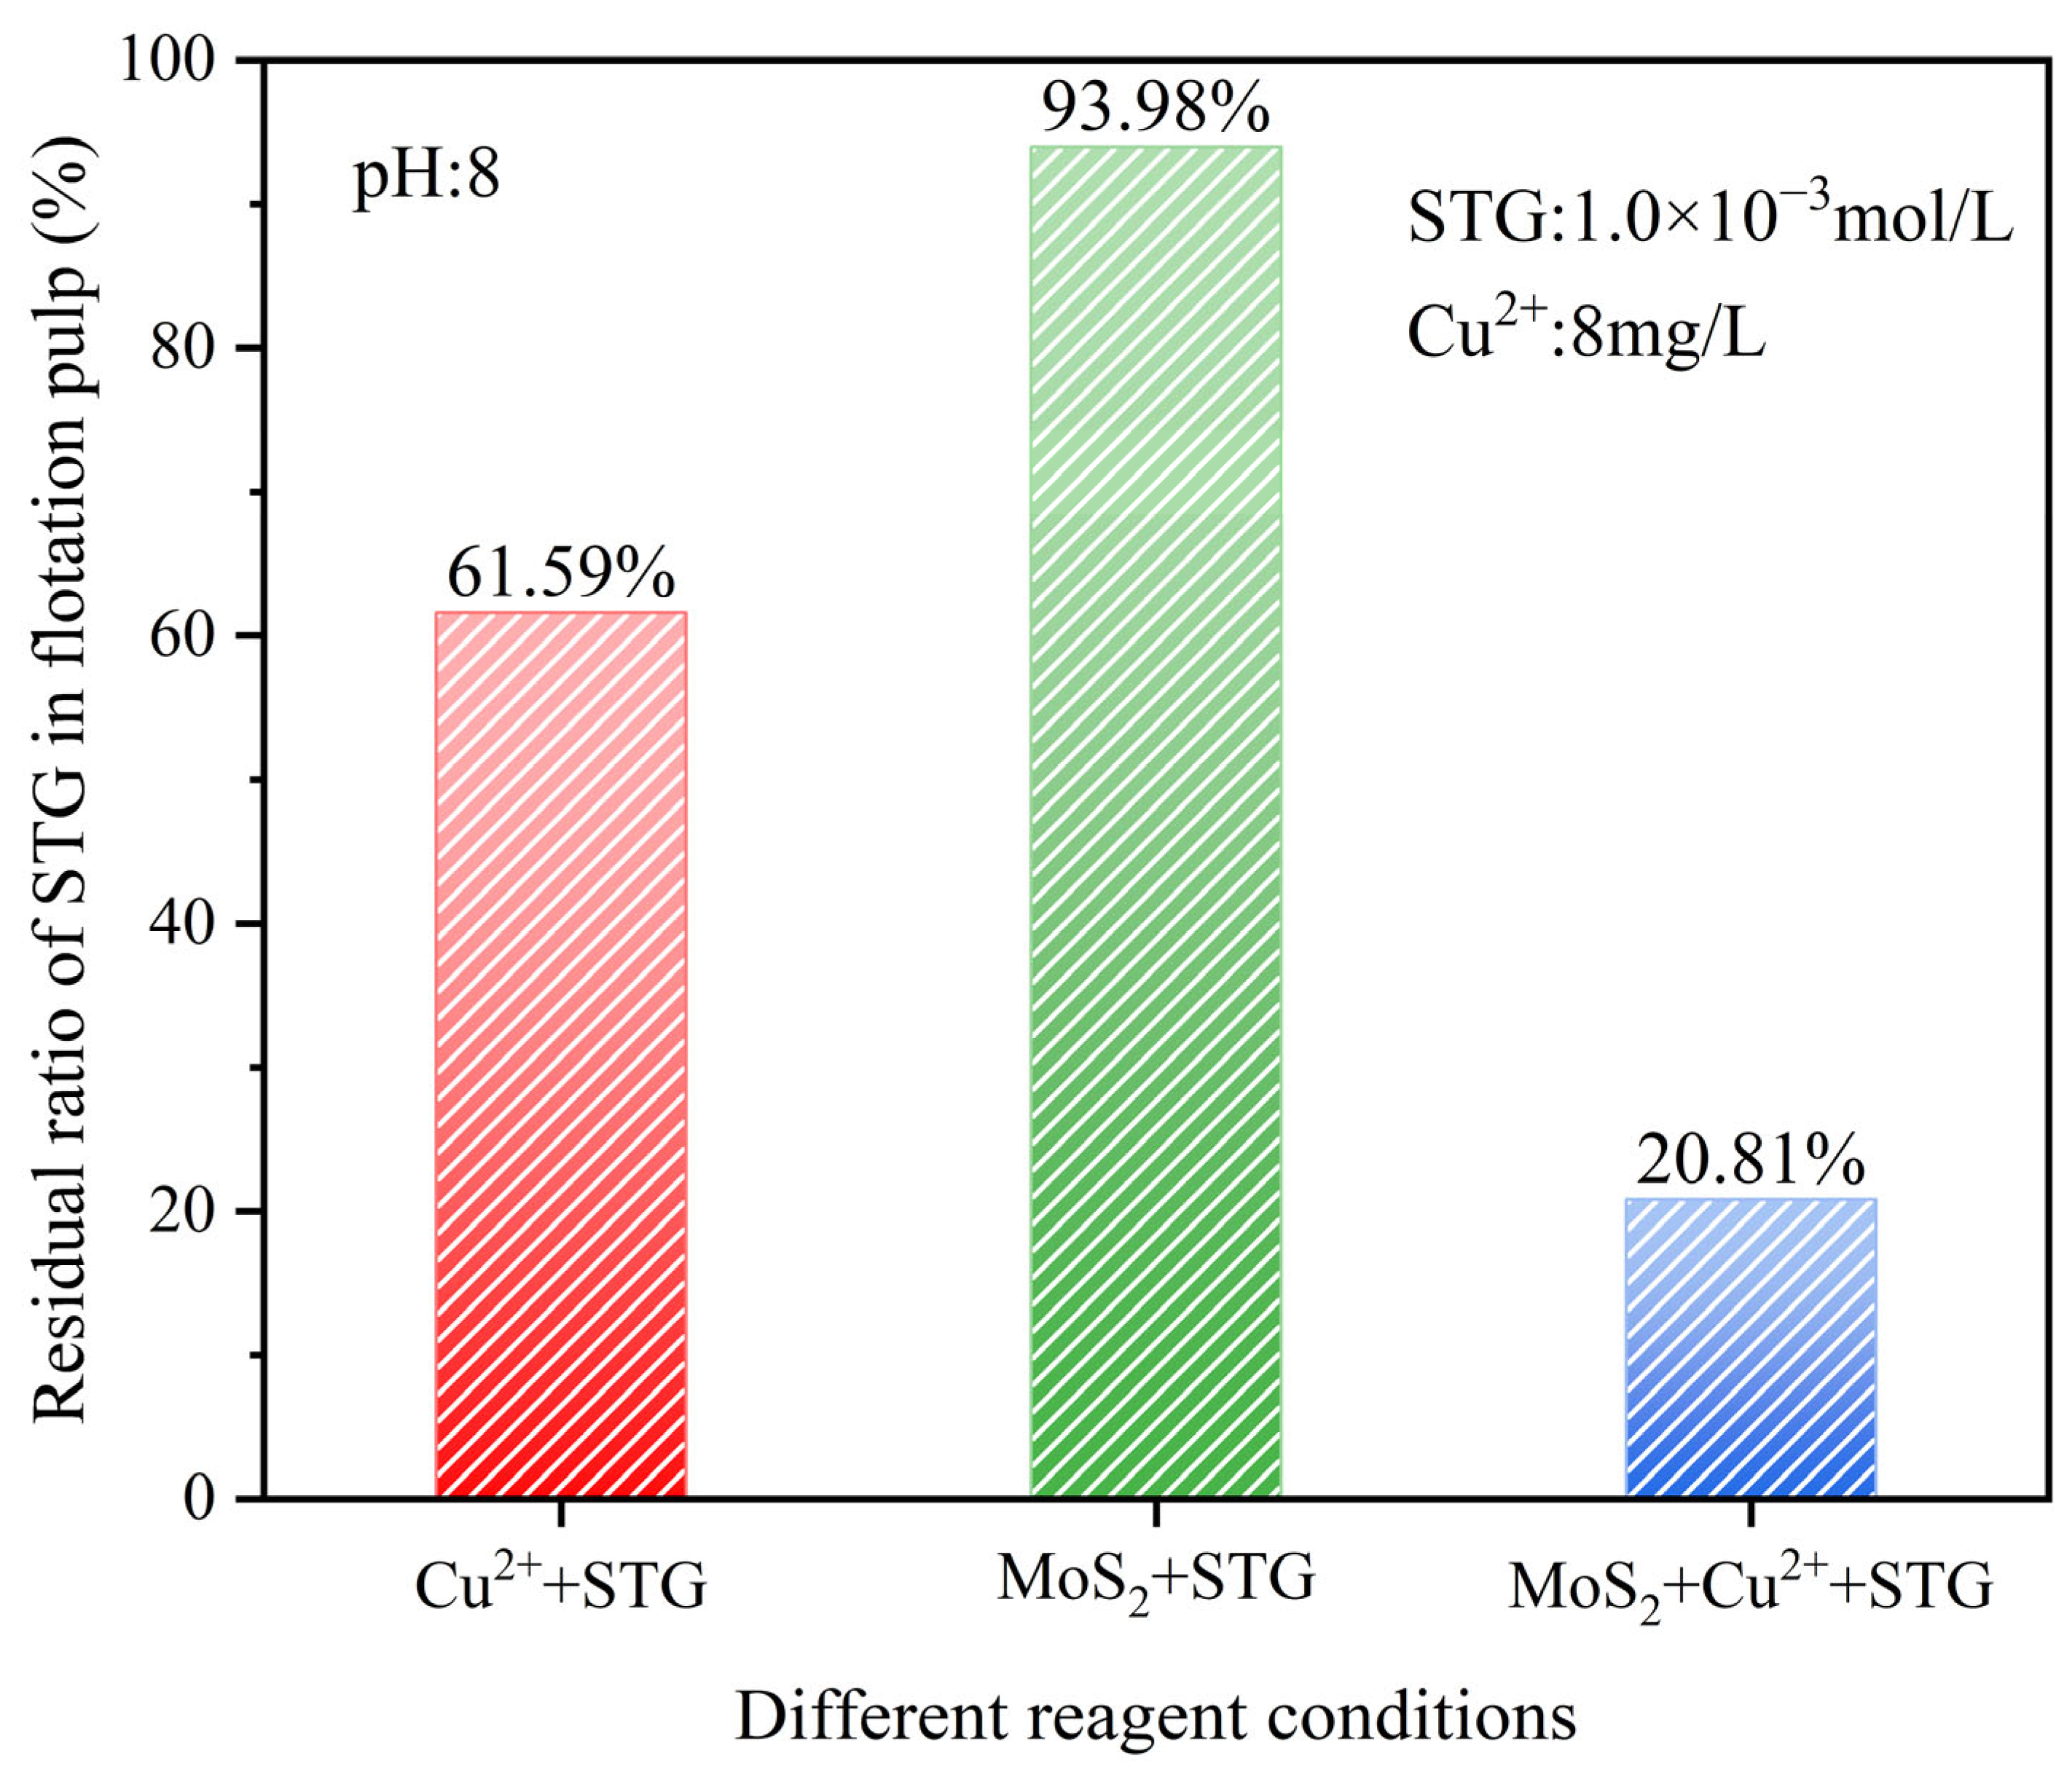
A higher residual ratio of a reagent in the slurry indicated a lower extent of chemical reaction [35]. In this study, the residual ratio of STG was analyzed under three reaction systems—Cu2+ + STG, MoS2 + STG, and MoS2 + Cu2+ + STG—at a slurry pH of 8.0, with Cu2+ at 8 mg/L and STG at 1.0 × 10⁻³ mol/L. This analysis aimed to elucidate the adsorption behavior of molybdenite toward STG under different conditions.
As shown in Figure 8, in the Cu2+ + STG system, the residual STG ratio was 61.59%, indicating partial consumption of STG due to its interaction with Cu2+. In contrast, in the MoS2 + STG system, the residual STG ratio remained as high as 93.98%, suggesting minimal adsorption or reaction on the untreated molybdenite surface. However, in the MoS2 + Cu2+ + STG system, the residual STG ratio significantly decreased to 20.81%, demonstrating that in the STG system with Cu2+, enhanced STG adsorption onto the molybdenite surface occurred. This intensified interaction further suppressed the floatability of molybdenite, aligning well with the flotation results.

Figure 8.
Residual STG ratio under different reagent conditions.
3.5. XPS Analysis
XPS was an effective method for investigating the chemical states and elemental makeup of the molybdenite surface by measuring the binding energies of emitted electrons [36,37,38,39]. To elucidate the mechanism by which the STG system with Cu2+ affected the floatability of molybdenite, XPS analyses were performed on molybdenite samples subjected to various treatment conditions.
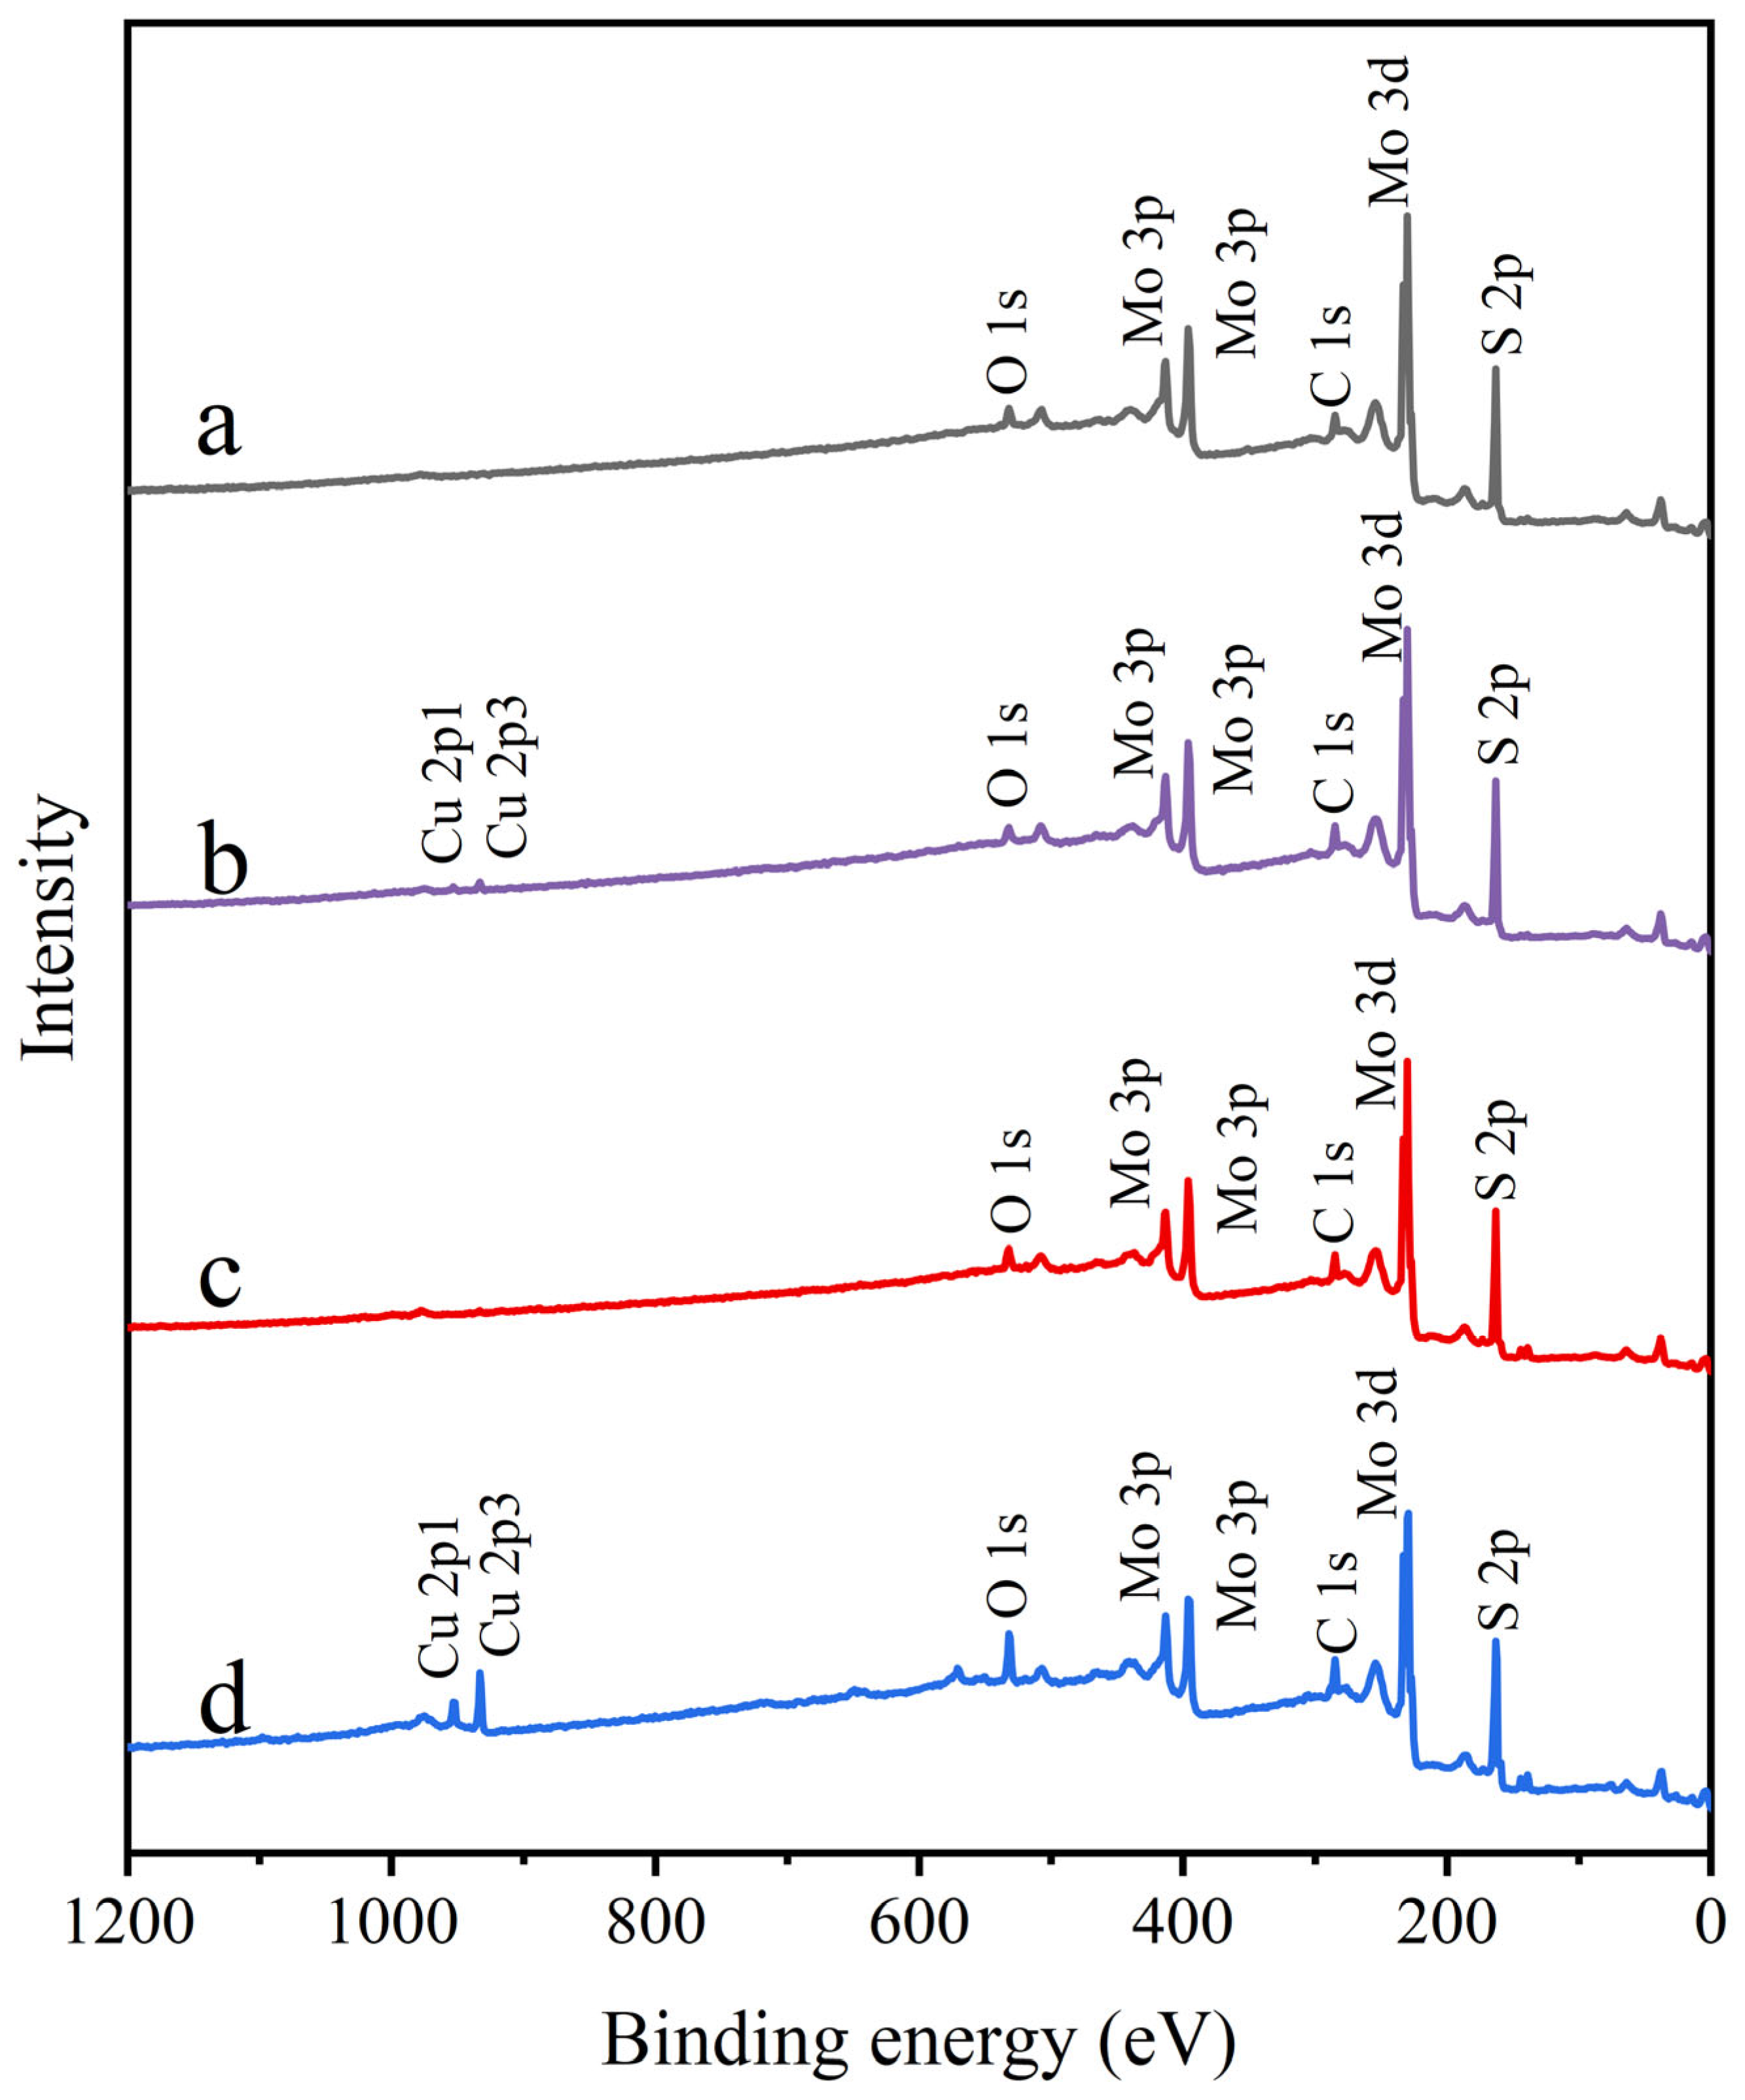
Figure 9 presents the XPS survey spectra of molybdenite samples under different treatment conditions. The spectrum of untreated molybdenite (Figure 9) was relatively clean, showing only minimal oxygen signals, likely due to air contamination or slight surface oxidation. Similarly, the spectrum of molybdenite treated with STG alone closely matched that of untreated molybdenite. After Cu2+ treatment, a distinct Cu 2p peak appeared, confirming the chemical binding of Cu2+ to the molybdenite surface. In the STG system, Cu2+ led to a significant increase in Cu 2p peak intensity, suggesting enhanced formation of Cu complexes on the molybdenite surface. To assess changes in surface composition quantitatively, the atomic concentrations of key elements in each sample were determined (Table 1). The data showed that the Cu content on the untreated and STG treated molybdenite surfaces were, respectively, only 0.19% and 0.22%, which were possibly due to the experimental error because molybdenite surface and STG molecule alone do not contain Cu-related substances and should not cause significant changes in Cu content by themselves. After Cu2+ treatment, this value increased to 0.91%, confirming the effective adsorption of Cu2+. Following the addition of STG, the surface Cu content increased to 3.65%, consistent with the enhancement of the Cu 2p peak intensity. This increase was likely due to the preferential binding of –COO– in STG molecules to Cu2+, which captured additional Cu2+ from the pulp, thereby raising the surface Cu content. Concurrently, untreated molybdenite exhibited a baseline C content of 12.90%, primarily attributed to atmospheric CO2 physisorption. For Cu2+-treated samples, C content markedly increased to 18.48%, likely due to Cu2+-catalyzed oxidation of adsorbed CO2 into carbonate species. STG-treated samples showed a slightly reduced C content (17.21%), potentially reflecting residual physically adsorbed STG from incomplete cleaning. Importantly, sequential Cu2+/STG treatment yielded the highest C content (18.50%), consistent with intensified C 1s spectral signals. This enhancement was mechanistically explained by Cu2+ providing active surface sites that promoted STG chemisorption, with carbon-containing moieties in STG acting as supplementary carbon sources. Similarly, untreated molybdenite exhibited a characteristic S content of 50.88%, predominantly attributed to lattice S2- species. Following Cu2+ treatment, the S content decreased to 45.19%, which could be ascribed to Cu2+-induced sulfur vacancies and partial conversion to Cu-S species. STG-treated samples exhibited an intermediate S content of 47.63%, likely due to residual STG molecules partially masking sulfur signals. Notably, the sequential Cu2+/STG treatment resulted in the lowest S content (44.85%), likely due to two synergistic mechanisms: (1) Cu2+-mediated bridging of STG molecules, forming a dense organic film that enhanced surface shielding, and (2) the synergistic effect between Cu2+ and STG, exacerbating sulfur etching during interfacial reactions. These combined processes effectively suppressed sulfur detection while promoting the accumulation of copper and carbon on the molybdenite surface.

Figure 9.
XPS survey spectra of molybdenite: (a) untreated, (b) exposed to Cu2+, (c) exposed to STG, and (d) exposed to both Cu2+ and STG.

Table 1.
Elemental analysis of the samples.
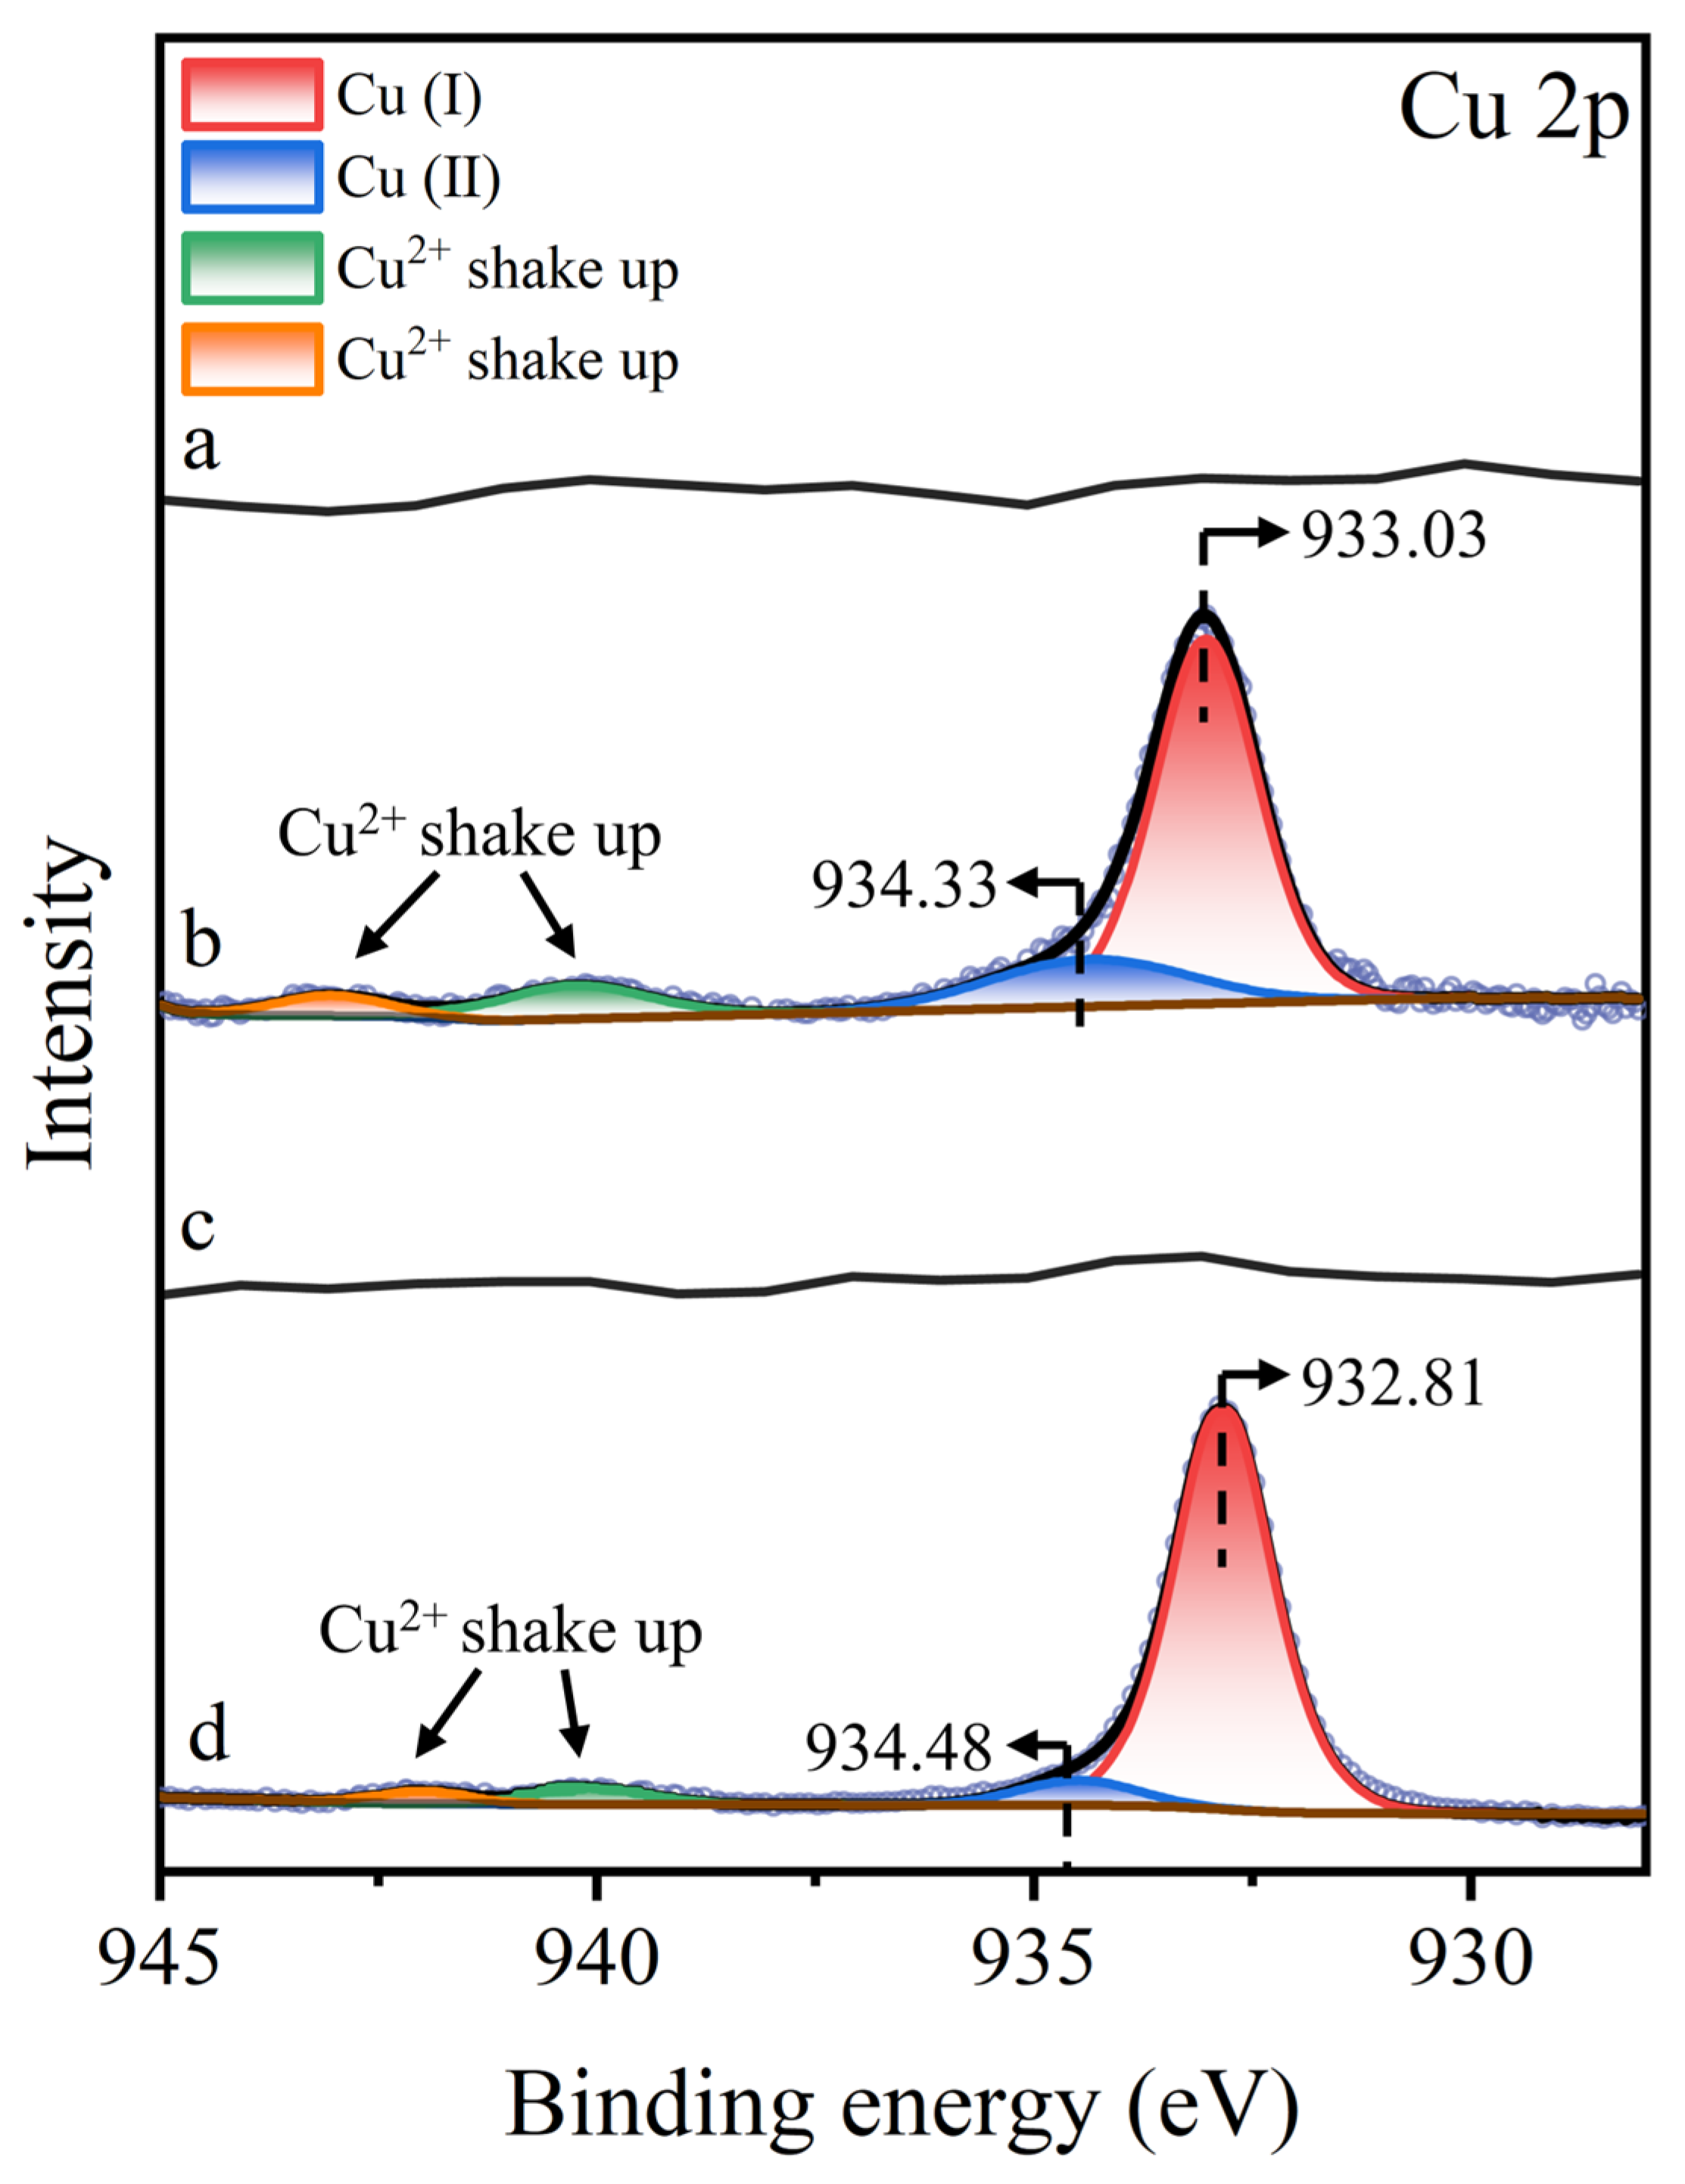
To further analyze the copper species associated with molybdenite, Figure 10 displays the Cu 2p3/2 XPS spectra of molybdenite surfaces under various treatment. No characteristic Cu 2p3/2 peaks were observed on untreated or STG-treated molybdenite surfaces, confirming the absence of detectable copper species. However, after Cu2+ treatment, a distinct Cu 2p3/2 peak emerged, which was split into three components: a peak at 933.03 eV attributed to Cu(I), a peak at 934.33 eV corresponding to Cu(II), and a weak satellite structure in the 940–945 eV range, characteristic of Cu(II) shake-up satellites [40,41,42]. The simultaneous presence of Cu(I) and Cu(II) peaks indicated that most of the Cu2+ in solution was reduced to Cu+, while a small amount of Cu2+ co-adsorbed onto the molybdenite surface. Following further treatment with STG after Cu2+ treatment, the Cu 2p3/2 XPS spectrum exhibited a notable shift, with the Cu(I) peak moving from 933.03 eV to 932.81 eV. This shift in binding energy suggested that the –SH or –COO− group in STG molecules interacts with Cu(I) sites present on molybdenite, altering the electronic structure of the copper species at the mineral interface.
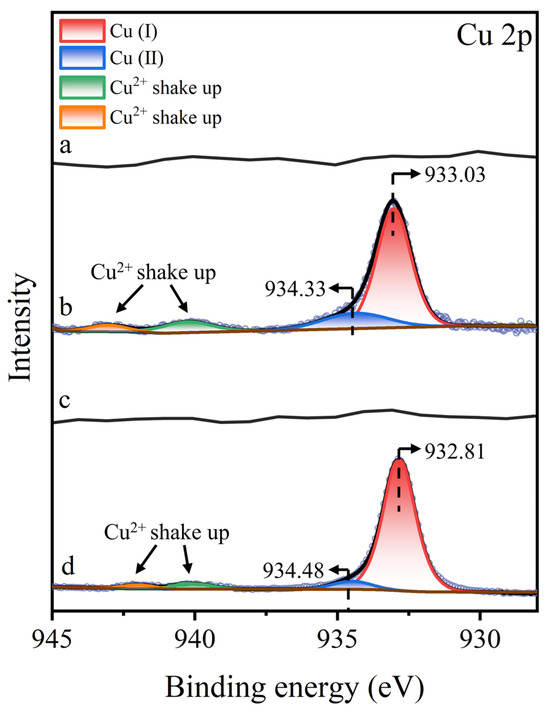
Figure 10.
Cu 2p XPS spectra of molybdenite: (a) untreated, (b) exposed to Cu2+, (c) exposed to STG, and (d) exposed to both Cu2+ and STG.
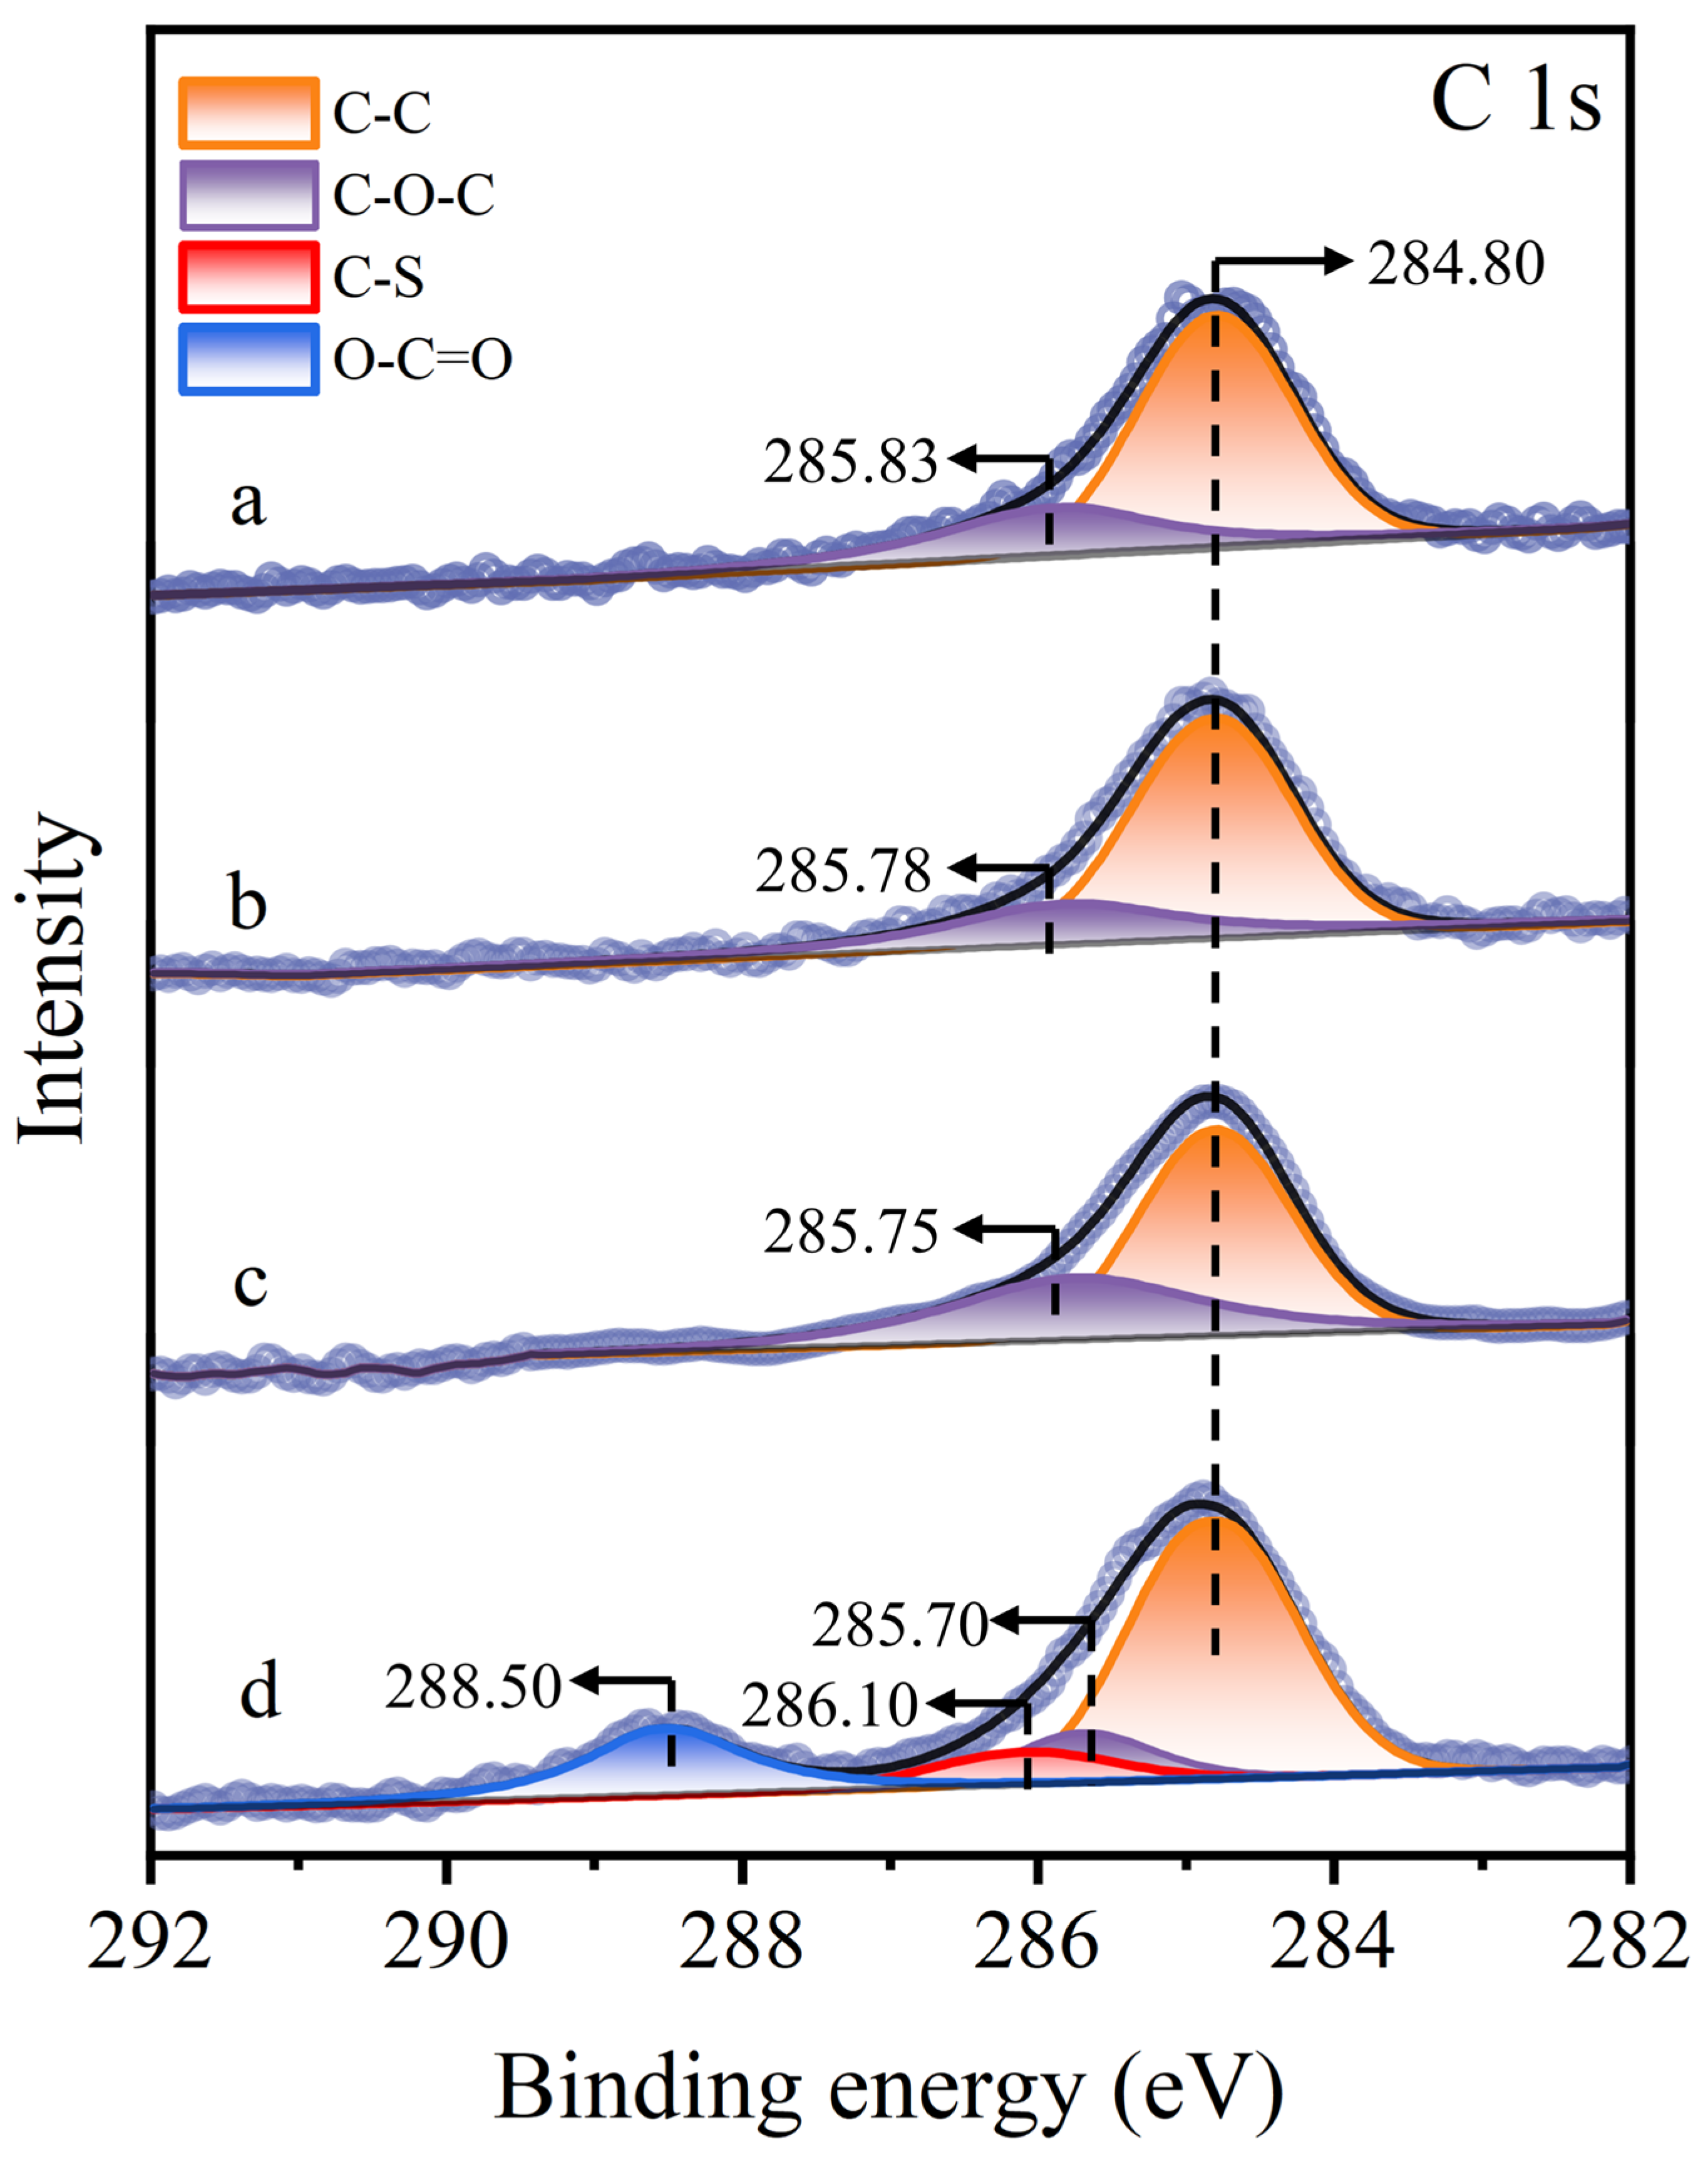
Significant changes were noted in the C 1s XPS spectrum of the molybdenite surface (Figure 11). On untreated, Cu2+-treated, and STG-treated molybdenite surfaces, only the C–C and C–O–C peaks were detected at 284.80 eV and around 285.83 eV [43], respectively. In contrast, in the STG system with Cu2+, subsequent STG treatment induced substantial alterations in the C 1s XPS spectrum, with the emergence of new peaks at 286.10 eV (C–S) and 288.50 eV (O–C=O) [10]. These new peaks suggested that the thiol or carboxyl groups of STG molecules interacted with the Cu(I) sites formed on the Cu2+-treated molybdenite surface.
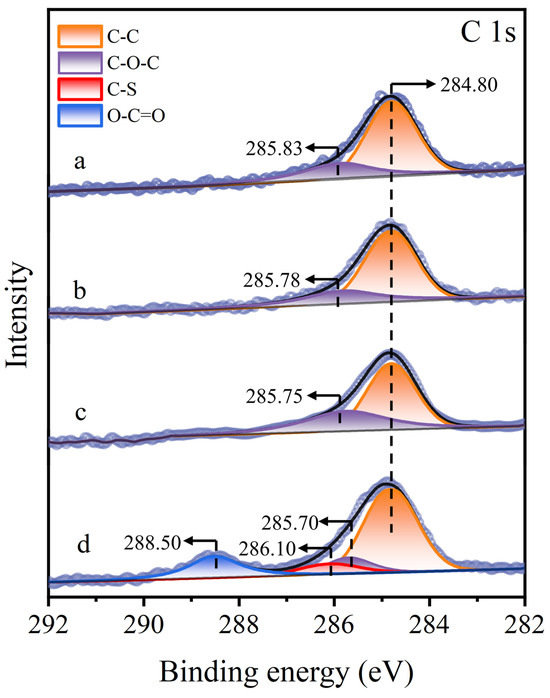
Figure 11.
C 1s XPS spectra of molybdenite: (a) untreated, (b) exposed to Cu2+, (c) exposed to STG, and (d) exposed to both Cu2+ and STG.
Figure 12 presents the S 2p XPS spectra of molybdenite surfaces under different treatment. For untreated, Cu2+-treated, and STG-treated molybdenite surfaces, only the intrinsic S2− characteristic peak of molybdenite was detected at 162.68 eV, 162.64 eV, and 162.80 eV, respectively, indicating that STG alone did not interact with the molybdenite surface [44,45]. However, in the STG system with Cu2+, a new peak at 163.52 eV appeared alongside the S2− peak at 162.53 eV [46]. The presence of the S–C peak indicated that STG molecules chemically bonded to Cu(I) sites on molybdenite after treatment.
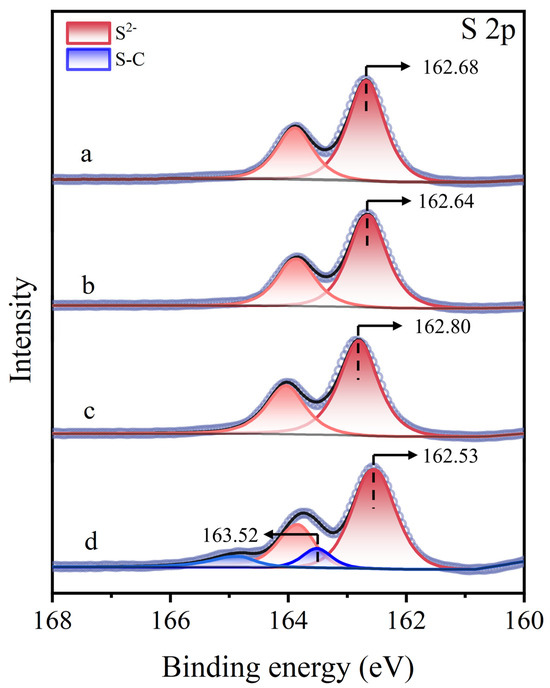
Figure 12.
S 2p XPS spectra of molybdenite: (a) untreated, (b) exposed to Cu2+, (c) exposed to STG, and (d) exposed to both Cu2+ and STG.
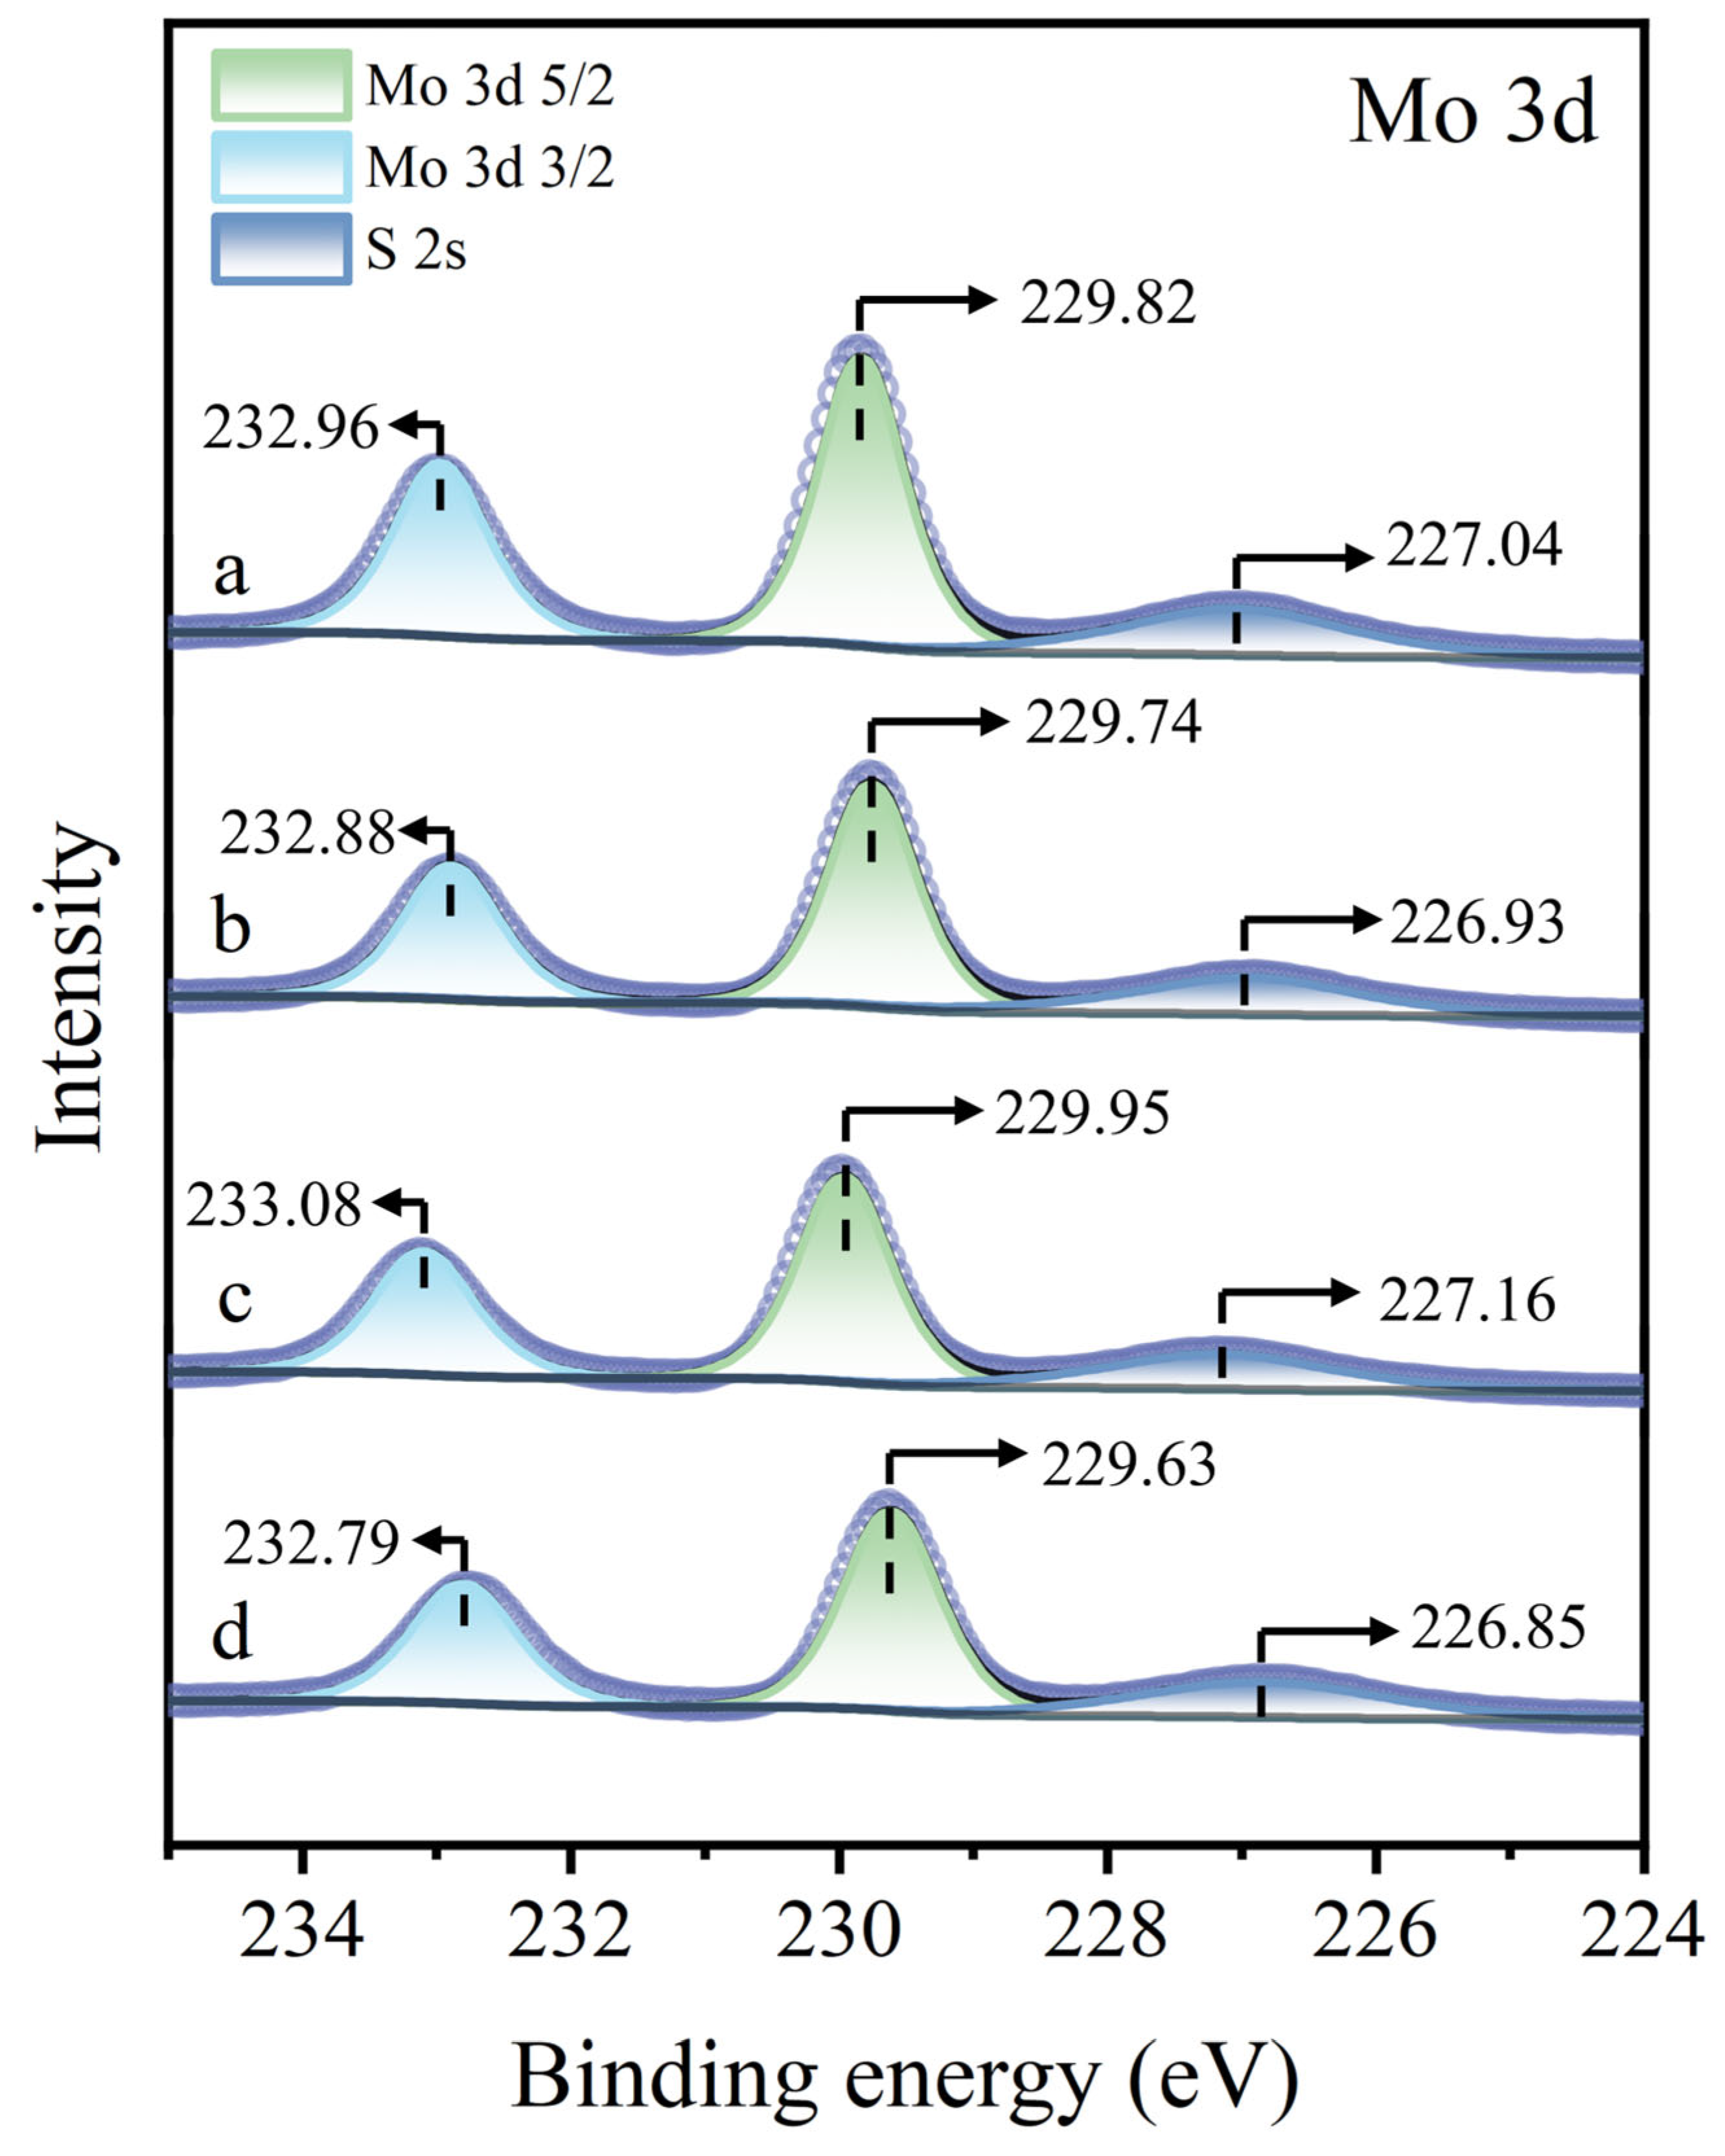
Figure 13 presents the Mo 3d XPS spectra of molybdenite surfaces under different treatment. Regardless of whether the molybdenite surface was untreated, treated with Cu2+ alone, treated with STG alone, or subjected to Cu2+ pre-treatment followed by STG treatment, no significant shifts in the Mo 3d peaks were observed, suggesting that none of these treatments induced detectable reactions with the Mo sites in molybdenite. In conclusion, neither Cu2+ nor STG alone exerts a noticeable effect on molybdenite. Cu2+ was predominantly adsorbed as Cu(I) species on the molybdenite surface, and subsequent exposure to STG resulted in the generation of Cu(I)-STG complexes. This association markedly inhibited the flotation performance of molybdenite.
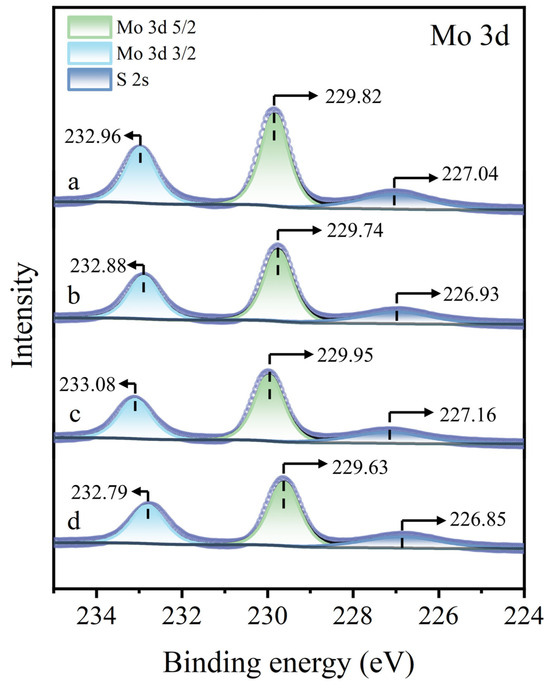
Figure 13.
Mo 3d XPS spectra of molybdenite: (a) untreated, (b) exposed to Cu2+, (c) exposed to STG, and (d) exposed to both Cu2+ and STG.
3.6. DFT Analysis
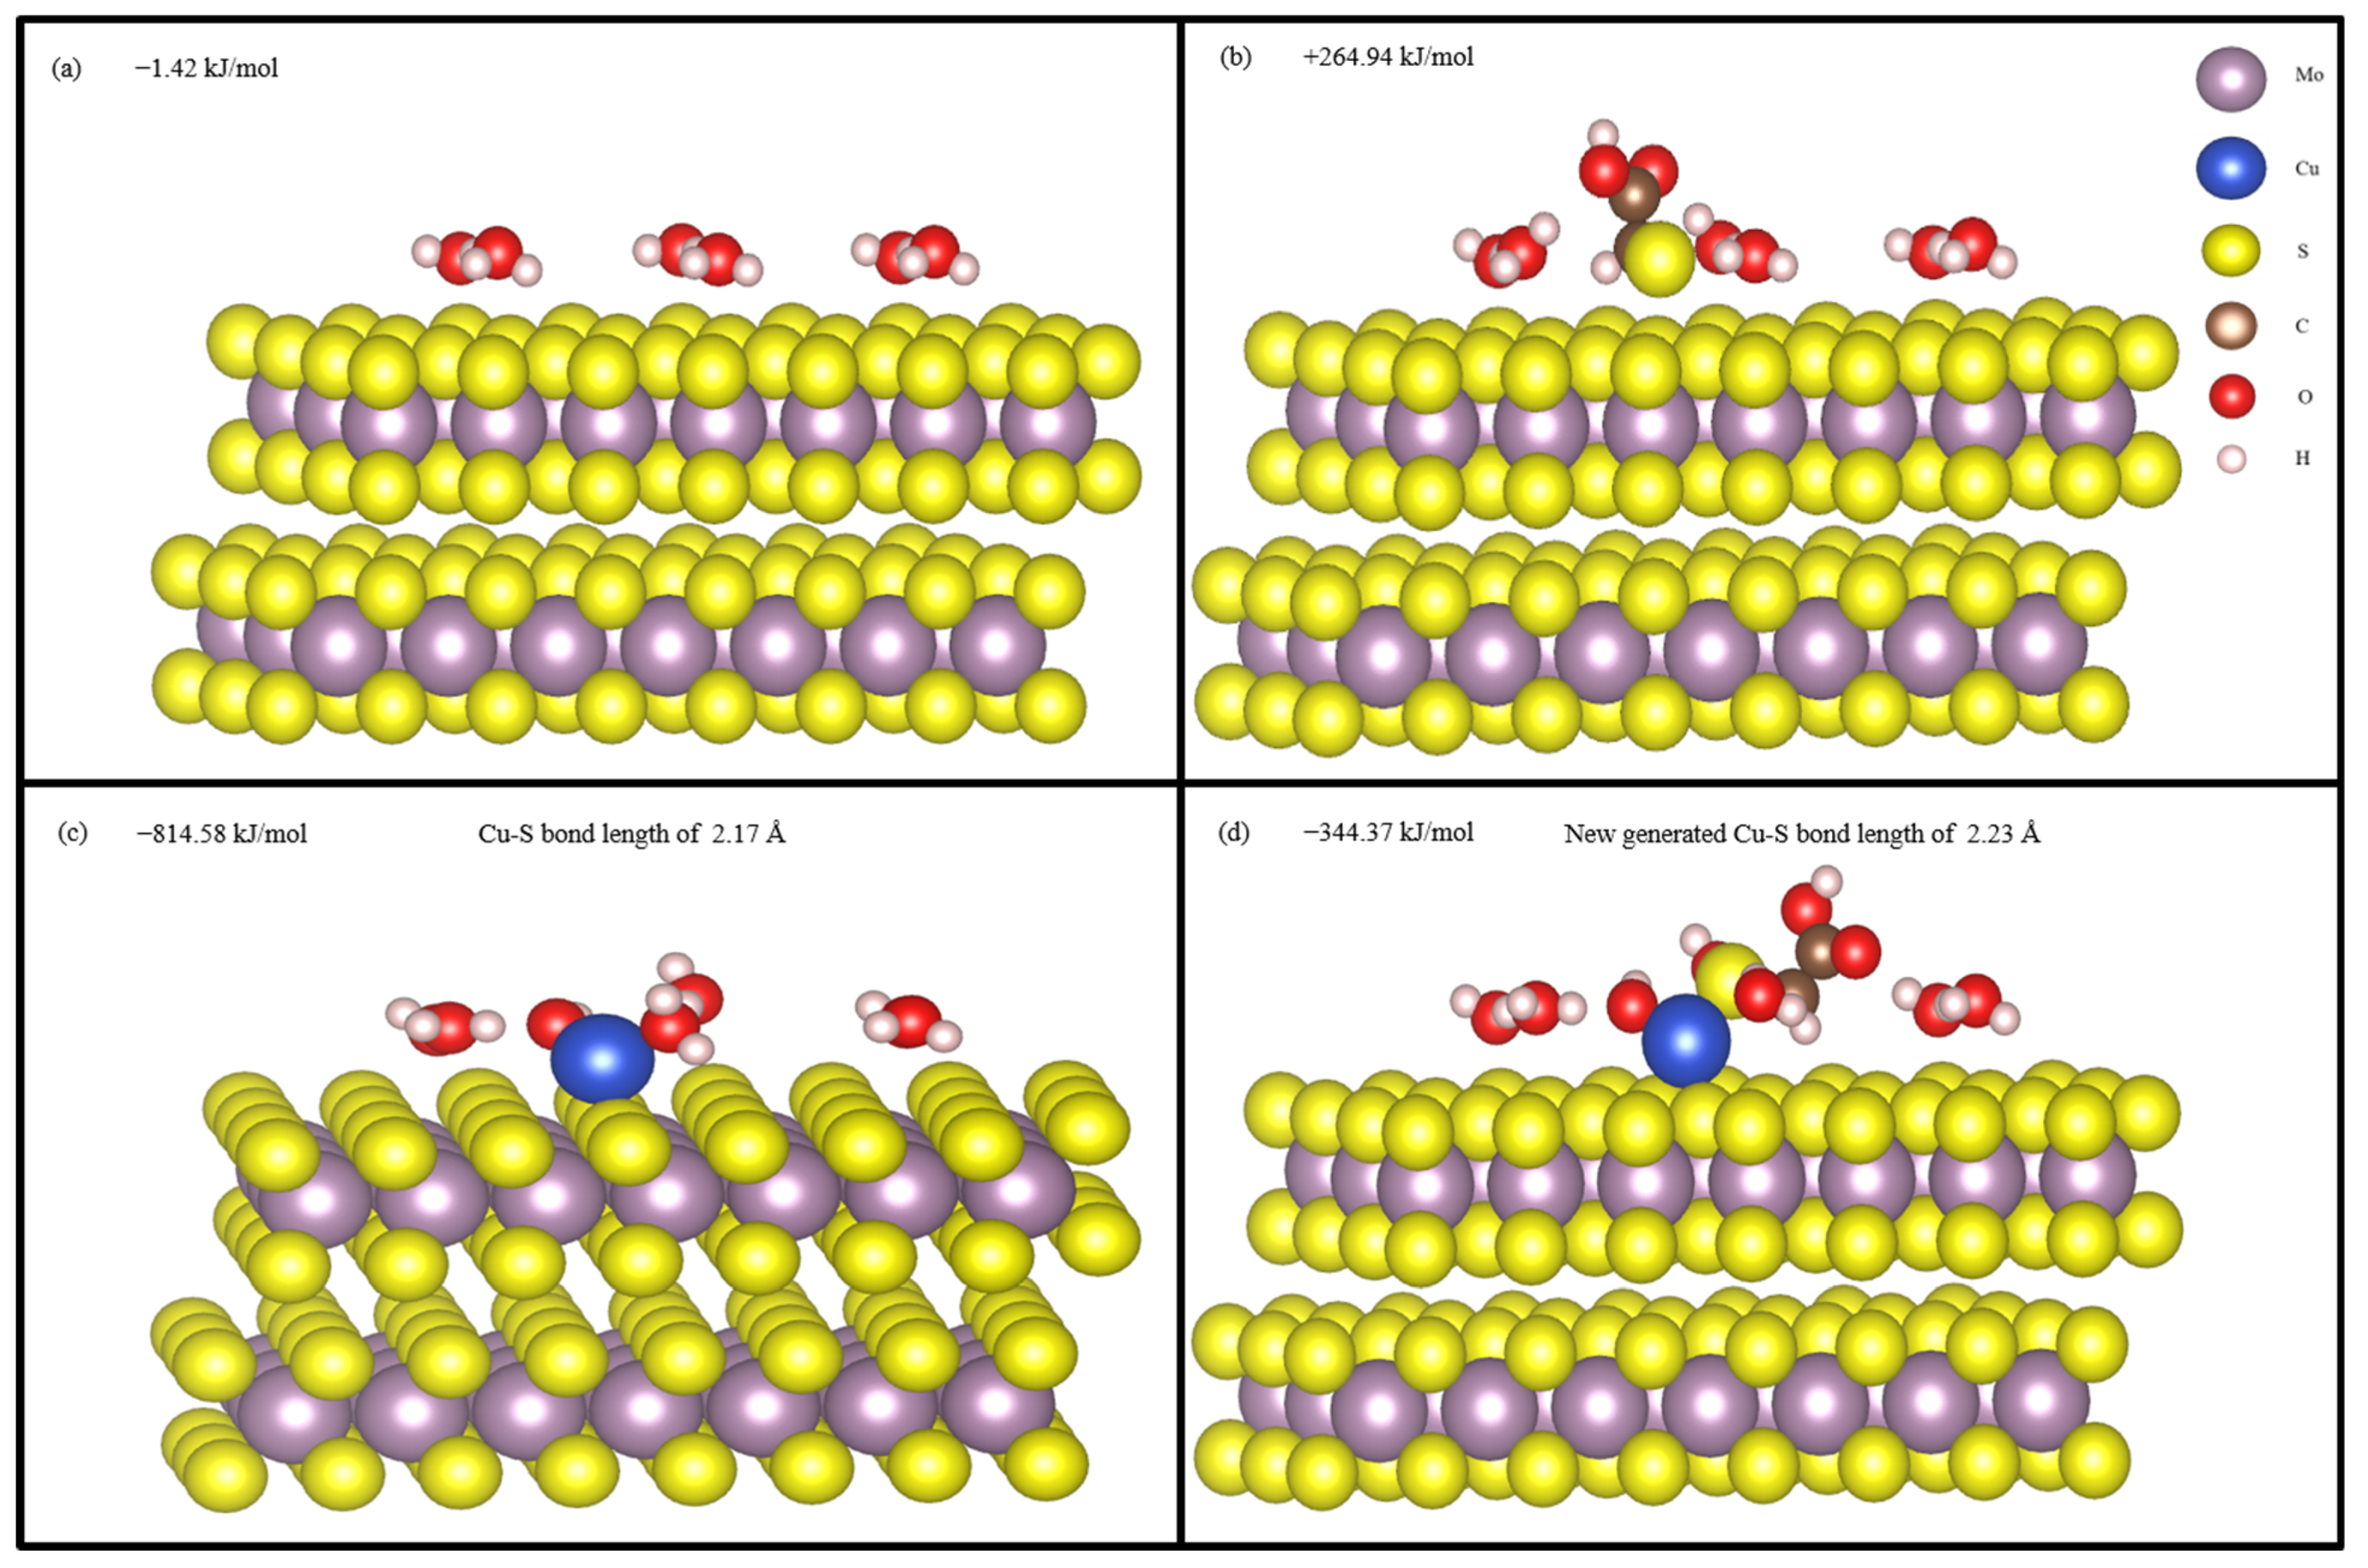
Figure 14 shows the optimized hydrated structure of molybdenite (001) surface, STG adsorption structure on hydrated molybdenite (001) surface; CuOH+ adsorption structure on hydrated molybdenite (001) surface, and STG adsorption structure on CuOH+ modified molybdenite (001) surface. The average adsorption energy of H2O was −1.42 kJ/mol, indicating the molybdenite (001) surface was very hydrophobic, which agrees with the previous research [47]. When STG further adsorption on hydrated molybdenite (001) surface, the calculated adsorption energy was +264.94 kJ/mol, which is a positive value, indicating that STG cannot be adsorbed on hydrated molybdenite (001) surface when no Cu ions present, which is consistent with the previous XPS results. After CuOH+ adsorption, the adsorption energy of CuOH+ reached −814.58 kJ/mol and a Cu–S bond of Cu in CuOH+ and S in molybdenite (001) surface with length of 2.17 Å was generated, indicating Cu ion was very easily to be adsorbed on the hydrated molybdenite (001) surface. And after further adsorption of STG on CuOH+ modified molybdenite (001) surface, a new Cu-S bond of Cu in CuOH+ and S in STG with length of 2.23 Å was produced and the STG adsorption energy was also a negative value of −344.37 kJ/mol, indicating STG adsorption on hydrated molybdenite (001) surface was enhanced when Cu ions present. The above DFT calculation results demonstrated that when copper ions are present in the pulp, STG also interacts with molybdenite, significantly depressing its floatability and making it more difficult to separation of molybdenite from chalcopyrite under STG inhibition. These observations are in line with the results from flotation experiments outcomes and all the characterization techniques mentioned above.

Figure 14.
Hydrated structure of molybdenite (001) surface (a); STG adsorption on hydrated mo-lybdenite (001) surface (b); CuOH+ adsorption on hydrated molybdenite (001) surface (c); STG adsorption on CuOH+ modified molybdenite (001) surface (d).
4. Conclusions
This study systematically explored how Cu2+ influences the flotation separation of chalcopyrite and molybdenite with STG as depressant, and elucidated the interaction mechanism between Cu2+, STG, and molybdenite surfaces. Based on the experimental results and in-depth analysis, the following key conclusions can be drawn:
- (1)
- Flotation experiments showed that at pH 8.0, neither Cu2+ nor STG alone significantly affected molybdenite flotation. However, the combination of STG with Cu2+ strongly depressed molybdenite flotation, degenerating the separation efficiency.
- (2)
- Contact angle, zeta potential, UV–Vis, and DFT calculation revealed that Cu2+ facilitated STG attachment onto molybdenite, enhancing its surface hydrophilicity and thereby diminishing its floatability.
- (3)
- XPS analysis revealed that Cu2+ predominantly adsorbed onto the molybdenite surface as Cu(I), providing reactive sites for the –SH or –COO− group in STG. The formation of a stable molybdenite–Cu(I)–STG complex effectively suppressed molybdenite flotation.
Author Contributions
Conceptualization, F.J.; Methodology, F.J.; Software, Y.L.; Validation, H.T.; Formal analysis, Y.L.; Investigation, F.J., S.H. and J.Q.; Data curation, S.H. and J.Q.; Writing—original draft, F.J.; Writing—review & editing, S.H., Y.L. and H.T.; Supervision, H.T.; Project administration, H.T.; Funding acquisition, F.J. All authors have read and agreed to the published version of the manuscript.
Funding
This research was funded by the [National Key R&D Program of China] grant number [2022YFC2904502, 2022YFC2904501].
Institutional Review Board Statement
Not applicable.
Informed Consent Statement
Not applicable.
Data Availability Statement
The original contributions presented in this study are included in the article. Further inquiries can be directed to the corresponding authors.
Conflicts of Interest
The authors declare no conflicts of interest.
References
- Yang, J.; Chen, L.; Xue, Z.; Yang, K.; Shao, Y.; Zeng, J.; Gao, Y. Performance evaluation of PHGMS technology for superfine chalcopyrite-molybdenite separation. Sep. Purif. Technol. 2024, 336, 126136. [Google Scholar] [CrossRef]
- Qin, X.; Liu, J.; Yu, Y.; Hao, J.; Gao, H.; Li, D.; Dai, L. Novel application of depressant sodium mercaptoacetate in flotation separation of chalcopyrite and pyrite. Adv. Powder Technol. 2023, 34, 104141. [Google Scholar] [CrossRef]
- Hlina, J.; Reboun, J.; Hamacek, A. Study of copper thick film metallization on aluminum nitride. Scr. Mater. 2020, 176, 23–27. [Google Scholar] [CrossRef]
- Zhang, H.-T.; Song, X.-Y.; Huang, Y.-H.; Zhang, Z.; Wang, W.; Xu, L.-F. Selective flotation separation of molybdenite and chalcopyrite using O3 oxidation method. Trans. Nonferrous Met. Soc. China 2024, 34, 298–308. [Google Scholar] [CrossRef]
- Yi, G.; Macha, E.; Van Dyke, J.; Ed Macha, R.; McKay, T.; Free, M.L. Recent progress on research of molybdenite flotation: A review. Adv. Colloid. Interface Sci. 2021, 295, 102466. [Google Scholar] [CrossRef]
- Hao, J.; Liu, J.; Yu, Y.; Gao, H.; Qin, X.; Bai, X. Depressants for separation of chalcopyrite and molybdenite: Review and prospects. Miner. Eng. 2023, 201, 108209. [Google Scholar] [CrossRef]
- Tang, X.; Chen, Y.; Liu, K.; Zeng, G.; Peng, Q.; Li, Z. Selective flotation separation of molybdenite and chalcopyrite by thermal pretreatment under air atmosphere. Colloids Surf. A Physicochem. Eng. Asp. 2019, 583, 123958. [Google Scholar] [CrossRef]
- Liang, G.; Chimonyo, W.; Lv, J.; Peng, Y. Differential depression of calcium lignosulfonate on chalcopyrite and molybdenite flotation with collector kerosene. Miner. Eng. 2023, 201, 108192. [Google Scholar] [CrossRef]
- Qi, M.; Peng, W.; Wang, W.; Cao, Y.; Zhang, L.; Huang, Y. A novel molybdenite depressant for efficient selective flotation separation of chalcopyrite and molybdenite. Int. J. Min. Sci. Technol. 2024, 34, 1179–1196. [Google Scholar] [CrossRef]
- Zhang, S.; Feng, Q.; Wen, S.; Xian, Y.; Liu, J.; Liang, G. Flotation separation of chalcopyrite from molybdenite with sodium thioglycolate: Mechanistic insights from experiments and MD simulations. Sep. Purif. Technol. 2024, 342, 126958. [Google Scholar] [CrossRef]
- Pan, C.-L.; Wei, X.-X.; Zhang, X.-G.; Xu, Y.-W.; Xu, P.-F.; Luo, Y.-C. 2-((5-Mercapto-1,3,4-thiadiazol-2-yl)thio)acetic acid as a novel chalcopyrite depressant for selective flotation separation of molybdenite from chalcopyrite. Miner. Eng. 2022, 183, 107625. [Google Scholar] [CrossRef]
- Cheng, D.; Ao, X.; Yuan, X.; Liu, Q. Effect of dissolved metal ions from mineral surfaces on the surface wettability of phosphate ore by flotation. Colloids Surf. A Physicochem. Eng. Asp. 2024, 701, 134995. [Google Scholar] [CrossRef]
- Hao, J.; Liu, J.; Lai, H.; Liao, R.; Gao, H.; Bai, X. A new application of Cu2+ on differential modification to promote copper–molybdenum separation with a novel chalcopyrite depressant amidinothiourea. Sep. Purif. Technol. 2025, 353, 128282. [Google Scholar] [CrossRef]
- Yang, W.; Qiu, X.; Liu, C.; Zhao, G.; Yan, H.; He, X.; Ding, K.; Jiao, Q.; Qiu, T. Flotation separation of chalcopyrite and molybdenite in advanced oxidation systems: Experimental and mechanism study. Powder Technol. 2025, 457, 120876. [Google Scholar] [CrossRef]
- Cai, J.; Jia, X.; Ma, Y.; Pei, B.; Ibrahim, A.M.; Su, C.; Shen, P.; Liu, D. Separation of copper-sulfur using sodium polyacrylate as pyrite depressant in acidic pulp: Floatability and adsorption studies. Miner. Eng. 2022, 188, 107815. [Google Scholar] [CrossRef]
- Chandra, A.P.; Gerson, A.R. A review of the fundamental studies of the copper activation mechanisms for selective flotation of the sulfide minerals, sphalerite and pyrite. Adv. Colloid. Interface Sci. 2009, 145, 97–110. [Google Scholar] [CrossRef]
- Liu, M.; Cheng, C.; Wang, L.; Qiu, Z.; Liu, S.; Chen, W.; Liu, G. The green separation of sphalerite from pyrite: Triazine-dithione collector and its flotation mechanism. Colloids Surf. A Physicochem. Eng. Asp. 2025, 718, 136947. [Google Scholar] [CrossRef]
- Hirajima, T.; Suyantara, G.P.W.; Ichikawa, O.; Elmahdy, A.M.; Miki, H.; Sasaki, K. Effect of Mg2+ and Ca2+ as divalent seawater cations on the floatability of molybdenite and chalcopyrite. Miner. Eng. 2016, 96, 83–93. [Google Scholar] [CrossRef]
- Özçelik, S.; Ekmekçi, Z. Surface Chemistry and Flotation of Gold-Bearing Pyrite. Minerals 2024, 14, 914. [Google Scholar] [CrossRef]
- Feng, Q.; Zhao, G.; Zhang, G.; Zhao, W.; Han, G. Degradation mechanism of surface hydrophobicity by ferrous ions in the sulfidization flotation system of smithsonite. Colloids Surf. A Physicochem. Eng. Asp. 2022, 648, 129119. [Google Scholar] [CrossRef]
- Zhang, Q.; Zhu, H.; Yang, B.; Jia, F.; Yan, H.; Zeng, M.; Qu, H. Effect of Pb2+ on the flotation of molybdenite in the presence of sulfide ion. Results Phys. 2019, 14, 102361. [Google Scholar] [CrossRef]
- Yuanjia Luo, W.S.; Han, H.; Peng, J.; Jiang, F. Uncovering the oxidation mechanism of sphalerite (ZnS) in the absence and presence of water: A first-principles investigation. Int. J. Min. Sci. Technol. 2025, 35, 149–157. [Google Scholar]
- Zhong, J.; Zhang, Q.; Xing, S.; Sun, W.; Tang, H.; Zhang, L.; Jiang, F.; Luo, Y. A new attempt for low-alkalinity flotation separation of chalcopyrite/molybdenite from pyrite using nonpolar collectors. J. Mol. Liq. 2025, 422, 126898. [Google Scholar] [CrossRef]
- Luo, Y.; Xia, Y.; Wang, C.; Chen, J.; Ou, L. Application of calcium lignosulphonate as an environmentally friendly depressant in the Cu–As separation by froth flotation at low alkalinity. J. Clean. Prod. 2023, 406, 137073. [Google Scholar] [CrossRef]
- Qiu, T.; Ding, K.; Yan, H.; Yang, L.; Wu, H.; Zhao, G.; Qiu, X. Electrochemistry and DFT study of galvanic interaction on the surface of monoclinic pyrrhotite (001) and galena (100). Int. J. Min. Sci. Technol. 2024, 34, 1151–1162. [Google Scholar] [CrossRef]
- Luo, A.; Chen, J. Effect of hydration and hydroxylation on the adsorption of metal ions on quartz surfaces: DFT study. Appl. Surf. Sci. 2022, 595, 153553. [Google Scholar] [CrossRef]
- Luo, Y.; Ou, L.; Chen, J. Experimental and computational study of the differential sulfidization mechanism of smithsonite and calcite. Miner. Eng. 2023, 198, 108102. [Google Scholar] [CrossRef]
- Luo, Y.; Sun, W.; He, S.; Peng, J.; Jiang, F. Innovative discovery on the impact of hydration on the alternative flotation of smithsonite and calcite under benzohydroxamic acid system. J. Mol. Liq. 2024, 415, 126433. [Google Scholar] [CrossRef]
- Luo, Y.; Ou, L.; Chen, J.; Zhang, G.; Xia, Y.; Zhu, B.; Zhou, H. Study on the enhancement mechanism of Pb ion on smithsonite sulfidation with coordination chemistry and first-principles calculations. Appl. Surf. Sci. 2022, 597, 153672. [Google Scholar] [CrossRef]
- Butt, H.-J.; Liu, J.; Koynov, K.; Straub, B.; Hinduja, C.; Roismann, I.; Berger, R.; Li, X.; Vollmer, D.; Steffen, W.; et al. Contact angle hysteresis. Curr. Opin. Colloid. Interface Sci. 2022, 59, 101574. [Google Scholar] [CrossRef]
- Chau, T.T.; Bruckard, W.J.; Koh, P.T.; Nguyen, A.V. A review of factors that affect contact angle and implications for flotation practice. Adv. Colloid. Interface Sci. 2009, 150, 106–115. [Google Scholar] [CrossRef]
- Zhao, L.; Zhuang, L.; Zhang, Z. The direct observation and distribution regularity of contact angle for spherical particle attached to air bubble in static three-phase system. Miner. Eng. 2023, 201, 108191. [Google Scholar] [CrossRef]
- Kruszelnicki, M.; Polowczyk, I.; Kowalczuk, P.B. Insight into the influence of surface wettability on flotation properties of solid particles–Critical contact angle in flotation. Powder Technol. 2024, 431, 119056. [Google Scholar] [CrossRef]
- Feng, Q.; Zhao, W.; Wen, S.; Cao, Q. Activation mechanism of lead ions in cassiterite flotation with salicylhydroxamic acid as collector. Sep. Purif. Technol. 2017, 178, 193–199. [Google Scholar] [CrossRef]
- Salmani Nuri, O.; Irannajad, M.; Mehdilo, A. Effect of surface dissolution by oxalic acid on flotation behavior of minerals. J. Mater. Res. Technol. 2019, 8, 2336–2349. [Google Scholar] [CrossRef]
- Zhang, Q.; Wen, S.; Feng, Q.; Zhang, S. Surface characterization of azurite modified with sodium sulfide and its response to flotation mechanism. Sep. Purif. Technol. 2020, 242, 116760. [Google Scholar] [CrossRef]
- Huang, X.; Zhang, Q. Depression mechanism of acid for flotation separation of fluorapatite and dolomite using ToF-SIMS and XPS. J. Mol. Liq. 2024, 394, 123584. [Google Scholar] [CrossRef]
- Liu, R.; Liu, D.; Li, J.; Liu, S.; Liu, Z.; Gao, L.; Jia, X.; Ao, S. Improved understanding of the sulfidization mechanism in cerussite flotation: An XPS, ToF-SIMS and FESEM investigation. Colloids Surf. A Physicochem. Eng. Asp. 2020, 595, 124508. [Google Scholar] [CrossRef]
- Zhang, N.; Ejtemaei, M.; Nguyen, A.V.; Zhou, C. XPS analysis of the surface chemistry of sulfuric acid-treated kaolinite and diaspore minerals with flotation reagents. Miner. Eng. 2019, 136, 1–7. [Google Scholar] [CrossRef]
- Zhao, Q.; Liu, W.; Wei, D.; Wang, W.; Cui, B.; Liu, W. Effect of copper ions on the flotation separation of chalcopyrite and molybdenite using sodium sulfide as a depressant. Miner. Eng. 2018, 115, 44–52. [Google Scholar] [CrossRef]
- Yang, B.; Wang, D.; Wang, T.; Zhang, H.; Jia, F.; Song, S. Effect of Cu2+ and Fe3+ on the depression of molybdenite in flotation. Miner. Eng. 2019, 130, 101–109. [Google Scholar] [CrossRef]
- Li, W.; Li, Y.; Wu, X.; Wang, Z.; Wei, Z. Pyrite activation in seawater flotation by copper and lead ions: XPS and in-situ electrochemical investigation. Appl. Surf. Sci. 2025, 680, 161363. [Google Scholar] [CrossRef]
- Huang, W.; Liu, R.; Jiang, F.; Tang, H.; Wang, L.; Sun, W. Adsorption mechanism of 3-mercaptopropionic acid as a chalcopyrite depressant in chalcopyrite and galena separation flotation. Colloids Surf. A Physicochem. Eng. Asp. 2022, 641, 128063. [Google Scholar] [CrossRef]
- Zhang, X.; Jiang, X.; Luo, A.; Chen, J.; Meng, Y. A modified co-polyacrylamide to depress molybdenite in Cu/Mo separation and its competitive adsorption mechanism between reagents. Sep. Purif. Technol. 2024, 337, 126239. [Google Scholar] [CrossRef]
- Jiang, F.; Zhang, L.; Yue, T.; Tang, H.; Wang, L.; Sun, W.; Zhang, C.; Chen, J. Defect-boosted molybdenite-based co-catalytic Fenton reaction. Inorg. Chem. Front. 2021, 8, 3440–3449. [Google Scholar] [CrossRef]
- Liu, S.; Xie, L.; Liu, G.; Zhong, H.; Wang, Y.; Zeng, H. Hetero-difunctional Reagent with Superior Flotation Performance to Chalcopyrite and the Associated Surface Interaction Mechanism. Langmuir 2019, 35, 4353–4363. [Google Scholar] [CrossRef]
- Pan, W.; Li, S.; Zhu, Y.; Gao, L.; Ma, Z.; Cao, Y.; Du, S. Hydration mechanism of molybdenite affected by surface oxidation: New insights from DFT and MD simulations. Colloids Surf. A Physicochem. Eng. Asp. 2024, 698, 134599. [Google Scholar] [CrossRef]


Disclaimer/Publisher’s Note: The statements, opinions and data contained in all publications are solely those of the individual author(s) and contributor(s) and not of MDPI and/or the editor(s). MDPI and/or the editor(s) disclaim responsibility for any injury to people or property resulting from any ideas, methods, instructions or products referred to in the content. |
© 2025 by the authors. Licensee MDPI, Basel, Switzerland. This article is an open access article distributed under the terms and conditions of the Creative Commons Attribution (CC BY) license (https://creativecommons.org/licenses/by/4.0/).