Article

Comparison of Finger Flexor Strength and Muscle Quality Between Climbers and Non-Climbers: Influence of Sex and Grip Type

by
Diego González-Martín
1,
Javier Santos-Pérez
1,
Sergio Maroto-Izquierdo
2,*,
José Antonio de Paz
1 and
Ángel Gallego-Selles
3,*
1
Faculty of Physical Activity and Sports Sciences and Institute of Biomedicine (IBIOMED), Universidad de León, 24007 León, Spain
2
i+HeALTH, Strategic Research Group, European University Miguel de Cervantes (UEMC), 47012 Valladolid, Spain
3
Department of Physical Education and Research Institute of Biomedical and Health Sciences (IUIBS), University of Las Palmas Gran Canaria, 35017 Las Palmas Gran Canaria, Spain
*
Authors to whom correspondence should be addressed.
Appl. Sci. 2025, 15(13), 7161; https://doi.org/10.3390/app15137161
Submission received: 6 June 2025 / Revised: 20 June 2025 / Accepted: 24 June 2025 / Published: 25 June 2025
(This article belongs to the Special Issue Biomechanics and Technology in Sports)

Abstract

Climbing demands exceptional isometric finger flexor strength and neuromuscular efficiency. This study aimed to compare maximum isometric strength and muscle quality (MQ) between climbers and non-climbers and examine the influence of sex and specific grip types. Methods: 33 climbers (14 women) and 29 non-climbers (15 women) volunteered in this study. Maximum isometric strength was measured for handgrip, three-finger drag, and half-crimp grips, while forearm muscle mass was estimated using DXA. MQ was calculated as the ratio of peak isometric force to forearm muscle mass. Results: Climbers demonstrated significantly higher isometric strength in both the three-finger drag and half-crimp grips compared to non-climbers (p < 0.01); however, non-significant differences were observed in handgrip strength. Despite similar forearm muscle mass, climbers exhibited greater MQ. Notably, female non-climbers showed higher MQ than their male counterparts (p < 0.05), a sex difference that was not evident among climbers. All tests exhibited high repeatability (ICC > 0.93, CV < 5.81%) with low SEM and MDC95 values. Conclusions: The findings underscore the necessity of employing climbing-specific strength assessments to capture the unique neuromuscular adaptations induced by climbing training. Muscle quality emerges as a sex-neutral biomarker for strength performance evaluation, with potential applications in the optimization of training programs. Future research should further explore the predictive value of MQ and strive for standardized testing protocols.

1. Introduction

Unlike many other sports that rely on dynamic strength, climbing requires sustained force production in isometric holds, underscoring the importance of grip strength in this discipline. The ability to generate force in the grip is recognized as a key performance factor due to its essential role in supporting body weight and maintaining secure holds [1]. Extensive research has consistently demonstrated that climbers exhibit significantly greater grip strength than non-climbers when assessed with both climbing-specific strength tests that mimic climbing positions and handgrip strength tests [2,3,4,5,6,7,8,9,10], with the magnitude of these differences more pronounced at higher levels of climbing skill [4,6,11]. Although some studies have employed handheld dynamometers to assess finger strength in climbers [9,10], these instruments may lack the specificity needed to accurately measure the finger flexor strength essential for climbing [12,13]. This limitation may stem from their design, which emphasizes thumb involvement and general hand function rather than replicating the grip types and finger-loading patterns commonly used in climbing. Consequently, they may not fully capture the sport-specific adaptations developed through climbing practice. In addition, studies examining finger flexor strength through various climbing-specific assessments have shown inconsistent results [3,4,5,7]. While some studies describe greater specialized grip strength in climbers [4,5,7], other authors report no significant differences between recreational climbers and non-climbers [3]. This discrepancy in results complicates the establishment of clear evidence regarding the extent to which finger flexor isometric strength distinguishes climbers from non-climbers, underscoring the necessity for more precise and specific assessment devices and protocols.
Accurate assessment of isometric finger flexor strength in climbers must consider that climbing involves various grip types (such as open hand, drag, and half-crimp), which can significantly impact climbing performance [11,14,15,16]. The three-finger drag grip, involving only the front three fingers (digits II–IV), reduces the impact of variations in the fifth digit’s length, which can affect the degree of extension in digits III and IV. This approach helps standardize measurements by minimizing the variability introduced by different hand anthropometrics, thereby allowing for more accurate assessments of open-hand strength specific to the slope grip technique [14]. In contrast, the half-crimp grip, essential for more demanding routes, allows force application up to the distal phalanges and enhances force production through effective engagement of the flexor digitorum profundus and increased activation of intrinsic hand muscles [17,18].
Although the isometric strength of finger flexors has been frequently studied in climbers and other populations [5,11,14,19,20,21], few of these studies report repeatability and reliability values beyond the intraclass correlation coefficient (ICC) [5,11,14,19]. These values have limited practical utility, as the specific procedure used to calculate the ICC is often not specified [5], and most fail to report the standard error of measurement (SEM) or the minimum detectable change (MDC). These variables are essential for interpreting the likelihood of change magnitude as a result of training or for comparisons between populations.
In climbing, the ability to support body mass can be a key factor in performance. Therefore, besides muscle strength, body composition has been widely studied in climbers of different skill levels, as well as in comparisons between climbers and non-climbers, with findings indicating that climbers tend to maintain a low body fat percentage [1,22]. In addition to assessing strength and body composition separately, it is useful to consider muscle quality (MQ), which refers to the ability of a muscle to generate force relative to its mass [23,24]. This parameter may offer a more functional perspective on athletic performance [25], particularly in sports like climbing, where optimizing strength without excessive mass is advantageous. In climbing, optimizing MQ could enhance strength-to-mass ratios critical for performance [13]. However, the implications of climbing practice and sex differences on MQ remain insufficiently explored. Investigating these factors could contribute to the development of specialized climbing training programs aimed at optimizing the strength-to-mass ratio, prioritizing muscle efficiency over muscle hypertrophy.
The impact of sex on finger flexor strength in climbers has not been thoroughly investigated, as most studies focus on male climbers [8,26]. Although traditional assessments indicate that men generally exhibit greater muscle strength than women [27,28], the magnitude of these differences tends to diminish when strength is normalized to muscle mass [29]. Several studies have reported that females exhibit superior upper limb MQ compared to males [30,31], although the underlying mechanisms for this observation remain poorly understood. Further research is needed to better understand these complex interactions, which could inform sex-specific training approaches to optimize the effectiveness of climbing training programs.
The objective of this study was to compare muscle strength and quality between climbers and non-climbers, as well as between males and females, by evaluating maximal handgrip strength and isometric finger flexor strength in two specific climbing grip types. Additionally, the study aimed to analyze the repeatability and reliability of these measurements by determining the SEM and MDC.

2. Materials and Methods

2.1. Subjects

An observational, cross-sectional, and comparative study was conducted with the participation of 62 individuals: 29 physically active non-climbers (15 women) and 33 climbers (14 women). Climbers had a minimum climbing grade of intermediate to elite based on the International Rock Climbing Research Association (IRCRA) grading table [32]. Inclusion criteria required climbers to have completed at least a 6A-grade redpoint route within the past six months and to have had no musculoskeletal injuries in the three months prior to the study. Climbers were contacted through informational posters placed in climbing gyms, while non-climbers were students enrolled in the Sports Science Degree at the University of León with no previous climbing experience. Recruitment took place between December 2023 and January 2024. All participants completed a health screening questionnaire and provided written informed consent prior to their inclusion in the study after receiving both oral and written information describing the study procedures, potential risks, and anticipated benefits. The study was conducted in accordance with the Declaration of Helsinki. All data were anonymized and handled confidentially. Due to its observational design and the use of routine, non-invasive testing procedures, ethical review and approval were waived.
Before data collection, an a priori power analysis was conducted to determine the optimal sample size for the comparative study. The analysis aimed to achieve a statistical power of 0.80 (80%) with a significance level (α) of 0.05, ensuring appropriate sensitivity to detect differences between groups. The calculation assumed a large effect size (Cohen’s d = 0.8) based on effect sizes reported in a recently published climbing-specific strength study [14]. To perform this analysis, we used the statistical software GPower (GPower 3.1.9.2, Heinrich Heine University Düsseldorf, Düsseldorf, Germany; http://www.gpower.hhu.de/, accessed on 15 December 2023). The test family selected was t-tests, with an analysis type of “Means: Difference between two independent means (two groups)” and a two-tailed distribution. Based on these parameters, a minimum sample size of 26 participants per group was required to achieve sufficient statistical power. The final sample of 70 participants (33 climbers and 29 non-climbers) exceeded this minimum requirement, thereby increasing the robustness of the study and enhancing the ability to detect meaningful group differences while maintaining statistical rigor.

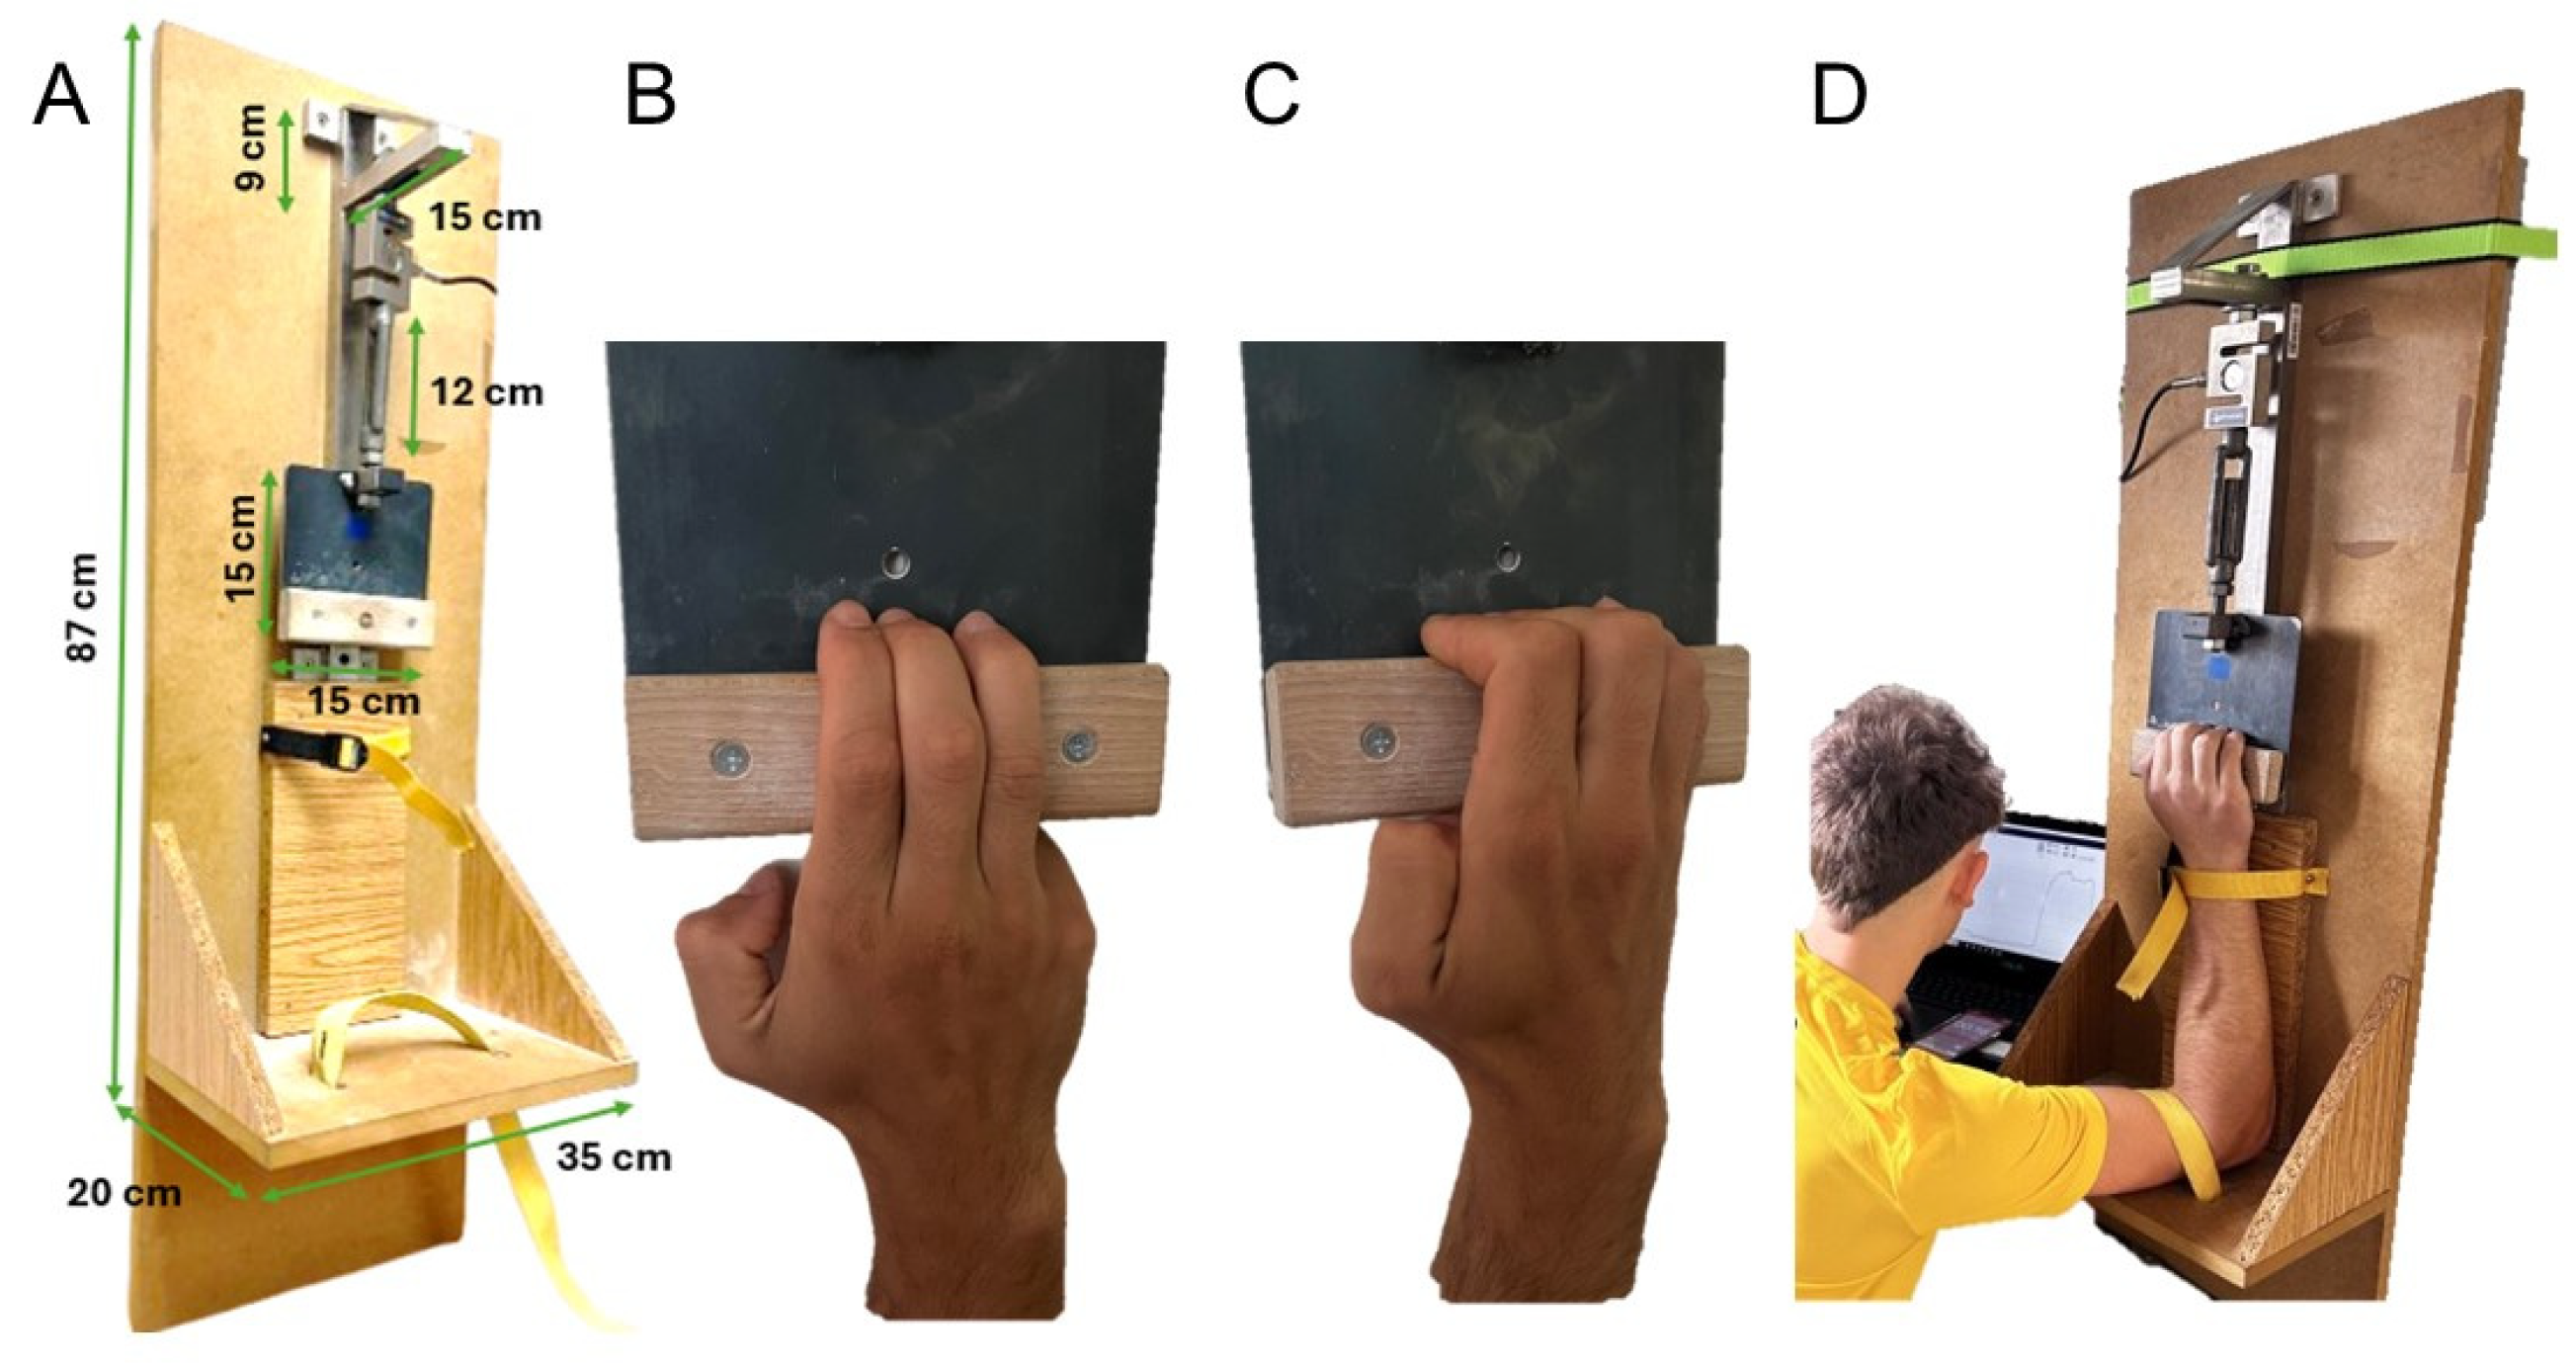
2.2. Muscle Strength Assessment

To minimize residual fatigue, participants were instructed to avoid moderate to intense physical activity on the day before testing and to refrain from consuming stimulant beverages on the day of testing. Prior to testing, participants completed a standardized warm-up protocol designed to ensure neuromuscular readiness and minimize variability across individuals. The protocol began with 5 min of low-intensity aerobic exercise on an elliptical machine (Reebok OneGX60, Reebok, Boston, MA, USA), performed at a perceived exertion level of 3–4 out of 10. This general warm-up was followed by two maximal-effort handgrip measurements per hand using a Jamar FS658 dynamometer (Patterson Medical, Warrenville, IL, USA), conducted with participants seated, the tested arm hanging naturally, the non-tested hand resting on the thigh, and both feet flat on the ground. Subsequently, participants completed a specific climbing warm-up involving eight unilateral, intermittent isometric contractions for each grip type (three-finger drag and half-crimp). The intensity of these efforts was progressively increased from approximately 50% to 75% of each participant’s perceived maximal voluntary contraction. Each repetition lasted 3–4 s, with 20 s of rest between repetitions. This protocol was adapted from previously validated procedures for climbing-specific strength testing [30,31] and aimed to ensure grip-specific neuromuscular activation while avoiding fatigue. The warm-up also served as a familiarization with the custom testing device and grip positions used in the subsequent maximal strength assessments.
The climbing-specific grips were tested using a custom-built device, which was adjusted to correspond to the arm length of each participant. The device, developed by the researchers and shown in Figure 1, consisted of a stationary section fixed to the wall, from which a metal arm extended. A strain gauge (Chronojump 500 kg, frequency 160 Hz) was attached to this metal extension and remained stable throughout the test. On the opposite side of the strain gauge, a 20 mm wooden support bar (150 × 40 × 20 mm, rounded edges) was positioned, serving as the point where participants applied force during the test. To isolate finger flexor activation, the arm and forearm were immobilized. To evaluate finger flexor strength, participants performed two different unilateral isometric tests in a randomized order. Each participant completed a fixed three-finger drag grip test and a fixed half-crimp grip test. The order of these tests and the hand used at the beginning of each test were randomized to control for potential order effects. Each test consisted of three maximal isometric contractions per hand, with each contraction lasting five seconds. The timing of each contraction was controlled using a mobile application that provided audible cues signaling both the start and end of the test. A 2-minute resting period was provided between each attempt. Participants were instructed to apply maximal force immediately upon hearing the start signal and to maintain this effort for the entire duration until the end signal was heard. To ensure consistency and optimal execution, two evaluators provided uniform verbal encouragement throughout each trial, supporting participants from the beginning to the end of the contraction period.
During the tests of climbing-specific maximal isometric strength, the thumb was excluded to avoid contribution to the measured force [33]. Additionally, participants were instructed to maintain the little finger (fifth digit) in a flexed position without contact with the support bar. This posture was visually verified by the evaluators during each trial to minimize synergistic interference. A medical professional was present during testing sessions, but no injuries or discomfort were reported. The data were recorded using the integrated software of Chronojump (version 2.5.0). The repetition corresponding to the arm with the highest maximal force value was selected, and the three measurements obtained from the same arm were used to calculate repeatability. To assess the repeatability of each test, we analyzed the three measurements obtained from the specific finger strength tests (three-drag and half-crimp) and the two measurements from the handgrip test.

2.3. Body Composition and Muscle Quality Assessment

In a separate testing session, participants arrived at the laboratory after an overnight fast. They underwent a dual-energy X-ray absorptiometry (DXA, Lunar Prodigy, GE Healthcare® Chicago, IL, USA), with enCore 2009 software (version 13.20.033) scan of their whole body, following the standards of the International Society for Clinical Densitometry (ISCD). Bone-free lean mass (BFLM) of the forearms was determined by defining the Region of Interest (ROI) using anatomical landmarks, specifically the humero-radial joint line at the proximal end and the radio-carpal joint line at the distal end. Muscle quality was assessed as the ratio of peak isometric force measured in the half-crimp, three-finger drag, and handgrip tests to the forearm BFLM, assumed as forearm muscle mass.

2.4. Statistical Analysis

Descriptive statistics were reported as mean ± standard deviation (SD). Data normality was assessed using the Shapiro–Wilk test. Based on the distribution of the data, group comparisons were conducted using either the Student’s t-test or the Mann–Whitney U test. Measurement repeatability was evaluated using the intraclass correlation coefficient, calculated with a two-way random-effects model for absolute agreement (ICC [2,1]) across multiple repetitions. Additional reliability indices were calculated for each test and each individual, including the coefficient of variation (CV), standard error of measurement (SEM = SD × √(1−(ICC), and minimum detectable change (MDC95 = 1.96 × SEM × √2). Effect size, determined using Cohen’s d, was categorized as trivial (ES < 0.25), small (0.25–0.5), moderate (0.5–1), and large (>1), and statistical significance was set at p < 0.05. Data were analyzed using IBM SPSS Statistics version 25.

3. Results

3.1. Participant Characteristics

The characteristics of the participants are shown in Table 1. Climbers had an average of 5.7 ± 4.0 years of climbing experience with a 15.7 ± 3.9 IRCRA level and showed a higher mean age (27.6 ± 3.8 years) compared to non-climbers (23.1 ± 3.1 years). The participating climbers (n = 33) were classified according to the IRCRA ability levels, as defined by Draper et al. [32], ranging from 6A to 8B. Based on these criteria, twenty climbers (60.6%) were classified as intermediate, ten climbers (30.3%) as advanced, and three climbers (9.1%) as elite. Although no significant differences were found in height or weight between the groups, climbers displayed a lower Body Mass Index than non-climbers (21.7 ± 3.0 vs. 23.5 ± 2.5, respectively), with this difference being particularly pronounced among female participants (p < 0.05). Furthermore, the body fat percentage was significantly different between the groups, with climbers exhibiting a percentage of 17.0 ± 8.0, in contrast to 21.5 ± 8.9 in non-climbers. No differences were observed between both groups in terms of arm span, ape index (height/arm span), or forearm length. Additionally, climbers exhibited similar forearm muscle mass compared to non-climbers (p = 0.228). When analyzed by sex, male climbers exhibited a slightly higher forearm muscle mass than male non-climbers, with a 1.04-fold increase (p = 0.549). Similarly, female climbers showed higher values compared to female non-climbers, with a 1.07-fold increase (p = 0.215).

3.2. Isometric Strength

Climbers demonstrated significantly higher isometric strength than non-climbers, with increases of approximately 1.38-fold and 1.44-fold in the three-finger drag and half-crimp grip positions, respectively (p < 0.01, ES > 1; Table 2). This pattern was consistent across both male and female climbers when compared to their non-climbing counterparts. Specifically, male climbers exhibited significantly greater isometric strength than male non-climbers, with increases of approximately 1.35-fold in the three-finger drag (p < 0.01, ES = 1.16) and 1.40-fold in the half-crimp grip (p < 0.01, ES = 1.45). Similarly, female climbers showed substantially higher isometric strength than female non-climbers, with a 1.31-fold increase in the three-finger drag (p < 0.01, ES > 1.23) and a 1.37-fold increase in the half-crimp grip (p < 0.01, ES > 1.69).
Notably, no significant differences were observed in handgrip strength between climbers and non-climbers overall (p = 0.16, Table 2). However, a sex-specific analysis revealed that female climbers demonstrated approximately 1.13-fold higher handgrip strength compared to non-climbing women (p < 0.05), whereas no significant differences were found between male climbers and male non-climbers. Additionally, significant sex-based differences were observed within each group, with men consistently exhibiting higher strength values than women across all grip positions.

Relative Strength to Body Weight
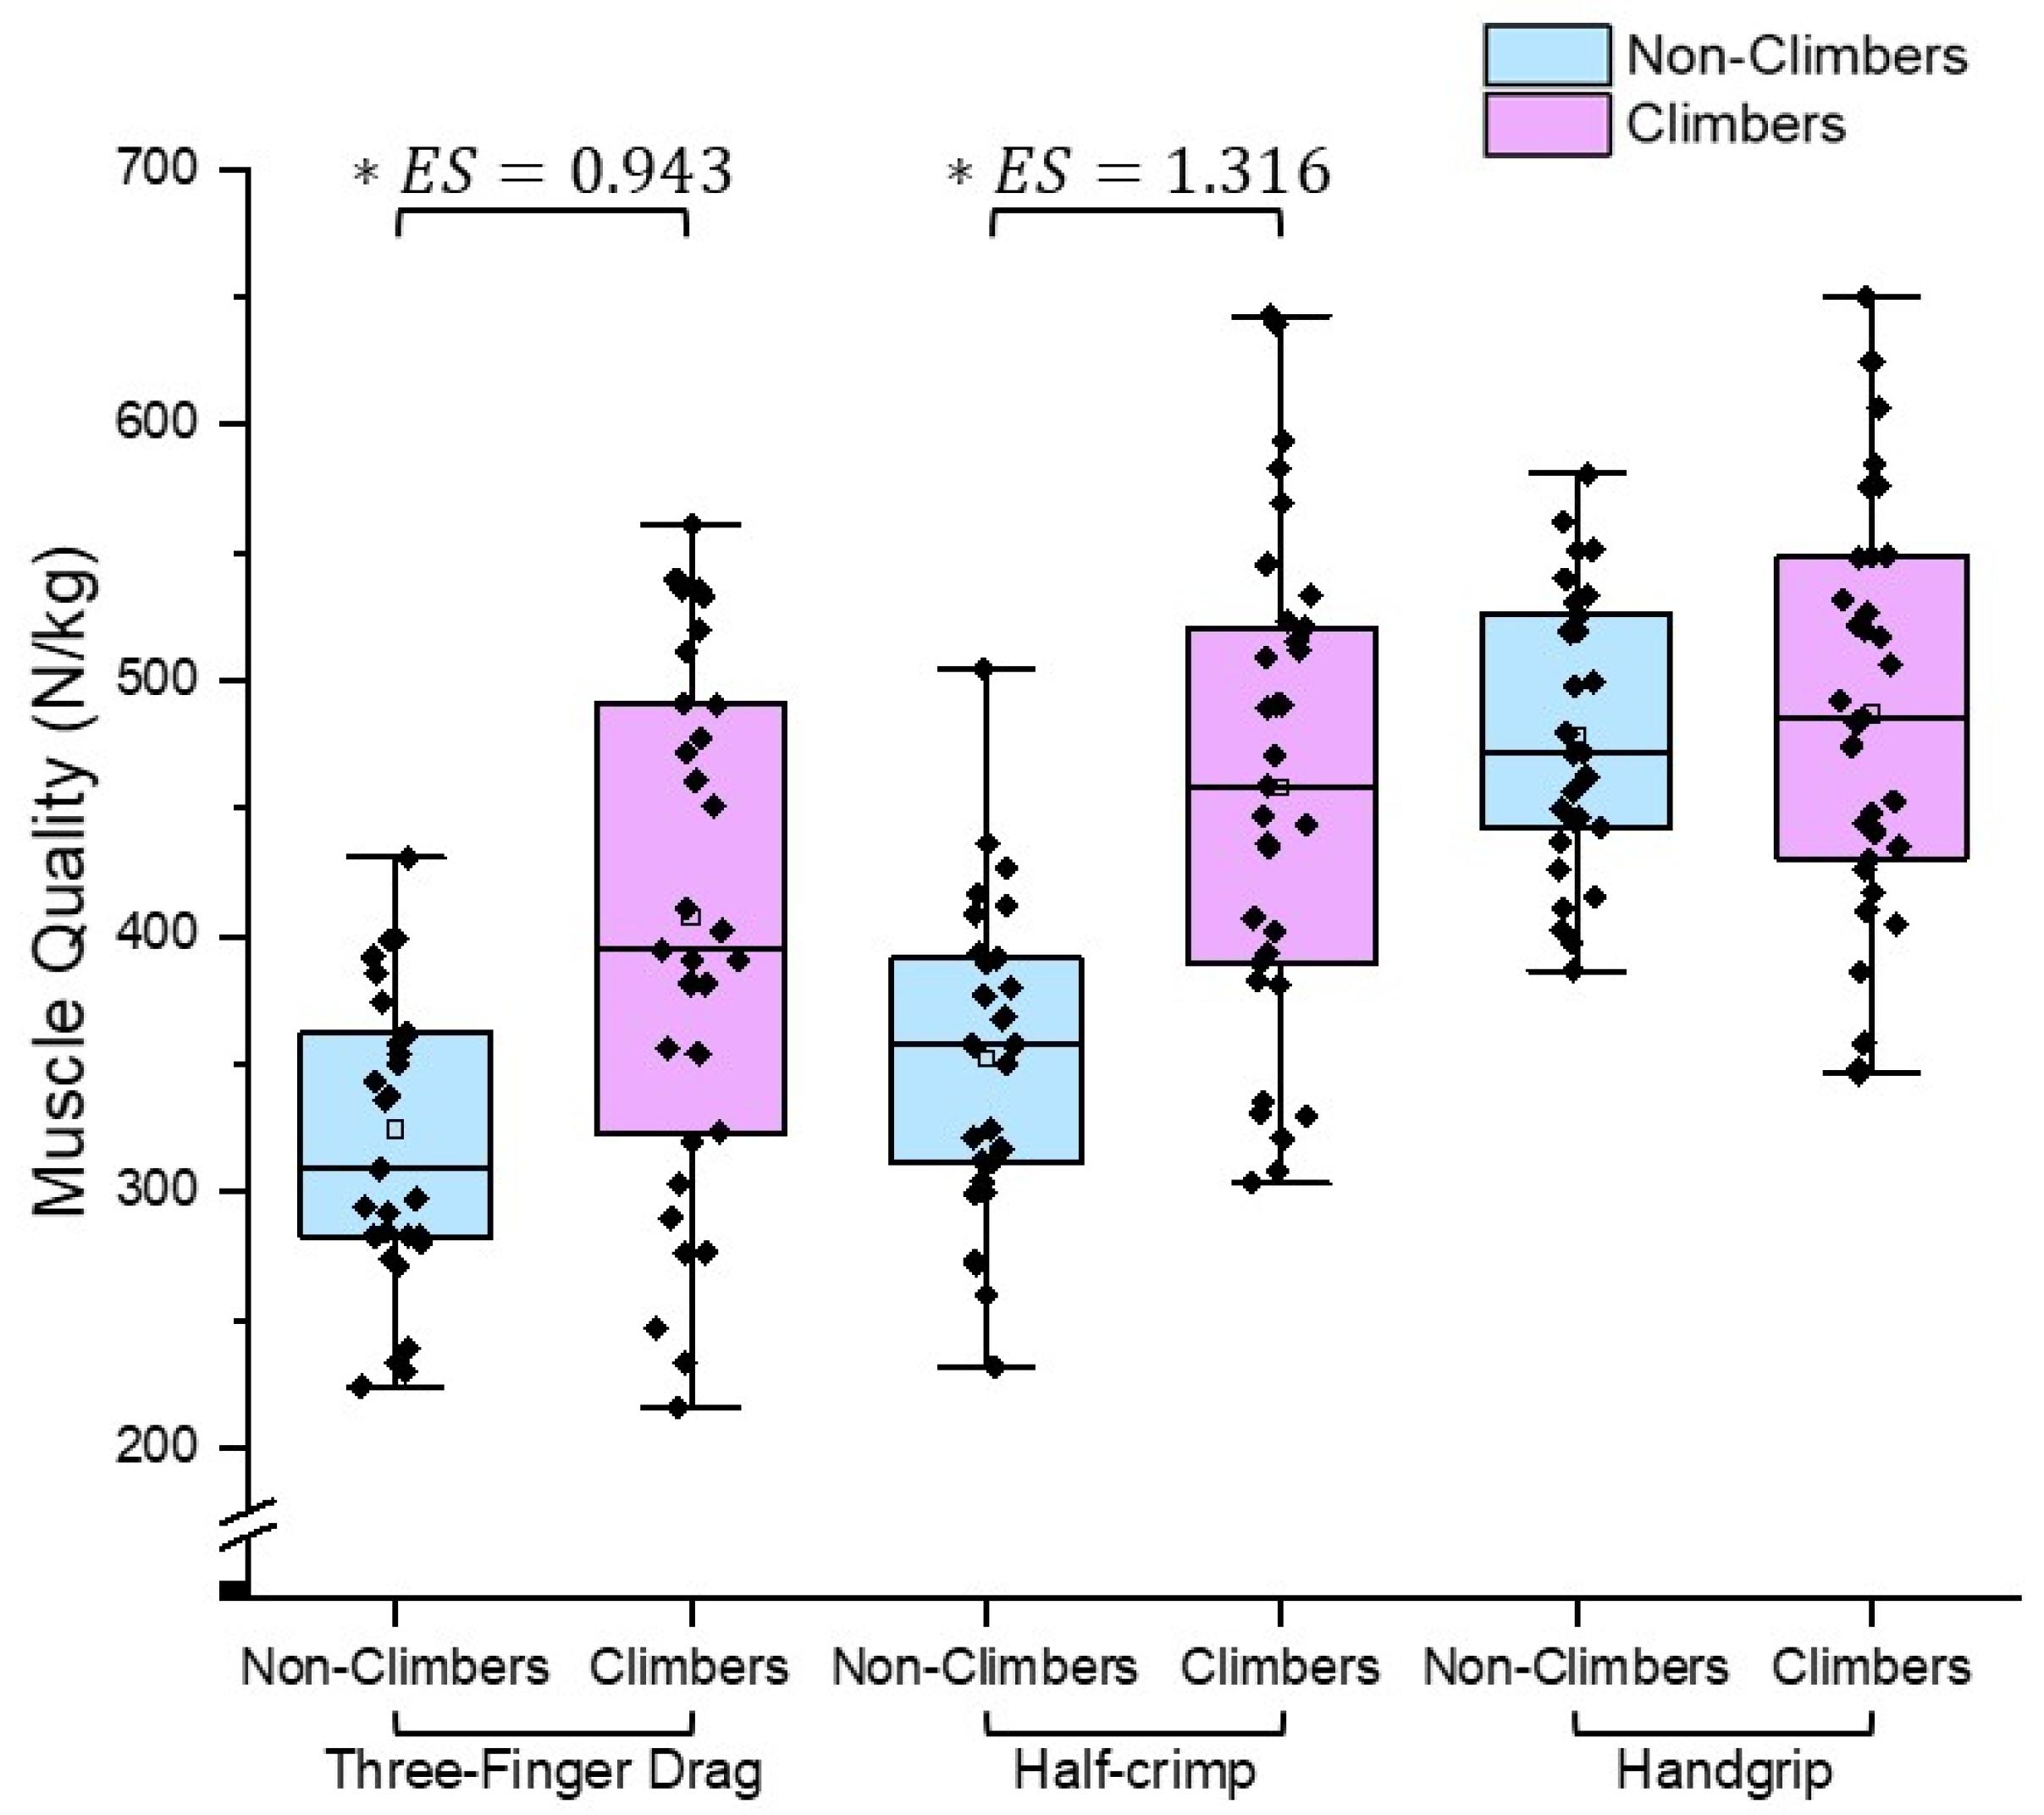
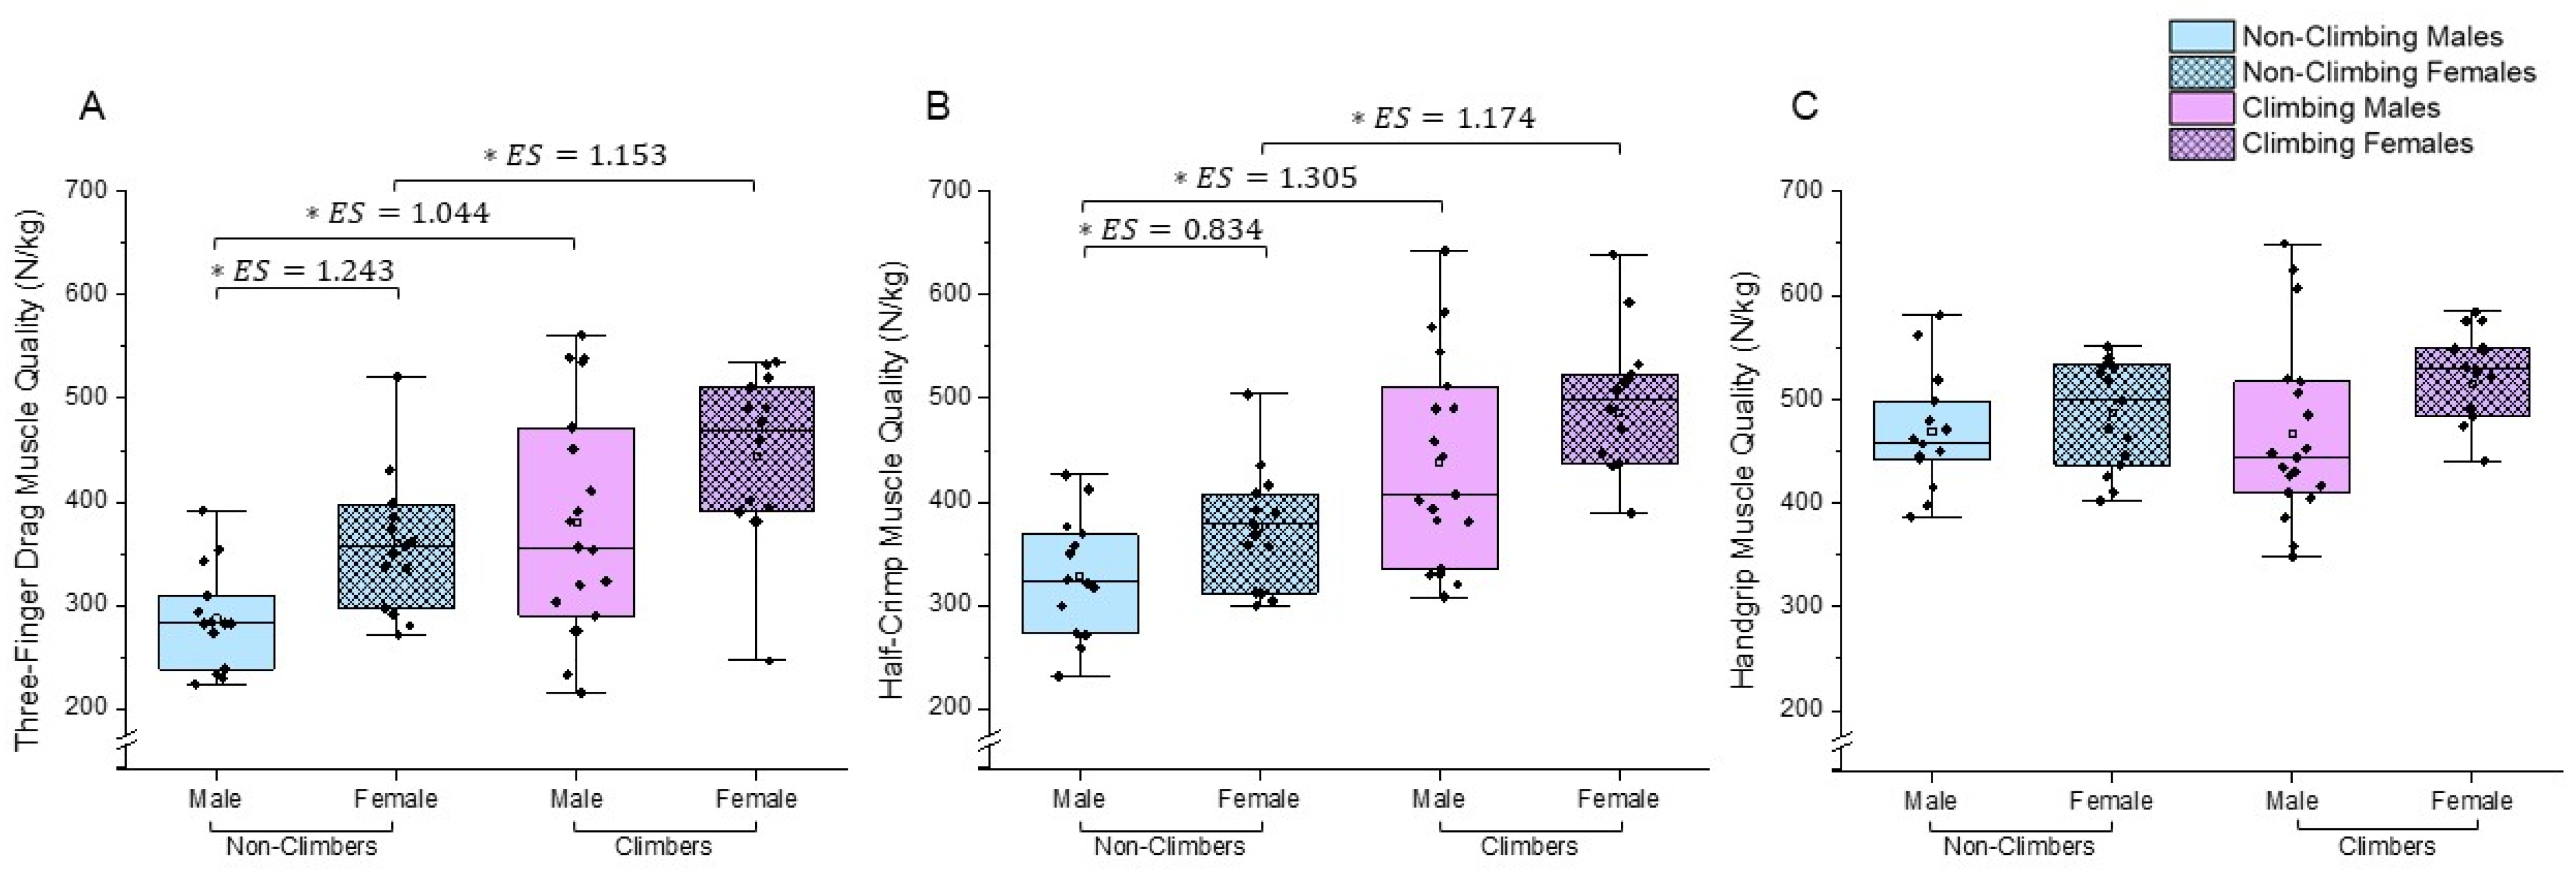
When normalized to body weight, all three strength measurements (three-finger drag, half-crimp, and handgrip) were significantly different between climbers and non-climbers (p < 0.05, Table 2). Additionally, when considering body weight-normalized strength values, no differences were found in the three-finger drag and handgrip tests between men and women, regardless of the group.

3.3. Muscle Quality

When strength values were normalized to finger flexor muscle mass, MQ was significantly higher only in climbing-specific strength assessments in climbers compared to non-climbers (Figure 2). In the three-finger drag position, climbers exhibited approximately a 1.25-fold higher MQ (407.4 ± 102.0 vs. 324.6 ± 67.7 N/kg; p < 0.01, ES = 0.5–1). In the half-crimp position, climbers showed a 1.30-fold higher MQ (458.4 ± 94.7 vs. 352.3 ± 60.6 N/kg; p < 0.01, ES > 1). These results remained consistent when comparing male and female climbers to their non-climber counterparts (Figure 3, p < 0.01). Interestingly, while females demonstrated higher MQ values than males (Figure 3A–C), these sex differences reached statistical significance only within the non-climber group (p < 0.05).

3.4. Reliability

The repeatability of each strength test was evaluated using the two-way random-effects model with absolute agreement and a single rater ICC (ICC 2,1). The results demonstrated high reliability across all tests (Table 3), with ICC values of 0.969 for the three-finger drag test (95% CI: 0.953–0.981), 0.962 for the half-crimp test (95% CI: 0.942–0.976), and 0.936 for the handgrip (95% CI: 0.895–0.961). The CV was calculated to assess the within-subject variability for each set of measurements. The CV values were 5.35% for the three-finger drag, 5.81% for the half-crimp, and 5.67% for the handgrip test, reflecting a consistent level of variation across tests.
Absolute reliability was further evaluated through the SEM and the MDC95, reported both in absolute terms and as percentages. The SEM values were 17.52 for the three-finger drag (5.93% of the mean), 22.65 for the half-crimp (6.79% of the mean), and 30.23 for the handgrip (7.44% of the mean). The MDC95 values were 48.55 (16.42% of the mean) for the three-finger drag, 62.79 (18.82% of the mean) for the half-crimp, and 83.79 (20.63% of the mean) for the handgrip.

4. Discussion

The present study evaluated finger flexor strength and MQ in climbers and non-climbers, with a focus on identifying differences between these groups and analyzing variations between sexes. Our findings demonstrate that, during climbing-specific assessments, climbers exhibit significantly greater strength than non-climbers. Both absolute and body weight-normalized values were consistently higher in climbers. In contrast, while climbers outperformed non-climbers in sport-specific tests, traditional handgrip assessments failed to distinguish climbers from non-climbers, highlighting the necessity of sport-specific evaluations. Furthermore, climbers also displayed higher MQ in both the three-finger drag and half-crimp positions. Notably, among non-climbers, women demonstrated higher MQ than men despite lower maximal isometric strength and muscle mass, emphasizing the ability of MQ to capture subtle efficiency differences. Taken together, these findings emphasize the potential of MQ as a cross-population indicator and pave the way for comparing climbing-specific assessments with more general measurements.

4.1. Climbing-Specific Strength vs. General Dynamometry

Climbing performance relies on the ability to generate force through specialized grips [1], yet methodological inconsistencies (e.g., grip depth, testing duration, body positioning) impede cross-study comparisons [12,22]. For instance, differences in elbow flexion angles (90° vs. 180°) alter force production [34], highlighting the need for standardized protocols. Indeed, our data confirm that climbers exhibit superior isometric strength in the half-crimp and three-finger drag positions, whereas non-climbers showed no significant differences between these grip types. These differences, consistent with previous studies [20,22,35], can be attributed to sport-specific adaptations, such as structural changes (e.g., tendon stiffness) in the flexor digitorum profundus, or neural adaptations, such as enhanced neural drive [36,37]. Moreover, recent findings have demonstrated that grip force, especially in the half-crimp position, is significantly influenced by experience, sex, and training frequency, supporting our stratified analysis of these variables [16]. Notably, these grip techniques account for a substantial portion of climbing performance variance, with specific grips demonstrating distinct biomechanical demands. The half-crimp and three-drag grips collectively explain 66% of bouldering performance variance [14], with climbers generating significantly higher force in the half-crimp grip compared to non-climbers [20]. These differences arise from the distinct biomechanical demands of each grip: the half-crimp grip primarily isolates the flexor digitorum profundus, whereas the three-drag engages both the flexor digitorum superficialis and profundus through force applied at the distal phalanges [11,17].
Handgrip dynamometry, commonly used to differentiate climbers [2,6,38], failed to distinguish climbers from non-climbers in our study. Moreover, this discrepancy likely stems from its reliance on thenar muscles and thumb opposition, which diverge from climbing-specific mechanics where force is applied via the last phalanx during suspension [33]. These findings reinforce the need for standardized climbing-specific protocols to improve measurement sensitivity and reproducibility [34,39]. Some previous studies have reported no significant differences in grip strength between recreational climbers and non-climbers when using general handgrip tests in non-specific positions [3], although significant differences were observed in elite climbers. The use of such protocols may partly explain the absence of group differences, as they are likely less sensitive to climbing-related adaptations. In summary, the limited sensitivity of traditional handgrip assessments highlights the value of more specific protocols, such as fixed 90° elbow flexion and strict half-crimp positioning [12], suggesting that traditional dynamometry may need to be supplemented or replaced in future climbing research.

4.2. Body Composition and Muscle Quality Differences

Body composition is a critical factor influencing climbing performance [40], with studies using DXA showing that climbers generally have lower body fat percentages and increased lean muscle mass [35,40,41]. Indeed, recent findings suggest increased lean muscle mass in the forearm region among skilled climbers [42]. Nevertheless, we observed similar forearm muscle mass, muscle mass index, and anatomical metrics (e.g., ape index) between groups, consistent with findings in previous studies [1,8]. Despite similar forearm muscle mass and anatomical metrics, lower body fat percentage facilitates greater force production relative to body weight in climbers [43]. This optimized body composition is critical in climbing, where excess mass increases metabolic cost [41,44] and complicates the execution of complex movements and the maintenance of endurance during extended climbs [45]. Building on this, MQ emerges as a critical biomarker, offering insights into neuromuscular efficiency beyond traditional strength performance and neuromuscular metrics.
MQ, defined as force per unit muscle mass [25,30], reflects climbing-specific neuromuscular efficiency. In our study, climbers exhibited higher MQ in their finger flexors without increased muscle mass, indicating highly efficient force production. This efficiency aligns with the focus of elite climbers on functional adaptations (e.g., neural activation and muscle coordination) rather than hypertrophy [20]. Studies in other sports have shown that neural adaptations can compensate for lower muscle mass, emphasizing the relevance of MQ [25]. For example, comparing athletes with similar levels of MQ may help identify specific muscle mass or strength deficits, thereby guiding targeted interventions and optimizing training strategies. Moreover, MQ could serve as a sensitive monitoring tool to detect early declines in neuromuscular efficiency during periods of overtraining or insufficient recovery, helping to fine-tune training loads and reduce injury risk. Additionally, while MQ shows promise as a predictor of strength performance, further investigation is needed to determine its reliability in predicting climbing outcomes. These observations not only underscore the functional benefits of optimized MQ but also set the stage for exploring how training may moderate differences across sexes.
Our analysis of sex differences in MQ revealed that non-climbers exhibit significant disparities between sexes. However, these differences are minimized among climbers. Consistent with this, cross-sectional studies have shown that arm MQ in females is consistently higher than in males across the lifespan [30,31]. Although the precise mechanism remains unclear, evidence suggests that women maintain MQ better during aging [30,31]. These differences may be explained by physiological factors influencing muscle efficiency, such as variations in fiber type predominance or selective neuromuscular activation [46]. In addition, previous studies have proposed mechanisms such as greater resistance to fatigue, enhanced mitochondrial efficiency, and estrogen-related protective effects on muscle tissue in females, which may contribute to relatively higher muscle quality despite lower muscle mass [47]. Nonetheless, this MQ disparity is not evident among climbers, indicating that training may mitigate such differences, thus positioning MQ as a sex-neutral metric for strength performance evaluation. This attenuation of sex-based differences in trained individuals likely reflects converging neuromuscular adaptations to climbing-specific demands, such as improved motor unit recruitment strategies and task-specific coordination patterns.

4.3. Reliability of Climbing-Specific Tests

Our study further contributes to climbing-specific research by reporting absolute reliability indices (ICC, SEM, MDC95), metrics that are rarely documented in previous studies [22]. Recent research reinforces the importance of testing posture, demonstrating that seated positions with 90° elbow flexion offer the highest reliability (ICC > 0.95) and strongest correlation with climbing performance [13]. Their findings support the use of standardized seated protocols for assessing climbing-specific finger strength, as applied in the current study. The three-finger drag and half-crimp tests demonstrated excellent reliability (ICC = 0.969 and 0.962, respectively; CV < 6%), consistent with prior work [11,34], which reported ICC values of 0.96 and 0.88, respectively. The half-crimp grip exhibits superior test–retest reliability for isometric finger strength, making it a robust measure for climbing-specific adaptations [14]. Its strong reliability, along with absolute indices like SEM and MDC95, provides valuable benchmarks for monitoring training progress and evaluation of strength performance improvements. However, methodological variability (e.g., grip type, posture, depth of the hold) complicates cross-study comparisons. For instance, lower ICC values (0.88) and an SEM of 5.52 kg were reported for full-crimp grips, while hand- and grip-specific differences were observed in overhead testing, with ICC values ranging from 0.605 for the three-drag grip on the left hand to 0.963 for the half-crimp on the right hand [11,14]. Our value for the MDC95, approximately 50 N, indicates that subthreshold strength gains may reflect measurement error, highlighting the need for standardized protocols to ensure consistency and reliability in future research. This is consistent with earlier results, the higher MDC95 for handgrip dynamometry (~80 N) underscores the necessity of climbing-specific assessments.

4.4. Practical Implications and Limitations

Building on our findings, integrating MQ assessments into training regimens has the potential to significantly enhance athlete monitoring and strength performance evaluation. For example, climbers with similar MQ but low strength may benefit from neuromuscular training to enhance motor unit recruitment. Similarly, athletes exhibiting MQ asymmetries could potentially reduce injury risk by incorporating specific unilateral exercises into their routines. Coaches should consider adopting climbing-specific tests such as half-crimp isometric holds rather than traditional dynamometry to more accurately track progress and identify emerging talent. By leveraging these insights, coaches and athletes can design evidence-based training programs tailored to the unique demands of climbing, ultimately enhancing performance across all skill levels. Although these practical applications are promising, it is important to acknowledge several limitations.
While our seated testing protocol standardized measurements, this protocol may fail to capture climbing-specific hanging demands, potentially underestimating the true performance capacities of climbers. Although no separate familiarization session was conducted, participants were guided on their grips during the pre-testing warm-up. Additionally, while DXA is commonly used for MQ assessment, its inability to isolate finger flexors limits the accuracy of these evaluations compared to other gold-standard methods. Moreover, future research should adopt more climbing-specific testing postures, such as hanging tests, and employ ultrasound-based muscle mass quantification to achieve greater specificity. Longitudinal studies are needed to validate the predictive value of MQ for climbing performance and to assess its responsiveness to periodized training interventions. Specifically, such studies should examine how changes in MQ over time relate to climbing progression and whether early improvements in MQ prospectively predict performance gains or reduced injury risk. Tracking MQ trajectories across different training phases (e.g., strength vs. endurance blocks) may also help determine its sensitivity to specific adaptations and identify critical thresholds linked to performance plateaus or regressions. Addressing these limitations will enhance the validity of MQ as a performance indicator and refine our understanding of climbing-specific adaptations. Overcoming these challenges will not only strengthen the role of MQ in performance evaluation but also drive forward innovative training methodologies.

5. Conclusions

This study contributes to the understanding of climbing performance evaluation through two key contributions. First, climbing-specific strength tests such as half-crimp isometrics demonstrate superior sensitivity to sport-specific adaptations compared to traditional dynamometry. Second, MQ reflects neuromuscular efficiency and is a sex-neutral metric that can guide training interventions. To translate these insights into practice, the adoption of standardized protocols should be prioritized, along with the promotion of MQ as a biomarker in athlete development. Future research should explore the relationship between MQ and climbing grades, paving the way for evidence-based training paradigms that enhance performance across all skill levels. These efforts will link scientific knowledge and practical application, empowering athletes and coaches to optimize training strategies for improved outcomes.

Author Contributions

Conceptualization, D.G.-M., Á.G.-S. and J.A.d.P.; methodology, D.G.-M., Á.G.-S. and J.A.d.P.; formal analysis, D.G.-M. and J.A.d.P.; investigation, D.G.-M., J.S.-P., Á.G.-S., S.M.-I. and J.A.d.P.; resources, D.G.-M. and J.A.d.P.; data curation, D.G.-M. and J.A.d.P.; writing—original draft preparation, D.G.-M., J.A.d.P. and Á.G.-S.; writing—review and editing, D.G.-M., Á.G.-S., J.S.-P., S.M.-I. and J.A.d.P.; visualization, D.G.-M., Á.G.-S., J.S.-P. and S.M.-I.; supervision, Á.G.-S. and J.A.d.P.; project administration, Á.G.-S. and J.A.d.P. All authors have read and agreed to the published version of the manuscript.

Funding

Ángel Gallego-Selles is a beneficiary of the Catalina Ruiz postdoctoral grant (ULPGC, APCR2023010007), funded by Consejería de Universidades, Ciencia, Innovación y Cultura del Gobierno de Canarias, and European Social Fund.

Institutional Review Board Statement

Ethical review and approval were waived for this study due to its observational nature and the use of data collected during routine testing, with no additional procedures or interventions that could pose risks to participants. All data were anonymized prior to analysis, and informed consent was obtained from all participants. This study was conducted in accordance with applicable ethical standards and guidelines.

Informed Consent Statement

All participants provided written informed consent prior to their enrolment in the study in accordance with established ethical guidelines.

Data Availability Statement

All data supporting the findings of this study are fully presented within the article. However, individual-level raw data can be made available upon reasonable request by contacting the corresponding author. The authors are open to sharing these data for the purpose of academic collaboration, transparency, and further scientific exploration.

Acknowledgments

The authors would like to extend their gratitude for the participation of all subjects and collaborators in this study.

Conflicts of Interest

The authors declare no conflicts of interest.

Abbreviations

The following abbreviations are used in this manuscript:
MQMuscle Quality
DXADual-energy X-ray Absorptiometry
ROIRegion of Interest
ISCDInternational Society for Clinical Densitometry
IRCRAInternational Rock Climbing Research Association
ICCIntraclass Correlation Coefficient
SEMStandard Error of Measurement
MCD95Minimum Detectable Change at 95% Confidence
CVCoefficient of Variation
SDStandard Deviation
RPERate of Perceived Exertion
MVCMaximum Voluntary Isometric Contraction

References

  1. Saul, D.; Steinmetz, G.; Lehmann, W.; Schilling, A.F. Determinants for success in climbing: A systematic review. J. Exerc. Sci. Fit. 2019, 17, 91–100. [Google Scholar] [CrossRef] [PubMed]
  2. Assmann, M.; Steinmetz, G.; Schilling, A.F.; Saul, D. Comparison of Grip Strength in Recreational Climbers and Non-Climbing Athletes-A Cross-Sectional Study. Int. J. Environ. Res. Public Health 2020, 18, 129. [Google Scholar] [CrossRef] [PubMed]
  3. Grant, S.; Hasler, T.; Davies, C.; Aitchison, T.C.; Wilson, J.; Whittaker, A. A comparison of the anthropometric, strength, endurance and flexibility characteristics of female elite and recreational climbers and non-climbers. J. Sports Sci. 2001, 19, 499–505. [Google Scholar] [CrossRef] [PubMed]
  4. Laffaye, G.; Levernier, G.; Collin, J.M. Determinant factors in climbing ability: Influence of strength, anthropometry, and neuromuscular fatigue. Scand. J. Med. Sci. Sports 2016, 26, 1151–1159. [Google Scholar] [CrossRef]
  5. Levernier, G.; Laffaye, G. Rate of force development and maximal force: Reliability and difference between non-climbers, skilled and international climbers. Sports Biomech. 2021, 20, 495–506. [Google Scholar] [CrossRef]
  6. Limonta, E.; Cè, E.; Gobbo, M.; Veicsteinas, A.; Orizio, C.; Esposito, F. Motor unit activation strategy during a sustained isometric contraction of finger flexor muscles in elite climbers. J. Sports Sci. 2016, 34, 133–142. [Google Scholar] [CrossRef]
  7. MacLeod, D.; Sutherland, D.L.; Buntin, L.; Whitaker, A.; Aitchison, T.; Watt, I.; Bradley, J.; Grant, S. Physiological determinants of climbing-specific finger endurance and sport rock climbing performance. J. Sports Sci. 2007, 25, 1433–1443. [Google Scholar] [CrossRef]
  8. Giles, D.; Barnes, K.; Taylor, N.; Chidley, C.; Chidley, J.; Mitchell, J.; Torr, O.; Gibson-Smith, E.; España-Romero, V. Anthropometry and performance characteristics of recreational advanced to elite female rock climbers. J. Sports Sci. 2021, 39, 48–56. [Google Scholar] [CrossRef]
  9. Baláš, J.; Pecha, O.; Martin, A.J.; Cochrane, D.J. Hand–arm strength and endurance as predictors of climbing performance. Eur. J. Sport Sci. 2012, 12, 16–25. [Google Scholar] [CrossRef]
  10. Ozimek, M.; Staszkiewicz, R.; Rokowski, R.; Stanula, A. Analysis of Tests Evaluating Sport Climbers’ Strength and Isometric Endurance. J. Hum. Kinet. 2016, 53, 249–260. [Google Scholar] [CrossRef]
  11. van Bergen, N.G.; Soekarjo, K.; Van der Kamp, J.; Orth, D. Reliability and Validity of Functional Grip Strength Measures Across Holds and Body Positions in Climbers: Associations With Skill and Climbing Performance. Res. Q. Exerc. Sport 2023, 94, 627–637. [Google Scholar] [CrossRef] [PubMed]
  12. Stien, N.; Saeterbakken, A.H.; Andersen, V. Tests and Procedures for Measuring Endurance, Strength, and Power in Climbing-A Mini-Review. Front. Sports Act. Living 2022, 4, 847447. [Google Scholar] [CrossRef] [PubMed]
  13. Stien, N.; Andersen, V.; Langer, K.; Saeterbakken, A.H. Assessing climbing-specific strength: The impact of body position and elbow flexion on reliability and predictive validity. J. Sports Sci. 2025, 43, 852–864. [Google Scholar] [CrossRef]
  14. Söderqvist, K.; Identeg, F.; Zimmerman, J.; Senorski, E.H.; Sansone, M.; Hedelin, H. Validity and Reliability of Finger-Strength Testing in 6 Common Grip Techniques for the Assessment of Bouldering Ability in Men. Int. J. Sports Physiol. Perform. 2024, 19, 290–298. [Google Scholar] [CrossRef]
  15. Amca, A.M.; Vigouroux, L.; Aritan, S.; Berton, E. Effect of hold depth and grip technique on maximal finger forces in rock climbing. J. Sports Sci. 2012, 30, 669–677. [Google Scholar] [CrossRef]
  16. Nelson-Wong, E.; Lorbiecki, C.; Wood, S.; Huang, S.; Crawley, J.; Higgins, E.; Parker, L.; Cowell, K. Influence of Experience, Training Frequency, and Sex on Climbing-Specific Grip Force in Rock Climbers of Varying Skill Level. J. Appl. Biomech. 2025, 41, 142–150. [Google Scholar] [CrossRef]
  17. Vigouroux, L.; Quaine, F.; Labarre-Vila, A.; Moutet, F. Estimation of finger muscle tendon tensions and pulley forces during specific sport-climbing grip techniques. J. Biomech. 2006, 39, 2583–2592. [Google Scholar] [CrossRef]
  18. Schweizer, A.; Hudek, R. Kinetics of crimp and slope grip in rock climbing. J. Appl. Biomech. 2011, 27, 116–121. [Google Scholar] [CrossRef]
  19. Michailov, M.L.; Baláš, J.; Tanev, S.K.; Andonov, H.S.; Kodejška, J.; Brown, L. Reliability and Validity of Finger Strength and Endurance Measurements in Rock Climbing. Res. Q. Exerc. Sport 2018, 89, 246–254. [Google Scholar] [CrossRef]
  20. Fanchini, M.; Violette, F.; Impellizzeri, F.M.; Maffiuletti, N.A. Differences in climbing-specific strength between boulder and lead rock climbers. J. Strength Cond. Res. 2013, 27, 310–314. [Google Scholar] [CrossRef]
  21. Rokowski, R.; Michailov, M.; Maciejczyk, M.; Więcek, M.; Szymura, J.; Draga, P.; Trendafilov, P.; Szygula, Z. Muscle strength and endurance in high-level rock climbers. Sports Biomech. 2024, 23, 1057–1072. [Google Scholar] [CrossRef] [PubMed]
  22. Langer, K.; Simon, C.; Wiemeyer, J. Physical performance testing in climbing-A systematic review. Front. Sports Act. Living 2023, 5, 1130812. [Google Scholar] [CrossRef]
  23. Barbat-Artigas, S.; Rolland, Y.; Zamboni, M.; Aubertin-Leheudre, M. How to assess functional status: A new muscle quality index. J. Nutr. Health Aging 2012, 16, 67–77. [Google Scholar] [CrossRef] [PubMed]
  24. McGregor, R.A.; Cameron-Smith, D.; Poppitt, S.D. It is not just muscle mass: A review of muscle quality, composition and metabolism during ageing as determinants of muscle function and mobility in later life. Longev. Heal. 2014, 3, 9. [Google Scholar] [CrossRef]
  25. Naimo, M.A.; Varanoske, A.N.; Hughes, J.M.; Pasiakos, S.M. Skeletal Muscle Quality: A Biomarker for Assessing Physical Performance Capabilities in Young Populations. Front. Physiol. 2021, 12, 706699. [Google Scholar] [CrossRef]
  26. MacKenzie, R.; Monaghan, L.; Masson, R.A.; Werner, A.K.; Caprez, T.S.; Johnston, L.; Kemi, O.J. Physical and Physiological Determinants of Rock Climbing. Int. J. Sports Physiol. Perform. 2020, 15, 168–179. [Google Scholar] [CrossRef]
  27. Augste, C.; Winkler, M.; Künzell, S. Optimization of an Intermittent Finger Endurance Test for Climbers Regarding Gender and Deviation in Force and Pulling Time. Front. Sports Act. Living 2022, 4, 902521. [Google Scholar] [CrossRef]
  28. Smetanka, R.G.; Armenta, R.F.; Nessler, J.A.; Newcomer, S.C. Heart Rate Response, Duration, Grip Strength, and Anthropometric Characteristics in Recreational Indoor Rock Climbers. J. Strength Cond. Res. 2022, 36, 832–837. [Google Scholar] [CrossRef]
  29. España-Romero, V.; Ortega Porcel, F.B.; Artero, E.G.; Jiménez-Pavón, D.; Gutiérrez Sainz, A.; Castillo Garzón, M.J.; Ruiz, J.R. Climbing time to exhaustion is a determinant of climbing performance in high-level sport climbers. Eur. J. Appl. Physiol. 2009, 107, 517–525. [Google Scholar] [CrossRef]
  30. Lopes, L.C.C.; Vaz-Gonçalves, L.; Schincaglia, R.M.; Gonzalez, M.C.; Prado, C.M.; de Oliveira, E.P.; Mota, J.F. Sex and population-specific cutoff values of muscle quality index: Results from NHANES 2011–2014. Clin. Nutr. 2022, 41, 1328–1334. [Google Scholar] [CrossRef]
  31. Mehra, A.; Snarr, R.L.; Park, K.S.; Krok-Schoen, J.L.; Czerwinski, S.A.; Nickerson, B.S. Muscle quality index comparisons between Hispanics and non-Hispanic Caucasians using dual energy X-ray absorptiometry and handgrip strength. Eur. J. Clin. Nutr. 2024, 78, 1064–1071. [Google Scholar] [CrossRef] [PubMed]
  32. Draper, N.; Giles, D.; Schöffl, V.; Konstantin Fuss, F.; Watts, P.; Wolf, P.; Baláš, J.; Espana-Romero, V.; Blunt Gonzalez, G.; Fryer, S. Comparative grading scales, statistical analyses, climber descriptors and ability grouping: International Rock Climbing Research Association position statement. Sports Technol. 2015, 8, 88–94. [Google Scholar] [CrossRef]
  33. Quaine, F.; Vigouroux, L.; Paclet, F.; Colloud, F. The thumb during the crimp grip. Int. J. Sports Med. 2011, 32, 49–53. [Google Scholar] [CrossRef] [PubMed]
  34. Baláš, J.; Panáčková, M.; Kodejška, J.; Cochrane, J.D.; Martin, J.A. The role of arm position during finger flexor strength measurement in sport climbers. Int. J. Perform. Anal. Sport 2014, 14, 345–354. [Google Scholar] [CrossRef]
  35. Philippe, M.; Wegst, D.; Müller, T.; Raschner, C.; Burtscher, M. Climbing-specific finger flexor performance and forearm muscle oxygenation in elite male and female sport climbers. Eur. J. Appl. Physiol. 2012, 112, 2839–2847. [Google Scholar] [CrossRef]
  36. Garcia, K.; Jaramillo, D.; Rubesova, E. Ultrasound evaluation of stress injuries and physiological adaptations in the fingers of adolescent competitive rock climbers. Pediatr. Radiol. 2018, 48, 366–373. [Google Scholar] [CrossRef]
  37. Ferrer-Uris, B.; Arias, D.; Torrado, P.; Marina, M.; Busquets, A. Exploring forearm muscle coordination and training applications of various grip positions during maximal isometric finger dead-hangs in rock climbers. PeerJ 2023, 11, e15464. [Google Scholar] [CrossRef]
  38. Macdonald, J.H.; Callender, N. Athletic profile of highly accomplished boulderers. Wilderness Environ. Med. 2011, 22, 140–143. [Google Scholar] [CrossRef]
  39. Marcolin, G.; Faggian, S.; Muschietti, M.; Matteraglia, L.; Paoli, A. Determinants of Climbing Performance: When Finger Flexor Strength and Endurance Count. J. Strength Cond. Res. 2022, 36, 1099–1104. [Google Scholar] [CrossRef]
  40. Ginszt, M.; Saito, M.; Zięba, E.; Majcher, P.; Kikuchi, N. Body Composition, Anthropometric Parameters, and Strength-Endurance Characteristics of Sport Climbers: A Systematic Review. J. Strength Cond. Res. 2023, 37, 1339–1348. [Google Scholar] [CrossRef]
  41. Okoren, L.; Magkos, F. Physiological Characteristics, Dietary Intake, and Supplement Use in Sport Climbing. Curr. Nutr. Rep. 2023, 12, 788–796. [Google Scholar] [CrossRef] [PubMed]
  42. Carrasco, F.; Arias-Tellez, M.J.; Solar-Altamirano, I.; Inostroza, J.; Carrasco, G. Regional Body Composition and Strength, Not Total Body Composition, Are Determinants of Performance in Climbers. J. Funct. Morphol. Kinesiol. 2024, 9, 228. [Google Scholar] [CrossRef] [PubMed]
  43. Watts, P.B. Physiology of difficult rock climbing. Eur. J. Appl. Physiol. 2004, 91, 361–372. [Google Scholar] [CrossRef] [PubMed]
  44. Giles, L.V.; Rhodes, E.C.; Taunton, J.E. The physiology of rock climbing. Sports Med. 2006, 36, 529–545. [Google Scholar] [CrossRef]
  45. Mermier, C.M.; Janot, J.M.; Parker, D.L.; Swan, J.G. Physiological and anthropometric determinants of sport climbing performance. Br. J. Sports Med. 2000, 34, 359–365; discussion 366. [Google Scholar] [CrossRef]
  46. Haizlip, K.M.; Harrison, B.C.; Leinwand, L.A. Sex-based differences in skeletal muscle kinetics and fiber-type composition. Physiology 2015, 30, 30–39. [Google Scholar] [CrossRef]
  47. Hawley, S.E.; Bell, Z.W.; Huang, Y.; Gibbs, J.C.; Churchward-Venne, T.A. Evaluation of sex-based differences in resistance exercise training-induced changes in muscle mass, strength, and physical performance in healthy older (≥60 y) adults: A systematic review and meta-analysis. Ageing Res. Rev. 2023, 91, 102023. [Google Scholar] [CrossRef]
Figure 1. (A) Custom-built device for assessment of finger strength; (B) finger position in the three-finger drag grip; (C) finger position in the half-crimp grip; (D) body position during a maximal finger flexor strength in half-crimp position.
Applsci 15 07161 g001
Figure 2. Muscle quality between climbers and non-climbers in three-finger drag, half-crimp, and handgrip. Blue bars represent non-climbers, and purple bars represent climbers. The boxplots display the distribution of muscle quality across these groups for different grip types. * differences between groups (p < 0.05); ES: effect size (Cohen’s d).
Applsci 15 07161 g002
Figure 3. (A) Muscle quality in three-finger drag comparing males and females; (B) muscle quality in half-crimp comparing males and females; (C) muscle quality in handgrip comparing males and females. Blue bars represent non-climbers, and purple bars represent climbers. In the gender-based comparisons, light blue with a dotted pattern represents non-climbing males, solid blue represents non-climbing females, solid purple represents climbing males, and purple with a dotted pattern represents climbing females. The boxplots display the distribution of muscle quality across these groups for different grip types. * differences between groups (p < 0.05); ES: effect size (Cohen’s d).
Applsci 15 07161 g003
Table 1. Characteristics of participants.
OutcomeAll ParticipantsMaleFemaleSex Differences
Non-Climbers (n = 29)Climbers (n = 33)ESpNon-Climbers (n = 14)Climbers (n = 19)ESpNon-Climbers (n = 15)Climbers (n = 14)ESpp
Non-Climb.
p
Climb.
Age (years)23.2 ± 3.127.6 ± 3.51.3030.00123.2 ± 3.427.2 ± 3.81.1050.00423.2 ± 3.128.1 ± 3.21.5600.0010.9910.497
Weight (kg)67.4 ± 11.164.3 ± 11.10.2790.27875.0 ± 6.969.7 ± 10.80.5550.12560.3 ± 9.656.8 ± 6.10.4270.2610.0010.001
Height (cm)168.8 ± 9.9171.7 ± 8.00.3190.215175.0 ± 7.7176.2 ± 6.30.1850.602163.1 ± 8.2165.4 ± 5.70.3350.3750.0010.001
BMI (kg/m2)23.5 ± 2.521.7 ± 3.00.6460.01424.5 ± 1.922.5 ± 3.40.7010.05622.6 ± 2.720.7 ± 1.80.8020.0400.0370.099
LMI (%)17.4 ± 2.817.0 ± 2.80.1260.62219.9 ± 1.818.7 ± 2.10.6070.09515.1 ± 0.914.8 ± 1.80.1850.6230.0010.001
FMI (%)5.0 ± 2.33.7 ± 2.00.6260.0173.6 ± 1.32.9 ± 2.00.3910.2766.4 ± 2.14.9 ± 1.40.8840.0250.0010.003
Body Fat (%)21.5 ± 8.917.0 ± 8.00.5320.04114.5 ± 4.912.3 ± 5.60.4190.24328.1 ± 6.323.5 ± 6.00.7390.0570.0010.001
Forearm Muscle (g)844 ± 269930 ± 2490.3100.2281076 ± 1791120 ± 2230.2130.549628 ±105673 ± 830.4720.2150.0010.001
Arm Span (cm)170.7 ± 12.2171.7 ± 9.00.0970.706178.7 ± 8.4176.4 ± 8.20.2810.432163.3 ± 10.5165.5 ± 5.50.2580.4930.0010.001
Ape Index 1.011 ± 0.031.001 ± 0.030.3800.1411.022 ± 0.031.001 ± 0.030.7290.0471.001 ± 0.021.001 ± 0.030.0080.9830.0340.999
Forearm Length (cm)27.2 ± 2.427.2 ± 1.70.0080.97628.6 ± 2.028.2 ± 1.30.2680.45225.9 ±1.925.8 ± 1.10.0290.9390.0010.001
The values are presented as mean ± standard deviation. BMI: body mass index; LMI: lean mass index; FMI: fat mass index; Ape-Index (cm): height/arm span; ES: effect size; p: p-value.
Table 2. Absolute and body weight-relative isometric strength values in climbers and non-climbers by sex.
OutcomeAll ParticipantsMaleFemaleSex Dif.
Non-Climbers (n = 29)Climbers (n = 33)ESpNon-Climbers (n = 14)Climbers (n = 19)ESpNon-Climbers (n = 15)Climbers (n = 14)ESpp
Non-Climb.
p Climb.
Three-finger drag (N)260.3 ± 63.9358.1 ± 109.91.0700.001301.3 ± 43.9407.6 ± 114.71.1580.003222.2 ± 56.0290.9 ± 55.41.2340.0030.0010.001
Half-crimp (N)285.0 ± 74.9409.2 ± 121.31.2140.001341.6 ± 52.6476.6 ± 113.51.4520.001232.1 ± 49.3317.6 ± 52.01.6890.0010.0010.001
Handgrip (N)398.8 ± 120.8442.6 ± 119.60.3650.157501.7 ± 85.5515.8 ± 103.20.1470.680302.8 ± 43.9343.4 ± 45.20.9110.0210.0010.001
Three-finger drag/BW (N/kg)3.9 ± 0.65.6 ± 1.41.5670.0014.0 ± 0.65.9 ± 1.61.4400.0013.7 ± 0.65.1 ± 0.91.9110.0010.1270.127
Half-crimp/BW (N/kg)4.2 ± 0.86.3 ± 1.41.8220.0014.6 ± 0.86.9 ± 1.51.8010.0013.9 ± 0.65.6 ± 0.82.3550.0010.0100.009
Handgrip/BW (N/kg)5.9 ± 1.26.9 ± 1.40.7960.0036.7 ± 0.97.4 ± 1.40.6260.0855.1 ± 0.76.1 ± 0.91.2190.0030.0010.003
BW: body weight; ES: effect size; p: p-value.
Table 3. Repeatability, standard error of measurement, and minimal detectable change.
OutcomeMean SDICC (95% CI)CV (%)SEMSEM (%)MCDMCD (%)
Three-finger drag (N)295.25±15.20.969 (0.953–0.981)5.3517.525.9348.5516.42
Half-crimp (N)333.10±19.10.962 (0.942–0.976)5.8122.656.7962.7918.82
Handgrip (N)406.24±22.30.936 (0.895–0.961)5.6730.237.4483.7920.63
ICC (95% CI): intraclass correlation coefficient (95% confidence interval); CV (%): coefficient of variation (percentage of variability relative to the mean); SEM: standard error of measurement (estimate of error in repeated measurements); SEM %: standard error of measurement as a percentage of the mean; MCD: minimal detectable change (smallest change beyond measurement error); MCD %: minimal detectable change as a percentage of the mean.
Disclaimer/Publisher’s Note: The statements, opinions and data contained in all publications are solely those of the individual author(s) and contributor(s) and not of MDPI and/or the editor(s). MDPI and/or the editor(s) disclaim responsibility for any injury to people or property resulting from any ideas, methods, instructions or products referred to in the content.

