1. Introduction
Among the geophysical indirect methods for the preliminary assessment of the presence of underground structures for archaeological studies, multichannel GPR systems have been under the spotlight for more than a decade [
1,
2,
3]. Their peculiarity is to be composed of several radar antennas, both transmitters and receivers, placed next to each other. They, therefore, can collect a spatially dense amount of data, which easily allows for full 3D surveys, with improved logistics with respect to standard GPR single-channel systems [
4,
5]. This means that very high resolution, usually of the order of few centimeters, can be achieved, making it possible to detect smaller targets [
6] and making the interpolation process to more reliably produce horizontal depth-slices. Several examples of successful application of multichannel GPR systems for archaeological prospections are, therefore, available in the literature (e.g., [
7,
8,
9,
10]) even in challenging and non-conventional applications (e.g., [
11]).
However, the data processing of multichannel GPR data can be significantly different, and more time consuming, from traditional GPR single-channel systems, given the large amount of data created [
10]. Also, in some situations, the increased density of spatial sampling does not correspond to an increased quality of depth-slices. Small anomalies and wave scattering can disturb the data and reduce the visibility of more relevant targets of archaeological interest (i.e., walls or structures). Moreover, notwithstanding the benefits of multichannel systems, they are still affected by limitations intrinsic in the GPR wave propagation, particularly the data quality degradation in presence of even small quantities of clay within the investigated subsoil.
Various studies on different multichannel GPR data processing approaches to exploit the full potentiality of these systems are available in recent literature. These include principal component analyses [
12], studies on signal polarization and orientation [
13], studies on filters for artifact reduction [
14], and studies on positioning accuracy [
15]. However, to the best of our knowledge, no study is specifically focused on improving multichannel GPR data quality over high-attenuating media, such as clayish soil. Also, few studies (e.g., [
16,
17]) discuss appropriate configuration and measurement parameters for successful archaeological fieldwork. In this respect, profile spacing may play a key role in survey effectiveness: dense profile spacing (generally less than 0.5 m) is usually suggested. This can be easily obtainable with multichannel GPR systems. Denser spacing may, however, not always result in clearer imaging and can strongly increase investigation and processing times. As an example, a previous study [
18] observed that, although many researchers suggest denser survey profiles, when mapping linear features, a coarser profile spacing can still be acceptable and effective depending on the aim of the surveys.
In this context, we acquired a GPR multichannel dataset on the Greek–Roman archaeological site of Tindari (Sicily, Italy). This site is recognized to be very challenging with respect to GPR wave propagation, since high signal attenuation occurs due to the presence of highly electrically conductive clay and relevant moisture content [
18]. In particular, the GPR survey, conducted in April 2023, was preceded by intense rainfalls, further compromising the data quality. The first results of the survey, obtained with standard processing approaches, were indeed not completely satisfactory and showed few of the attended targets, even where buried walls were confirmed to be present in the subsoil by previous excavations. Following the methodology of a pioneering study on GPR spatial density [
16], we verified that for detecting main targets in archaeological prospection, a between-lines spacing of 25 cm is sufficient enough, and that higher spatial resolution does not provide substantial advantages. Therefore, this study explores the idea that, if all the channels of a dense multichannel GPR system are not strictly necessary in the aim of spatial resolution, we can make better use of them by stacking them. This stacking would allow for an increased signal-to-noise ratio and would enhance the quality of the traces and of the resulting time-slices, particularly in highly attenuating clay material and high moisture content situations.
2. Materials and Methods
The ancient town of Tindari was founded by Greek colonists at the beginning of 4th century BC on a plateau about 235 m above sea level along the northern coast of Sicily (
Figure 1A). At least the oriental sector of the city, including the theatre, was built in this period. One century after its foundation, it was occupied by the Carthaginians, and some decades later, it became a Roman colony. During this last period, the ancient town entered a moment of renewed prosperity marked by construction of new buildings and residential areas. At the end of the 4th or the beginning of the 5th century AD, the town was completely abandoned, most probably due to an earthquake that destroyed most of its buildings [
19]. Afterwards, the Roman town was covered by sediments and, to date, has not been completely excavated. Currently, the whole area is an archaeological park, and different surveys and excavation works have been conducted to gain knowledge on the town setting (e.g., [
20,
21]).
An area of about 30 m × 20 m within a residential insula in the archaeological park of Tindari was surveyed with a multichannel GPR system (
Figure 1B). Specifically, the survey took place within Insula XVIII b, where there is a domus currently studied and excavated by the University of Turin [
21]. This area provides an excellent benchmark for the methodologies that we aim to test within this work since it was already partially excavated (
Figure 1B), and several known features of the underlying Roman domus have been evidenced. Excavations were later covered and preserved so that the GPR survey was possible above them. The acquired data were first processed with a series of standard processing steps. Then, two different stacking strategies were tested to assess how they can improve radargrams and time-slices. The glossary contains the definitions of some specialistic terms mentioned in this and following paragraphs.
2.1. Instrument and Data Collection
The GPR multichannel system used in this study is Stream C, manufactured by IDS and available at the Department of Historical Studies of University of Torino. It has 34 antennas, 24 of which have the dipoles oriented vertically and 10 horizontally, with respect to the acquisition direction. A total of 23 radargrams with both the transmitter and the receiver antennas oriented vertically (“VV” with a horizontal separation of about 4 cm) and 9 horizontally (“HH” with a horizontal separation of about 10 cm) are, therefore, available for each acquisition profile (i.e., each swath). The central frequency of the antenna is 600 MHz; however, frequency distributions centered at about 300 MHz were observed in the test site.
The investigated area was covered with a total of 39 swaths acquired mainly in the SE to NW direction with a distance among the different acquisitions of about 1 m (
Figure 1B) in order to cover the whole interested area with a dense distribution of traces. Few profiles in the perpendicular direction were also acquired around the central portion of the area where irremovable obstructions prevented a uniform profile acquisition. Data were acquired with an in-line acquisition step of 4 cm (same as the lateral separation of VV dipoles) and 512 samples per trace for an acquisition time of 80 ns. The data were acquired by moving the instrument on the survey areas thanks to an aluminum trolley on which the Stream C system was mounted. The data were georeferenced with a Geomax GNSS system in base-rover configuration and with RTK corrections, allowing for centimeter-level precision in localization.
2.2. Data Processing
The data were processed in two phases using the commercial software ReflexW 10.0 [
22]. First, a series of basic processing steps were performed to remove the main instrumental noise. Second, the two stacking strategies were tested on the processed data: a conventional in-line stacking and the new off-line stacking. A combination of the two strategies was also evaluated.
In the first series of processing steps, we applied only the strictly necessary processing to the data, with the following processing flow:
Subtract mean or Dewow. This is a filter separately applied on each trace. Considering all the samples within a moving time range of 4 nanoseconds, this filter subtracts the mean value of the samples from the actual sample value. It was useful to remove instrumental noise that shifted the signal toward positive or negative values, instead of oscillating around 0.
Move start time. The first nanoseconds of the signal, before the emission of the electromagnetic impulse, are removed. An automatic recognition of the transmitted impulse timing is needed because each channel of the Stream C multichannel system starts to record at a slightly different time. In ReflexW software, the combination of “Correct max phase” and “move start time” filters performs this task.
Background removal. This filter calculates the mean trace of the whole radargram and subtracts this trace to each trace. It removes horizontally coherent instrumental noise.
Subtracting average. This filter acts as a horizontal high pass filter. It is similar to the background removal, but restricted to a moving window of a certain number of traces. We selected a moving window of 50 traces corresponding to about 2 m. This filter is suggested for archaeological studies aimed at finding walls or similar features in [
23].
Gain. An automatically calculated gain function was applied with the “Energy Decay” filter of ReflexW to compensate for the intrinsic and geometric attenuation of the signal at depth.
No migration was performed since it was difficult to recognize well-defined hyperbolae to estimate an appropriate electromagnetic wave velocity. Furthermore, this study aims to recognize the main buried walls in a challenging environment, not to pinpoint the location of small features.
The time-slices were then finally created by interpolating all the 2D radargrams into a 3D data volume, and then cutting it into horizontal slices. For the comparisons presented in this study, for simplicity sake, we used only the vertically (VV) oriented dipoles. To better visualize time-slices, an envelope filter was also applied to the data. The envelope is a measure for reflectivity strength, which is proportional to the square root of the complete energy of the signal at an instant of time [
22].
2.3. Stacking Strategies to Improve Signal-to-Noise Ratio
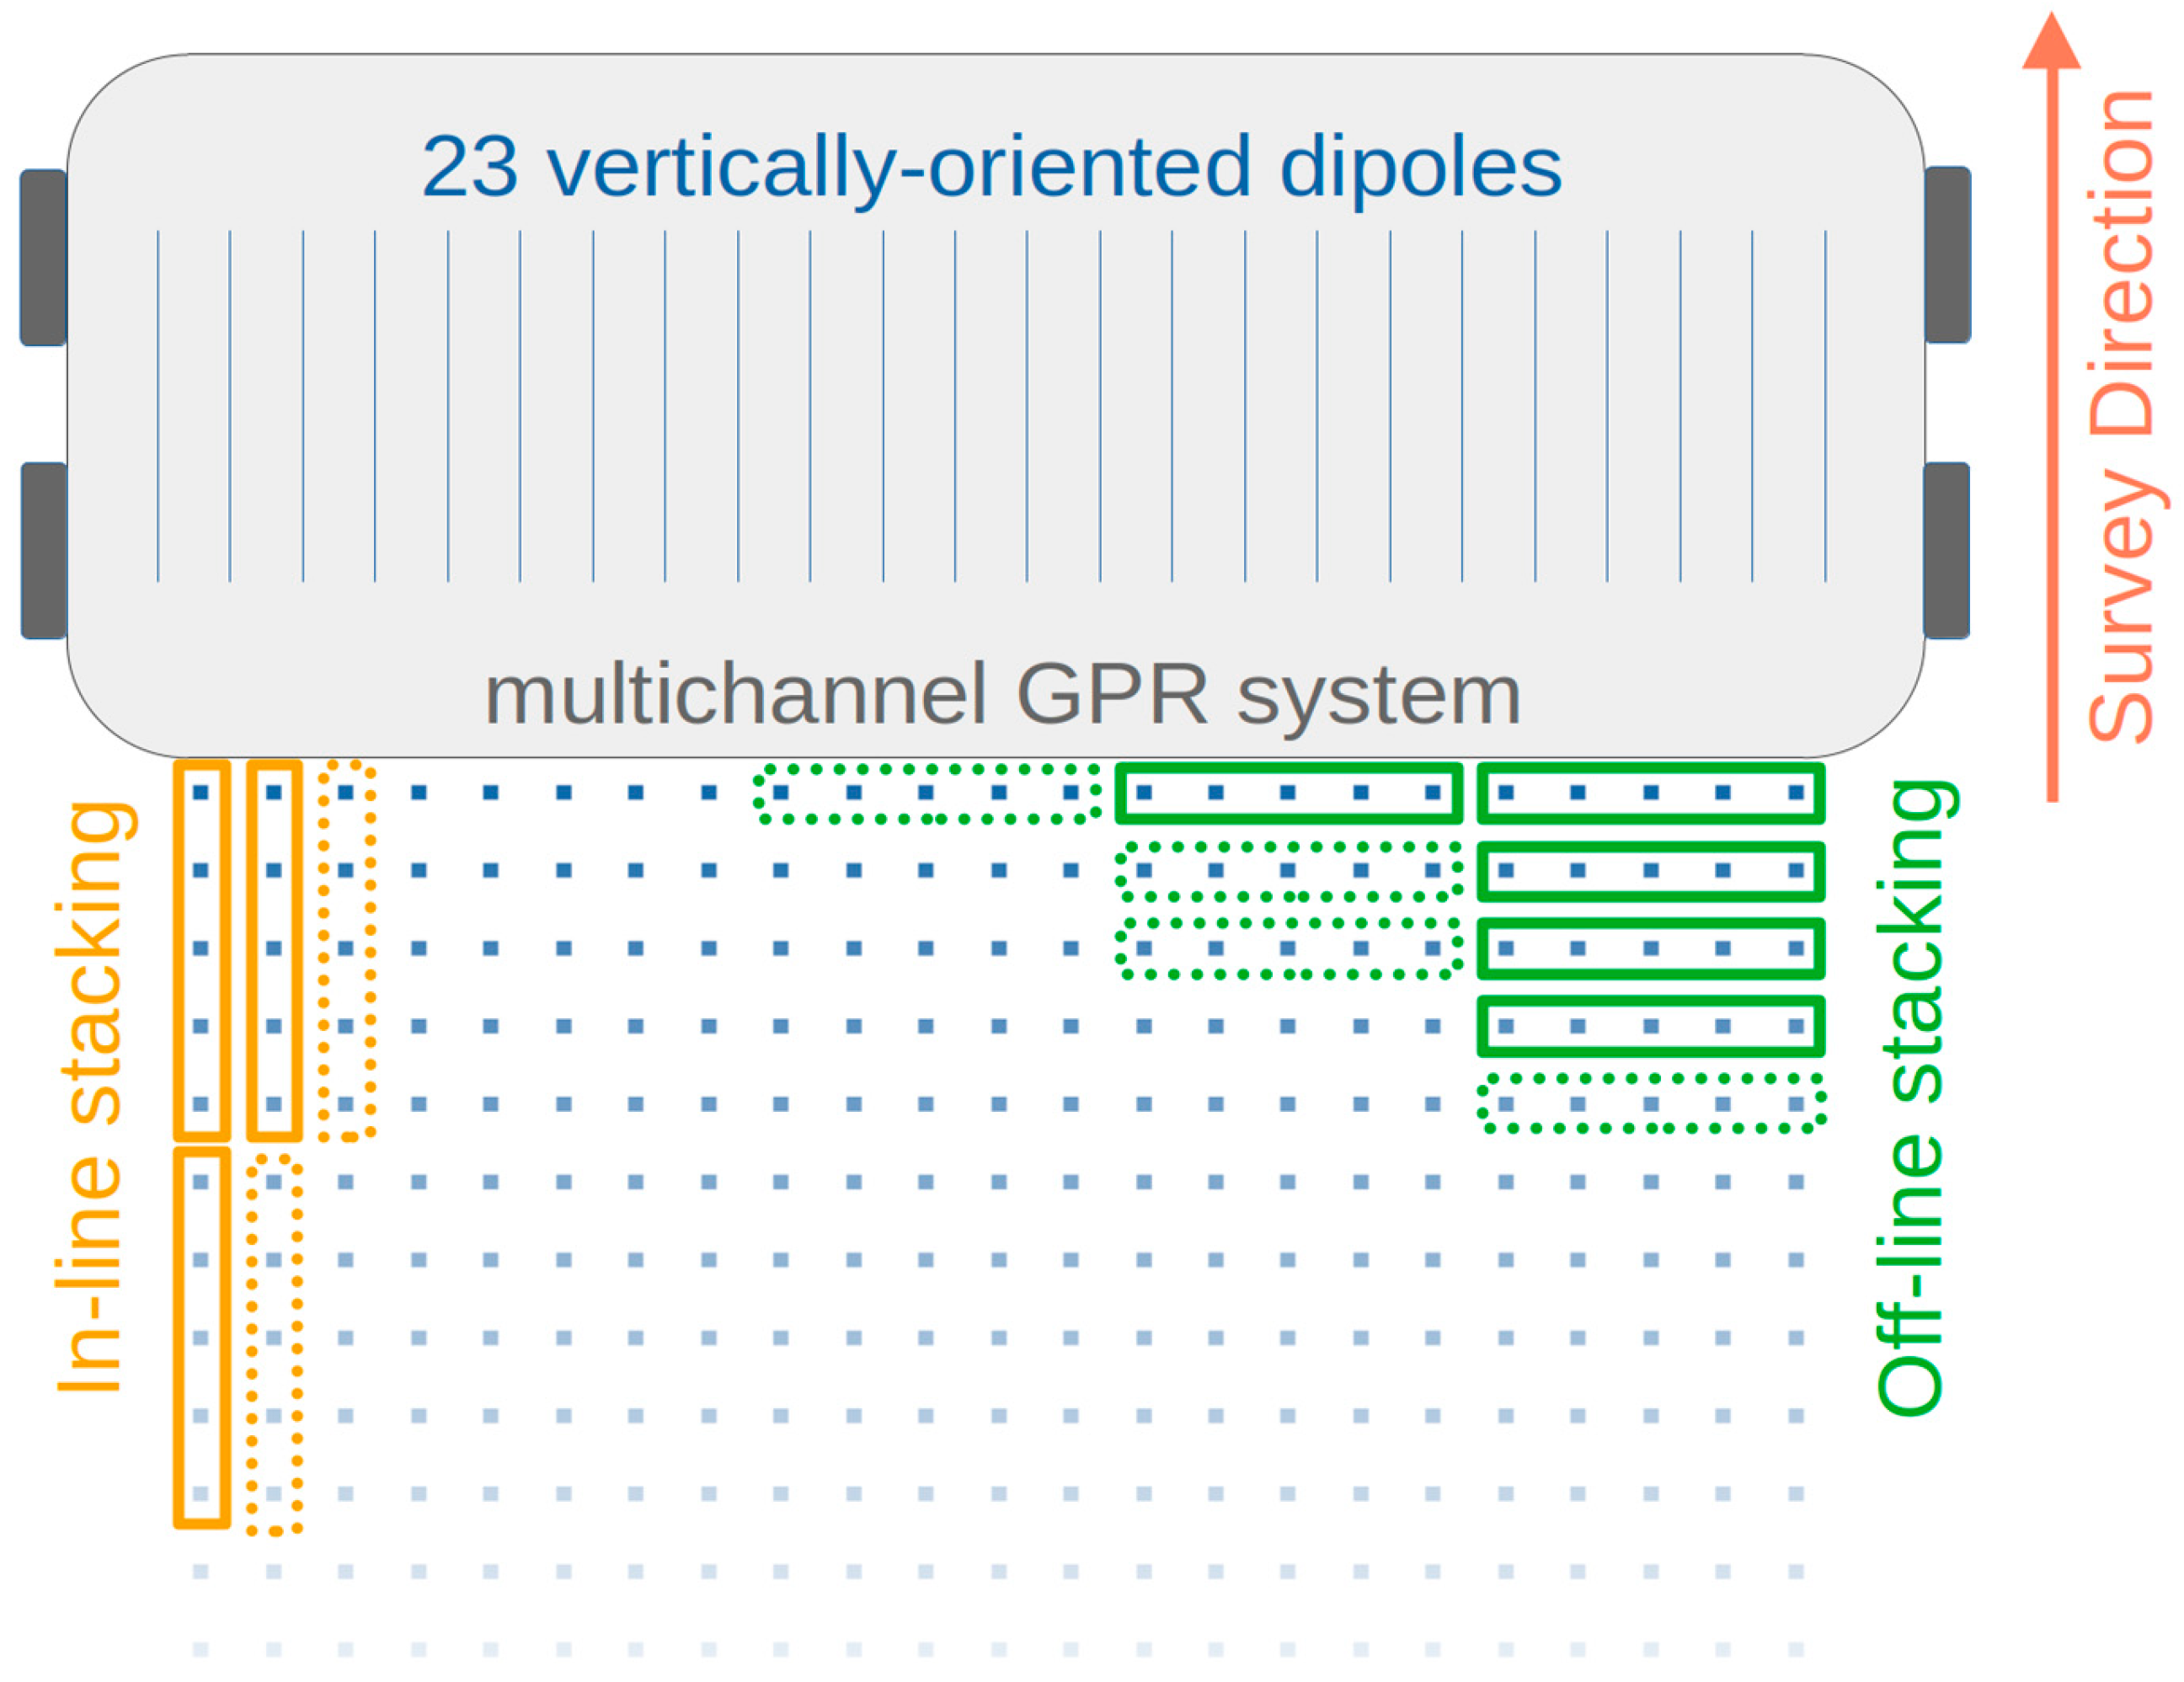
Stacking is a traditional method to improve the signal-to-noise ratio in many geophysical techniques. It consists of summing traces from different records to decrease the random noise. In GPR surveys, stacking is generally performed in two ways. The first is hardware stacking, performed by the instrument during data collection, and is generally invisible to the user. The second is post-processing stacking and is usually performed along adjacent traces acquired in the profile direction, in this text called in-line stacking, in which in-line adjacent traces, often collected a few centimeters apart from each other, are stacked with the aim to increase the signal-to-noise ratio (see
Figure 2).
We here tested a third way of stacking that we can call off-line stacking. We stacked traces recorded in the same in-line position but by adjacent channels (see
Figure 2). This stacking is also aimed to increase the signal-to-noise ratio but at the expense of the lateral spatial resolution. As an example, given the lateral resolution of the VV dipoles of 4 cm, an off-line stacking of 5 adjacent traces would result in a 16 cm lateral resolution of the stacked radargrams. We performed this stacking using the “merge files—stack profiles” option of ReflexW. This option allows for merging different files resulting from profiles of adjacent channels in the off-line direction by stacking them.
It must be recalled that the in-line stacking approach also results in a loss in resolution in the in-line direction, depending on the number of stacked traces. Therefore, the two stacking approaches can be considered sort of similar with respect to the potential loss of resolution issue. The stacking direction, however, can be relevant and provide different results depending on the orientation of the investigated structures (i.e., parallel or perpendicular to the acquisition direction). Also, a reduced resolution in the in-line direction generally worsens the quality of the radargram (shown later) and may compromise the imaging potential.
We compared the data after the processing but without any stacking to the data after the processing and with in-line stacking, off-line stacking, and both in- and off-line stackings. These comparisons were performed at three different levels of data visualization: we compared traces, radargrams, and depth-slices.
3. Results
Results of the performed surveys and of the different stacking attempts are reported in the following in order to understand which is the better approach to improve data quality. First, we show how the in-line and off-line stacking improves the GPR signals of single example traces. Four example traces are shown in
Figure 3 to this aim:
Figure 3A reports an example GPR trace after processing;
Figure 3B reports an example GPR trace in the same position of the previous, obtained with off-line stacking of five laterally adjacent traces;
Figure 3C reports an example GPR trace in the same position, obtained with in-line stacking of five adjacent acquired traces in the profile direction; and
Figure 3D reports an example trace after both off-line and in-line stackings.
It can be observed that in the non-stacked trace after processing, the noise after about 15 ns is of the same order of magnitude as the signal (shaded yellow area). This strongly compromises the investigation depth and, as mentioned, is caused by the presence of highly attenuating clay materials at the site [
19]. Both off-line (
Figure 3B) and in-line (
Figure 3C) stackings manage to partially reduce this noise, and the related traces show useful signal reflections where in the non-stacked trace they were barely visible, consequentially improving the investigation depth.
Nevertheless, off-line stacking (
Figure 3B) appears to offer an improved quality of the example trace in the same time range, with an increased attenuation of the high frequency noise and general better visibility. In order to provide a quantitative estimation of this improvement, the signal-to-noise ratio (SNR) of the different data reported in
Figure 3 was computed. The SNR is the ratio of the signal summed squared magnitude to that of the noise. Coherently with the qualitative considerations performed, an increased SNR was observed in the off-line stacked traces (SNR = 9 dB) with respect to both the non-stacked traces after processing (SNR = 6 dB) and the in-line stacked ones (SNR = 8 dB). Further increase in the SNR can also be obtained by applying both in-line and off-line stacking approaches (SNR = 11 dB); however, this would compromise the resolution, as will be discussed later. Similar considerations have been observed along different portions of the acquired GPR volume and in different example traces.
We judge that the off-line stacking appears to be more suited for the suppression of the noise and to increase the investigation depth. Indeed, apparently the stacking of laterally adjacent traces results in an increased SNR and more coherence of the finally obtained trace with respect to the stacking of consecutive acquired traces, merging the advantage of using different acquisition channels in the same portion of the investigated volume.
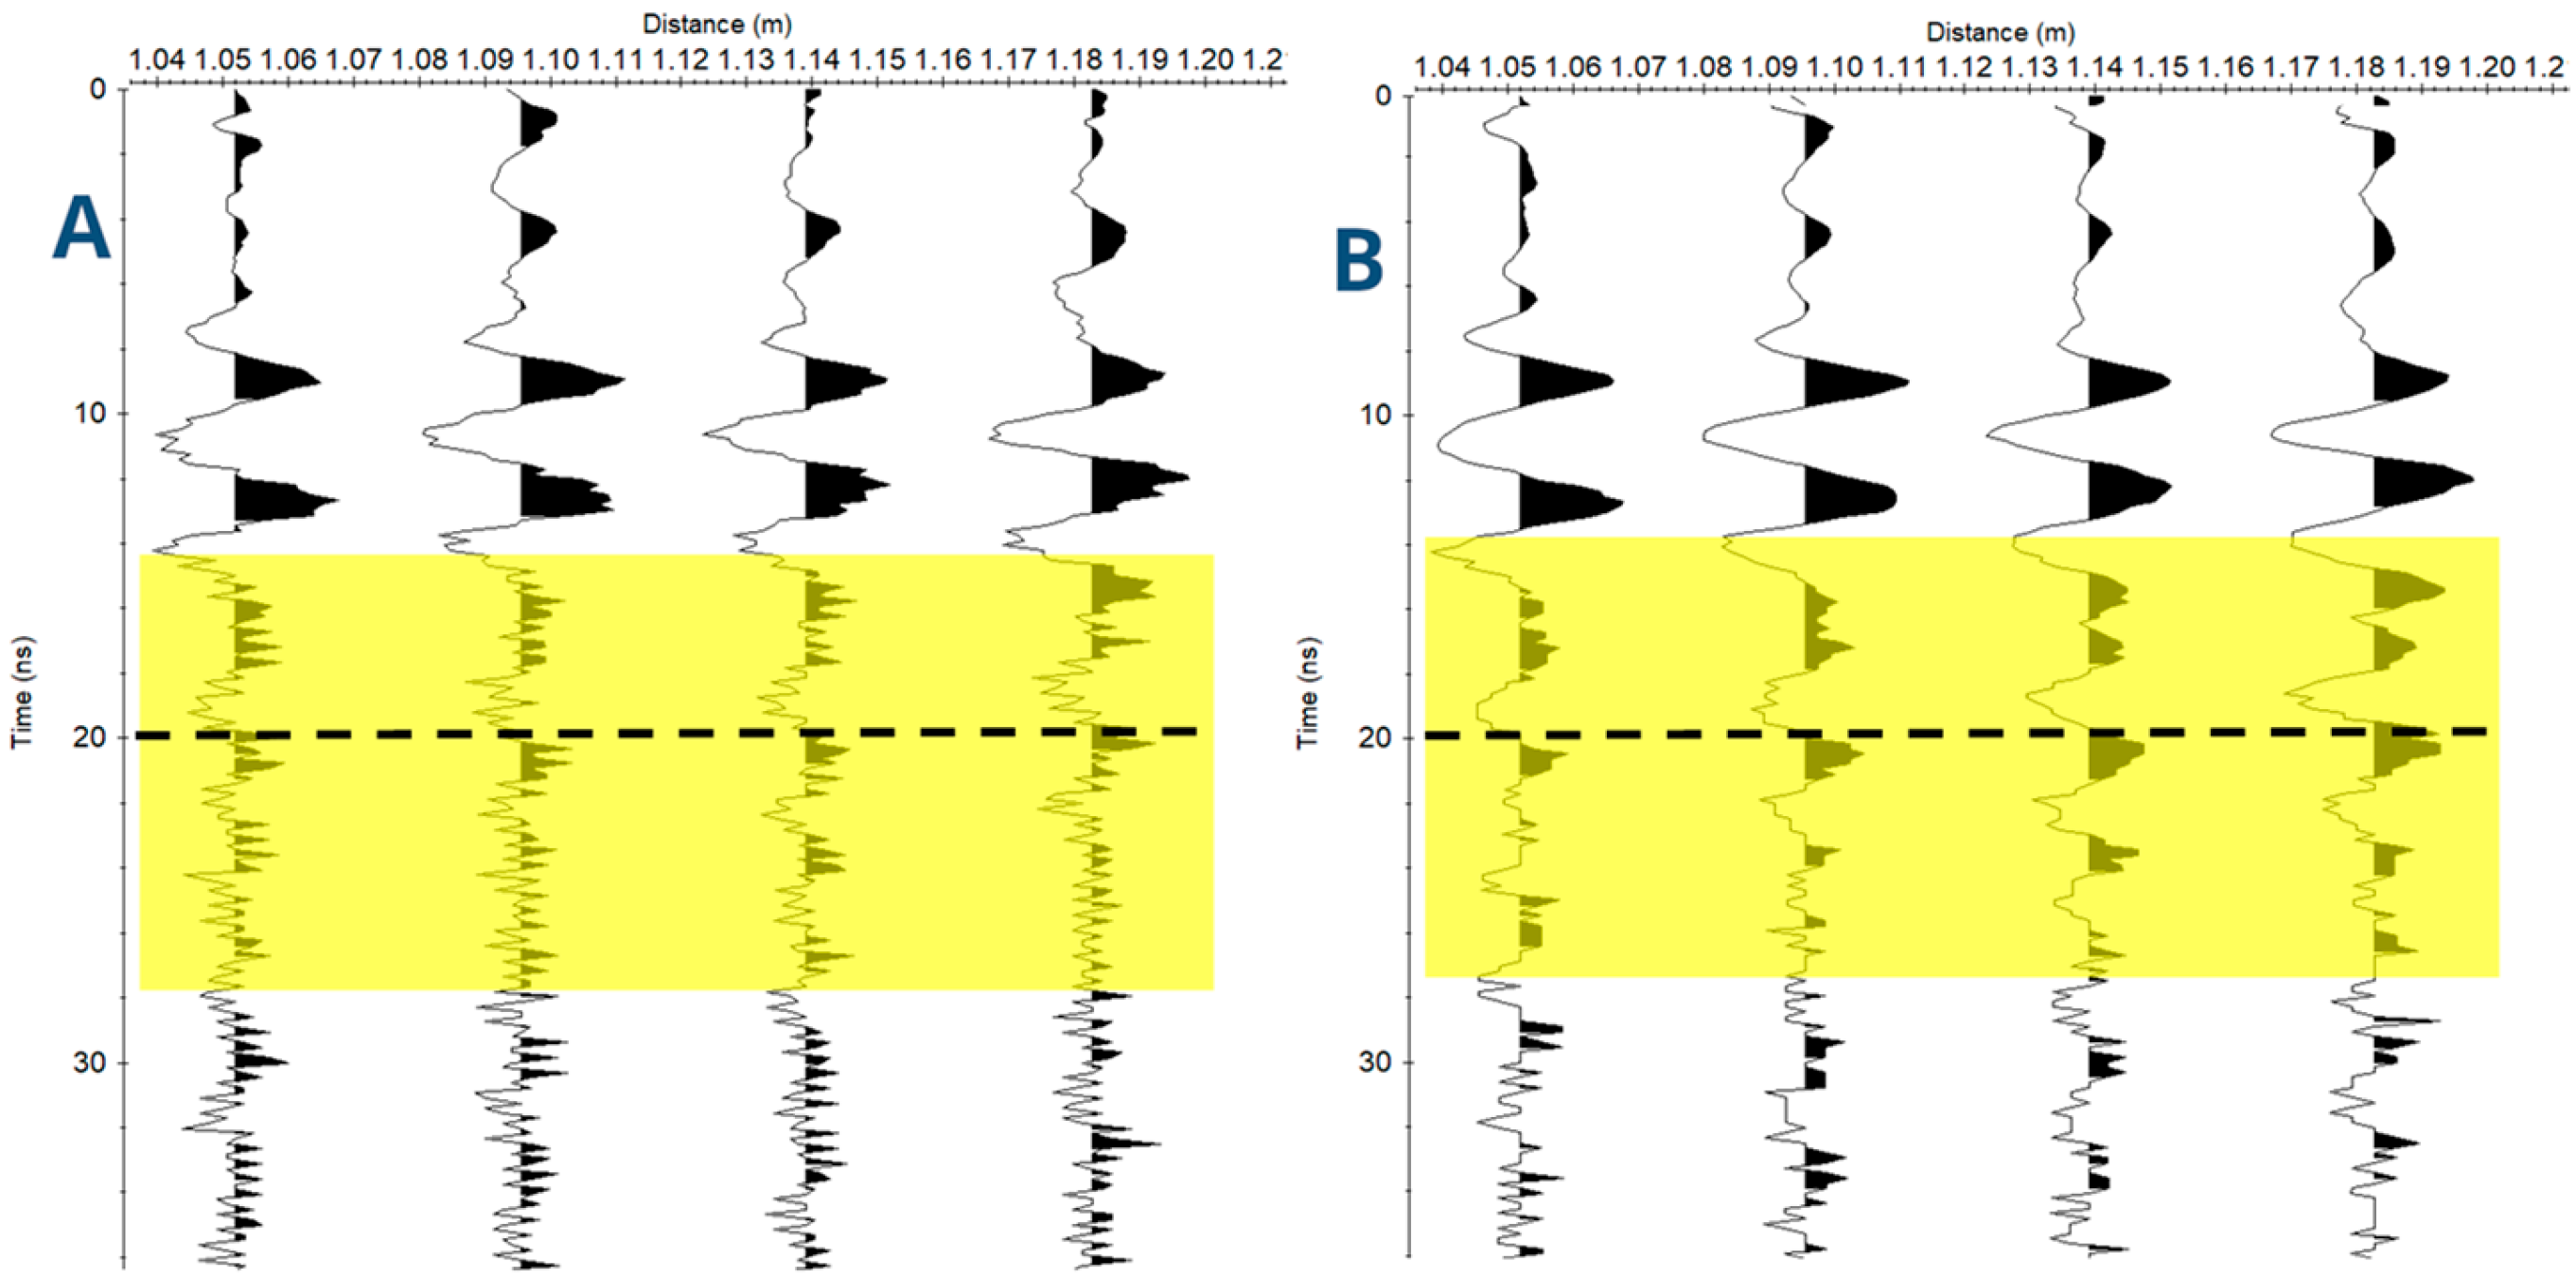
Another indubitable advantage of the off-line stacking with respect to in-line stacking is related to the different resolution in the profile direction that the two approaches can offer. This is represented in
Figure 4 where a comparison of some consecutive GPR traces after processing (
Figure 4A) and the same after off-line stacking (
Figure 4B) is reported. Again, an improvement in the quality of the traces can be observed in a similar time range than before (shaded yellow area). Apart from increasing the investigation depth, this also allows for better evaluation of the continuity of reflections among different traces. The same result cannot be obtained with in-line stacking because, within the distance analyzed in
Figure 4, all the observed traces would collapse in a single one.
In addition, traces reported in
Figure 4 also partially explain why the in-line stacking appears to be not as good as the off-line stacking in improving the trace quality and increasing the SNR. It can be indeed noted that the reflection event at around 20 ns (black dashed line) appears with a peak amplitude, which is slightly varying in the profile direction. Therefore, the in-line stacking of these traces would not result in a trace as clear as that of the off-line stacking, as previously commented with respect to
Figure 3C.
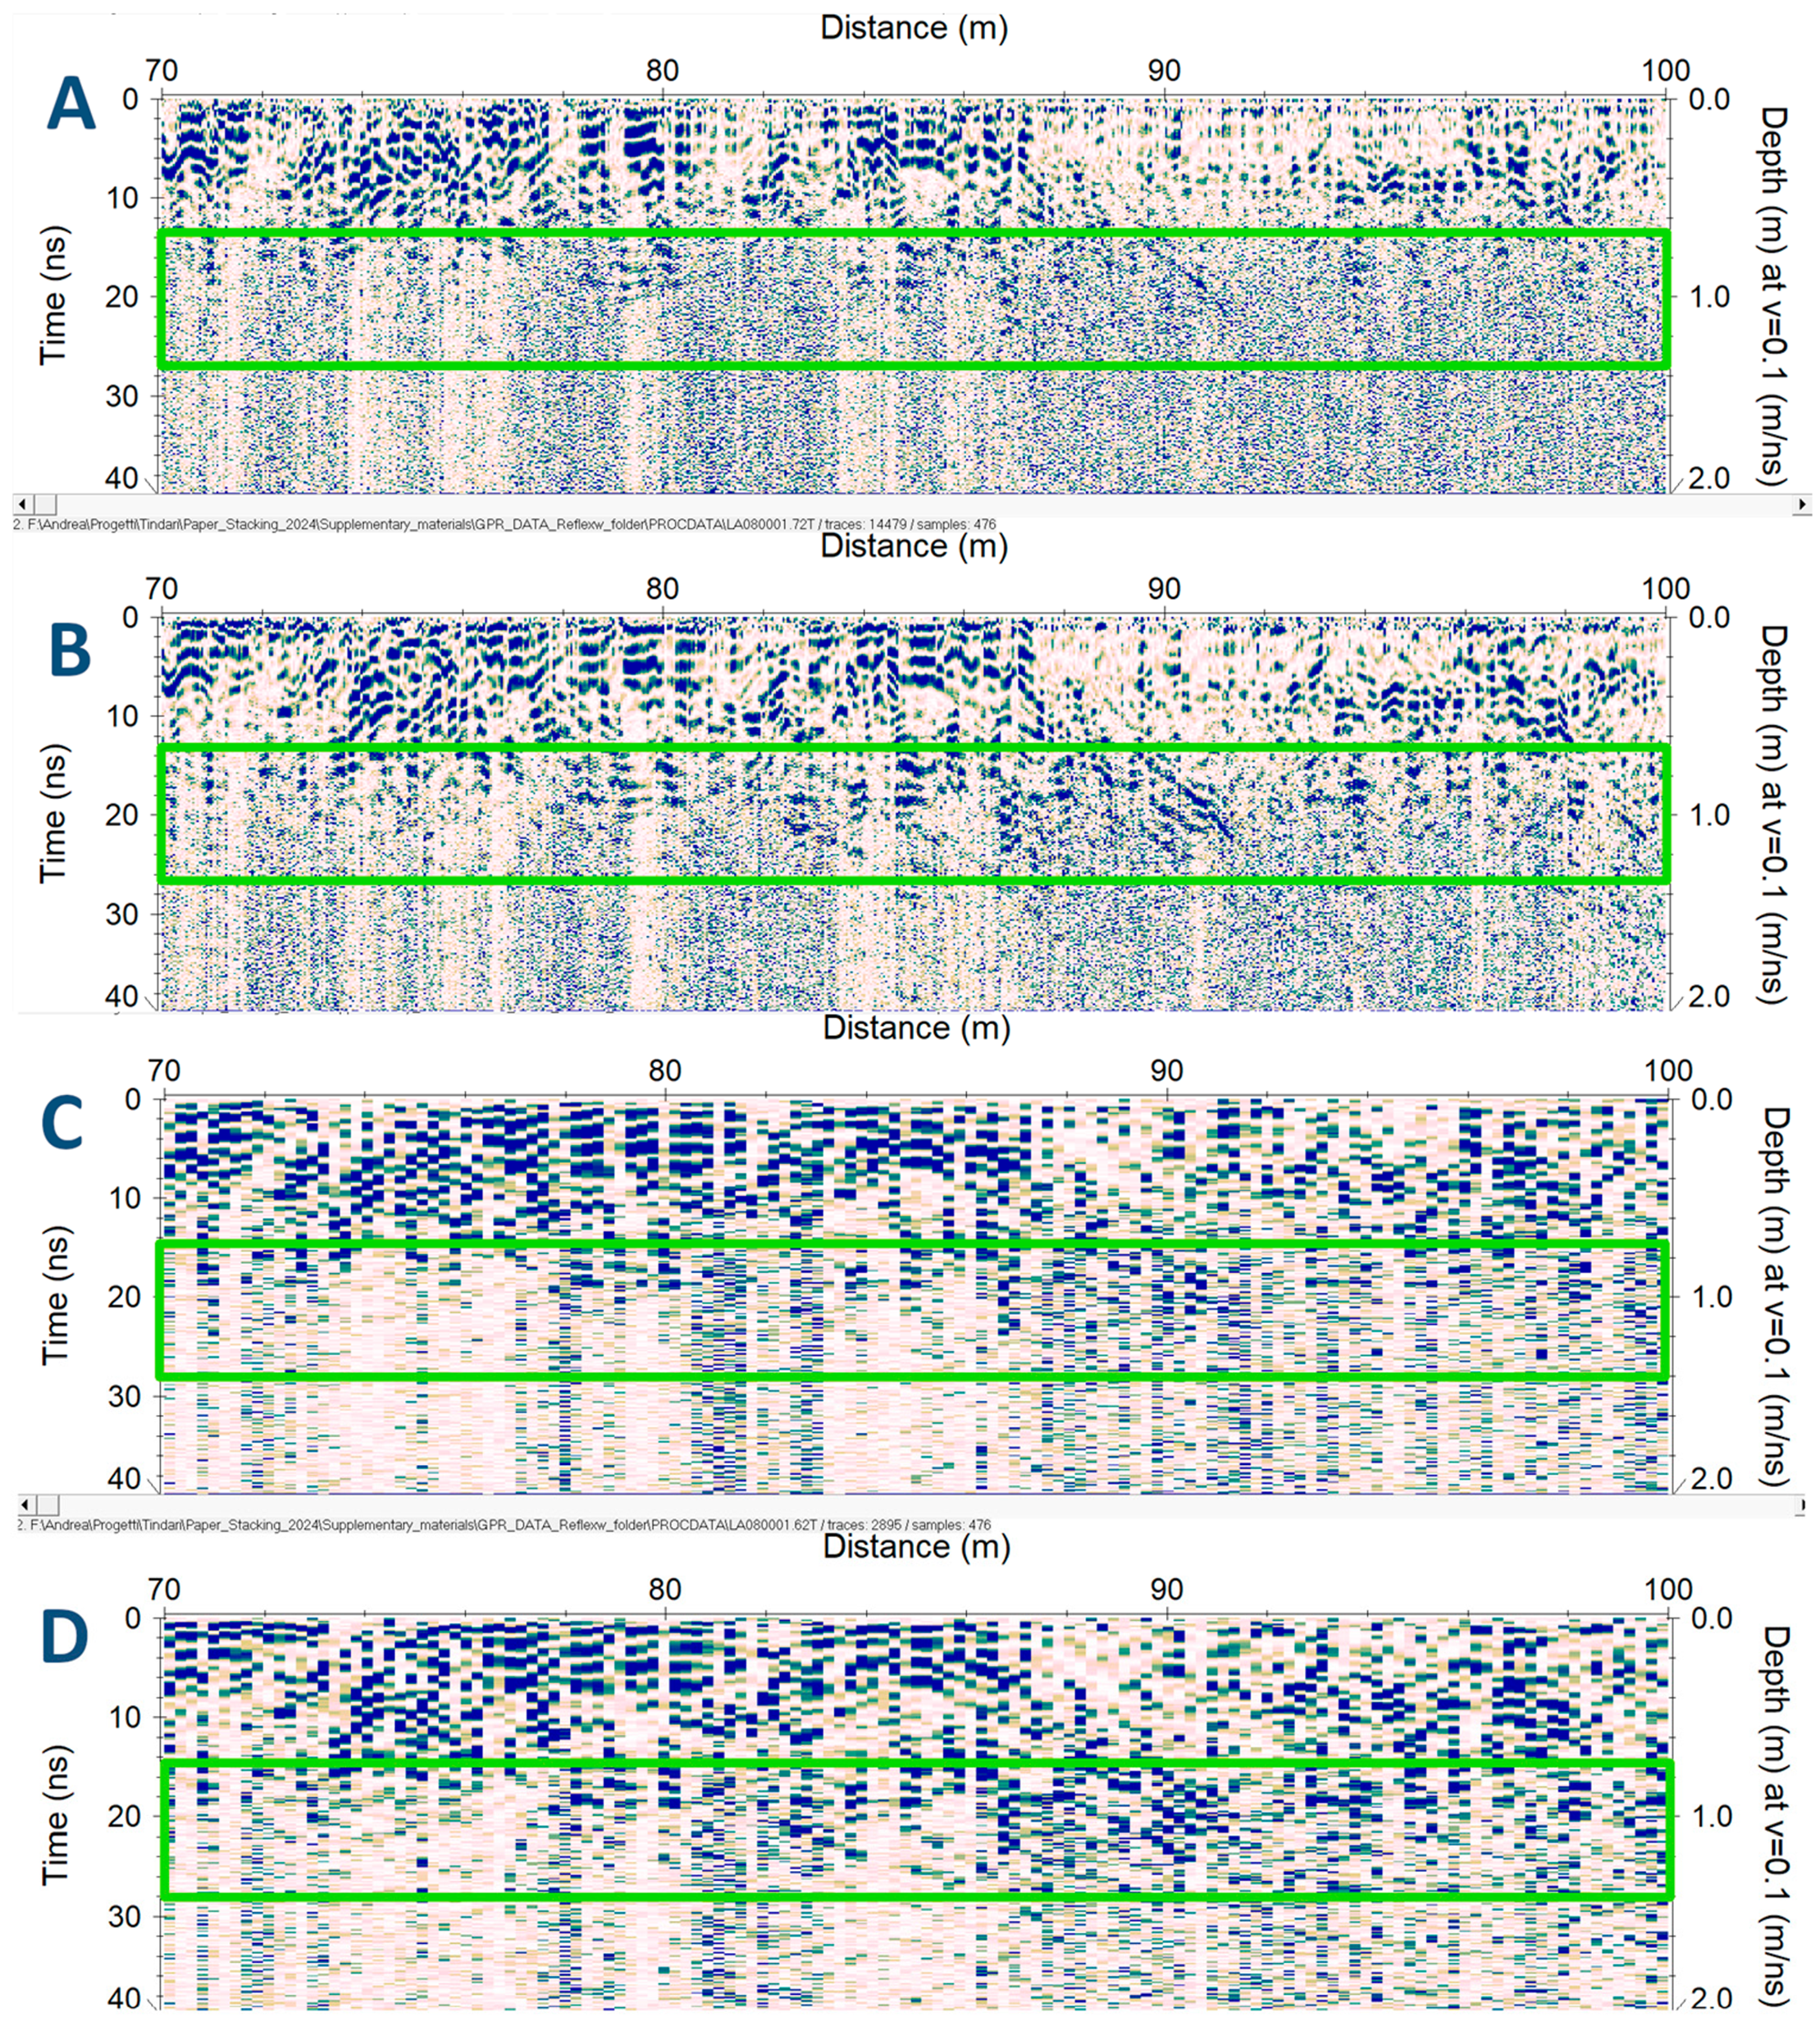
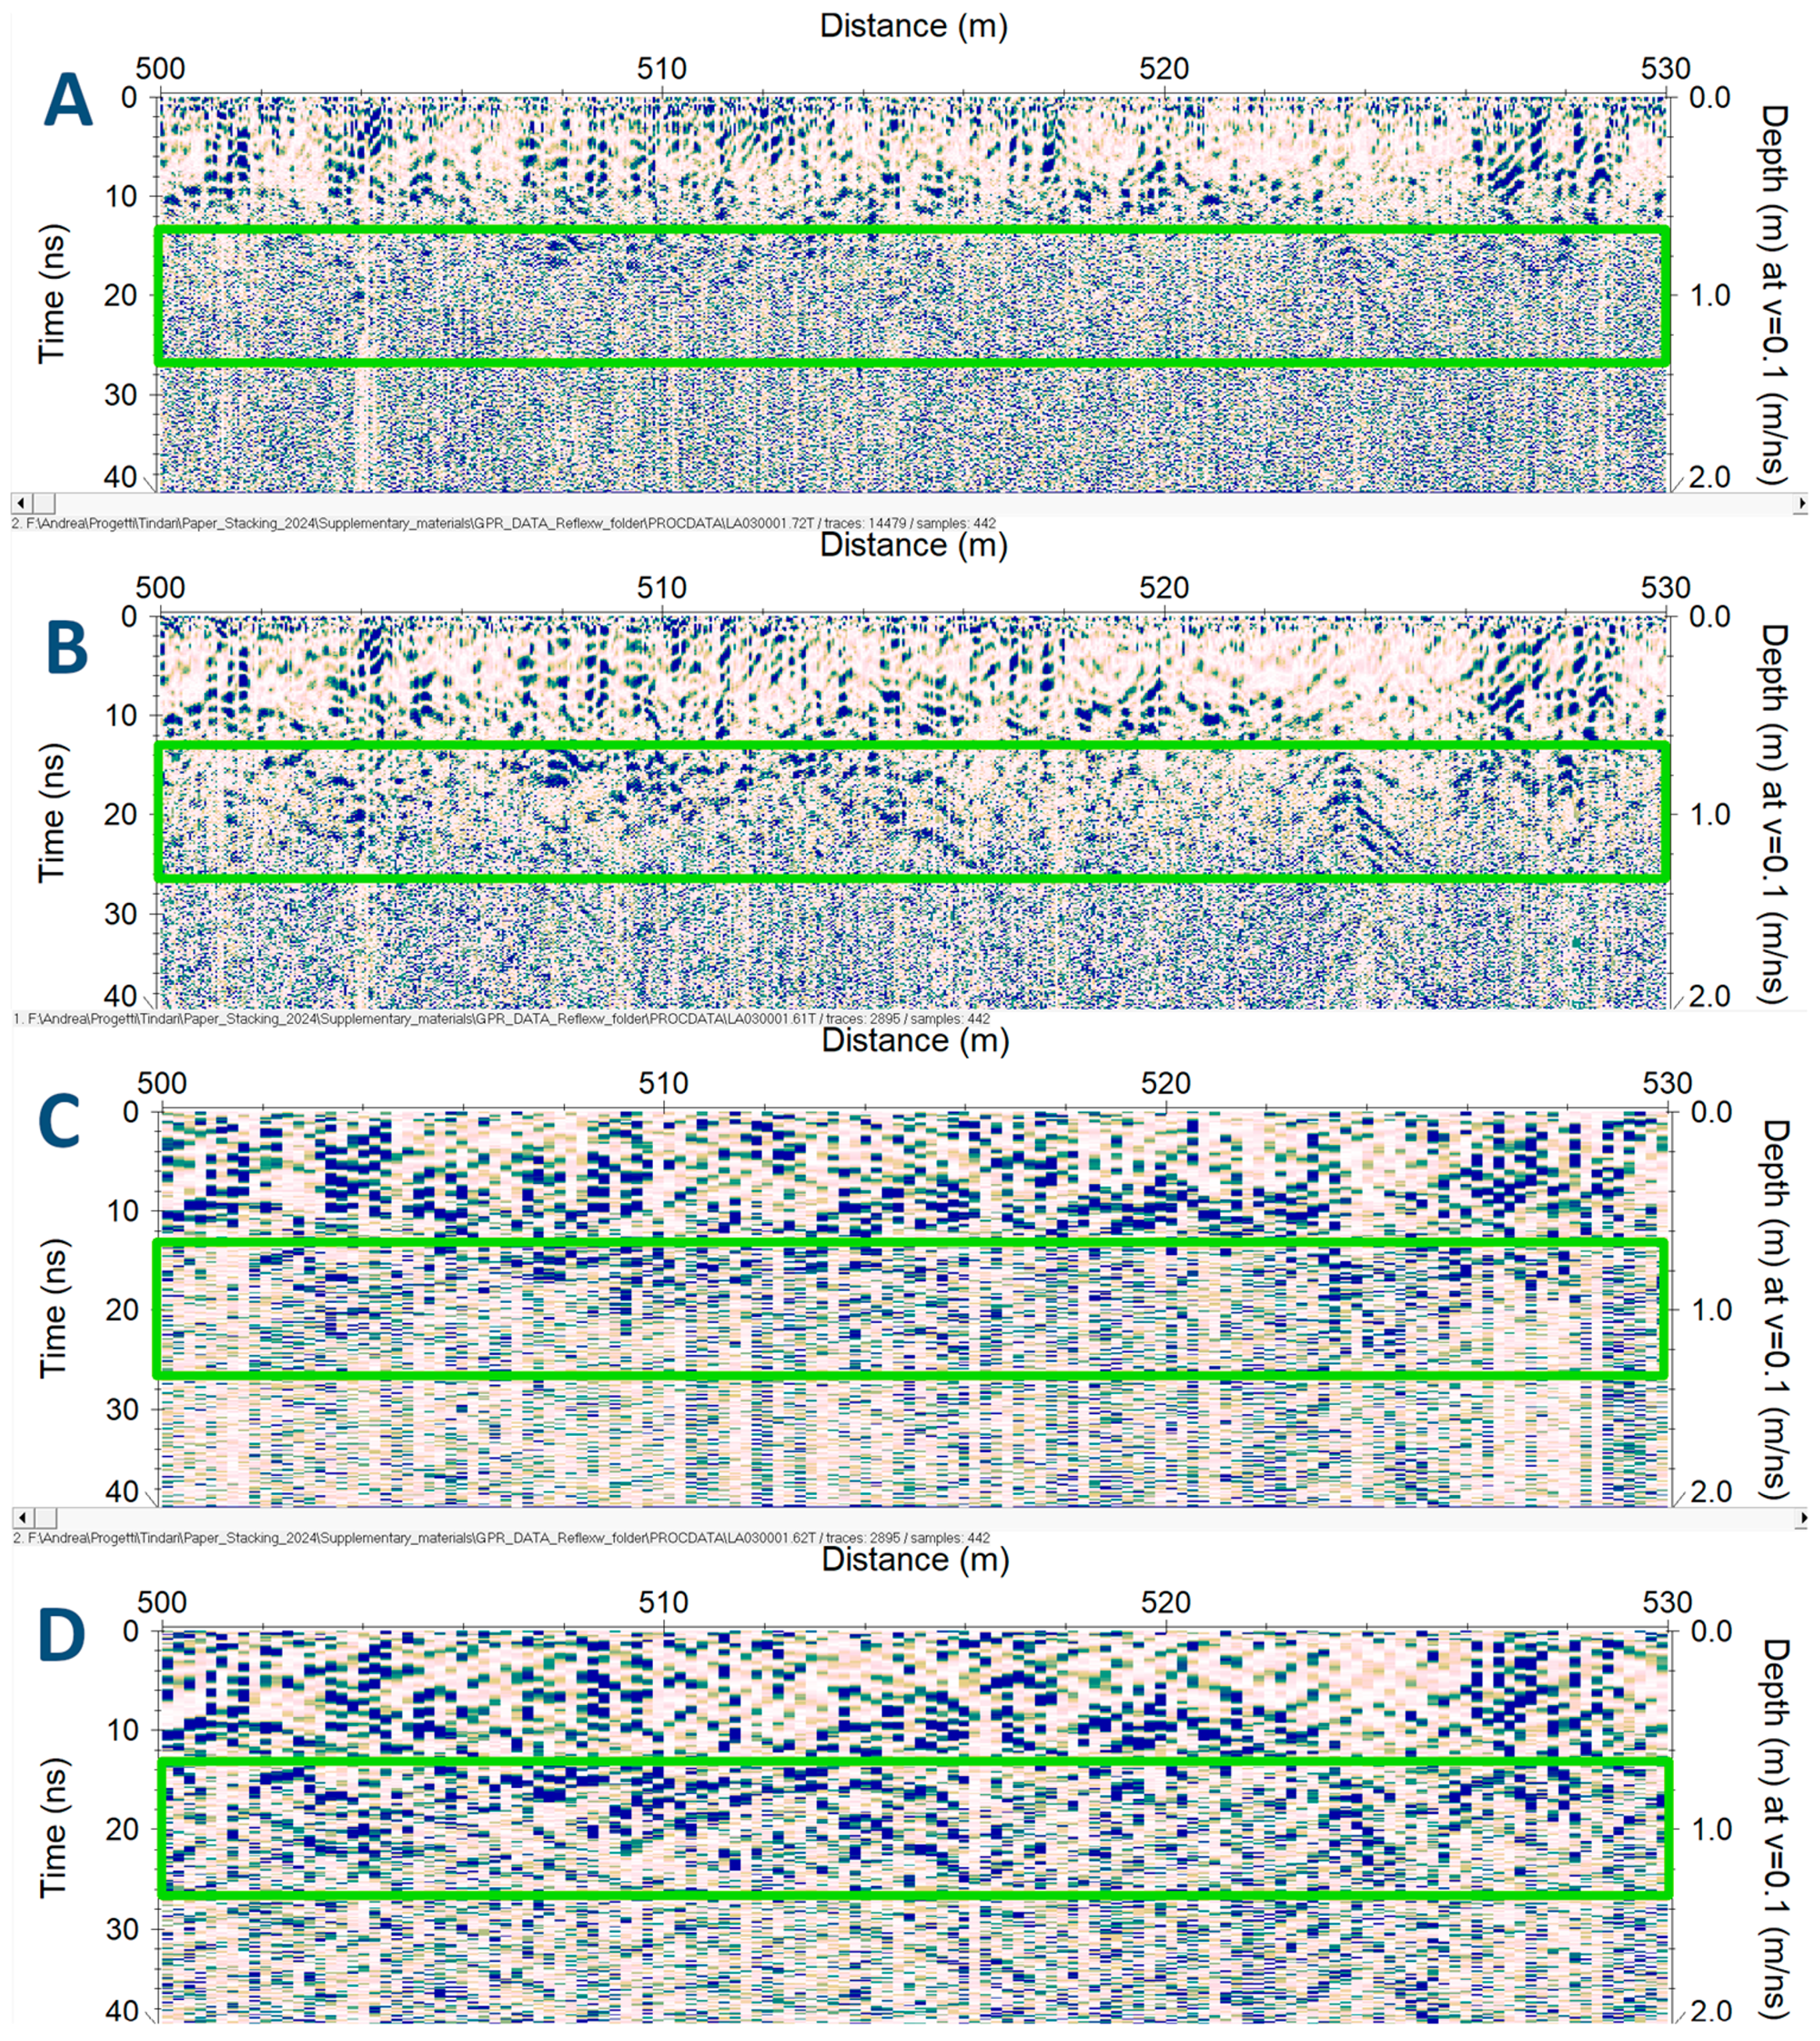
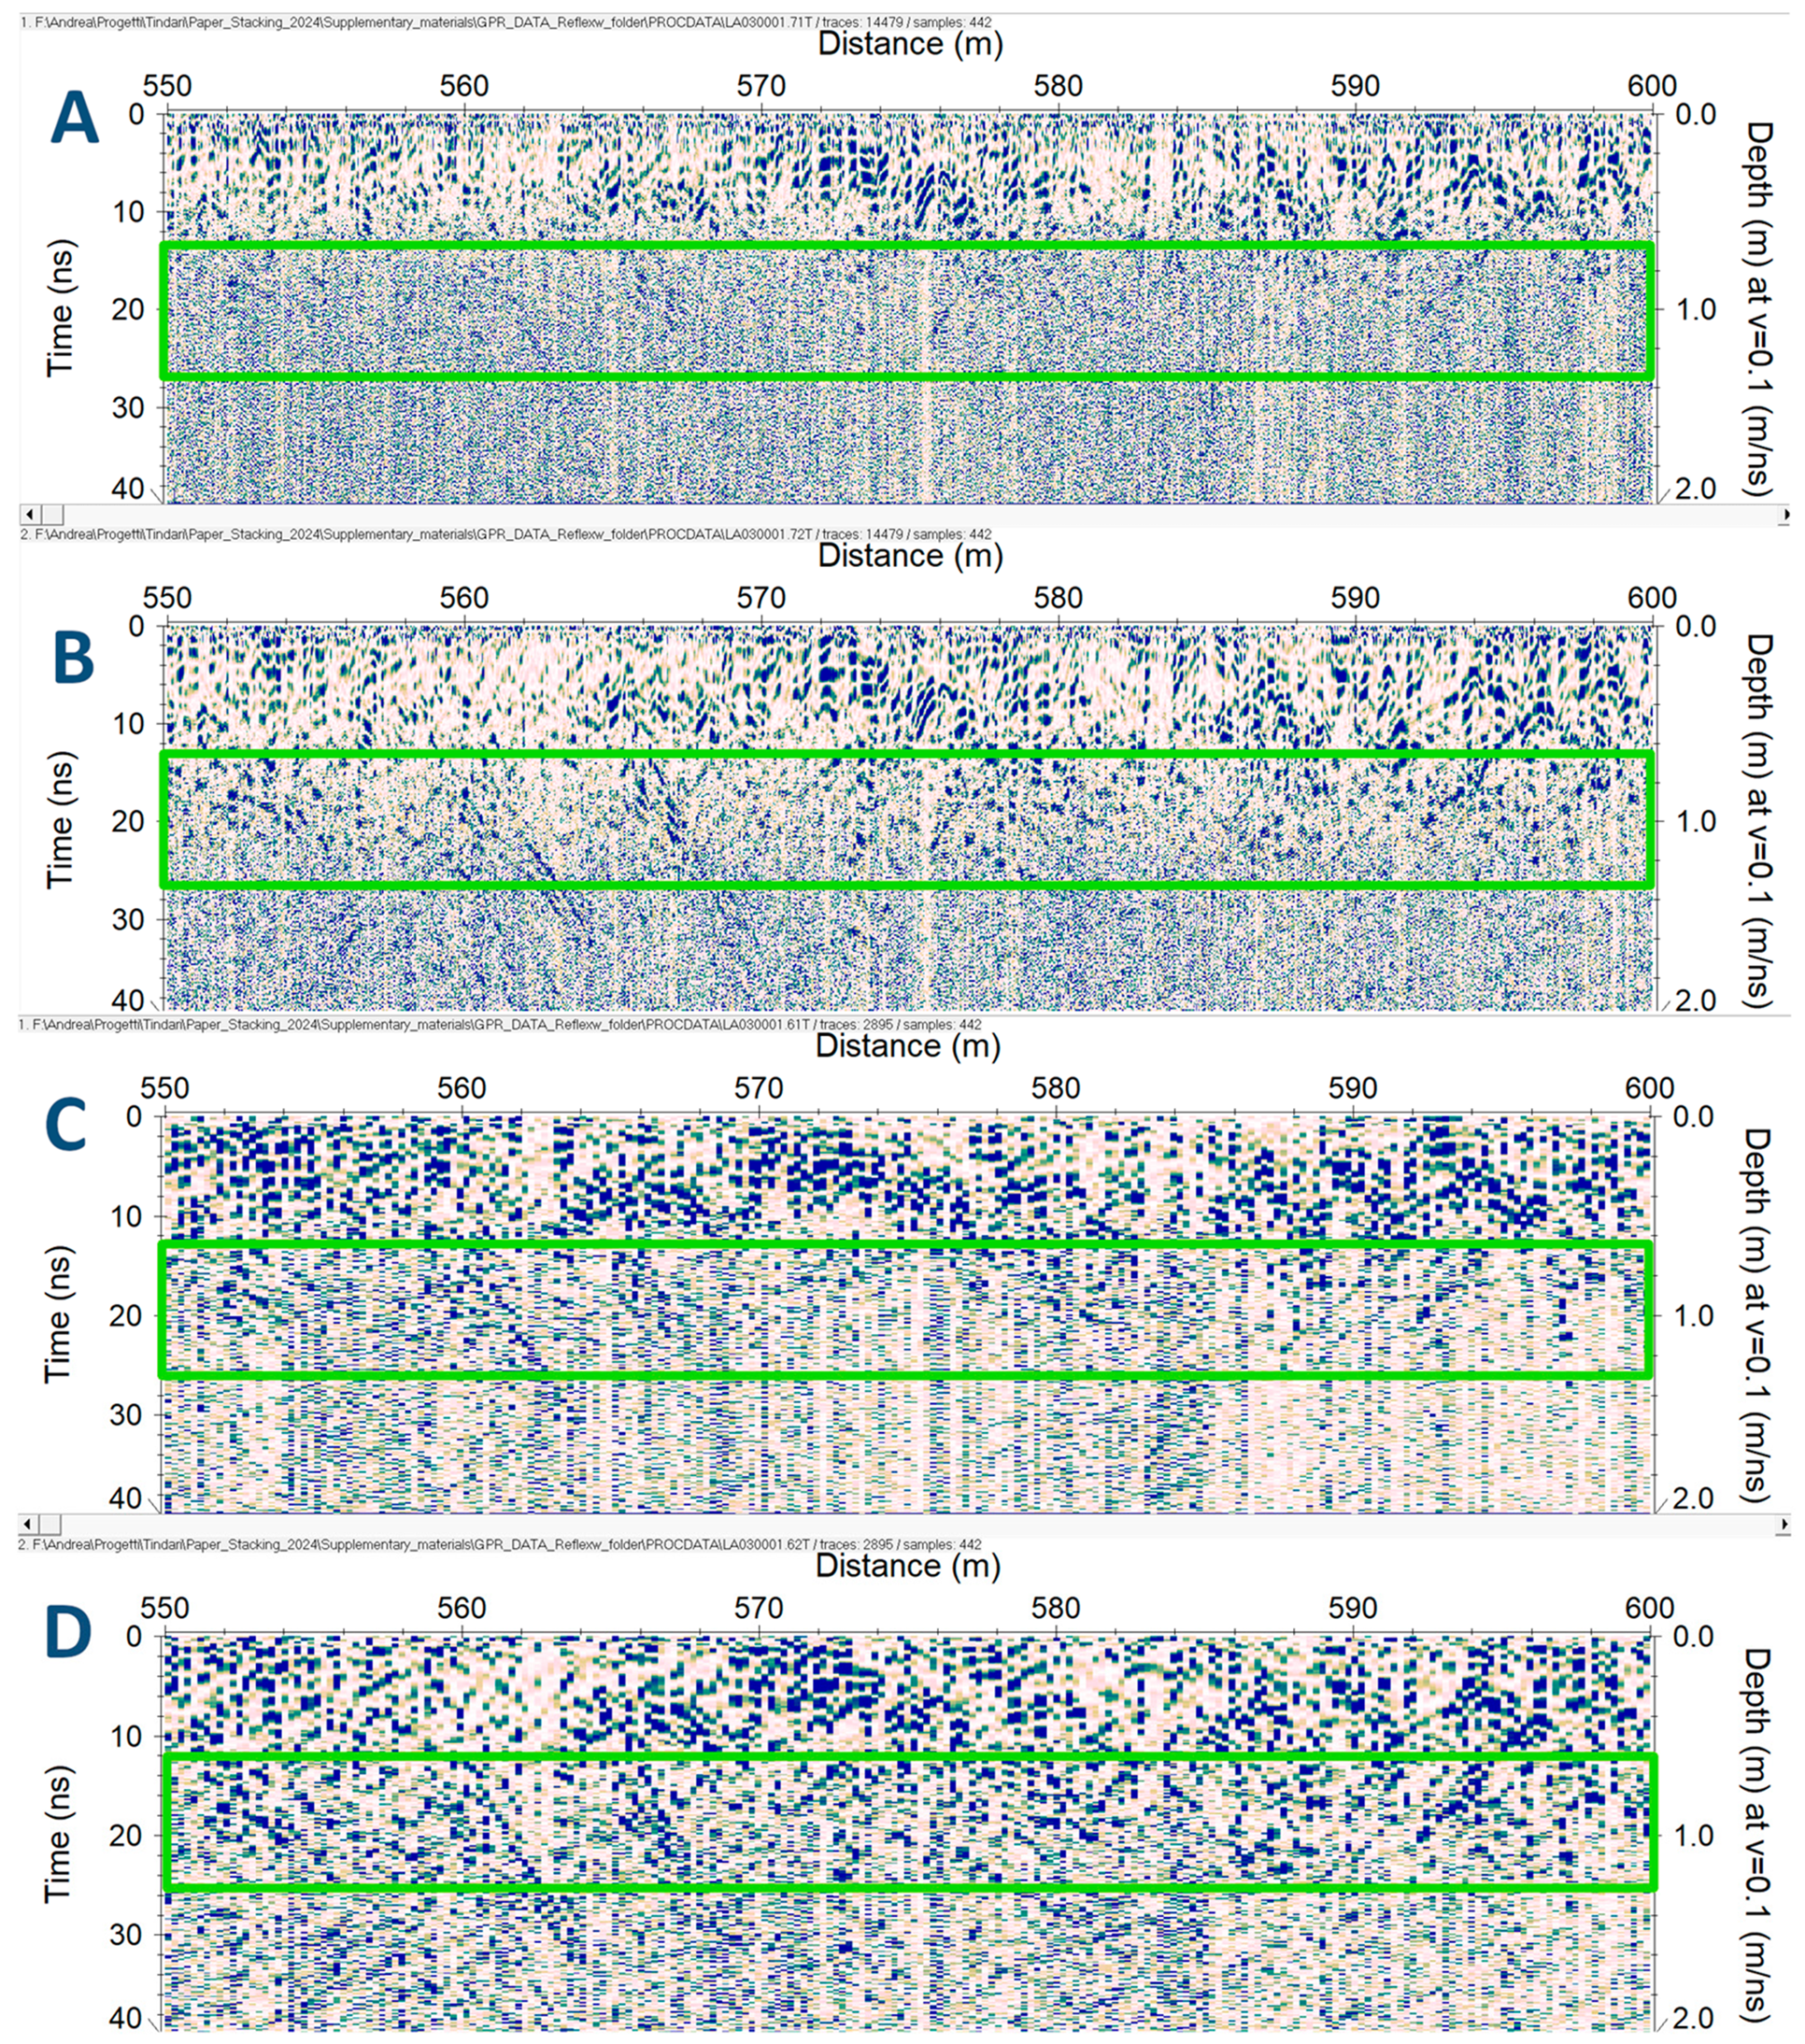
After assessing the goodness of off-line stacking on single example traces, we repeat the same comparison on whole radargrams. Example radargrams in different portions of the investigated GPR volume are reported in this respect in
Figure 5,
Figure 6 and
Figure 7. Following the same presentation approach as before, in all the figures, radargrams after processing and before any stacking (panels A) are compared with the off-line stacked ones (panels B), the in-line stacked ones (panels C), and radargrams after both off-line and in-line stacking (panels D).
We can observe that the whole radargram highly benefits from off-line stacking in the 15 to 25 ns time range (green rectangles) and that the improvement of the quality of the radargrams is significantly better with the use of the off-line stacking with respect to the other stacking approaches. Moreover, the random noise starting at about 10 ns is also greatly reduced. Especially, specific reflecting features are more visible in the off-line stacked radargrams than in the others, e.g., around progressive 90 m in
Figure 5, 515 and 525 m in
Figure 6, and between progressive 550 and 570 m in
Figure 7, confirming the increase in the potential investigation depth.
In all the figures, it can also be further evidenced that the main problem of in-line stacking is that, reducing the number of traces, it easily worsens the clarity of 2D radargrams (as an example, see comparisons of
Figure 5B,C around progressive 90 m and of
Figure 6B,C around progressive 525 m). Comparing in-line stacking and off-line stacking along radargrams again suggests that the latter is the better improvement option. The combination of both stacking options (panels D) is better than just in-line stacking, but the resolution loss is still problematic to accurately detect buried structures and specific reflection features.
The different stacking approaches are finally evaluated on time-slices, obtained by interpolating all the 2D radargrams coming from the different stacking options into different 3D data volumes. Example time-slices of the different approaches are presented at two different times: in
Figure 8 at 14 ns and in
Figure 9 at 18 ns. This time range corresponds to the zone in which more significative improvement differences have been noted in the example radargrams and to the attended depth of main excavated structures. It can be evidenced that off-line stacking remains a viable noise-reduction processing not only for radargrams but also for time-slices, which are usually the main product of a multichannel GPR survey for archaeology.
Particularly, it can be observed in
Figure 8 (green circle) how the off-line stacking improves the visibility and continuity of linear features corresponding to the walls of the excavated domus within the insula (see also
Figure 1B). Furthermore, the details provided by the off-line stacking approach are highly increased with respect to the only processed data before any stacking and to the other stacking approaches, allowing a better delineation of the domus structure. At increased times (
Figure 9), it can also be noted how off-line stacking allows one to more clearly highlight the presence of five localized anomalies, aligned along a specific direction (green rectangle), which may correspond to an archaeologically interesting feature and are barely visible in the other images. Specifically, these anomalies correspond to the anomalies already reported in correspondence of the radargram of
Figure 5 between progressive 75 and 95 m.
4. Discussion
In all the comparisons performed within the paper (example traces, radargrams, and time-slices), we noticed an improvement, thanks to off-line stacking, in the quality of the results obtained. For the specific test site of Tindari, this improvement is especially evident in the 15–25 ns time range. Compared with the traditional in-line stacking, while also this last can be partially helpful to improve the general quality of the results, often it negatively affects the radargram quality. In fact, stacking n adjacent traces in the profile direction (five in this case) reduces the number of traces by a factor of n. Fewer traces consequently mean fewer pixels in the radargram, reducing its resolution.
One possible solution to overcome this in-line stacking limitation would be acquiring more traces per meter to collect more data to be stacked. However, this is often not convenient with multichannel systems, which have to handle a large data flow and limit the acquisition speed according to the selected spacing between traces. In this sense, the off-line stacking seems to be, therefore, an excellent alternative to improve the radargram quality, especially at depth, without compromising acquisition times.
It has to be considered that also off-line stacking is performed at the expense of the resolution, given that stacking n adjacent traces in the lateral direction (five in this case) reduces the number of traces by a factor of n and consequently worsens the lateral resolution. While this loss in resolution does not affect the radargram quality, it can potentially deteriorate the quality of time-slices depending on the dimensions of the desired targets to be imaged. Therefore, while suppressing noise, the off-line stacking can smear small, discrete targets or reduce lateral resolution, especially if the group size or channel spacing is large relative to the target size. However, in the specific situation in which the survey aim is the identification of archaeological remains of relevant dimensions (i.e., walls or structures), we noticed that off-line stacked time-slices are instead very clear and informative. In this respect, off-line stacking has the advantage of suppressing possible small anomalies and scattering and indeed improves the final image instead of deteriorating it. This can be considered true until the number of laterally stacked traces is limited such as to maintain at least a reasonable lateral resolution (i.e., generally <0.25 to 0.5 m for archaeological investigations).
One problem worth mentioning is that off-line stacking can, nevertheless, worsen the data quality at shallow depths. Stacking five adjacent traces separated about 4 cm each means stacking something situated in the range of about 16 cm. Therefore, shallow targets can be misplaced or decrease in quality when applying off-line stacking (this problem also happens with in-line stacking). This problem is not clearly noticeable in the data reported in the paper since at the test site the buried features lie deeper, often at least at 30 cm of depth. In this sense, one has to be conscious that, for example, above 50 cm of depth, it is better to consider the non-stacked data, while below 50 cm of depth, it is better to consider the stacked data. The choice of this depth is arbitrary and seems valid for the Tindari test site, but may be reconsidered for other sites according to site-specific soil characteristics.
From the results obtained in this study, we can therefore conclude that off-line stacking is a simple and viable option to reduce noise in multichannel GPR data, especially in challenging environments. The SNR improved from non-stacked data to off-line stacked data in both 2D radargrams and depth-slices. Compared with traditional in-line stacking, off-line stacking shows a substantial advantage. This result allows for better interpretation of multichannel GPR data, which generally involves both radargrams and time-slices visualizations.
In this work, we mainly compared the off-line stacking to in-line stacking since these two processing steps share the same philosophical approach. However, we do not see any stacking approach as an alternative to other, more sophisticated, filtering approaches that are commonly used in challenging environments (e.g., f-k filtering [
14,
24] or wavelet denoising [
25,
26]). Indeed, further filtering can still be applied to the stacked traces in order to exploit the potentiality of these last processing approaches to increase the data quality.
As mentioned before, the resolution reduction due to (any type of) stacking was assessed to be not an important problem in the test site, where the survey targets were relatively big features such as buried walls. Indeed, it has been already discussed in the literature [
18] that generally a denser GPR profile spacing can guarantee that all target features will fall within the radar’s footprint. In this respect, multichannel GPR systems usually easily allow a significantly denser spacing than standard GPR single-channel systems. But the question is how dense is dense enough? Normally, the spacing of GPR profiles is suggested to be no larger than the anticipated feature size of the targets or the distance between adjacent features [
27]. If the target features are large enough, not all the acquired channels are strictly necessary and can be stacked, as performed in this study.
When feature size and feature spacing are both unknown, the radar’s wavelength is the only factor to be taken into account, based on the principle of radar footprint, to establish the lateral separation among traces. Usually, the profile spacing is suggested to be a quarter of the wavelength [
17,
28]. Indeed, for the Stream C system adopted in this study, the VV channel separation of 4 cm strictly derives from this consideration: at the nominal frequency of 600 MHz, with an assumed standard radar velocity of 10 cm/ns, the resulting wavelength is of about 16 cm, and its quarter about 4 cm, as the adopted antenna separation. However, this antenna separation can be valuable only for the imaging of very tiny structures but not generally necessary. Indeed, even acquisition grids of an eighth of the wavelength have shown to guarantee a proper sampling of the high-frequency content of the GPR signal spectrum, and resulting in optimum image quality, but mainly for fracture imaging purposes [
22]. Moreover, the quarter wavelength value may vary depending on the effective central frequency of the signal (at the test site, we observed a shift to lower frequencies in the 300 Hz range) and on the effective radar velocity of the tested material (generally lower than 10 cm/ns in natural clayey soils).
Therefore, most of the sampled information with the multichannel system adopted in this work on a real subsoil in a real archaeological site can result well below the quarter wavelength criterion, and, consequently, the proposed off-line stacking approach can be seen also as a necessary step to restore the real lateral resolution of the data and not as an artificial processing strategy. Indeed, for the studied case history, considering an approximate radar velocity of 7 cm/ns, dependent on the clay content [
29], and the observed peak frequency of about 300 MHz would result in a quarter wavelength value of about the same order as the one obtained with the off-line stacking of five adjacent traces, as performed in the analyses reported in this paper. The general message is to not remain stuck by manufacturer specification but be flexible depending on the required resolution of the surveys and on survey specifications.


