Article

Cyber-Secure IoT and Machine Learning Framework for Optimal Emergency Ambulance Allocation

1
Division of Computer Science and Engineering, Sunmoon University, 70, Sunmoon-ro221beon-gil, Tangjeong-myeon, Asan-si 31460, Chungcheongnam-do, Republic of Korea
2
Department of Artificial Intelligence and Software Technology, Sunmoon University, 70, Sunmoon-ro221beon-gil, Tangjeong-myeon, Asan-si 31460, Chungcheongnam-do, Republic of Korea
*
Author to whom correspondence should be addressed.
Appl. Sci. 2025, 15(13), 7156; https://doi.org/10.3390/app15137156 (registering DOI)
Submission received: 30 April 2025 / Revised: 30 May 2025 / Accepted: 15 June 2025 / Published: 25 June 2025

Abstract

Optimizing ambulance deployment is a critical task in emergency medical services (EMS), as it directly affects patient outcomes and system efficiency. This study proposes a cyber-secure, machine learning-based framework for predicting region-specific ambulance allocation and response times across South Korea. The model integrates heterogeneous datasets—including demographic profiles, transportation indices, medical infrastructure, and dispatch records from 229 EMS centers—and incorporates real-time IoT streams such as traffic flow and geolocation data to enhance temporal responsiveness. Supervised regression algorithms—Random Forest, XGBoost, and LightGBM—were trained on 2061 center-month observations. Among these, Random Forest achieved the best balance of accuracy and interpretability (MSE = 0.05, RMSE = 0.224). Feature importance analysis revealed that monthly patient transfers, dispatch variability, and high-acuity case frequencies were the most influential predictors, underscoring the temporal and contextual complexity of EMS demand. To support policy decisions, a Lasso-based simulation tool was developed, enabling dynamic scenario testing for optimal ambulance counts and dispatch time estimates. The model also incorporates the coefficient of variation (CV) of workload intensity as a performance metric to guide long-term capacity planning and equity assessment. All components operate within a cyber-secure architecture that ensures end-to-end encryption of sensitive EMS and IoT data, maintaining compliance with privacy regulations such as GDPR and HIPAA. By integrating predictive analytics, real-time data, and operational simulation within a secure framework, this study offers a scalable and resilient solution for data-driven EMS resource planning.

1. Introduction

Timely response in emergency medical care is a critical determinant of patient survival, particularly in acute cases such as cardiac arrest, severe trauma, or stroke. When an emergency occurs, the ability of an ambulance to arrive swiftly at the scene and transport the patient to an appropriate healthcare facility significantly influences the likelihood of recovery and long-term health outcomes. Accordingly, emergency response time remains a core performance indicator within emergency medical services (EMS) systems worldwide [1,2]. South Korea’s national EMS system, which operates under the 119 rescue and emergency dispatch framework, plays a central role in the country’s public health infrastructure by delivering critical prehospital care and linking incident locations to tertiary medical institutions. As the nation undergoes a rapid demographic transition into an aging society, the demand for timely and high-quality emergency interventions has surged. This shift is accompanied by an increase in age-related emergencies, particularly in regions where access to specialized care is limited, thus intensifying the burden on the EMS system to maintain operational responsiveness nationwide [3]. Despite these growing complexities, the current ambulance deployment strategy in South Korea still largely relies on static criteria—most notably, population size. As shown in Figure 1, the spatial distribution of ambulance allocation (right) closely mirrors the population distribution (left), suggesting that deployment decisions are primarily driven by demographic counts rather than actual emergency demand patterns. This one-size-fits-all approach overlooks critical factors, such as temporal variability in emergency incidents, traffic congestion, accessibility to hospitals, and regional vulnerability, potentially resulting in resource underutilization in low-demand areas and chronic shortages in high-need zones [4]. Ambulance deployment plays a vital role not only in enabling rapid medical intervention but also in ensuring equitable access to care. Insufficient ambulance coverage or poorly optimized placement strategies can lead to delayed response times, decreased survival rates, and increased pressure on emergency departments. Therefore, optimizing ambulance allocation is essential for enhancing the overall effectiveness and equity of the EMS system, particularly under conditions of increasing demographic and spatial complexity [5]. To address these challenges, there is an urgent need to transition from traditional population-based deployment policies toward data-driven strategies that incorporate real-time variables such as traffic flow, hospital capacity, response history, and sociodemographic indicators. A scientifically grounded, adaptive allocation model will be crucial in building a resilient EMS system capable of meeting both current and future public health demands.
Emergency medical services (EMS) serve as critical systems that directly contribute to saving lives, with ambulance deployment functioning as a key operational asset that determines both the speed of on-site response and the quality of initial medical intervention. Effective ambulance allocation is not merely a matter of increasing the number of emergency vehicles; rather, it must be grounded in a quantitative strategy that considers demographic characteristics, spatial accessibility, and temporal variations in demand [6,7]. However, most current deployment policies remain predominantly based on static variables, such as population density, administrative area size, and historical dispatch frequency. As a result, they fail to adequately account for dynamic factors such as real-time traffic conditions, hospital capacity, patient severity, and the incidence of episodic events [8]. As a result, persistent ambulance shortages are observed in certain regions. Delays in emergency response are frequently reported, particularly in densely populated urban areas affected by traffic congestion and in remote rural regions where access to medical facilities is limited [9]. To address these challenges, recent attention has turned to big data and machine learning-based approaches. By integrating multidimensional datasets—including historical dispatch records, regional demographics, hospital locations, and traffic volume—predictive models can be trained to forecast emergency demand across specific spatial and temporal contexts. This enables a proactive reallocation of ambulance resources in anticipation of emerging needs [10].
This study proposes a predictive framework that integrates machine learning methods with real-world EMS data to optimize ambulance deployment in South Korea. The model incorporates a broad array of explanatory variables, including traffic congestion, proximity to medical institutions, elderly population ratios, and historical dispatch records, to identify determinants of response efficiency. To facilitate practical application, an interactive simulation interface is developed to compare conventional population-based allocation with the proposed data-driven approach. The core model employs tree ensemble regression algorithms—namely, Random Forest, XGBoost, and LightGBM—trained and validated using actual 119 dispatch data to ensure robustness and generalizability. The simulation platform supports policy planning by allowing decision-makers to dynamically adjust regional parameters and explore various hypothetical deployment scenarios. This functionality enables both national and local EMS administrators to make evidence-based and equitable decisions regarding resource allocation. In addition, the system incorporates a performance evaluation module based on the coefficient of variation in workload distribution, aligning with established administrative standards for regional equity. By addressing both operational efficiency and fairness, the proposed framework offers a valuable tool for strategic EMS planning in the face of growing demographic and infrastructural complexity.
The main contributions of this study are summarized as follows. First, we develop a predictive model that leverages real-world EMS data and machine learning methods to identify critical factors influencing ambulance response performance. Second, we design an interactive simulation interface that facilitates dynamic comparison between traditional and data-driven deployment strategies. Third, we incorporate a performance assessment mechanism based on the coefficient of variation in workload distribution to ensure regional equity. Finally, the proposed system is developed with integrated cybersecurity safeguards to ensure the secure handling of sensitive operational data. The primary contribution of this study lies in the development of a comprehensive and cyber-secure framework for optimizing emergency medical services through the combined application of predictive modeling, real-time IoT data integration, and simulation-based decision support. In contrast to conventional methods that rely solely on historical data or fixed allocation rules, our approach dynamically incorporates spatial, temporal, and operational factors while ensuring the confidentiality and integrity of data communications. This integrated system provides actionable insights for EMS administrators and policymakers aiming to improve responsiveness and promote equitable service delivery across regions.
The remainder of this paper is structured as follows. Section 2 reviews the theoretical background and related research on ambulance deployment and predictive modeling in EMS systems. Section 3 describes the data sources, preprocessing methods, and variable construction. Section 4 presents the predictive modeling process, simulation framework, and performance evaluation results. Section 5 discusses methodological considerations, key limitations, and directions for future research. Finally, Section 6 concludes with a summary of findings and the policy implications for data-driven EMS planning and resource optimization.

2. Background

2.1. Importance of Ambulance Deployment

Ambulance deployment plays a critical role in emergency medical services (EMS) by ensuring timely responses and safeguarding patient survival in emergency situations. An effective deployment strategy significantly influences patient outcomes, as rapid response times are directly associated with improved treatment results. Particularly in time-sensitive emergencies such as cardiac arrest, severe trauma, or stroke, providing care within the first 10 min can substantially increase the likelihood of survival [11]. The efficiency of ambulance deployment is influenced by multiple factors, including population density, traffic flow, hospital location, and capacity, and the frequency of emergency incidents. In urban areas, heavy traffic congestion can delay ambulance travel time, while in rural regions, the broad coverage area per ambulance often results in extended response times. These regional characteristics must be carefully considered in the development of deployment strategies. However, most existing ambulance deployment systems rely on static allocation methods, which fail to account for dynamic factors such as real-time traffic conditions, hospital bed availability, and anticipated fluctuations in emergency demand. Static models are often inadequate for responding effectively to variations in urban traffic flow or sudden changes in emergency department capacity. To address these limitations, recent studies have highlighted the potential of machine learning and data-driven approaches in optimizing ambulance deployment. By analyzing historical dispatch data in combination with real-time traffic and hospital resource information, these methods can offer more sophisticated and adaptive deployment strategies. For example, dynamic ambulance redeployment models utilizing genetic algorithms have been proposed, demonstrating effectiveness in adjusting vehicle locations in response to real-time demand changes, thereby reducing average response times [12].
The critical role of ambulance deployment has been underscored in numerous recent studies. It extends beyond the simple transportation of patients to medical facilities, serving instead as a foundational mechanism for the effective distribution of emergency medical resources and the optimal utilization of personnel during time-critical situations. Improper deployment may lead to delays in delivering necessary treatment, potentially resulting in life-threatening consequences for patients [13]. The function of an ambulance in emergency care includes not only rapid diagnosis and initial treatment but also the stabilization of the patient and safe transport to the hospital. Thus, proper deployment contributes to both short-term emergency response performance and the long-term operational efficiency of the emergency medical system. An optimized deployment strategy can alleviate the burden on emergency departments and prehospital care providers, thereby improving the overall efficiency of the healthcare system [14]. For instance, well-distributed ambulance resources can reduce overcrowding in emergency rooms, leading to a more favorable treatment environment for incoming patients. Furthermore, ambulance deployment affects not only survival rates but also overall healthcare costs. Timely intervention can prevent the deterioration of a patient’s condition, reducing the need for expensive, prolonged treatment [15]. For example, early cardiopulmonary resuscitation (CPR) and defibrillator use for cardiac arrest patients have been shown to improve survival outcomes while shortening hospital stays and lowering associated costs.

2.2. Key Factors Affecting Ambulance Deployment

Among the key factors influencing ambulance deployment, population density and regional characteristics are among the most critical. Out-of-hospital cardiac arrest (OHCA) survival rates have been found to correlate strongly with population density, independent of EMS response time [16]. Accordingly, areas with higher population densities may require proportionally greater ambulance coverage. Urban and rural areas differ substantially in their emergency response needs and should therefore be considered separately in deployment strategies. In rural or remote areas, special measures such as increasing the number of emergency personnel in underserved regions may be necessary to ensure adequate coverage. Traffic conditions and road infrastructure directly affect ambulance travel time to the scene. In areas with high congestion or poor road quality, response delays are more likely, highlighting the need for deployment strategies that consider real-time traffic patterns and roadway accessibility. In addition, the process of selecting a destination hospital must consider not only geographic proximity, but also facility capacity, clinical specialization, expected patient outcomes, and characteristics of the incident location [17]. These factors underscore the importance of dynamic modeling that integrates transportation and infrastructure data into ambulance allocation strategies. The geographic distribution and operational capacity of nearby hospitals also play a significant role in deployment planning. The size and occupancy rates of medical facilities can influence the frequency and necessity of ambulance diversion [18], which occurs when hospitals are unable to accept incoming patients. Therefore, strategic deployment must holistically account for hospital distribution, specialization, and admission capacity to ensure that patients are rapidly transported to the most appropriate care facilities. In particular, the location of major hospitals and specialized treatment centers can exert a substantial influence on the effectiveness of regional deployment policies.
The analysis of emergency dispatch records and patient characteristics plays a critical role in developing effective ambulance deployment strategies. For example, identifying the factors associated with non-transport ambulance calls can offer valuable insights for refining deployment decisions [19]. Such data enable a better understanding of the spatial and temporal distribution of ambulance demand and support the design of customized allocation strategies that consider patient types and severity levels. Furthermore, studies have revealed a strong association between ambulance density and out-of-hospital cardiac arrest outcomes, suggesting that the allocation of ambulance resources has a direct impact on patient survival [20]. More recent research has proposed ambulance deployment models that integrate machine learning with optimization techniques. These models are capable of optimizing ambulance placement in real time by incorporating historical dispatch data, traffic information, and demographic indicators. For instance, Hwang et al. (2020) presented an approach using integer programming formulations that jointly determine the redeployment of existing ambulances and the placement of new units [21]. Their model effectively minimizes ambulance travel distances while improving on-time arrival rates within the golden hour. Technological interventions such as priority signal systems for emergency vehicles have also shown promise in enhancing deployment efficiency. Municipalities equipped with such systems have demonstrated higher rates of timely arrivals compared to those without them [22], underscoring the importance of considering infrastructure readiness in deployment planning. In summary, developing a robust ambulance deployment model requires the integration of multiple factors, including population density, regional characteristics, traffic conditions, road infrastructure, hospital accessibility and capacity, and patient-specific emergency data. Leveraging real-time analytics, machine learning-based dynamic modeling, and supportive technological innovations can significantly improve the speed and effectiveness of emergency medical service delivery.

2.3. Technological Innovations in Ambulance Deployment

Technological advancements have played a pivotal role in improving the efficiency of ambulance deployment and emergency medical services. Rapid ambulance response in emergency situations is a critical determinant of patient survival, and various technological approaches have been developed to optimize this process. Among them, artificial intelligence (AI) and machine learning techniques have shown great promise in predicting future emergency demand based on historical data. Machine learning algorithms can analyze spatial and temporal patterns of emergency incidents and contribute to the optimization of ambulance allocation and redeployment. For instance, AI-based predictive models are capable of forecasting high-risk zones and proactively positioning ambulances to reduce response times. These models consider multiple external factors, such as traffic congestion, weather fluctuations, and incident trends, thereby improving the accuracy of demand forecasts. The ability to generate precise predictions through machine learning serves as a foundational component for efficient ambulance deployment. It enables the anticipation of demand fluctuations, minimizes idle resource allocation, and enhances the overall responsiveness of EMS systems.
Recent studies have actively explored the use of machine learning to improve prediction accuracy and optimize ambulance deployment. For example, machine learning algorithms have been applied to forecast ambulance demand across different regions and times of day, enabling the strategic placement of ambulances to reduce response times [23]. These predictive models incorporate real-time variables, such as traffic flow and weather conditions, thereby enhancing the operational efficiency of ambulance services. In parallel, systems that integrate real-time traffic and environmental data have been developed to dynamically optimize ambulance routing. Traffic conditions, particularly in urban areas, can have a profound impact on ambulance travel times. Real-time traffic information systems assist ambulances in selecting the fastest available routes and avoiding delays caused by congestion or accidents at intersections. Similarly, environmental factors such as road conditions and weather events, including slippery surfaces or flooding, can significantly affect vehicle movement. By continuously collecting and analyzing environmental and traffic data, these systems support dynamic route adjustments, thereby improving response times and enhancing patient survival outcomes [24]. Moreover, Internet of Things (IoT)–based systems have emerged as a key technology for improving ambulance management and maintenance. Sensors installed in ambulances monitor vehicle location, fuel levels, engine status, and the operational state of onboard medical equipment, transmitting data in real time to central management systems. This continuous monitoring allows for immediate corrective action when anomalies are detected and ensures that ambulances remain fully operational. Additionally, IoT systems can further optimize route guidance by incorporating real-time traffic and environmental information during ambulance transit [25]. The introduction of telemedicine technologies has also opened new possibilities for providing real-time medical support to patients inside ambulances. Through remote connectivity, healthcare professionals can monitor patient conditions, deliver instructions to paramedics, and initiate prehospital interventions, thereby improving the continuum of care from the field to the hospital.
Medical devices installed in ambulances are now capable of transmitting patients’ physiological data in real time to receiving hospitals, enabling immediate clinical decision-making. For example, in the case of cardiac arrest, hospitals can remotely guide paramedics in using defibrillators while cardiopulmonary resuscitation (CPR) is being performed inside the ambulance. Similarly, for stroke patients, portable brain imaging can be performed during transport, with the results transmitted to the receiving hospital to enable early preparation for treatment. Such telemedicine systems play a crucial role in stabilizing patients before they arrive at the hospital and significantly improve the continuity and speed of emergency care [26,27]. In addition to in-ambulance telemedicine, drone technology has emerged as a valuable tool for supporting emergency medical services in areas that are difficult to access by road. In mountainous regions or areas experiencing severe traffic congestion, ambulances may be unable to reach the scene promptly. Drones can be deployed to deliver essential medical supplies such as medications, defibrillators, and blood products directly to the site. Their rapid mobility and small size make drones particularly effective in bypassing physical obstacles and delivering critical resources ahead of ambulance arrival. Despite their promise, several technological challenges remain for the widespread adoption of drones in emergency services, including regulatory restrictions, flight safety concerns, and limitations in battery endurance. Active research is underway to address these barriers, and drone-assisted emergency medical delivery systems are expected to become an increasingly important component of prehospital care in the future [28].

3. Methodology

3.1. Experimental Settings

This study aims to derive an optimal ambulance deployment strategy for 119 emergency centers through artificial intelligence-based predictive modeling, adopting a quantitative empirical research design. The research framework consists of predictive modeling and simulation analysis using observation-based panel data, structured to enable multivariate analysis that comprehensively incorporates a variety of factors influencing ambulance allocation. The dataset integrates emergency dispatch records with a wide range of contextual information to reflect both static and dynamic variables relevant to deployment decisions.
As summarized in Table 1, data were collected over a 9-month period, from January to September 2024, covering all 229 emergency centers nationwide. This yielded a total of 2061 center-month observations (229 centers × 9 months), forming a panel data structure that captures both temporal and cross-sectional variations. Such a structure enhances the generalizability of the model and enables control for regional heterogeneity. The dataset includes variables such as ambulance dispatch frequency, patient transport times, patient severity levels, center-level operational statistics, population density, traffic congestion, hospital locations and capacities, and road infrastructure conditions. These data were compiled from administrative records of the National Fire Agency, Statistics Korea, the Ministry of Health and Welfare, and national traffic information systems.
To address discrepancies in data formats across multiple sources, the collected datasets underwent a comprehensive integration and standardization process. Reverse geocoding was applied using a normalized address system aligned with administrative district boundaries. Following the integration of all sources, preprocessing procedures were conducted to manage outliers and missing values. Data consistency and structural validity were further verified through spatial comparative analysis at the city and county (Si/Gun/Gu) level. Throughout the dataset construction process, administrative district codes were employed as the primary mapping key to reduce mismatches and minimize data loss across heterogeneous regional datasets.
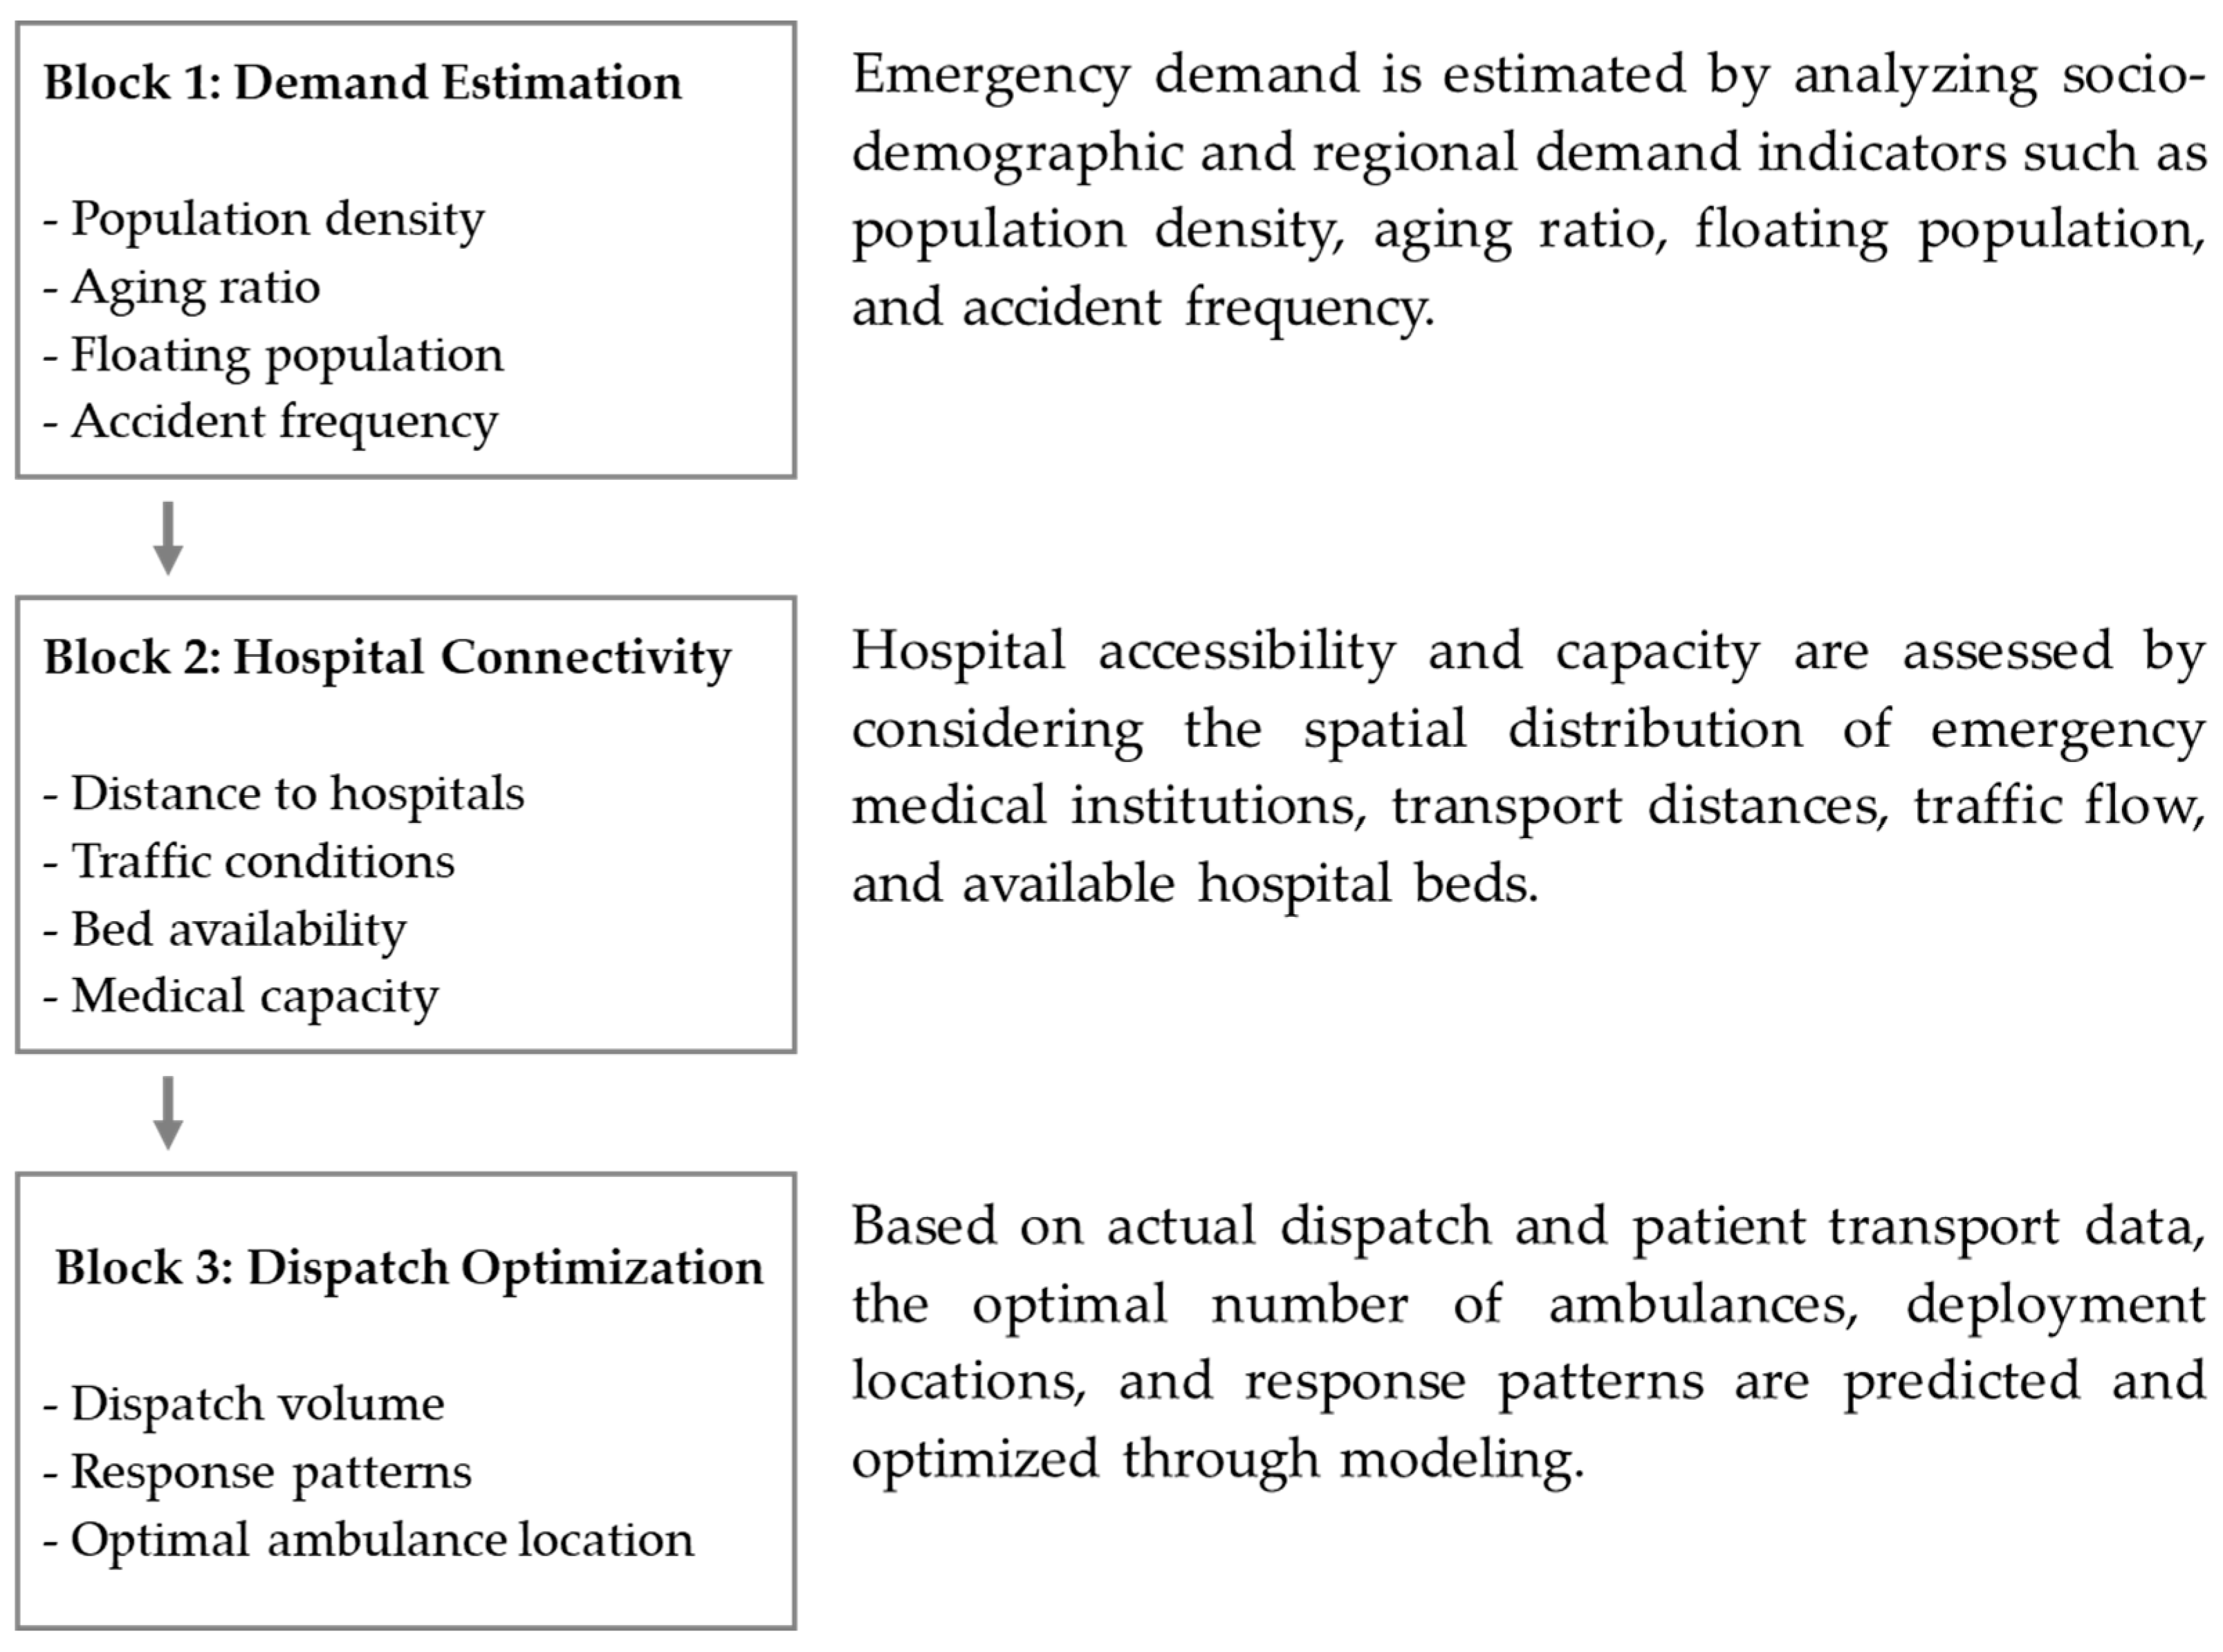
The model development framework was structured around three major analytical pillars (Figure 2). First, a demand estimation phase was implemented to quantitatively predict regional emergency demand based on sociodemographic variables and location-specific factors, including population density, aging rates, floating population size, and accident occurrence rates. Second, an accessibility-based hospital connectivity analysis was conducted, evaluating the practical accessibility to emergency medical institutions by considering geographic distribution, patient transport distances, traffic flow conditions, and hospital bed capacities. Third, a dispatch and deployment optimization phase was developed to predict ambulance demand for each emergency center and to optimize the allocation of ambulances and dispatch patterns within their jurisdictions, based on historical dispatch records and patient transport data.
Each analytical block was designed as an independent module while maintaining interoperability to allow for integrated simulation-based cross-validation. Since factors influencing ambulance deployment arise from multiple domains—including demographic characteristics, socio-environmental conditions, hospital accessibility, traffic dynamics, and patient severity—variables were organized using a multidimensional taxonomy. This structure enhanced model interpretability and minimized multicollinearity during the machine learning-based variable weighting process. Key features were selected through a combination of expert Delphi surveys and Lasso regression–based importance estimation. By adopting this architecture, this study advances beyond simple statistical analysis to develop a predictive model grounded in real-world structured data that captures the heterogeneity of regional ambulance demand and the complexity of operational environments. Incorporating spatial and temporal data diversity further improves the scalability of the model and its applicability to practical policy design and implementation.

3.2. Variable Design and Data Preprocessing

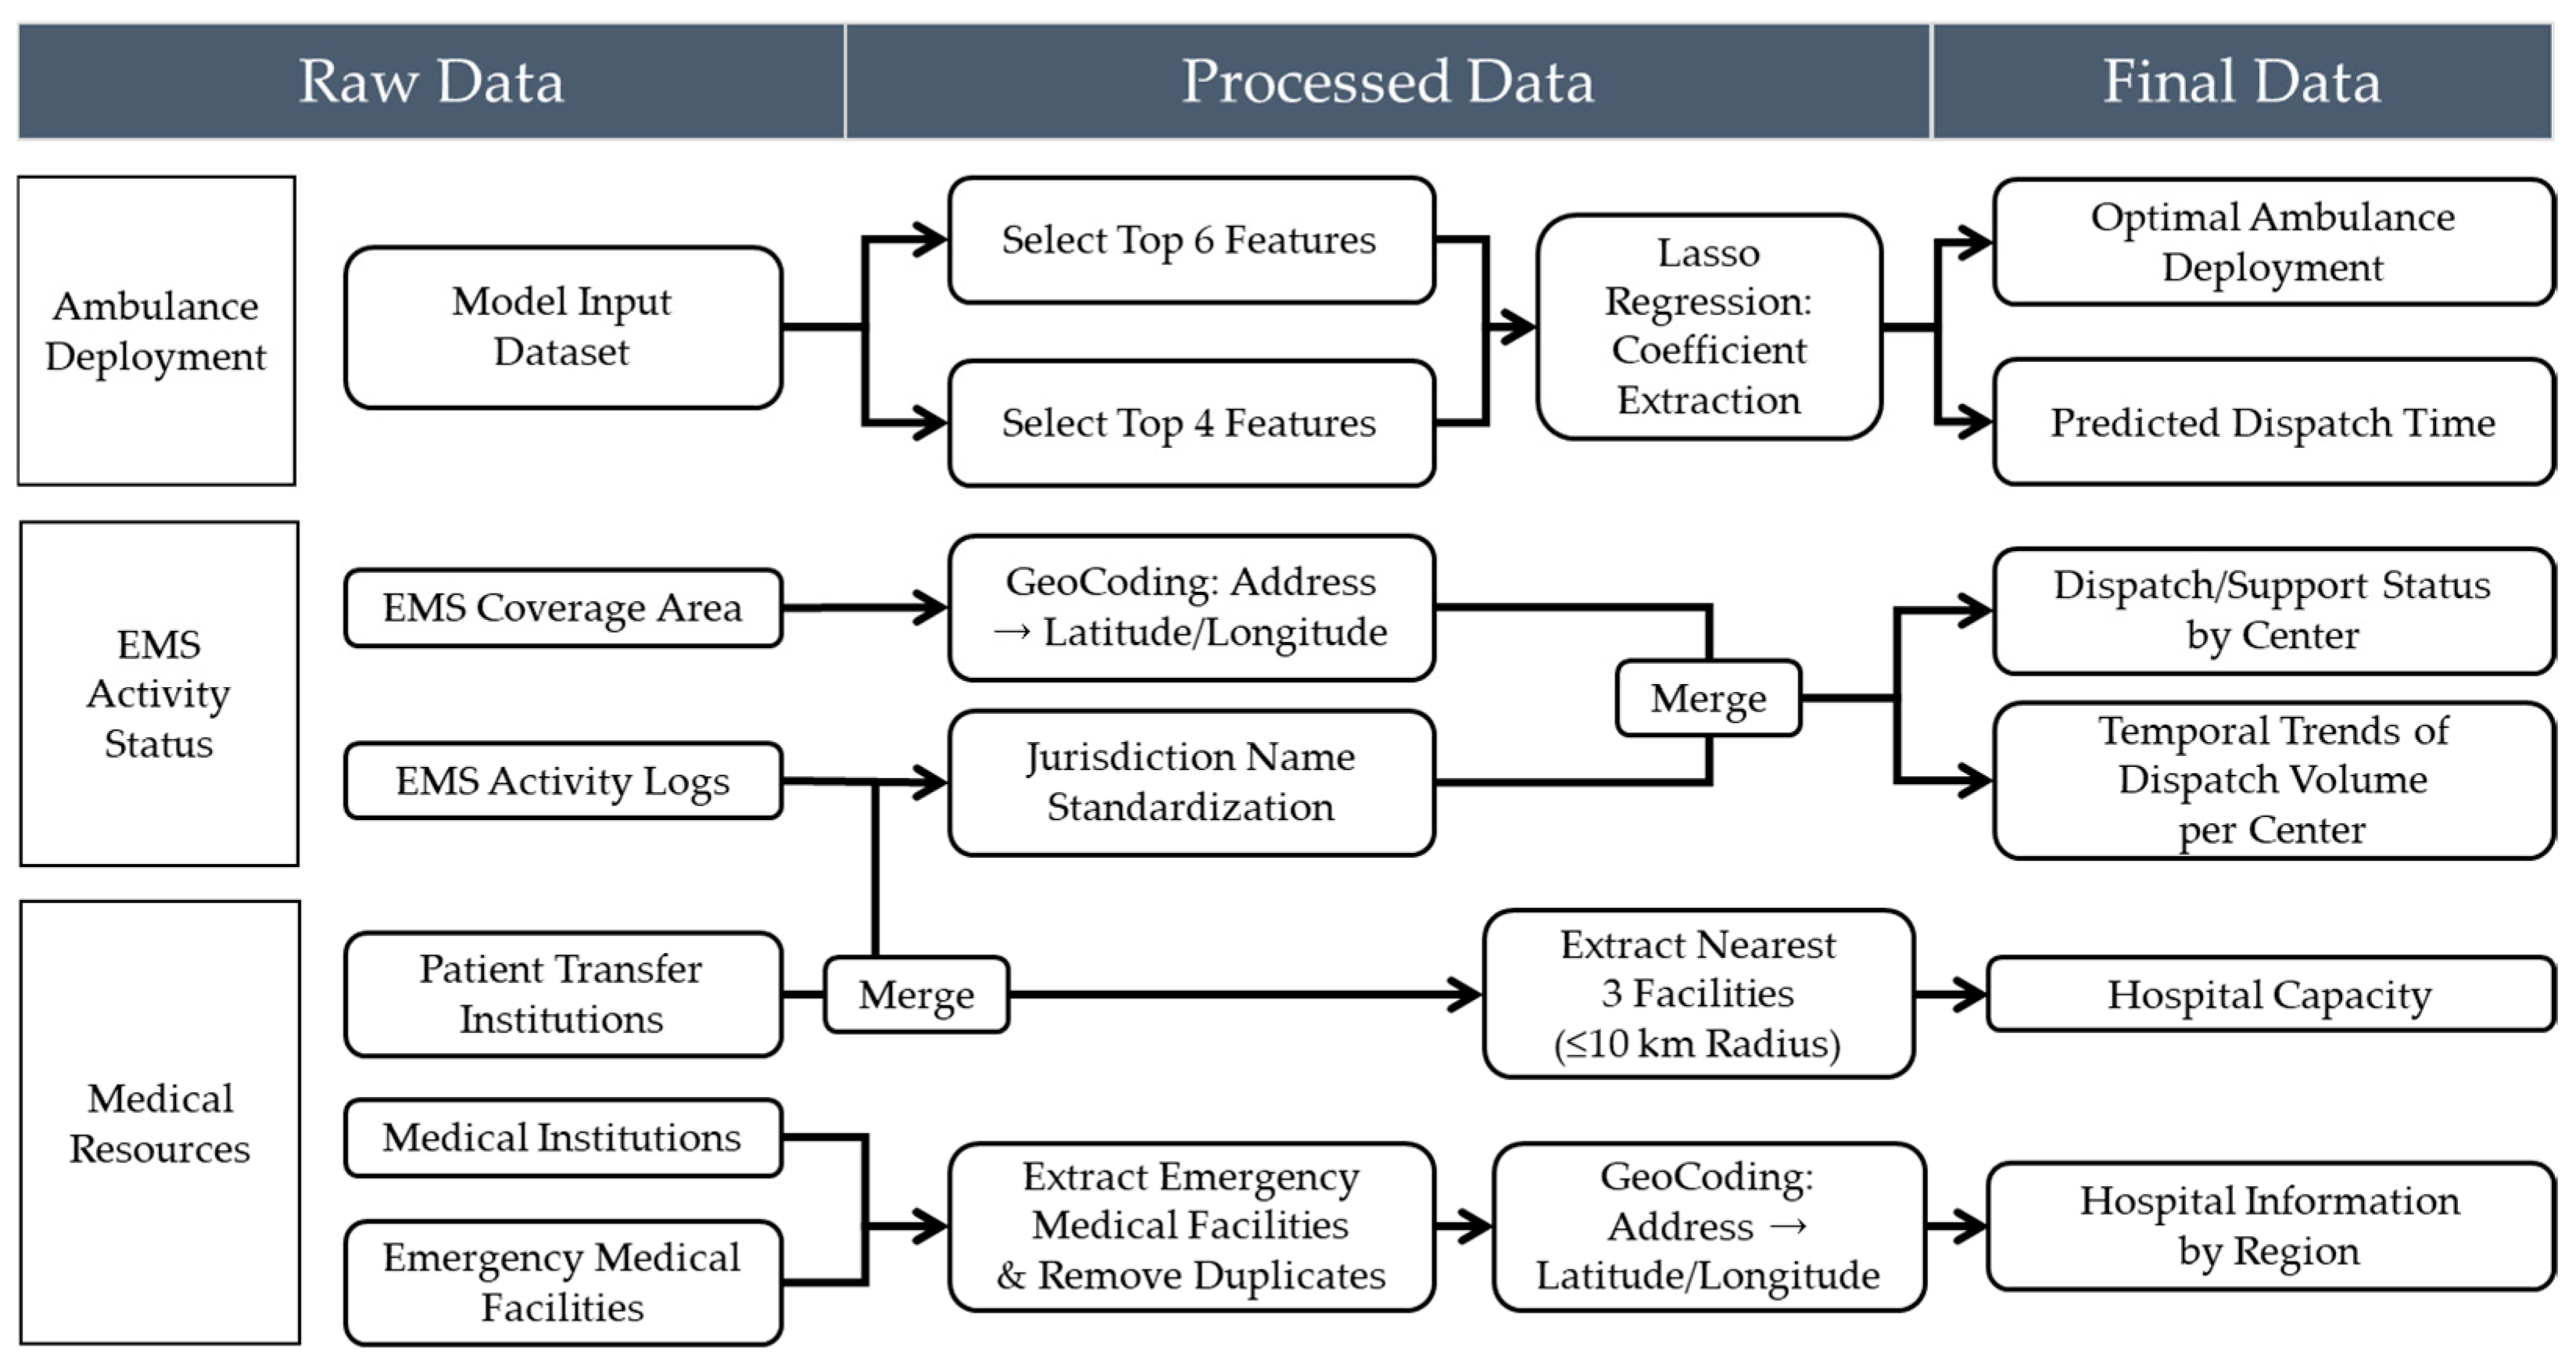
This study aims to construct a highly reliable predictive model by implementing a rigorous data preprocessing and validation framework to ensure data consistency and integrity. Rather than merely eliminating basic errors, the validation process is treated as a core component throughout the analytical workflow, serving to ensure both the statistical reliability and logical validity of the variables. These efforts directly contribute to the model’s robustness and generalizability. Specific preprocessing steps included identifying and handling missing and outlier values, removing duplicate records, resolving merge conflicts between datasets, standardizing variable formats, and ensuring spatial coherence. All procedures were designed in consultation with the National Fire Agency and regional emergency management agencies to support policy-relevant interpretations. To optimize the predictive performance of the ambulance deployment model while ensuring policy applicability, two distinct datasets were constructed based on the analytical objective. The first dataset was used for training the machine learning models, while the second was designed to support visualization and spatial policy analysis. Both datasets were developed through a systematic pipeline involving raw data collection, preprocessing, variable transformation, and final integration. The overall data processing workflow is illustrated in Figure 3.
The training dataset was constructed based on operational and demographic data from 229 emergency response centers across South Korea. The collected raw data included ambulance dispatch records, monthly dispatch counts, patient transport times, total and elderly population ratios, daily floating population figures, road traffic volume, and congestion indices, as well as environmental indicators such as alcohol consumption rates and food establishment density. Variable selection was guided by both theoretical relevance—derived from prior studies—and empirical validity, confirmed through expert consultations. To further validate the practical impact of each variable, we incorporated results from a field survey administered to 311 frontline emergency medical personnel affiliated with the National Fire Agency. In response to the question, “Which factor most significantly affects your on-site workload?”, 87.0% of respondents identified the number of dispatches as the primary determinant. Additional influential factors included “distance or time to the hospital” (5.1%), “availability of medical resources” (3.3%), and “proportion of high-acuity emergency cases” (2.2%). These findings are highly consistent with the variable importance rankings derived from the model, supporting the construct validity of the selected features. Furthermore, frequent inter-jurisdictional ambulance deployments were observed, with certain centers reporting over 100 outbound emergency responses per month. This suggests that structural resource shortages are occurring in specific areas. An analysis of hourly traffic volumes on major roads in 2023 (Figure 4) also revealed recurrent congestion patterns during morning and evening peak periods, highlighting traffic delays as a critical factor contributing to prolonged emergency response times.
There was also considerable variation in the frequency of high-acuity emergency dispatches across centers, with some facilities recording over 60 such cases per month. This finding highlights the potential value of implementing severity-based deployment strategies. These statistics align not only with the observed operational data but also with the field experiences reported by emergency personnel, thereby reinforcing the construct validity of the selected variables and the practical relevance of the training dataset. To ensure data quality and integrity, we collaborated with the National Fire Agency to identify and remove outliers and missing values based on domain expert assessments. Where appropriate, statistical imputation techniques were applied to correct for missing data. In addition, reverse geocoding procedures were performed to convert geographic coordinates (latitude and longitude) into standardized administrative district codes and addresses. This process ensured spatial alignment across datasets from heterogeneous sources, thereby enhancing the consistency and reliability of the integrated dataset.
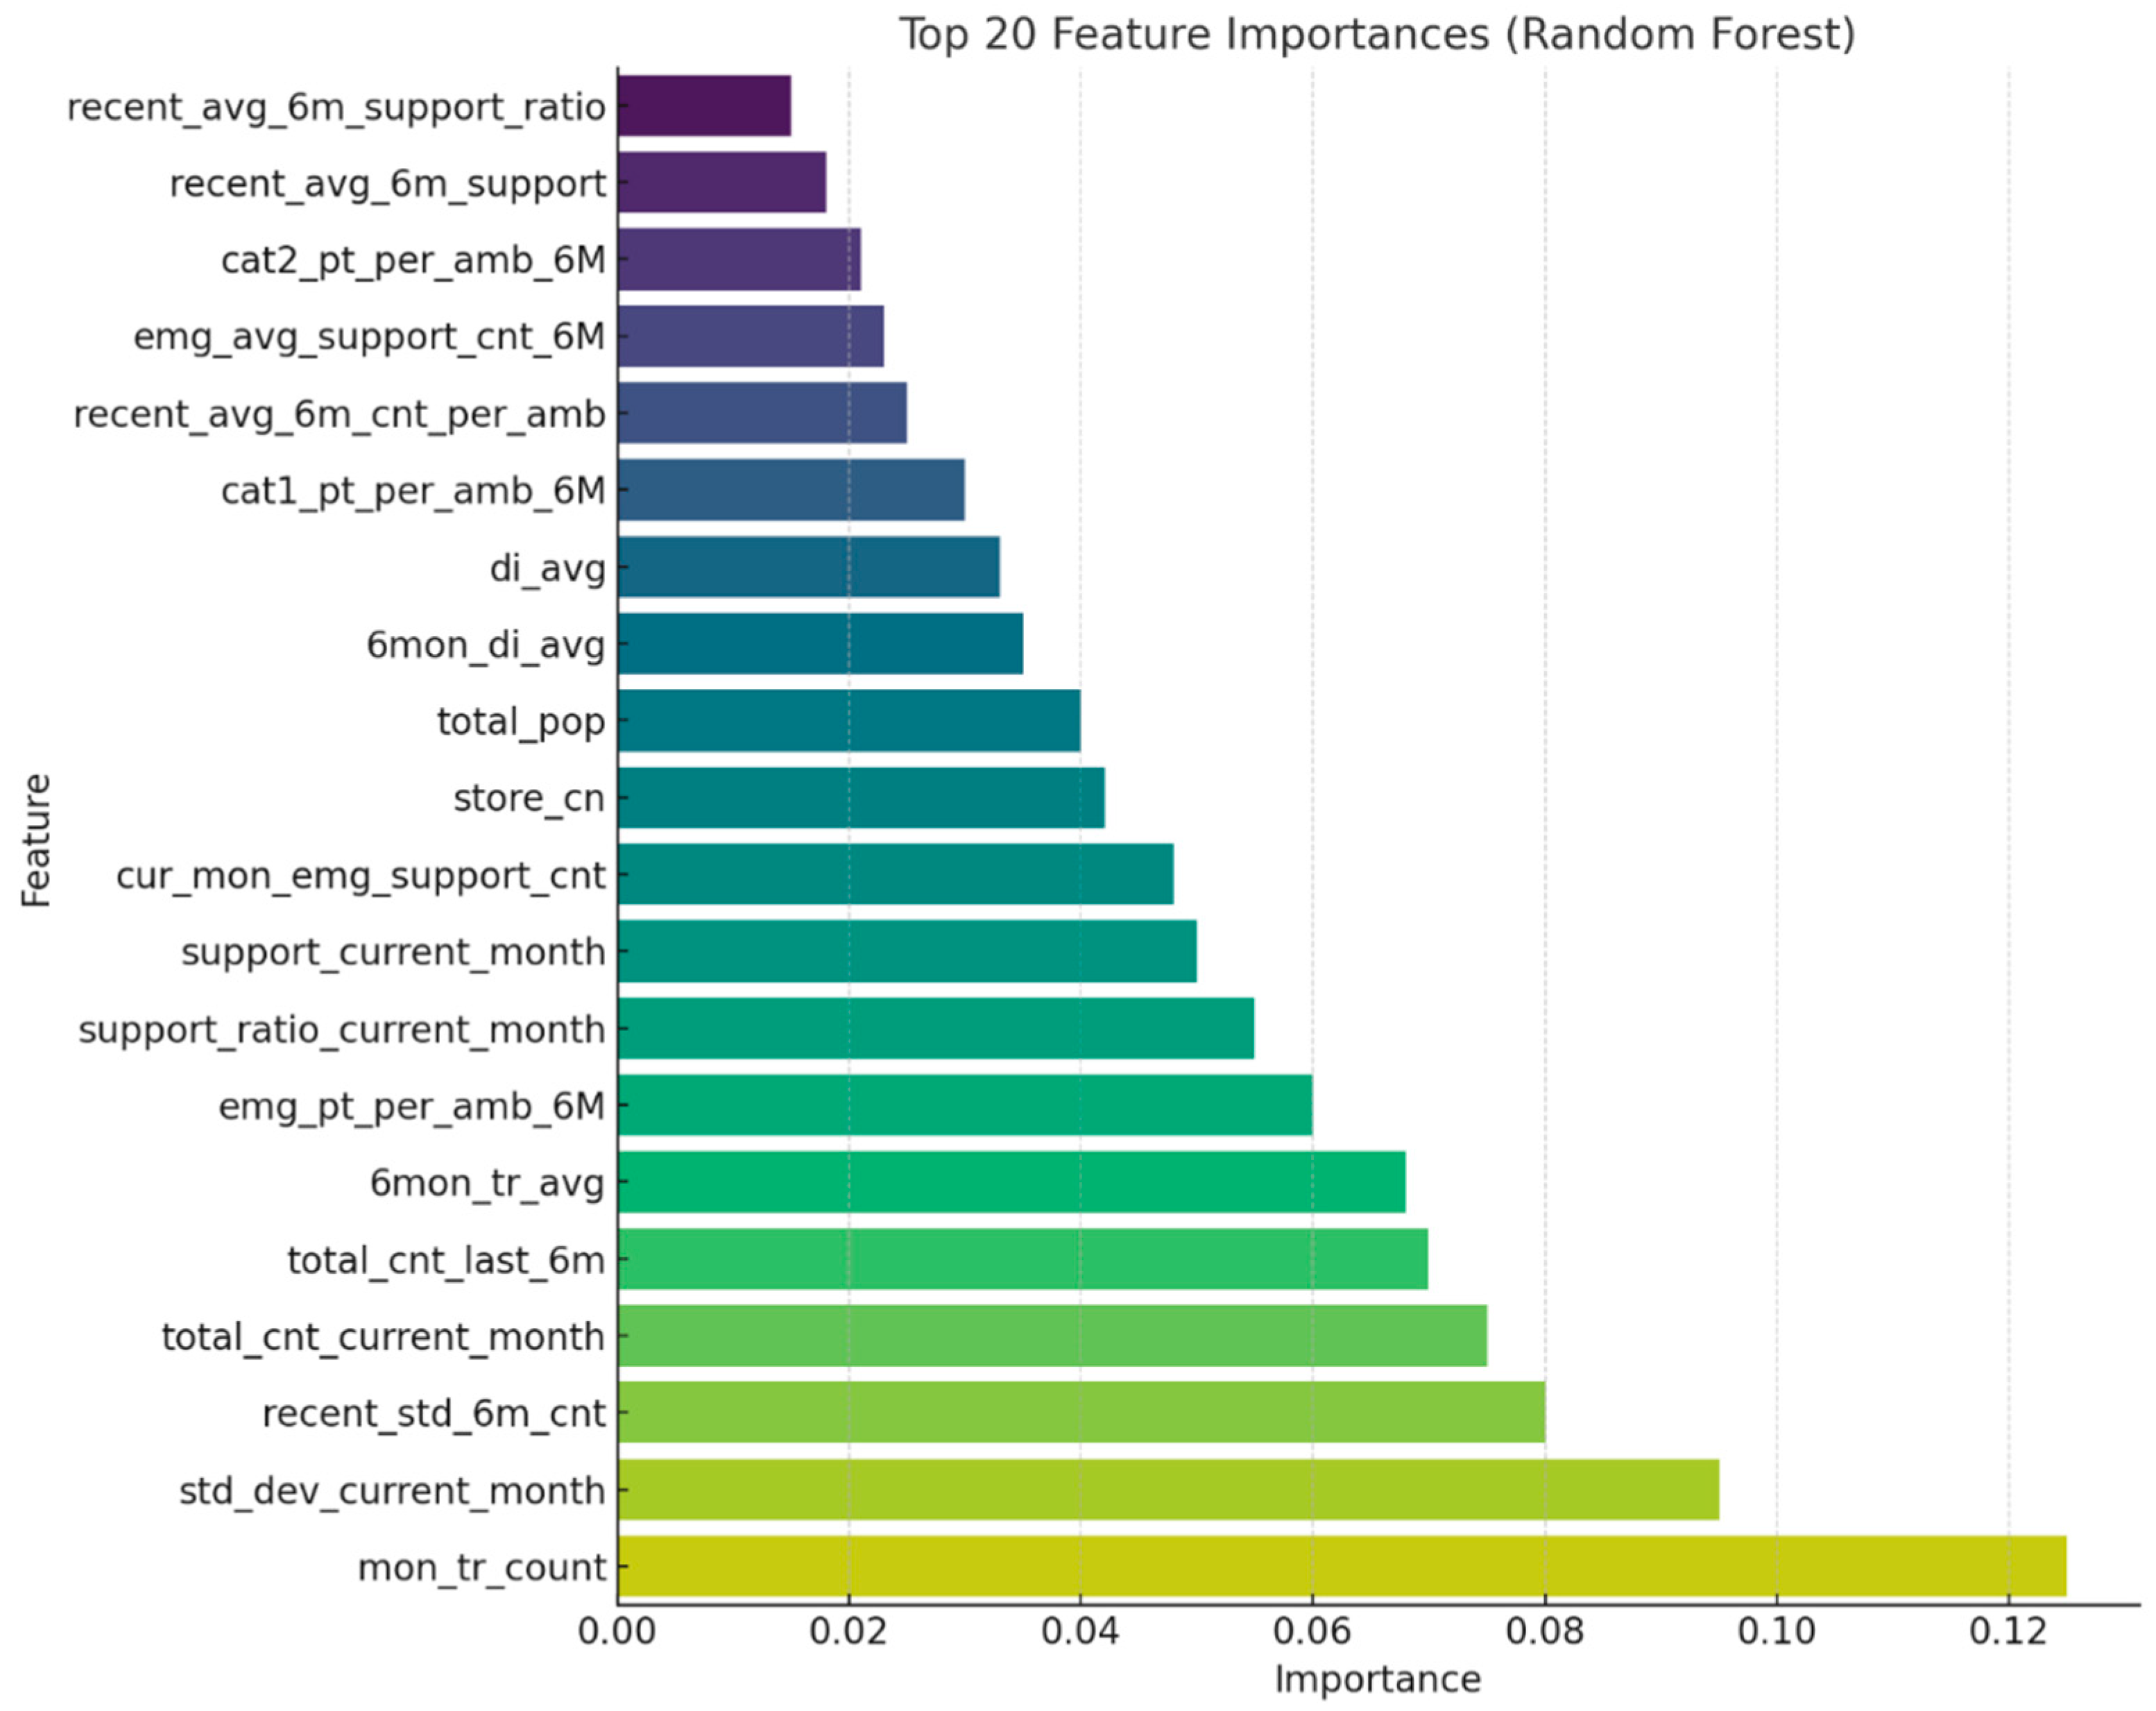
Numerical input variables used in the model were scaled using either min–max normalization or z-score standardization, depending on distribution characteristics. Categorical variables (e.g., urban vs. rural classification, hospital types) were converted into numeric form using one-hot encoding. An initial set of approximately 20 candidate variables was considered. To mitigate overfitting and multicollinearity, Lasso regression was applied, resulting in the selection of six key predictors with high explanatory power. These selected variables were subsequently used for training tree-based machine learning models, including Random Forest, XGBoost, and LightGBM. Considering the heterogeneous and dynamic nature of EMS data, characterized by spatial variability in population distribution, temporal fluctuations in emergency dispatch frequency, and complex nonlinear interactions among multiple explanatory variables, this study employed ensemble-based tree models including Random Forest, XGBoost, and LightGBM. These models are particularly well suited for high-dimensional structured data with intricate relationships, as they offer robustness against multicollinearity, capture nonlinear patterns without the need for extensive feature transformation, and provide interpretable metrics such as variable importance for policy-relevant insights [29]. In parallel, a supplementary dataset was constructed to support visualization of prediction results and policy-oriented interpretation. This dataset incorporated spatial information on hospital capacity, emergency medical facility distribution, and regional accessibility. It was designed to help policymakers intuitively assess local resource allocation needs.
The jurisdiction of each 119 emergency center was standardized under a unified naming convention, and hospital information within a 10-kilometer radius of each center was collected. This process included the deduplication of medical facilities and geocoding of hospital locations. Additional filtering criteria—such as number of available beds, operating hours, and emergency service capability—were applied to refine the hospital dataset. Measures of distance and accessibility between centers and hospitals were then computed and merged into the final dataset. Using the results from the feature importance analysis, the top-ranked variables were employed to generate spatial weight maps and predicted response times, visualized at the administrative district level. This dual-dataset structure supports both predictive modeling and policy simulation on an empirical basis, moving beyond conventional experience-based decision-making toward data-driven ambulance deployment strategies.
Missing values were addressed through tailored strategies based on the characteristics and distribution patterns of each variable. When the missingness was determined to be completely at random or statistically predictable, appropriate imputation techniques such as mean substitution, median replacement, or linear interpolation were applied. For critical variables where missing values were logically implausible, the corresponding records were excluded entirely to ensure data integrity. In cases where missing data occurred for specific centers or time periods, the cause was investigated in collaboration with the Gyeonggi Fire and Disaster Headquarters, as such gaps were often due to administrative reporting delays or system transitions. The treatment methods were then adjusted accordingly, depending on the identified cause. Outlier detection followed both statistical and logical criteria. Statistically, values were considered outliers if they exceeded 3 standard deviations from the mean or fell outside 1.5 times the interquartile range. Logically implausible values, such as dispatch durations longer than 10 h or response times exceeding 1 h, were also excluded on the basis of operational infeasibility. The overall removal of outliers was kept below two percent of the dataset, in order to preserve the stability of model training and avoid distortion in inter-variable relationships. For extreme values that could plausibly occur during exceptional events such as large-scale disasters, removal decisions were made only after further review with the National Fire Agency. To ensure compliance with international and national data protection regulations, including the General Data Protection Regulation (GDPR) and the Health Insurance Portability and Accountability Act (HIPAA), rigorous data anonymization and de-identification procedures were applied prior to model training. All personally identifiable information (PII) and protected health information (PHI) were removed or transformed through a multi-step process in accordance with the guidelines provided by relevant authorities. Specifically, the dataset underwent structured de-identification using suppression, generalization, and pseudonymization techniques. Geolocation data were truncated to administrative units (e.g., district-level codes) to prevent re-identification of individuals or specific sites. Temporal data, such as timestamps of emergency incidents, were generalized to daily granularity to mitigate temporal linkage risks. In addition, all unique identifiers (e.g., patient IDs, call numbers) were replaced with random hashes and were not recoverable.
Duplicate values were identified not only based on exact record matches but also by accounting for partially blank fields and inconsistent formatting. In addition to identifying record-level duplicates, logical redundancies—such as repeated registration of the same hospital within a single jurisdiction—were carefully reviewed during the data integration process. Common issues such as mismatched key fields, typographical errors in location names, and inconsistencies in temporal granularity were resolved through the normalization of administrative district codes and the unification of jurisdictional naming conventions. For instance, geographic names such as “Jeongja-dong, Jangan-gu, Suwon-si, Gyeonggi-do” were sometimes confused with “Jeongja-dong” in Seongnam-si due to naming overlap. These cases were standardized using the Vworld administrative code system to ensure consistent merge keys across datasets. During the merging of each center’s jurisdictional boundaries with population data from Statistics Korea, several records were found to be missing. Further investigation revealed that these omissions were primarily due to historical changes in administrative boundaries and naming conventions. To address this issue, the temporal reference points for data aggregation were adjusted and historical administrative codes were matched to restore the missing data. After merging, any remaining logical duplicates were removed using key-based filtering, and an additional validation procedure was performed to ensure integrity. Following these refinement procedures, data formatting consistency and unit harmonization across variables were carried out. For example, traffic flow data, originally reported as vehicles per hour, were aggregated and converted into daily averages for model compatibility. In addition, potential multicollinearity between variables with high correlation, such as alcohol consumption rates and the number of food establishments, was addressed using correlation-based filtering and Lasso regression for variable selection. Through this process, 6 key predictive features were extracted from over 20 candidate variables, and these served as the core inputs for both model training and simulation.
As a result of these data preprocessing efforts, the proportion of missing values was maintained below 5 percent, the rate of outliers was kept under 2 percent, and no unresolved merge or mapping errors remained in the final dataset. This indicates that the data used in this study met rigorous statistical quality standards and were well-suited for both practical applications and policy-oriented analyses. Furthermore, this preprocessing approach contributed not only to improving the generalizability of the prediction model but also to enhancing the interpretability of its outputs. It ultimately supports evidence-based decision-making for future ambulance deployment planning.
As illustrated in Figure 5, a dedicated visualization dataset was developed to enhance the interpretability of model outputs and support spatially informed policy decisions. The dataset was structured based on EMS service jurisdictions and incorporated key spatial features, such as the three nearest emergency medical institutions within a 10 km radius, regional population distributions, and the density of critical public facilities. To ensure consistency and accurate spatial matching, address information was converted into geographic coordinates via geocoding and reverse geocoding, then standardized using administrative district codes. Hospital-level data were collected from the Ministry of Health and Welfare’s national emergency facility registry and regional health information systems. Information on capacity indicators—such as bed availability, operating hours, and emergency care capabilities—was refined into structured variables. Accessibility between EMS centers and hospitals was assessed through both distance-based metrics and transportation infrastructure indicators, including average driving speed and congestion levels on major roads. The processed dataset enabled the generation of visual tools such as weighted resource allocation maps, hospital-to-center connectivity networks, and district-level response time heat maps. Variables identified as highly important by the prediction model were prioritized for visualization, serving as foundational elements for developing a policy dashboard. This system offers decision-makers an intuitive understanding of spatial disparities in EMS coverage and supports evidence-based adjustments in ambulance distribution and infrastructure planning.

3.3. Development of Predictive Models for Emergency Resource Allocation

The development of the proposed model was designed to optimize the nationwide deployment of 119 emergency ambulances in Korea, with an emphasis on achieving both high predictive accuracy based on empirical data and practical applicability for policy implementation. A supervised regression modeling framework was employed, integrating EMS dispatch records with variables such as population demographics, traffic metrics, and medical infrastructure to construct the learning dataset. The training dataset included preprocessed input variables such as the proportion of critical patients, the total and elderly population within each jurisdiction, the ratio of dispatches to available ambulances, traffic indices for general and express roads, average transfer time, alcohol consumption rate, and the density of food establishments. To enhance model efficiency, Lasso regression was applied to identify optimal variable combinations, mitigate multicollinearity, and extract sparsity-weighted coefficients for feature selection. Three tree-based ensemble regression models—Random Forest, XGBoost, and LightGBM—were implemented and comparatively evaluated. Random Forest offers strong resistance to overfitting, maintains high interpretability, and is relatively easy to implement. XGBoost provides superior generalization performance through L1 and L2 regularization and leverages sequential learning via gradient boosting, yielding high predictive accuracy. LightGBM, while structurally similar to XGBoost, is better suited for large-scale applications due to its high computational efficiency and ability to handle high-dimensional data using parallel processing, making it advantageous for real-time operational deployment.
From a mathematical perspective, the core algorithms used in this study are based on distinct learning principles. Random Forest is an ensemble method that aggregates the output of multiple decision trees trained on bootstrapped samples. Its predictive output is expressed as
y ^ = 1 T t = 1 T f t ( x )
where f t ( x ) represents the prediction from each individual decision tree, and T denotes the total number of trees in the ensemble [30].
XGBoost, an advanced implementation of gradient boosting, optimizes a regularized objective function defined as follows:
L ϕ = i = 1 n l ( y i , y ^ i ) + k = 1 K Ω f k
Ω f = γ T + 1 2 λ w 2
This formulation enables robust regularization and efficient convergence through second-order gradient approximation, which is a key advantage of XGBoost over traditional boosting methods [31].
Lasso regression employs L1-penalization to enforce sparsity in feature selection. Its optimization objective is
m i n β 1 2 n i = 1 n ( y i x i T β ) 2 + λ j = 1 p β j
where λ controls the strength of the penalty term. This formulation promotes model sparsity by shrinking less informative coefficients toward zero, thereby facilitating feature selection [32].
Hyperparameters for each model were independently tuned to maximize learning stability and minimize overfitting. Detailed parameter configurations for each model are provided in Section 4.1. For the Lasso regression, the regularization parameter alpha was set to 0.001, allowing for the extraction of sparse coefficients from the most relevant predictors while promoting model simplification.
Model training was conducted using Python 3.10, employing libraries such as Scikit-learn, LightGBM, and XGBoost. An 80:20 train–validation split was applied, followed by 5-fold cross-validation to assess both the average performance and variance across folds. The training and hyperparameter tuning were performed on a high-performance computing environment equipped with an Intel Xeon Gold 6248R 3.00 GHz CPU, 256 GB of RAM (Intel Corporation, Santa Clara, CA, USA), and an NVIDIA A100 GPU (40 GB) (NVIDIA Corporation, Santa Clara, CA, USA). While most operations were executed on the CPU, GPU acceleration was selectively utilized for large-scale matrix computations and hyperparameter optimization. This setup ensured sufficient computational capacity to handle spatiotemporally complex and high-volume datasets and to support the repeated training of ensemble-based models with high stability. Two separate target variables were modeled. The first was the optimal number of ambulances per EMS center, which serves as the foundation for demand-based resource allocation strategies. The second was the dispatch duration from scene to hospital, which is critical for evaluating emergency response performance in relation to geographic and traffic conditions. These outputs were subsequently used as core inputs in the simulation phase for generating region-specific weight factors and conducting scenario-based policy analyses.
The dependent variable for the first predictive model—namely, the optimal number of ambulances per EMS center—was defined based on empirical data from 100 EMS centers identified by the National Fire Agency as having achieved an appropriate level of deployment. This determination was made by comprehensively considering factors such as operational efficiency, responsiveness to local demand, population characteristics, dispatch frequency, response time, hospital accessibility, and environmental conditions. These centers were evaluated as benchmark cases where such variables were well-balanced and were therefore designated as a reference baseline within the training dataset. The selection criteria were established in consultation with policy officers and field-level administrators at the NFA to ensure both operational validity and policy relevance. Using this group of 100 reference centers, the model was trained to predict appropriate deployment levels for other regions by comparing their respective combinations of input features. This similarity-based approach enabled the model to account for structural and contextual heterogeneity across EMS centers and quantify relative deployment needs in a more nuanced and context-sensitive manner. This modeling approach thus departs from conventional methods that rely solely on historical dispatch volumes and offers a more rigorous and data-driven foundation for resource planning.
In conclusion, the modeling strategy adopted in this study integrates multiple strengths: objective feature selection using Lasso regression, structural diversity through ensemble tree-based algorithms, performance optimization via cross-validation and hyperparameter tuning, and practical applicability by balancing predictive accuracy and interpretability. This framework is designed not only to enhance short-term operational efficiency but also to serve as a robust quantitative foundation for long-term emergency medical service policy planning and infrastructure investment decisions.

3.4. Simulation-Based Weight Calibration

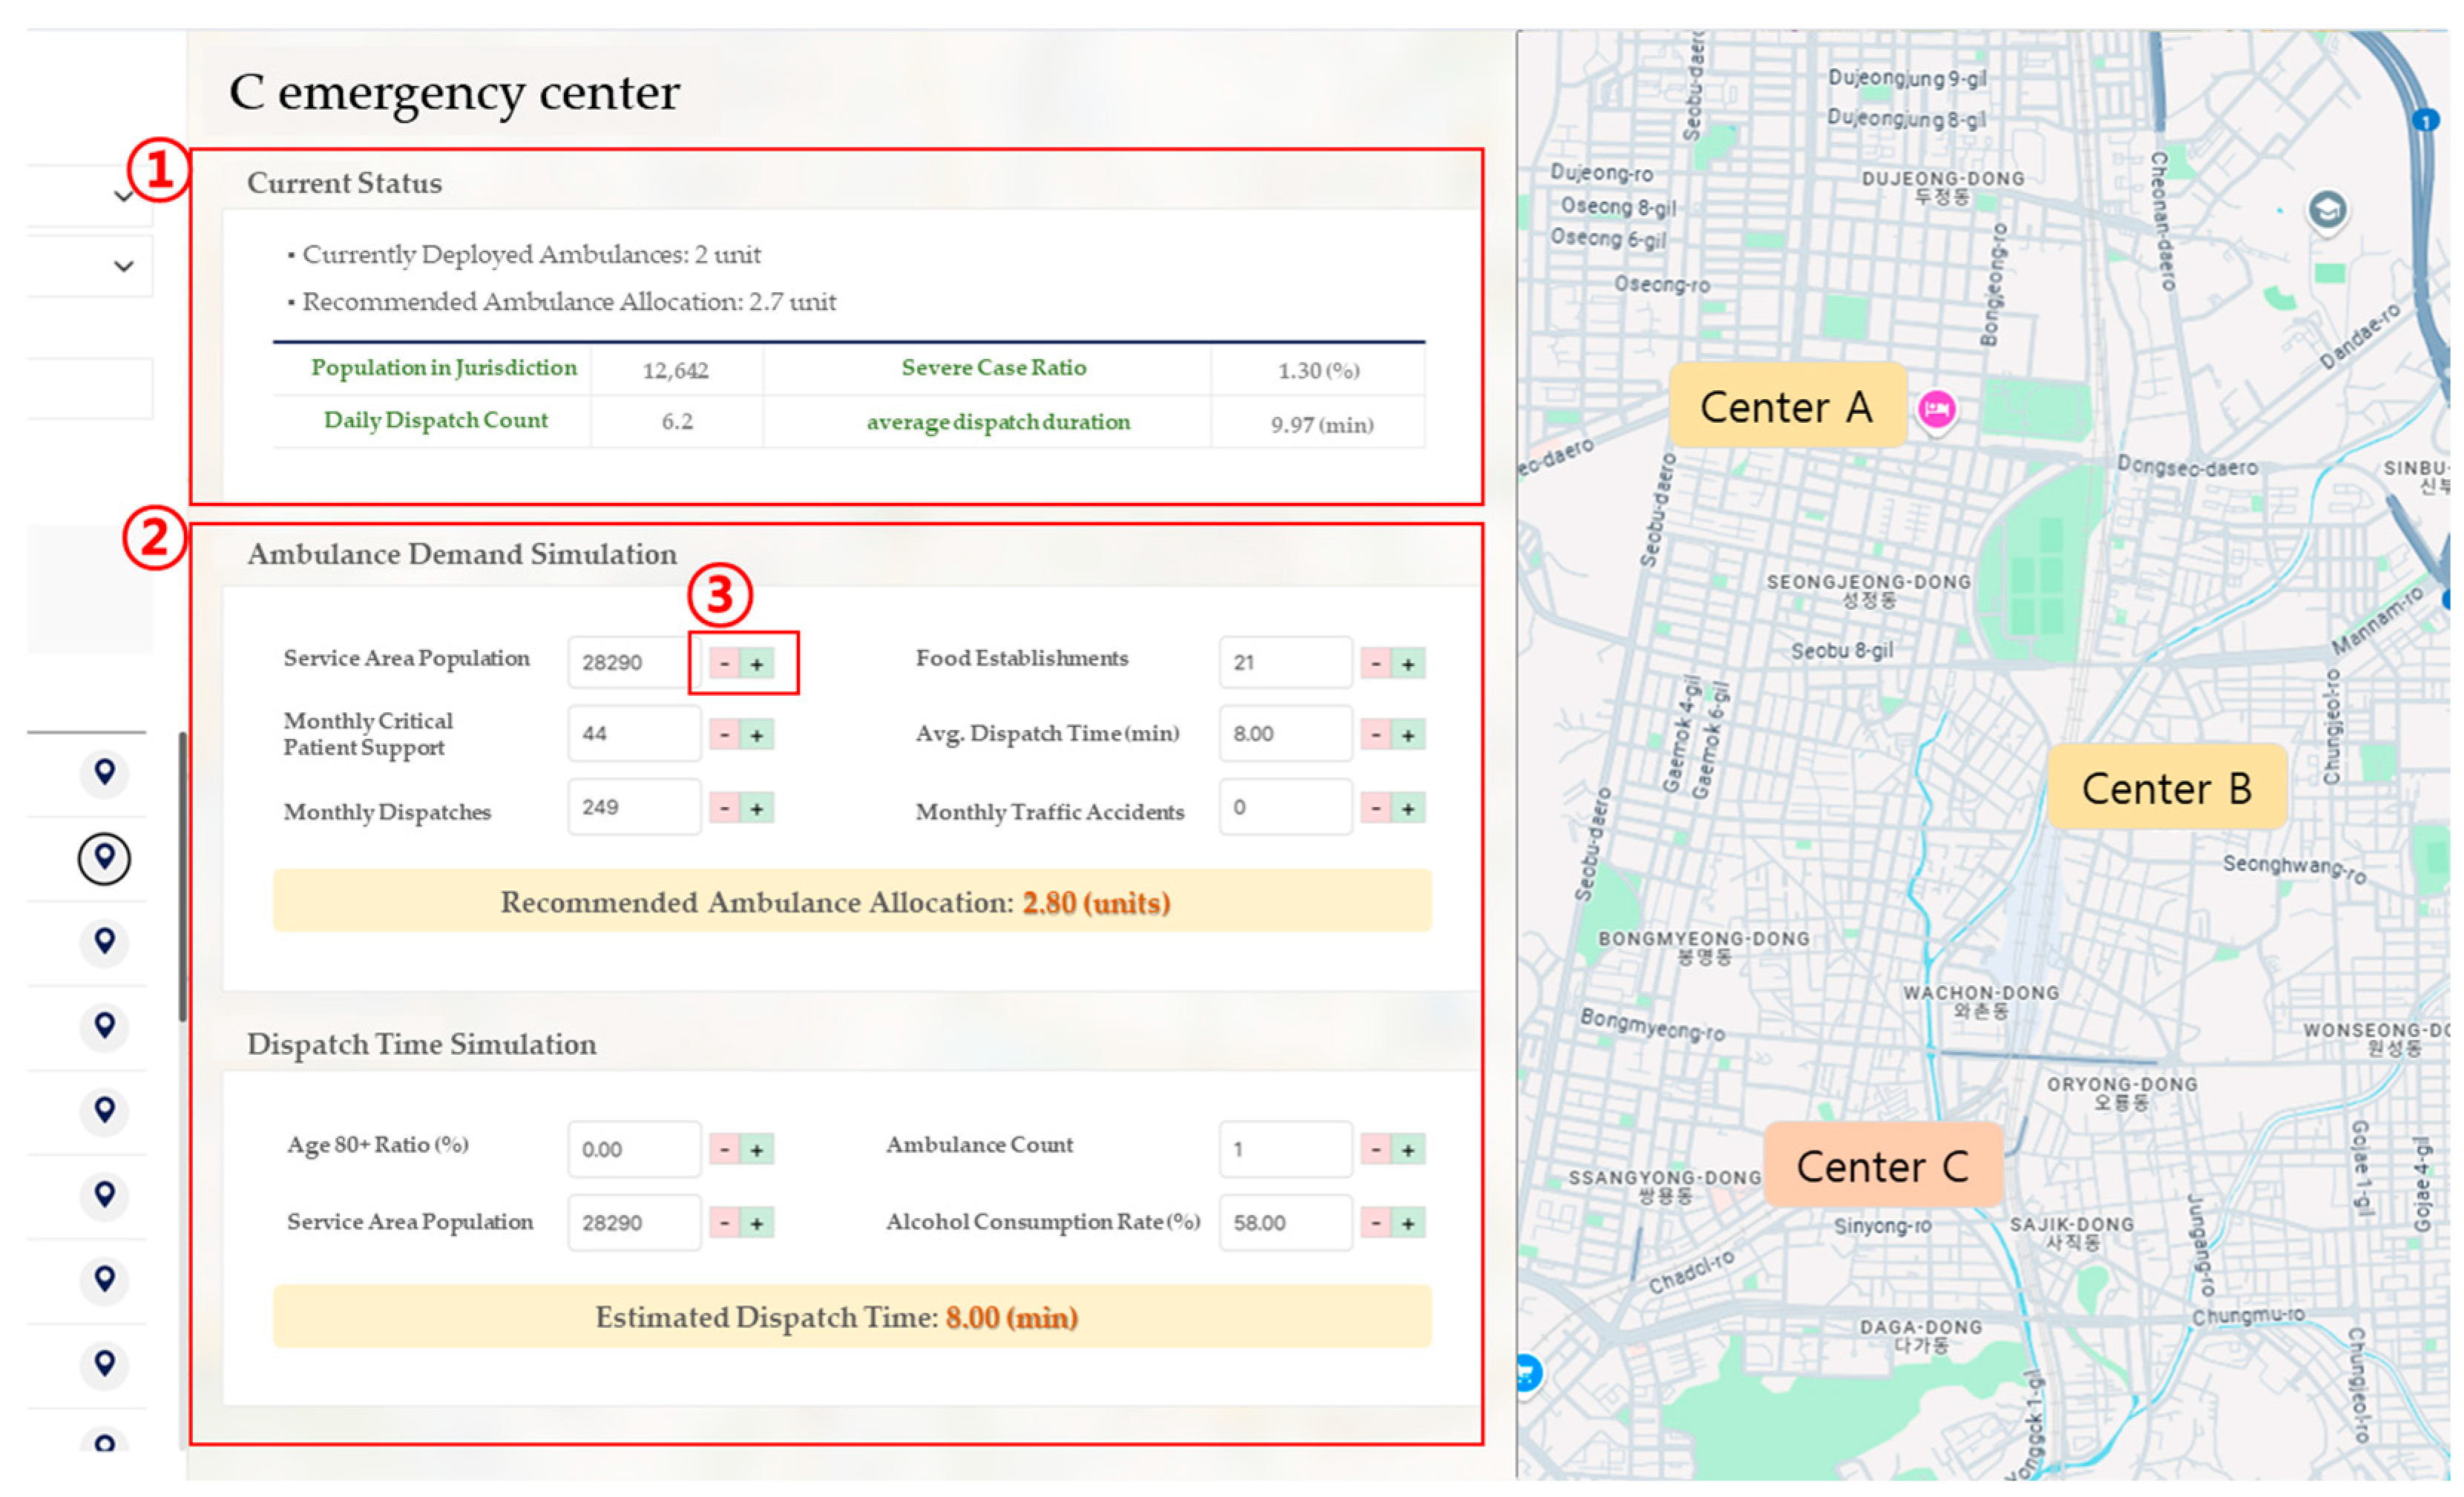
To facilitate the practical application of the machine learning model in real-world policy decision-making, a simulation-based weight calibration procedure was developed. This simulation system was designed with a dual focus on operational flexibility in the field and policy scalability. It allows users to dynamically adjust key input variables, after which the predictive results are automatically recalculated in real time. This design ensures that the model’s outputs function not merely as static forecasts but as adaptable tools for conducting sensitivity analyses and constructing policy scenarios. The simulation engine generates recommended ambulance deployment volumes or expected dispatch durations based on user-defined input variables at the EMS center level. These variables include population size within the jurisdiction, daily dispatch volume, number of inter-center critical patient transfers, average dispatch duration, number of local food establishments, and incidence of traffic accidents. Users can input values manually or adjust them via interactive controls. The simulation then compares these user-defined inputs with the model’s baseline values and recalculates the outcome by applying variable-specific weights that reflect each feature’s relative importance. The prediction mechanism is built upon a reference baseline, adjusting the predicted values by computing the weighted differences between user-provided inputs and their corresponding baseline values. This can be formally expressed as
y ^ = y r e f + i = 1 n w i · ( x i x i , r e f )
where y ^ is the adjusted prediction, y r e f is the baseline value, x i represents each user input variable, x i , r e f is the corresponding baseline input value, and w i is the weight assigned to the i t h variable based on its learned importance in the predictive model. For example, variables such as population size and the number of critically ill patients exert a strong influence on demand prediction and are therefore assigned relatively high weights. In contrast, indirect variables, such as the number of restaurants or local alcohol consumption rates, are given lower weights due to their weaker direct impact on emergency response needs. Rather than relying on a simple weighted average, the simulation model adopts a baseline-adjusted prediction mechanism based on the deviation of each input variable from its reference value. Each deviation is multiplied by a pre-defined weight, and the cumulative result is added to the baseline to produce the final output. This approach enhances both transparency and interpretability, allowing users to understand how changes in individual inputs affect the prediction. Moreover, the system is designed such that adjustments to input variables are immediately reflected in the visualized results, enabling intuitive exploration of scenario outcomes in real time. All simulation weights are calculated using a standardized reference framework across all EMS centers, ensuring consistency in comparative analyses. Based on these weights, the system can support policy scenario design, such as increasing or decreasing ambulance allocations, reassigning hospital linkages, or reconfiguring regional deployment strategies. Simulation results can be visualized either as temporal scenarios or spatial distribution maps, offering decision-makers a user-friendly interface through which they can explore center-specific recommendations, structural risk levels in emergency response, and the capacity of nearby hospitals based on weighted rankings.
This simulation framework provides a systematic basis for identifying not only areas with high emergency response demand but also regions where structural delays in response time are prevalent. Unlike static prediction models, the simulation weights are designed to support cumulative trend-based computations, enabling linkage with time-series analyses, such as trends in dispatch volume and duration or regional increases in the proportion of severe cases. Furthermore, the simulation architecture allows for flexible adjustment of weights depending on policy scenarios. For instance, in scenarios targeting elderly concentrated regions, a higher weight can be assigned to the elderly population ratio. In contrast, for urban areas characterized by severe traffic congestion, greater importance may be placed on average dispatch duration. Through this design, the simulation functions not only as a predictive tool but also as a policy sensitivity analysis instrument that reflects variations in contextual conditions. The weight system is implemented to allow for real-time automatic updates and is integrated with the National Fire Agency’s centralized platform via an API, playing a key role in establishing a field-responsive policy framework. As a result, the system facilitates not only demand-driven strategic ambulance deployment but also dynamic resource reallocation in emergency scenarios. Ultimately, this simulation structure can be applied across multiple decision-making domains, including ambulance resource allocation, deployment standard refinement, and mid-to-long-term emergency response planning. The weight-based prediction outputs can be regularly reported or synchronized in real time with central platforms. This represents a significant advancement from static model-based policymaking toward a dynamic, input-responsive decision-support simulation paradigm.

4. Results

4.1. Model Performance Evaluation and Feature Importance Analysis

This study evaluates the predictive performance of three ensemble-based regression models for forecasting ambulance demand and dispatch time. The target variables are (1) the estimated number of ambulances required per emergency medical center and (2) the average dispatch duration from departure to hospital arrival. The dataset comprises 2061 monthly observations across 229 EMS centers, integrating operational metrics, population statistics, transportation indicators, and emergency response records. Three state-of-the-art machine learning models were tested: Random Forest (RF), eXtreme Gradient Boosting (XGBoost), and Light Gradient Boosting Machine (LightGBM). These tree-based algorithms were selected for their proven ability to capture complex nonlinear relationships and interactions among variables. As shown in Table 2, model training and validation were conducted using five-fold cross-validation, and performance was assessed using root mean square error (RMSE), mean absolute error (MAE), and the coefficient of determination (R2). Among the models, LightGBM achieved the lowest MSE (0.048) and RMSE (0.218), demonstrating superior overall prediction accuracy. This can be attributed to its use of leaf-wise tree growth, which enhances local precision in high-dimensional spaces [33]. However, XGBoost showed the lowest MAE (0.084) and MAPE (0.040), indicating robustness in minimizing absolute and relative prediction errors. The model’s advantage is likely due to its L1/L2 regularization, which effectively prevents overfitting and improves convergence stability through learning rate adjustment. These results suggest that while LightGBM excels in minimizing the total prediction error, XGBoost offers advantages in controlling individual-level deviations. Each model’s strengths provide valuable flexibility depending on whether the goal is precise aggregate forecasting or stable individual-level predictions.
Meanwhile, the Random Forest model exhibited consistently stable performance across all evaluation metrics, with particularly robust results for RMSLE (0.070), indicating reliable generalization even under log-transformed distributions. This robustness stems from the model’s ensemble structure based on bootstrap aggregation (bagging), which effectively reduces variance by averaging multiple decision trees, thereby enhancing prediction stability [34]. Moreover, the model’s relative ease of interpretation, particularly in feature importance estimation, aligns well with this study’s emphasis on policy applicability. In contrast, LightGBM exhibited a tendency to overemphasize the importance of variables that appear repeatedly across trees. This bias is especially pronounced for high-cardinality or categorical variables, potentially leading to distorted feature importance rankings [35]. Despite this, LightGBM demonstrated the highest overall predictive accuracy and computational efficiency among the tested models. Taken together, all three models demonstrated predictive performance suitable for practical deployment. However, each showed distinct strengths: LightGBM offered high precision and computational efficiency, XGBoost excelled in convergence speed and low mean error, and Random Forest provided strong interpretability and consistent generalization. Given that the objective of this study includes both real-time simulation and policy decision support, factors beyond raw accuracy—such as interpretability, resistance to overfitting, and reliability of feature importance output—were prioritized in model selection. Based on this comprehensive evaluation, Random Forest was adopted as the primary predictive engine for downstream simulation and decision-support tasks.
Feature importance analysis using the Random Forest model revealed that monthly dispatch volume (mon_tr_count) was the most influential predictor, followed by variables capturing short- and medium-term fluctuations in ambulance demand—such as standard deviation and cumulative counts over recent months (std_dev_current_month, recent_std_6m_cnt, total_cnt_current_month, total_cnt_last_6m). These features represent critical indicators of local workload and were confirmed to align with field survey responses from emergency personnel.
Figure 6 and Table 3 present the top 20 feature importance scores. Notably, temporal consistency and variability were strong predictors, emphasizing the importance of tracking dispatch trends and identifying sudden surges. The high importance of std_dev_current_month and recent_std_6m_cnt underscores the predictive power of volatility in EMS workloads. Variables related to support demands, population, and facility density (e.g., support_ratio_current_month, total_pop, store_cn) also contributed meaningfully, supporting both operational and policy-level interpretation. These findings suggest that temporal continuity and demand variability are key determinants in ambulance demand forecasting. They also underscore the necessity of tracking time-series demand fluctuations when formulating emergency resource deployment strategies. The frequent inclusion of recent-month average and standard deviation variables further confirms that detecting short-term surges and outliers significantly contributes to improving model performance.
As part of the simulation modeling process for predicting ambulance demand and dispatch time, we estimated quantitative variable weights using regression models optimized via gradient descent algorithms. Specifically, we applied and compared three representative techniques in the penalized regression family: gradient descent–based linear regression, Ridge regression (L2-regularized), and Lasso regression (L1-regularized). These models are well-suited for high-dimensional data, with Ridge reducing model variance by shrinking all the coefficients, and Lasso further enhancing interpretability by driving irrelevant coefficients to zero [36]. As shown in Table 4, among the models tested, Lasso regression achieved the best overall performance, with MSE = 0.168, RMSE = 0.410, MAE = 0.328, MAPE = 0.232, and RMSLE = 0.174. In contrast, linear and Ridge regressions yielded higher error metrics (MSE = 0.195 and 0.182, respectively), indicating their relative limitations in handling complex feature spaces. The superior performance of Lasso highlights its ability to suppress noisy predictors and focus on the most influential variables [37]. This makes it particularly effective for generating stable, interpretable coefficients that can be applied as scenario-specific weights in simulation-based ambulance deployment strategies.
Based on these findings, this study ultimately adopted the Lasso regression model as the preferred method for deriving variable weights. Two simulation frameworks were subsequently developed using the Lasso-derived coefficients. The first simulation model focuses on ambulance demand estimation. It employs six key predictors identified by Lasso regression: total population within the coverage area, the number of food establishments, the average monthly number of inter-center emergency transfers for critical patients, average dispatch duration, monthly dispatch volume, and the number of traffic accidents. These variables serve as independent inputs, while the target variable is the recommended number of ambulances to be deployed. This model enables the quantification of context-specific ambulance demand based on region-level conditions. The second simulation model is designed to estimate dispatch time, with a focus on evaluating regional response efficiency. Four explanatory variables were selected: proportion of residents aged 80 and older, number of ambulances assigned to the center, total population, and alcohol consumption rate. This model structure reflects localized factors that influence response time and can serve as a tool for assessing operational adequacy across different administrative regions. The adoption of a Lasso-based weighting scheme has proven effective in multiple dimensions: enhancing model interpretability, quantifying variable importance, and enabling user-driven scenario analysis within the simulation interface. These features position the proposed framework as a valuable decision-support tool for both short-term resource allocation and long-term strategic planning in emergency medical services.
These results underscore a key methodological advancement of this study by demonstrating that the integration of Lasso regression into the simulation framework improves predictive performance while generating sparse and interpretable coefficients tailored to the operational context of emergency medical services (EMS). Unlike traditional simulation models that often rely on expert heuristics or manually calibrated parameters, this data-driven approach derives variable weights through statistically grounded learning, thereby enhancing both reproducibility and empirical rigor. The Lasso-based weighting scheme supports transparent scenario-specific adjustments and maintains model stability in high-dimensional settings, contributing to the development of scalable and accountable decision-support tools for EMS resource planning.

4.2. Simulation Application and Visualization Results

To enhance the practical utility of the ambulance deployment prediction model developed in this study, a simulation-based visualization system was implemented. This system enables users to intuitively assess model outputs and explore various policy scenarios by adjusting key input variables. Rather than serving merely as a static prediction display, the tool is designed as a dynamic decision-support platform for policymakers and field-level emergency management personnel, supporting real-time strategic planning. The system comprises two main simulation modules. The first module estimates ambulance demand based on user-specified input values. These include the total population within the jurisdiction, the number of food establishments, the number of critical patient transfers received from other EMS centers, the average dispatch duration, the current month’s dispatch volume, and the number of traffic accidents. The system applies a regression formula derived from Lasso analysis to calculate the appropriate number of ambulances for deployment. Notably, the model was trained using data from 100 EMS centers identified by the National Fire Agency as exemplifying optimal deployment. These reference centers serve as a benchmark to ensure the reliability and practical relevance of the simulation results. The second module predicts expected dispatch duration, incorporating four primary input variables: proportion of residents aged 80 and older, number of ambulances assigned to the center, total population, and local alcohol consumption rate. This model captures region-specific characteristics that contribute to delays—such as aging populations and alcohol-related incidents—and facilitates realistic scenario analysis for resource allocation. By reflecting the nuanced operational challenges associated with local demographic and behavioral patterns, this simulation tool supports the formulation of more context-sensitive emergency response strategies.
The simulation system was implemented as a web-based interface, allowing users to select a specific region or EMS center and interactively adjust key input variables to obtain real-time predictions. As illustrated in Figure 7, Section ① provides an overview of current operational indicators, such as the jurisdiction’s total population, daily number of dispatches, proportion of high-acuity patients, and average on-scene arrival time. Section ② displays the outputs of both the ambulance demand simulation and the dispatch time prediction module. Users can modify simulation inputs corresponding to the six and four variables described in Section 4.1, using either the plus/minus buttons or direct numeric entry in Section ③. Adjustments are immediately reflected in the simulation outputs.
Predicted values are presented not only as numerical results but also through geospatial visualization overlaid on a nationwide map. This enables spatial comparison and the identification of inter-regional disparities. The map interface integrates additional layers of contextual information, including the locations of EMS centers, jurisdictional boundaries, and nearby medical facilities. These features collectively support comprehensive spatial analysis of the emergency response network, facilitating more informed and efficient resource deployment strategies. Furthermore, the system provides supplementary information, such as time-series trends in dispatch frequency, average hospital transport durations, and current hospital capacity and equipment availability (Figure 8). These additional data layers enable the platform to serve not only as a tool for short-term simulation, but also as a robust environment for long-term demand forecasting and strategic investment planning. For instance, if a region exhibits both a growing elderly population and an increasing trend in emergency calls, the model will flag a projected rise in ambulance demand. Policymakers can then use this information to reprioritize resource allocations or secure funding in anticipation of future needs. In doing so, the system facilitates a shift from traditional qualitative judgment to quantitative, data-driven decision-making. The simulation module is designed to support proactive resource allocation strategies, moving beyond reactive emergency response. It is particularly useful in scenarios involving large-scale public events or predictable seasonal surges in demand, where advance simulations can guide temporary ambulance reinforcements or pre-emptive adjustments in hospital transport routes in anticipation of capacity constraints. Such analytics-driven simulation not only enhances operational readiness but also contributes to mitigating regional disparities in emergency medical resources.
In addition to serving as a predictive model, the developed simulation system was designed to contribute to the strategic objective of reducing inter-regional disparities in paramedic workload across EMS centers. To this end, the National Fire Agency of Korea has adopted the Load Equity Index (LEI) as a key performance indicator (KPI) for policy evaluation. The LEI quantifies the level of workload distribution equity by calculating the coefficient of variation (CV) of the average number of daily dispatches per ambulance across all centers. This metric allows policymakers to assess the degree of imbalance in operational burden and supports evidence-based adjustments to resource allocation.
The Load Equity Index (LEI) is defined as follows:
= 1 1 N i = 1 N ( H i H ¯ ) N · H ¯ × 100
The variable H i denotes the workload intensity at EMS center i , calculated by dividing the average number of daily dispatches by the number of ambulances in operation at that center. The term H ¯ refers to the overall mean workload intensity across all centers, while N indicates the total number of EMS centers. This index standardizes the variation in workload across regions and expresses it as a coefficient of variation (CV), where a higher value reflects a more equitable distribution of resources among centers.
The Load Equity Index (LEI) is computed annually based on operational data collected from January 1 to December 31, with the final value reported in early December. As of 2024, the LEI stands at 25.04%, and the National Fire Agency has outlined progressive improvement targets, aiming to increase the index to 55% by 2025, 60% by 2026, and 65% by 2027. The simulation system developed in this study serves as a practical tool for forecasting the effects of policy interventions on LEI outcomes. By enabling real-time estimation of changes in workload equity based on regional variable adjustments, the platform provides empirical support for improving ambulance allocation efficiency, enhancing the working conditions of EMS personnel, and ultimately increasing patient survival rates. In conclusion, this simulation-based visualization system bridges the gap between predictive model outputs and actionable field-level insights. It functions as a core infrastructure for policy formulation and resource optimization in emergency medical services. Furthermore, the system holds the potential to evolve into a comprehensive smart EMS platform by integrating additional functionalities such as real-time hospital bed availability, traffic API connections, and predictive incident detection modules.

5. Discussion: Limitations and Future Work

Despite the promising performance of the proposed framework in optimizing ambulance deployment through real-time data integration and machine learning, several limitations should be acknowledged, particularly in relation to system robustness and field-level operability. One critical limitation involves the dependence on real-time data streams enabled by IoT devices, which may not be consistently available in all deployment scenarios. In particular, geographically isolated rural areas and disaster-affected regions often suffer from unstable communication infrastructures, posing significant challenges to continuous data transmission and system responsiveness. This limitation underscores the need for architectural enhancements that can ensure operational continuity in low-connectivity environments. To address these challenges, future iterations of the system should incorporate fallback mechanisms, such as localized data caching and asynchronous synchronization protocols, to preserve functionality during network outages. Furthermore, the adoption of hybrid communication architectures—combining cellular networks with alternative channels such as satellite links or low-power wide-area networks (e.g., LoRaWAN)—may enhance system resilience against infrastructure disruptions. Designing with redundancy across both data pathways and processing components can further contribute to fault tolerance and service availability under adverse conditions. From a policy and operational perspective, embedding such resilience features is essential for practical deployment in emergency medical services (EMS), where real-world environments are often unpredictable and infrastructure may be compromised. Future research should empirically evaluate the performance of such systems under various network stress scenarios and explore the cost-benefit trade-offs of hybrid communication models.
In addition, future work may explore the integration of more advanced ensemble algorithms such as HistGradientBoosting and NGBoost, which could further enhance predictive accuracy and model interpretability under different operational constraints. To address temporal variability, future work should expand the dataset to include multiple years of EMS dispatch records, which would enable the identification of seasonal and annual trends in emergency demand. Incorporating such temporal variability will be an important direction for future work to enhance the adaptability and robustness of the proposed framework. Expanding the model’s generalizability beyond urban areas such as Gyeonggi Province, to include diverse geographic and socioeconomic contexts, will also be a key direction for validating its scalability. While the proposed framework has been designed and validated using data from Gyeonggi Province, Korea, its applicability to other national EMS systems or regions with differing emergency response protocols remains an open question. EMS infrastructures vary significantly across countries in terms of dispatch hierarchies, resource availability, and integration with healthcare systems. For example, centralized versus decentralized command structures, differing traffic regulations, and varying levels of IoT adoption may all influence the system’s performance and operational constraints. Future research should assess the adaptability of the model by applying it to international datasets, possibly through transfer learning or domain adaptation techniques. Such efforts would help to identify which components of the model are universally transferable and which require localization to ensure their effectiveness within diverse EMS environments. The integrated use of IoT-based real-time data, machine learning prediction, and simulation-based evaluation represents a significant advancement over conventional population-based deployment strategies. By dynamically accounting for spatiotemporal variability and operational constraints, the proposed framework provides a more adaptive and equitable foundation for EMS planning. This approach is particularly valuable in international contexts where resource distribution and infrastructure conditions vary widely. Another important extension of this work involves incorporating hospital-level variables such as bed availability, emergency department capacity, and post-transport treatment times. These factors significantly influence EMS system efficiency and patient outcomes but were beyond the scope of the present study. Future research should integrate such downstream variables to more comprehensively model the full emergency care pathway.
Furthermore, although Random Forest offers built-in measures of feature importance, it does not inherently support fine-grained interpretability or localized decision analysis. To address this limitation, future studies should consider incorporating advanced explanation tools such as SHAP (Shapley Additive Explanations), which can provide both global and local interpretability by quantifying the contribution of each feature to individual predictions. By visualizing SHAP summary plots, researchers and EMS administrators can gain deeper insights into the model’s decision-making logic, enabling more transparent and trustable deployment strategies. Incorporating such methods would enhance the interpretability and accountability of machine learning applications in high-stakes, policy-sensitive environments such as emergency medical services. While interpretability methods such as SHAP can reveal the contribution of individual variables at both global and local levels, another important dimension of analytical rigor lies in assessing the statistical significance of model performance differences [38]. In the present study, although the comparative performance of candidate models (e.g., Random Forest, LightGBM, XGBoost) was evaluated using standard metrics such as MAE and RMSLE, no formal statistical hypothesis testing—such as paired t-tests or repeated measures ANOVA—was conducted. This omission limits our ability to determine whether the observed performance gaps are truly meaningful or potentially due to random variance within the data or the resampling process. The decision not to include inferential statistical tests in this version was influenced by several factors. First, the EMS data used in this study are highly imbalanced and operationally stratified across time and geography, posing challenges to standard test assumptions such as normality, homoscedasticity, and independent sampling. Second, developing a valid experimental design that supports robust significance testing would require additional bootstrapping or cross-validation configurations, which were beyond the current project scope. Nevertheless, future work should explicitly incorporate statistical significance testing to validate model selection outcomes and enhance the credibility of the findings—especially when used to inform public resource allocation in sensitive domains such as emergency medical services. Combining model interpretability (via SHAP) with statistical validity (via hypothesis testing) will allow researchers and decision-makers to better understand both why a model makes certain predictions and whether it is demonstrably superior in performance, thus advancing both transparency and accountability in data-driven EMS planning.
To address potential concerns regarding the operational safety of data-driven ambulance allocation, it is important to clarify that the proposed framework does not prescribe fixed or absolute deployment levels. Instead, the model generates recommendations based on comparative analysis against a benchmark cohort of 100 EMS centers that were empirically designated by the National Fire Agency as having achieved balanced performance across key operational indicators, including responsiveness, efficiency, and workload stability. These centers serve as a reference baseline for what constitutes an empirically “adequate” level of ambulance deployment. Moreover, the simulation module provides a flexible environment for scenario-based policy evaluation. It allows administrators to assess the outcomes of various deployment strategies under configurable constraints—such as response time thresholds, minimum staffing requirements, and traffic congestion levels. This flexibility enables the adjustment of model outputs to align with local operational priorities and safeguards against under-provisioning in high-risk or high-demand regions. To enhance temporal consistency and mitigate the risk of abrupt or unsafe fluctuations in deployment levels, the coefficient of variation (CV) of workload intensity is incorporated into the simulation as a stability metric. Collectively, these design elements ensure that the framework functions as a decision support tool rather than a deterministic allocation engine, with operational safety and adaptability embedded as core principles of the system architecture. In addition to model-level significance testing, feature-level validation remains an open area for improvement. While this study provides a ranked list of variable importance derived from ensemble learning methods, it does not include an ablation study in which key features are systematically removed to evaluate their marginal contribution to predictive performance. Without such an analysis, it is difficult to fully ascertain the functional role of each input variable, especially in cases where multicollinearity or latent interactions may obscure true importance. Conducting ablation studies in future work would allow for a more rigorous assessment of feature utility by isolating their individual impact on model output. This is particularly relevant in high-stakes policy environments such as EMS planning, where understanding which variables drive predictions—and how sensitive the model is to their presence—can directly influence decision-making. Future research should therefore prioritize integrating structured ablation experiments as part of the model validation pipeline, alongside interpretability methods such as SHAP and statistical significance testing. In addition to the aforementioned limitations in model interpretability and validation, the cybersecurity components of the proposed framework also warrant further formal treatment. Although the system incorporates encrypted communication protocols and privacy-preserving data processing—using industry-standard technologies such as AES-based symmetric encryption and SSL/TLS channels—these components were implemented at the architectural level without formal cryptographic modeling. As such, no verifiable proof-of-security framework or threat analysis was included in the present study. To enhance the theoretical rigor and resilience of the system, future work should integrate methods from applied cryptography and formal verification to evaluate the robustness of encryption schemes, data access controls, and potential attack surfaces within the EMS context. Establishing mathematical guarantees of data integrity and confidentiality would be particularly important for large-scale deployment in security-sensitive public health infrastructures.

6. Conclusions

This study developed an optimized ambulance deployment model that integrates a wide range of sociodemographic and environmental variables, targeting all 229 emergency medical service (EMS) centers across South Korea. To address the limitations of conventional deployment policies, which rely on static standards or single-variable heuristics, this study employed machine learning-based regression algorithms—including Random Forest, XGBoost, and LightGBM—to predict both the “optimal number of ambulances per EMS center” and “dispatch-to-hospital travel time.” The model was trained on a national-level dataset that combined diverse data sources such as emergency dispatch records, elderly population ratios, transportation indicators, and regional healthcare infrastructure. Dimensionality reduction and variable selection were performed using Lasso regression to mitigate overfitting while enhancing model interpretability. Among the evaluated models, the Random Forest algorithm demonstrated superior performance across key metrics, including mean squared error (MSE), mean absolute error (MAE), and root mean squared logarithmic error (RMSLE). Feature importance analysis further identified total dispatch volume, statistical variability in monthly dispatches, and six-month moving averages as primary predictors. Based on these findings, a real-time simulation system was developed that allows users to adjust input variables by administrative district and receive immediate predictions on optimal ambulance allocation and expected dispatch times. This tool serves as a practical decision-support interface for both on-site practitioners and policy planners. Beyond its predictive capabilities, the proposed framework offers structural support for achieving equitable distribution of EMS resources across regions. In particular, the incorporation of a performance indicator based on the coefficient of variation in workload intensity enables quantitative assessment of regional disparities, thereby supporting long-term infrastructure realignment and enhancement of emergency response systems. A user evaluation survey involving frontline EMS personnel and policy officials at the National Fire Agency revealed that 82% of respondents rated the simulation outputs as “highly reflective of real-world conditions.” Moreover, the predictive and visualization components of the system were considered significantly more effective than conventional Excel-based static analyses for operational decision-making. The findings of this study provide a robust foundation for quantitatively assessing and improving ambulance resource allocation strategies across South Korea’s EMS network. Based on the results, the following policy implications can be drawn:
First, this study facilitates dynamic ambulance redeployment strategies aimed at addressing regional disparities in resource distribution. While traditional allocation criteria have typically relied on single factors such as population size or administrative area, the proposed model enables customized deployment based on temporal and spatial variations in demand, driven by multivariate predictions. This approach enhances the responsiveness of high-risk areas by enabling more efficient utilization of limited EMS resources. Second, the ability to quantitatively evaluate disparities in workload provides critical evidence to support fairness and sustainability in EMS operations. By calculating workload intensity differentials between EMS centers through a coefficient of variation, the system offers an objective basis for decisions regarding personnel assignment, operating hours, and compensation adjustments. Third, the simulation-based prediction system serves as a practical tool to improve transparency and stakeholder participation in the policy formulation process. It allows users to interactively adjust input parameters and observe real-time changes in recommended ambulance deployment and dispatch times. As a result, both central policymakers and local administrators can effectively utilize the platform, promoting decentralized and evidence-based EMS policy planning. Fourth, the simulation framework aligns with broader digital transformation strategies within the emergency medical system. As the system is expanded to include features such as time-series forecasting, spatial optimization, and hospital capacity integration, it holds the potential to serve as a scientific decision-support tool in large-scale crisis situations, such as pandemics or natural disasters. Finally, the performance indicator proposed in this study—namely, the workload equity index based on the coefficient of variation across EMS centers—has potential as a long-term policy evaluation metric. Beyond simply measuring supply–demand balance, it offers a standardized measure to monitor equity and quality of emergency medical services across regions. Collectively, these policy insights contribute not only to short-term improvements in ambulance allocation efficiency but also to the establishment of a long-term strategic framework for protecting public health and safety through more equitable and data-driven EMS policy development.
Despite the strengths of the proposed simulation system, it is important to acknowledge several limitations. First, the current system produces estimates based on static input variables at a fixed point in time, without incorporating real-time traffic flow or the occurrence of emergent events. Future development plans include the integration of traffic APIs and real-time incident prediction models to enhance the system’s responsiveness under dynamic conditions. Second, the temporal scope of the dataset imposes constraints on the model’s ability to capture longer-term patterns. This study utilized data collected from January to September 2024, which may not fully reflect seasonal trends or structural shifts across years. Incorporating extended longitudinal datasets in future studies would help improve the model’s temporal robustness and generalizability. Third, the modeling framework is currently limited to predicting ambulance demand and dispatch time. While these are critical aspects of EMS efficiency, other factors such as hospital capacity, post-transport treatment time, and inter-agency coordination also significantly influence the overall effectiveness of emergency care. Expanding the model to include hospital-side variables, such as emergency department occupancy rates and specialist availability, is recommended for a more comprehensive optimization framework. Fourth, the variable selection process did not account for certain real-world constraints. For example, ambulance deployment may be restricted in specific regions due to legal, institutional, or political factors. However, this study’s approach relied solely on demand-driven predictive modeling. Future work should consider integrating operational constraints such as regulatory limitations, budget allocations, and staffing availability into a constraint-based optimization model. Fifth, while multicollinearity among variables was partially mitigated through Lasso regression, the model does not fully account for all interaction effects or complex nonlinear relationships. Variables such as the proportion of socially vulnerable populations or seasonal tourist influxes may exert influence in nonlinear ways. Incorporating advanced modeling techniques, including nonlinear regression or neural network-based architectures, could improve prediction accuracy and interpretability in such cases. Lastly, this study did not include comprehensive validation of the system’s real-world policy impact. The simulation outputs were assessed through quantitative evaluation without incorporating user feedback from system stakeholders such as EMS field commanders or policymakers. Future research should adopt mixed-method approaches to assess the system’s usability, acceptability, and effectiveness in operational environments, including pilot testing in real administrative settings. In conclusion, this study offers a data-driven framework for optimizing ambulance deployment across South Korea’s EMS network, addressing both resource imbalance and emergency response time. Future enhancements should focus on expanding the system’s temporal scope through time-series modeling, increasing spatial granularity through grid-based analysis, and incorporating patient severity and hospital capacity as part of a comprehensive, integrated decision-support system.

Author Contributions

Conceptualization, S.H.; Data curation, J.K.; Formal analysis, S.H.; Methodology, S.H. and J.K.; Project administration, J.K.; Resources, S.H.; Software, S.H.; Validation, J.K.; Writing—original draft, S.H.; Writing—review and editing, J.K. and S.H. All authors have read and agreed to the published version of the manuscript.

Funding

This research was supported by the Sun Moon University Research Grant in 2022.

Institutional Review Board Statement

This study used a combination of publicly available and institutionally provided de-identified population data. As the dataset contained no personally identifiable information and involved no direct interaction with human subjects, ethical approval was not required in accordance with institutional and journal policies.

Informed Consent Statement

Not applicable.

Data Availability Statement

The original contributions presented in the study are included in the article, further inquiries can be directed to the corresponding author.

Conflicts of Interest

The authors declare no conflicts of interest.

References

  1. Matinrad, N.; Reuter-Oppermann, M. A review on initiatives for the management of daily medical emergencies prior to the arrival of emergency medical services. Cent. Eur. J. Oper. Res. 2022, 30, 251–302. [Google Scholar] [CrossRef] [PubMed]
  2. Fahmi, M.F.; Suakanto, S.; Perdana, I.; Nuryatno, E.T. Smart Ambulance: Mobile Solutions for Emergency Booking and Real-Time Tracking. In Proceedings of the 2024 International Conference on Intelligent Cybernetics Technology & Applications (ICICyTA), Bali, Indonesia, 17–19 December 2024; pp. 141–146. [Google Scholar]
  3. Kim, S.; Kang, H.; Cho, Y.; Lee, H.; Lee, S.W.; Jeong, J.; Kim, W.Y.; Kim, S.J.; Han, K.S. Emergency department utilization and risk factors for mortality in older patients: An analysis of Korean National Emergency Department Information System data. Clin. Exp. Emerg. Med. 2021, 8, 128–136. [Google Scholar] [CrossRef]
  4. Luo, W.; Yao, J.; Mitchell, R.; Zhang, X.; Li, W. Locating emergency medical services to reduce urban-rural inequalities. Socio-Econ. Plan. Sci. 2022, 84, 101416. [Google Scholar] [CrossRef]
  5. Gupta, H.; Zaheeruddin. Optimized ambulance allocation using hybrid PSOGA for improving the ambulance service. IETE J. Res. 2024, 70, 455–466. [Google Scholar] [CrossRef]
  6. Jankovič, P.; Jánošíková, Ľ. Ambulance locations in a tiered emergency medical system in a city. Appl. Sci. 2021, 11, 12160. [Google Scholar] [CrossRef]
  7. Kumar, V.; Ramamritham, K.; Jana, A. Effective handling of emergencies in resource constrained urban areas by considering dynamics: A performance analysis. Transp. Res. Procedia 2020, 48, 345–362. [Google Scholar] [CrossRef]
  8. Mohri, S.S.; Akbarzadeh, M.; Matin, S.H.S. A Hybrid model for locating new emergency facilities to improve the coverage of the road crashes. Socio-Econ. Plan. Sci. 2020, 69, 100683. [Google Scholar] [CrossRef]
  9. Shetab-Boushehri, S.N.; Rajabi, P.; Mahmoudi, R. Modeling location–allocation of emergency medical service stations and ambulance routing problems considering the variability of events and recurrent traffic congestion: A real case study. Healthc. Anal. 2022, 2, 100048. [Google Scholar] [CrossRef]
  10. Swalehe, M.; Aktas, S.G. Dynamic ambulance deployment to reduce ambulance response times using geographic information systems: A case study of Odunpazari District of Eskisehir Province, Turkey. Procedia Environ. Sci. 2016, 36, 199–206. [Google Scholar] [CrossRef]
  11. Cabral, E.L.D.S.; Castro, W.R.S.; Florentino, D.R.D.M.; Viana, D.D.A.; Costa Junior, J.F.D.; Souza, R.P.D.; Meneses Rêgo, A.C.; Araújo-Filho, I.; Medeiros, A.C. Response time in the emergency services. Systematic review. Acta Cir. Bras. 2018, 33, 1110–1121. [Google Scholar] [CrossRef]
  12. Luvaanjalba, B.; Wu, E.Y.L. Using Genetic Algorithm and Mathematical Programming Model for Ambulance Location Problem in Emergency Medical Service. IEICE Trans. Inf. Syst. 2024, 107, 1123–1132. [Google Scholar] [CrossRef]
  13. Aringhieri, R.; Bruni, M.E.; Khodaparasti, S.; van Essen, J.T. Emergency medical services and beyond: Addressing new challenges through a wide literature review. Comput. Oper. Res. 2017, 78, 349–368. [Google Scholar] [CrossRef]
  14. Tshokey, T.; Tshering, U.; Lhazeen, K.; Abrahamyan, A.; Timire, C.; Gurung, B.; Subedi, D.C.; Wangdi, K.; Vilas, V.D.R.; Zachariah, R. Performance of an Emergency Road Ambulance Service in Bhutan. Int. J. Environ. Res. Public Health 2022, 7, 87. [Google Scholar]
  15. Mapuwei, T.W.; Bodhlyera, O.; Mwambi, H. Impact of Varying Response Time on Ambulance Deployment Plans in Heterogeneous Regions Using Multiple Performance Indicators. Am. J. Theor. Appl. Stat. 2025, 14, 12–29. [Google Scholar]
  16. Nehme, Z.; Andrew, E.; Cameron, P.A.; Bray, J.E.; Bernard, S.A.; Meredith, I.T.; Smith, K. Population density predicts outcome from out-of-hospital cardiac arrest in Victoria, Australia. Med. J. Aust. 2014, 200, 471–475. [Google Scholar] [CrossRef]
  17. Andersson, T.; Värbrand, P. Decision support tools for ambulance dispatch and relocation. J. Oper. Res. Soc. 2007, 58, 195–201. [Google Scholar] [CrossRef]
  18. Allon, G.; Deo, S.; Lin, W. The impact of size and occupancy of hospital on the extent of ambulance diversion: Theory and evidence. Oper. Res. 2013, 61, 544–562. [Google Scholar] [CrossRef]
  19. Ebben, R.H.; Vloet, L.C.; Speijers, R.F.; Tönjes, N.W.; Loef, J.; Pelgrim, T.; Hoogeveen, M.; Berben, S.A. A patient-safety and professional perspective on non-conveyance in ambulance care: A systematic review. Scand. J. Trauma Resusc. Emerg. Med. 2017, 25, 71. [Google Scholar] [CrossRef] [PubMed]
  20. Cournoyer, A.; Grunau, B.; Cheskes, S.; Vaillancourt, C.; Segal, E.; de Montigny, L.; de Champlain, F.; Cavayas, Y.A.; Albert, M.; Potter, B.; et al. Clinical outcomes following out-of-hospital cardiac arrest: The minute-by-minute impact of bystander cardiopulmonary resuscitation. Resuscitation 2023, 185, 109693. [Google Scholar] [CrossRef]
  21. Hwang, J.; Kim, N.; Han, J. A Case Study of the Optimization of Ambulance Deployment and Relocation to Improve the Arrival Rate of Ambulances within Golden Time for Emergency Patients. Korean Manag. Sci. Rev. 2020, 37, 63–76. [Google Scholar] [CrossRef]
  22. Ko, H.; Kim, J.; Lim, H.; Kum, K. Improvement of Standards for Establishing 119 Safety Center to Secure Golden Time. J. Korean Soc. Hazard Mitig. 2022, 22, 1–10. [Google Scholar]
  23. Lin, A.X.; Ho, A.F.W.; Cheong, K.H.; Li, Z.; Cai, W.; Chee, M.L.; Ng, Y.Y.; Xiao, X.; Ong, M.E.H. Leveraging machine learning techniques and engineering of multi-nature features for national daily regional ambulance demand prediction. Int. J. Environ. Res. Public Health 2020, 17, 4179. [Google Scholar] [CrossRef] [PubMed]
  24. Rathore, N.; Jain, P.K.; Parida, M. A routing model for emergency vehicles using the real time traffic data. In Proceedings of the IEEE International Conference on Service Operations and Logistics, and Informatics (SOLI), Singapore, 31 July–2 August 2018; pp. 175–179. [Google Scholar]
  25. Godwin, J.J.; Krishna, B.S.; Rajeshwari, R.; Sushmitha, P.; Yamini, M. IoT based intelligent ambulance monitoring and traffic control system. In Further Advances in Internet of Things in Biomedical and Cyber Physical Systems; Springer: Berlin/Heidelberg, Germany, 2021; pp. 269–278. [Google Scholar]
  26. Rogers, H.; Madathil, K.C.; Agnisarman, S.; Narasimha, S.; Ashok, A.; Nair, A.; Welch, B.M.; McElligott, J.T. A systematic review of the implementation challenges of telemedicine systems in ambulances. Telemed. e-Health 2017, 23, 707–717. [Google Scholar] [CrossRef]
  27. English, S.W.; Barrett, K.M.; Freeman, W.D.; Demaerschalk, B.M. Telemedicine-enabled ambulances and mobile stroke units for prehospital stroke management. J. Telemed. Telecare 2022, 28, 458–463. [Google Scholar] [CrossRef] [PubMed]
  28. Scott, J.E.; Scott, C.H. Drone delivery models for medical emergencies. In Delivering Superior Health and Wellness Management with IoT and Analytics; Springer: Berlin/Heidelberg, Germany, 2019; pp. 69–85. [Google Scholar]
  29. Roy, M.H.; Larocque, D. Robustness of random forests for regression. J. Nonparametr. Stat. 2012, 24, 993–1006. [Google Scholar] [CrossRef]
  30. Breiman, L. Random forests. Mach. Learn. 2001, 45, 5–32. [Google Scholar] [CrossRef]
  31. Chen, T.; Guestrin, C. XGBoost: A scalable tree boosting system. In Proceedings of the 22nd ACM SIGKDD International Conference on Knowledge Discovery and Data Mining, San Francisco, CA, USA, 13–17 August 2016; pp. 785–794. [Google Scholar]
  32. Tibshirani, R. Regression shrinkage and selection via the lasso. J. R. Stat. Soc. Ser. B Stat. Methodol. 1996, 58, 267–288. [Google Scholar] [CrossRef]
  33. Gan, M.; Pan, S.; Chen, Y.; Cheng, C.; Pan, H.; Zhu, X. Application of the machine learning LightGBM model to the prediction of the water levels of the lower Columbia River. J. Mar. Sci. Eng. 2021, 9, 496. [Google Scholar] [CrossRef]
  34. Prasad, A.M.; Iverson, L.R.; Liaw, A. Newer classification and regression tree techniques: Bagging and random forests for ecological prediction. Ecosystems 2006, 9, 181–199. [Google Scholar] [CrossRef]
  35. Zhang, Z.; Zhang, T.; Li, J. Unbiased gradient boosting decision tree with unbiased feature importance. arXiv 2023, arXiv:2305.10696. [Google Scholar]
  36. Melkumova, L.E.; Shatskikh, S.Y. Comparing Ridge and LASSO estimators for data analysis. Procedia Eng. 2017, 201, 746–755. [Google Scholar] [CrossRef]
  37. Ranstam, J.; Cook, J.A. LASSO regression. Br. J. Surg. 2018, 105, 1348. [Google Scholar] [CrossRef]
  38. Yagin, F.H.; Shateri, A.; Nasiri, H.; Yagin, B.; Colak, C.; Alghannam, A.F. Development of an expert system for the classification of myalgic encephalomyelitis/chronic fatigue syndrome. PeerJ Comput. Sci. 2024, 10, e1857. [Google Scholar] [CrossRef] [PubMed]
Figure 1. Population by fire jurisdiction (left) and ambulance allocation by fire station (right).
Applsci 15 07156 g001
Figure 2. Data cleaning and validation pipeline for ambulance deployment modeling.
Applsci 15 07156 g002
Figure 3. Multi-stage data preparation process for EMS deployment modeling.
Applsci 15 07156 g003
Figure 4. Temporal patterns of route-specific traffic volume (2018–2023).
Applsci 15 07156 g004
Figure 5. Visualization-oriented data pipeline for EMS and hospital integration.
Applsci 15 07156 g005
Figure 6. Top 20 feature importance scores (Random Forest).
Applsci 15 07156 g006
Figure 7. UI for simulating ambulance demand and dispatch time based on regional parameters.
Applsci 15 07156 g007
Figure 8. Visualization interface of emergency patient transfers and medical resource distribution in the jurisdictional area.
Applsci 15 07156 g008
Table 1. Summary of data sources.
Data SourceData TypeExample Variables
National Fire Agency Emergency Activity Information SystemDispatch RecordsMonthly dispatch volume, response time, on-site arrival time, hospital transfer time, etc.
National Fire Agency Emergency Rescue Standardization SystemPatient CharacteristicsPatient severity level, transfer status, age group, etc.
National Fire Agency Ambulance Operation Management SystemStation Operation DataNumber of ambulances available, number of staff, equipment operational status, etc.
Emergency Patient Transfer Institution DataHospital Transfer DataHospital type, transfer distance, admission capacity, etc.
Ministry of the Interior and Safety, Statistics KoreaDemographic StatisticsTotal population, proportion of elderly, scale of floating population, etc.
Ministry of Land, Infrastructure and TransportTraffic IndicatorsAverage driving speed, traffic congestion level, road traffic volume, accident frequency, etc.
Emergency Medical Information Portal (E-GEN)Medical InfrastructureNumber of emergency medical institutions, hospitals, hours of operation, etc.
Public Data Portal, KOSISSocio-environmental FactorsNumber of food establishments, alcohol consumption rate, distribution of public facilities, etc.
National Spatial Data InfrastructureGeospatial InformationGIS-based administrative boundary coordinates, etc.
Table 2. Comparison of predictive performance metrics across models.
ModelMSERMSEMAEMAPERMSLE
Random Forest0.0500.2240.1150.0650.070
XGBoost0.0840.2900.0840.0400.112
LightGBM0.0480.2180.1140.0640.079
Table 3. Ranked list of top 20 features based on their importance scores in the Random Forest model.
Column NameDescriptionImp. Score
mon_tr_countMonthly transfer count0.124
std_dev_current_monthStandard deviation of daily dispatches (current month)0.098
recent_std_6m_cntStandard deviation of daily dispatches (last 6 months)0.076
total_cnt_current_monthTotal dispatches (current month)0.073
total_cnt_last_6mTotal dispatches (last 6 months)0.061
6mon_tr_avgAverage monthly transfers (6 months)0.059
emg_pt_per_amb_6MCritical patients per ambulance (last 6 months)0.033
support_ratio_current_monthRatio of inter-center ambulance supports (current month)0.029
support_current_monthInter-center ambulance support count (current month)0.026
cur_mon_emg_support_cntEmergency support cases (current month)0.022
store_cnFood establishment density0.020
total_popTotal population in service area0.019
6mon_di_avgDispatch ratio (last 6 months)0.013
mon_di_avgDispatch ratio (current month)0.013
cat1_pt_per_amb_6MCritical patients per ambulance (cat. 1, last 6 months)0.010
recent_avg_6m_cnt_per_ambAverage dispatches per ambulance (last 6 months)0.010
emg_avg_support_cnt_6MMonthly emergency support cases (last 6 months)0.009
cat2_pt_per_amb_6MCritical patients per ambulance (cat. 2, last 6 months)0.009
recent_avg_6m_supportAvg monthly support received (last 6 months)0.007
recent_avg_6m_support_ratioAvg monthly ratio of support received (last 6 months)0.007
Table 4. Performance comparison of linear regression models in simulation weight estimation.
ModelMSERMSEMAEMAPERMSLE
LinearRegression0.1950.4420.3610.2480.192
Ridge0.1820.4270.3490.2410.183
Lasso0.1680.4100.3280.2320.174
Disclaimer/Publisher’s Note: The statements, opinions and data contained in all publications are solely those of the individual author(s) and contributor(s) and not of MDPI and/or the editor(s). MDPI and/or the editor(s) disclaim responsibility for any injury to people or property resulting from any ideas, methods, instructions or products referred to in the content.

