Article

Machine Learning Modeling of Foam Concrete Performance: Predicting Mechanical Strength and Thermal Conductivity from Material Compositions

1
Xinjiang Jiaotou Construction Management Co., Ltd., Urumchi 830000, China
2
School of Highway, Chang’an University, Xi’an 710064, China
3
Key Laboratory of Special Area Highway Engineering, Ministry of Education, Xi’an 710064, China
4
Programa Doctoral en Ingeniería de Materiales, Facultad de Ingeniería Mecánica y Eléctrica, Universidad Autónoma de Nuevo León, Ave. Universidad s/n, Ciudad Universitaria, San Nicolás de los Garza 66455, Nuevo León, Mexico
*
Authors to whom correspondence should be addressed.
Appl. Sci. 2025, 15(13), 7125; https://doi.org/10.3390/app15137125
Submission received: 22 May 2025 / Revised: 18 June 2025 / Accepted: 21 June 2025 / Published: 25 June 2025
(This article belongs to the Special Issue Research on Properties of Novel Building Materials)

Abstract

This study investigates the quantitative relationship between material composition and the performance of foam concrete based on 170 validated experimental datasets extracted from the existing literature. The statistical approach combined with machine learning modeling was employed to systematically analyze and predict key performance indicators. Pearson correlation analysis was used to identify the parameters affecting mechanical and thermal properties. The analysis revealed that the water-to-cement ratio (W/C) and cement content were the most influential factors for mechanical properties, while density and the coarse-to-fine aggregate ratio (Cag/Fag) had the greatest impact on thermal conductivity. To overcome the limitations of traditional empirical models in capturing complex nonlinear relationships, a predictive framework with eight machine learning algorithms was established. Among these, Neural Network Regression exhibited the highest accuracy for mechanical property prediction, with a coefficient of determination of R2 = 0.987 for compressive strength and R2 = 0.932 for flexural strength. For thermal conductivity, support vector regression achieved the best predictive performance with R2 = 0.933. Error analysis demonstrated significant differences in prediction accuracy across performance indicators: compressive strength was the easiest to predict, followed by flexural strength, while thermal conductivity was the most challenging. Based on practical engineering requirements, a hierarchical model selection strategy was proposed. Specifically, Neural Network Regression is prioritized for mechanical properties, and support vector regression is prioritized for thermal properties. Decision Tree Regression is recommended as a general-purpose model. The predictive model used in this study provides reliable technical support for the optimization and engineering application of foam concrete, enhancing both prediction accuracy and practical efficiency.

1. Introduction

With the rapid expansion of the global construction industry, concrete has become one of the most extensively used building materials, contributing significantly to natural resource depletion and environmental impacts [1,2,3]. In particular, the large-scale extraction of natural aggregates for concrete production imposes considerable ecological stress. To address sustainable challenges in modern construction engineering, the use of alternative materials has gained increasing attention. Foam concrete has been recognized as a promising solution due to its lightweight, thermal insulation capability, and environmental friendliness [4,5]. The performance of foam concrete is primarily evaluated through its mechanical properties and thermal conductivity. They are critical for their application in structural and non-structural components, such as walls, floors, and roofs. Foam concrete demonstrated promising compressive strength and effective thermal insulation in several studies. However, its performance is strongly influenced by factors such as mix proportions, manufacturing processes, and environmental conditions. Accurate prediction and systematic optimization are essential to guarantee reliable practical implementation.
In recent years, foam concrete has garnered increasing attention in both academic and industrial domains due to its multifunctional advantages, particularly in lightweight structural applications and sustainable construction. Numerous studies have highlighted its exceptional thermal insulation, lightweight nature, and adaptability to complex geometries, which makes it an attractive solution for modern building challenges. Mohamed et al. [6] provided a comprehensive review emphasizing that ultra-light foamed concrete (ULFC) with optimized pore structures can achieve thermal conductivity values as low as 0.1 W/m·K while maintaining adequate mechanical properties for non-structural applications. Similarly, Liu et al. reported that increasing foam volume fraction significantly improves thermal resistance, reducing thermal conductivity by more than 20%, thus enhancing the material’s suitability for energy-efficient building envelopes. From an environmental perspective, Liu et al. [7] also highlighted the green potential of foam concrete due to its low embodied energy, recyclability, and ability to incorporate industrial by-products. Furthermore, Cao et al. [8] demonstrated that adding glass lightweight microspheres improves both the compressive strength and thermal performance of foam concrete, helping to mitigate the usual trade-offs between insulation efficiency and structural capacity. In addition, Wu et al. [9] explored foam concrete’s behavior in tunnel applications and confirmed its superior thermal buffering capacity, making it a viable material for underground environments where thermal regulation is critical. Collectively, these recent studies validate foam concrete as both a functional and sustainable alternative to traditional cementitious materials, supporting its strategic use in future resilient infrastructure.
Although previous studies have discussed the thermo-mechanical properties of foam concrete, some significant gaps remain in quantifying the specific effect of individual material parameters on its overall performance. Compared with previous studies, this research offers several improvements. Earlier works [10,11] focused mainly on predicting compressive strength using single machine learning models and limited datasets. In contrast, our study incorporates 170 data records extracted from publications and investigates multiple performance indicators, including compressive strength, flexural strength, and thermal conductivity. Moreover, we evaluate eight machine learning algorithms under the same conditions, allowing for a more comprehensive performance comparison. This approach helps bridge the gap between existing single-target models and practical multi-property prediction needs in engineering applications.
The physical and chemical characteristics of foam concrete, such as density, porosity, and curing conditions, can lead to performance differences that limit its application [6,7,8]. Most current studies have primarily focused on the effect of individual parameters, while limited attention has been given to the comprehensive influence of multiple interacting properties. Thus, the scientific optimization to innovate the performance of foam concrete was a significant challenge [11]. Some scholars have assessed the influence of composition elements, such as cement, sand, mineral admixtures, and pore distribution on the compressive strength of foam concrete [12,13,14]. However, these studies have generally not incorporated dimensionless parameters, such as the water-to-cement ratio and sand-to-cement ratio. The dimensionless parameters can dramatically affect the strength of foam concrete. Furthermore, a wide range of thermal conductivity values for foam concrete [15,16,17] were reported in several studies. The difference likely results from different testing methods and materials used by researchers. Key factors affecting thermal conductivity involve the aggregates, mix ratios, and density [18]. While some machine learning models were established to estimate the heat transfer performance of foam concrete, many previous models failed to analyze the unique properties of foam concrete [19,20]. The models often underestimated the influence of dimensionless parameters like the w/c and s/c ratios, which are crucial in predicting foam concrete’s thermal conductivity [12,21].
Sargam et al. used MLP networks with advanced imputation techniques to predict thermal conductivity, their focus was limited to a single target property and relied on relatively small and incomplete datasets. In contrast, our study adopts a broader multi-target modeling approach and leverages a more diverse dataset with complete parameter coverage and standardized preprocessing. Xiao et al. analyzed the individual or combined effects of a few admixtures on thermal and mechanical properties under fixed curing conditions; this study considers a broader range of material parameters and curing periods. The current approach uses data-driven modeling to explore non-linear relationships among multiple variables. Taiwo et al. and Nehdi et al. established a rigorous pipeline for HPC strength prediction using ensemble learning, RFE, and model interpretability tools; their approach focused exclusively on compressive strength. In contrast, the current study extends prediction to multiple properties—including thermal conductivity and flexural strength—based on a broader dataset and material parameter space. Moreover, our modeling strategy explores generalization behavior across different ML model types, rather than optimizing a single ensemble architecture.
The complexity of thermal conductivity testing procedures makes it impractical to conduct experimental measurements for every concrete structure [22]. Thus, the data-driven model can be highly beneficial for it. Although machine learning (ML) has been widely used in multiple domains of concrete research, its use for predicting foam concrete properties, especially thermal conductivity, remains limited. This study focuses on using multiple material parameters to predict the Fc, Fr, and TC of foam concrete [22,23]. Previous studies mainly focused on individual parameters, such as the water-to-cement ratio or density, using linear or empirical models [24,25]. However, these methods often fail to capture the complex relationships between multiple factors. Some researchers have used machine learning to predict compressive strength [26,27], but few studies have systematically analyzed both mechanical and thermal properties using a dataset. In this study, 170 experimental datasets were collected from the literature to explore the effects of multiple parameters, including W/C, FA/C, cement content, and Cag/Fag, using eight machine learning algorithms.
Recent studies have demonstrated the growing use of machine learning (ML) techniques to predict the properties of foam concrete, particularly compressive strength and thermal conductivity. For example, Salami et al. [28] applied Neural Networks, genetic algorithms, and ensemble models to estimate the compressive strength of lightweight foamed concrete. Using a dataset of 1030 samples, their best models achieved an R2 of approximately 0.93, highlighting the potential of hybrid methods in enhancing prediction accuracy. Similarly, Elhishi et al. [29] emphasized model transparency by integrating explainable artificial intelligence (XAI) with traditional ML techniques for concrete strength prediction, offering both accuracy and interpretability.
In terms of thermal performance, Cakiroglu et al. [30] implemented explainable ensemble learning models, such as XGBoost and CatBoost, on a dataset of 504 foam concrete samples. Their models reached R2 values exceeding 0.98, showcasing state-of-the-art performance in predicting thermal conductivity. Rosa et al. [31] developed a Neural Network-based prediction method tailored for concrete thermal conductivity, achieving high precision across a range of compositions and conditions. In contrast, the current study expands upon these efforts by predicting three key performance indicators—compressive strength, flexural strength, and thermal conductivity—using eight machine learning algorithms (LMR, RR, SVR, NNR, DTR, RF, KNNR, and GPR) applied to 170 validated experimental records compiled from 48 published sources. By incorporating a broader feature set—including W/C, FA/C, density, porosity, and the Cag/Fag ratio—and performing consistent 5-fold cross-validation, this work offers a more comprehensive and unified predictive framework. Notably, the NNR model achieved an R2 of 0.987 for compressive strength prediction, outperforming many previous models. For thermal conductivity, the SVR model attained an R2 of 0.933, approaching the accuracy reported in larger datasets. This study not only provides a benchmark comparison but also proposes a model selection strategy tailored to specific predictive tasks.
In this research, relevant experimental data on foam concrete were collected. The influence of different parameters on its mechanical strength and thermal conductivity was analyzed. A multi-parameter prediction model was developed by using machine learning techniques [32]. The dataset was standardized, with missing values and outliers systematically addressed to improve data accuracy. Eight advanced machine learning algorithms, including Support Vector Machines (SVMs), Random Forest (RF), Neural Networks (NNs), Decision Tree Regression (DTR), Ridge Regression, K-Nearest Neighbors Regression (KNNR), Gaussian Process Regression (GPR), and Multivariate Linear Regression (MLR), were executed to design a multivariable prediction framework [33,34]. Regression analysis was conducted to characterize the highly nonlinear interactions between material parameters and the properties of foam concrete. Model performance was evaluated using K-fold cross-validation to ensure robust generalization and stability [35]. The comparative analysis of predictive models was performed to detect the most suitable algorithms for projecting the key indicators of foam concrete. The results demonstrate that machine learning techniques outperform traditional empirical approaches. By evaluating a diverse set of algorithms, this research exploits ML models to promote broader applications of foam concrete in engineering [36].

2. Methodology

As depicted in Figure 1, the research methodology establishes a comprehensive and systematic approach for assessing ML models through four stages: (a) data collection, (b) data preprocessing and selection of input variables, (c) model training and validation, and (d) model evaluation and analysis.

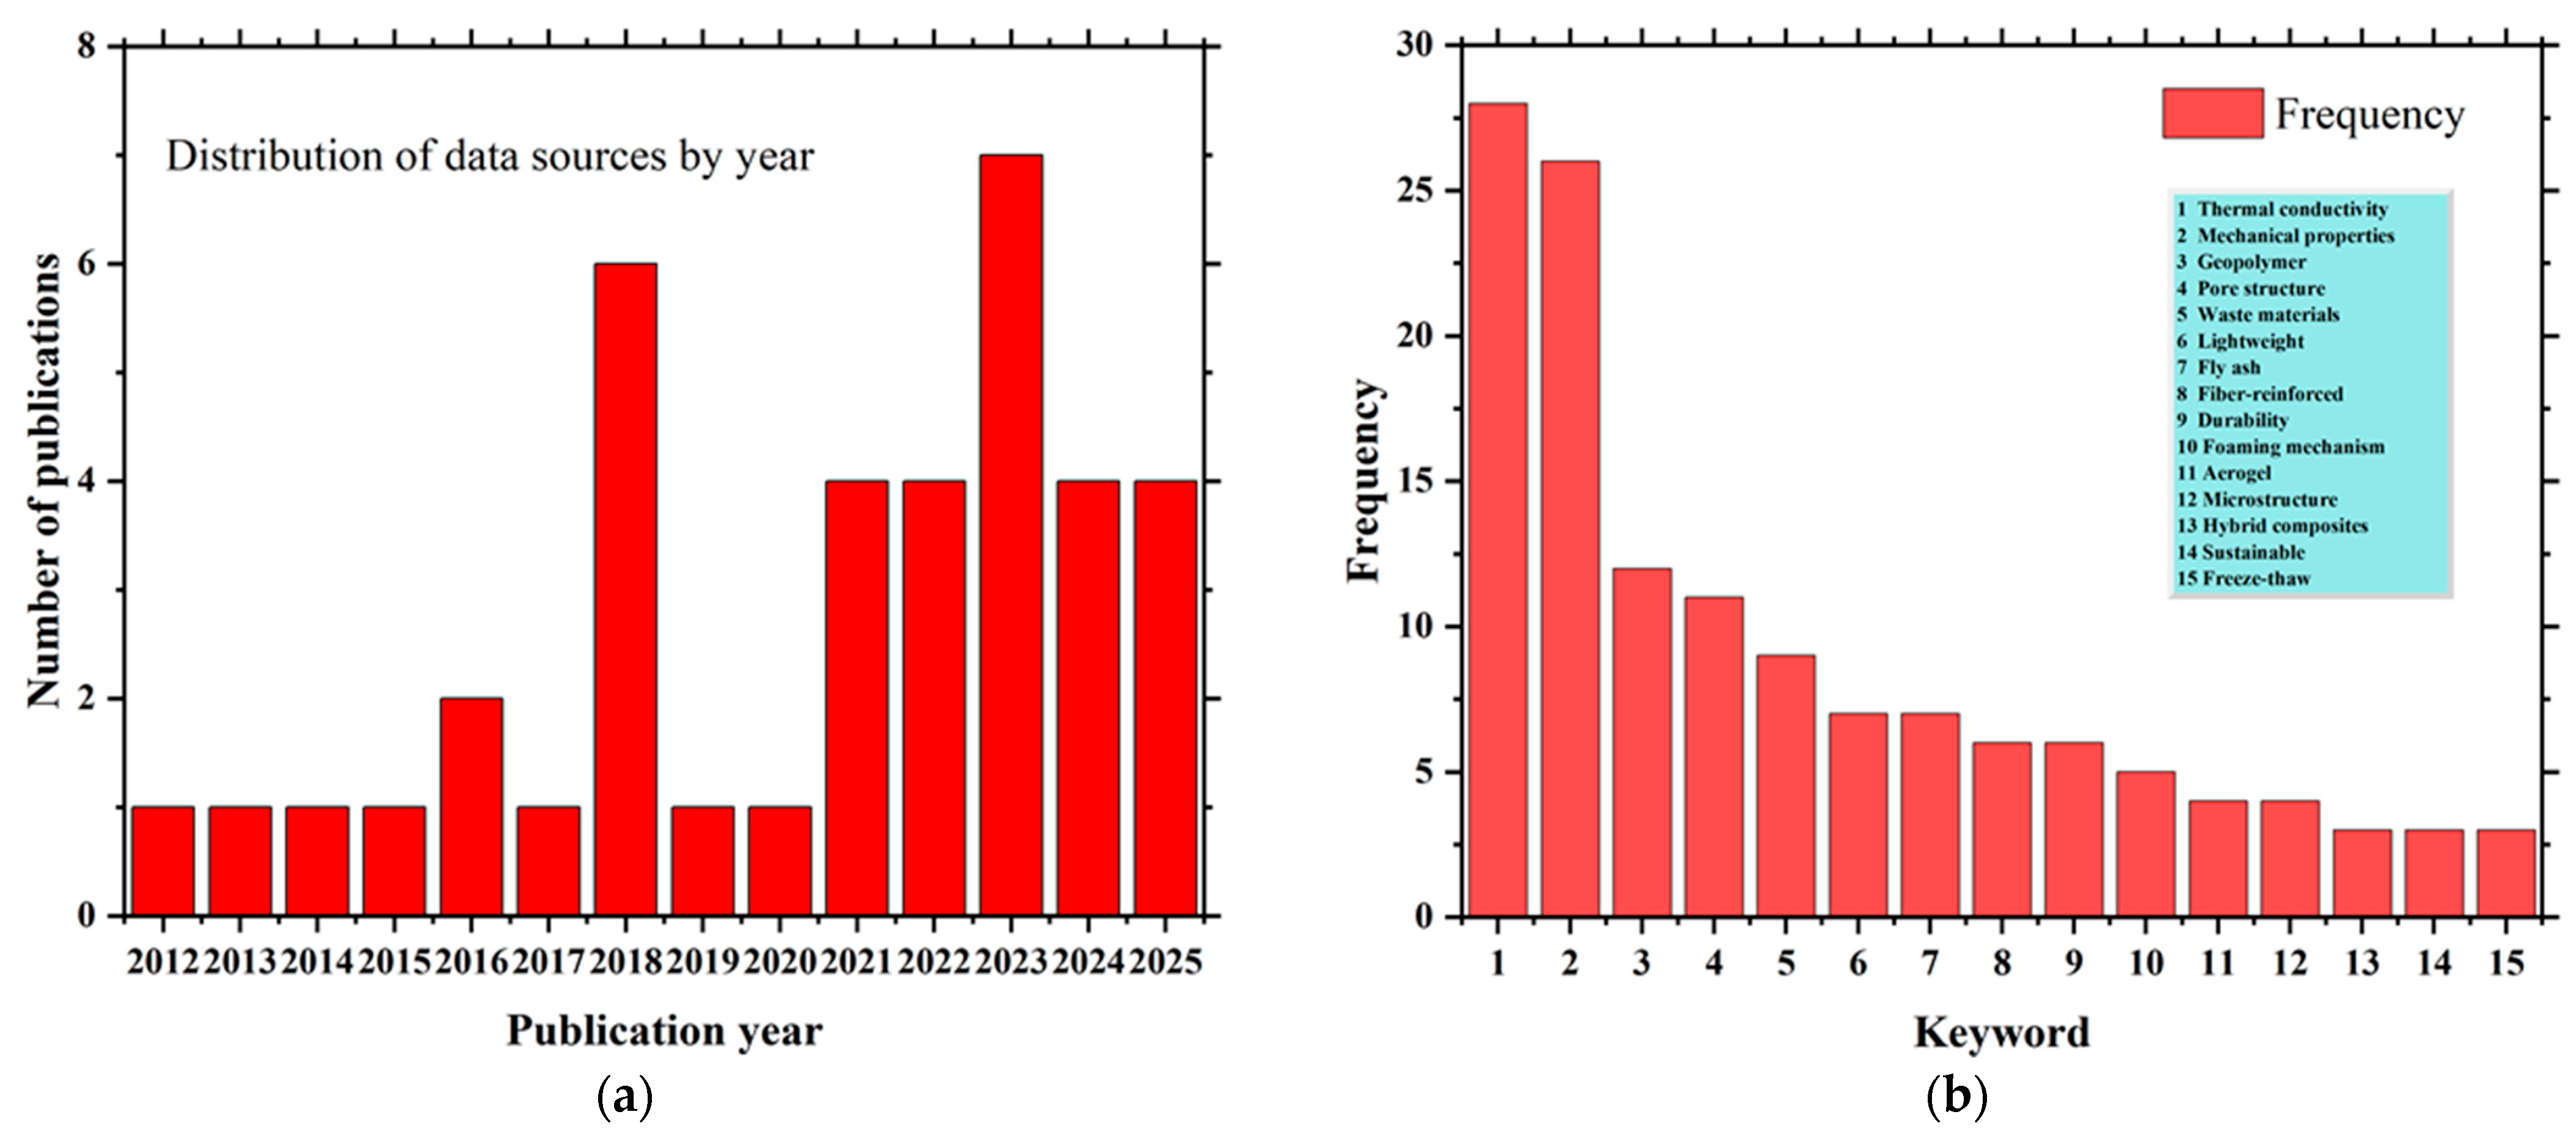
2.1. Data Compilation

The data used in this study were gathered from multiple research articles focusing on the mechanical behavior and thermal performance of foam concrete. Initially, data were systematically collected from the literature, with important variables identified and reliable experimental data selected. Data lacking sufficient detail were excluded. To ensure data consistency and quality, thorough assessments were conducted for outliers, missing values, and potential discrepancies in experimental conditions. The extracted dataset includes parameters such as the density, W/C, cement content, S/C, Cag/Fag, porosity, FA/C, along with corresponding mechanical strength and thermal conductivity data. Data were selected according to similar experimental conditions, sample types, and testing methods to ensure comparability and consistency.
In this study, a parameter range or subgroup was considered “data lacking” if it contained fewer than 10 data points, accounting for less than 6% of the total dataset. This threshold aligns with common practices in statistical learning, as sparsely populated data regions often lead to biased or unreliable predictions, particularly in nonlinear modeling contexts.
In total, 170 valid data points were collected for further analysis. The final dataset consists of 170 validated experimental entries collected from 38 journal publications [37,38,39,40,41,42,43,44,45,46,47,48,49,50,51,52,53,54,55,56,57,58,59,60,61,62,63,64,65,66,67,68,69,70,71,72,73,74], covering a wide range of foam concrete compositions, curing conditions, and testing methods. These sources were carefully selected to ensure consistency and reliability across different studies.

2.2. Data Cleaning and Preprocessing

In this study, the correlations and links between the material parameters of foam concrete and its mechanical strength and thermal conductivity were analyzed. The output parameters include compressive strength (Fc), flexural strength (Fr), and thermal conductivity (TC), all of which are functions of the input parameters, as shown in Equation (1).
Output ( F C , F r , TC ) = Input ( Density , W / C , C , S / C , Cag / Fag , P , FA / C )
Table 1 presents the statistical characteristics of various parameters and their corresponding mechanical strengths and thermal conductivities. Figure 2 shows the statistical distributions of the material parameters, the corresponding mechanical strengths, and thermal conductivities. Despite some data scatter, a clear correlation is observed between the parameter variations and material performance indicators. To quantitatively assess this correlation, Pearson’s correlation coefficient is employed as a metric to calculate the linear relationship between the material parameters and the predicted values.
The Pearson correlation analysis was conducted to provide initial insights into the linear relationships between material parameters and target properties. However, it was not used as the sole basis for feature selection. All available parameters were retained as model inputs in order to capture both linear and nonlinear interactions through the machine learning algorithms. The correlation results mainly served to support the interpretation of feature influence and model behavior, particularly in the discussion of prediction accuracy and feature relevance. Although Pearson correlation coefficients were computed to assess the linear relationships between input variables and target properties, the results were not used to eliminate features. Instead, all parameters were retained in the modeling process to allow the algorithms to capture potential nonlinear effects and interactions. The correlation analysis primarily served to support a later interpretation of model outcomes.
As shown in Figure 3, the correlation matrix reveals the complex interrelationships between the various parameters of foam concrete. The W/C exhibits a statistically significant inverse relationship with both compressive strength (Fc) and flexural strength (Fr), while the cement content shows a significant positive correlation with both. The thermal conductivity (TC) is crucially influenced by the foam concrete density, cement content, and the Cag/Fag. Significantly, there is a weak positive correlation between compressive strength and thermal conductivity, suggesting an inherent trade-off between mechanical performance and thermal insulation. The correlation matrix also highlights other key relationships: the W/C strongly correlates positively with porosity [75]. Additionally, the FA and the Cag/Fag significantly influence porosity [76,77]. The research has shown that increasing the fly ash content leads to a 5–8% increase in porosity. The phenomenon is mainly attributed to the micro-filler effect of fly ash particles and the changes in the microstructure caused by the pozzolanic reaction. Furthermore, reducing the Cag/Fag by increasing the proportion of fine aggregates effectively reduces porosity, as fine aggregates fill the voids between coarse aggregates, leading to a more compact particle packing structure [78,79]. The FA/C is negatively correlated with early strength. On the contrary, it has a positive effect on long-term strength. Specifically, it enhances long-term flexural strength and maintains a lower thermal conductivity [80]. Many studies suffer from methodological limitations, such as using a single train-test split, focusing only on compressive strength, or excluding standardized ratio-based inputs. These gaps can lead to biased results or models that are not generalizable. In this study, we apply 5-fold cross-validation to improve reliability. We also predict three key performance indicators—compressive strength, flexural strength, and thermal conductivity—under the same framework. In addition, we include dimensionless input variables, such as W/C and FA/C, which improve the consistency of feature scaling and broaden the applicability of the model. These improvements help overcome the shortcomings seen in earlier work and provide a more complete view of foam concrete behavior.
Figure 4 presents a dual analysis of the research corpus, illustrating (a) the temporal evolution of publication volume across years and (b) the categorical distribution of studies by their primary investigated parameters, revealing emerging trends and methodological focus areas in foam concrete research.

2.3. Machine Learning Model

This study applies the MATLAB R2024a (version 24.1.0, build 1.8.0_202) Regression Learner to analyze and compare the predictive performance of eight ML models. To improve the generalization ability of the models, 80% of the data were designated to the training set, while 20% were separated for the validation set. This approach allows for the evaluation and comparative analysis of the influence of various material parameters on the performance of foam concrete.

2.3.1. Support Vector Regression

Support vector regression (SVR) is well-suited for predicting continuous output variables in foam concrete performance. Support vector regression (SVR) has a distinct advantage, through its capacity to map the input data into a higher-dimensional space via kernel transformation, thereby effectively addressing issues associated with linear non-separability [81,82]. Given that experimental data of foam concrete often involve numerous variables and complex nonlinear tasks, SVR is particularly well-suited for modeling and evaluation in the process. In the current study, a quadratic kernel function is employed as the default for SVR, enabling a more effective representation of the nonlinear patterns.

2.3.2. Linear Multidimensional Regression

In Linear Multidimensional Regression (LMR), interaction effects refer to the interdependent influence exerted by two or more independent variables [83,84]. Specifically, the effect of one variable may vary depending on the values of others. Conventional linear models may fall short in analyzing the underlying complexity and interdependencies among variables. Considering that both the mechanical strength and thermal conductivity of foamed concrete are influenced by multiple, incorporating interaction terms into the LMR model is crucial. Furthermore, incorporating interaction effects into the LMR model effectively quantifies inter-variable relationships without significant overfitting risks.

2.3.3. Random Forest

Random Forest (RF) is a widely used ensemble learning method grounded in the Bagging framework [85,86]. By both random sampling of training data and random selection of feature subsets, RF generates a diverse set of decision trees, thereby reducing model variance and mitigating the risk of overfitting. Each tree is fitted to a bootstrap sample drawn from the original dataset. Each learner was built using a stochastic subset of input variables, ensuring sufficient diversity among individual learners and improving the overall predictive performance of the ensemble. In this study, the RF model is configured with a forest comprising 50 independent decision trees, with the minimum number of leaf nodes per tree set to 8.

2.3.4. Decision Tree Regression

Decision Tree Regression (DTR) is a predictive technique that constructs a regression model by recursively partitioning the dataset [87]. DTR is well-suited for addressing nonlinear regression tasks involving multiple variables, as it iteratively divides the data until the resulting subsets are sufficiently small to allow for accurate local modeling. Owing to its high interpretability and transparent decision-making structure, DTR is particularly beneficial for complex regression problems [88]. This method enables effective modeling of the various factors influencing mechanical strength and thermal conductivity. To promote predictive accuracy and ensure the reliability of terminal estimates, this study specifies a minimum leaf size of four samples per node, thereby maintaining sufficient data representation within each subset.

2.3.5. K-Nearest Neighbors Regression

K-Nearest Neighbors Regression (KNNR) is a non-parametric, instance-based learning method that has been proven effective for predicting the performance characteristics of foam concrete [89]. The algorithm functions by selecting the K nearest similar data points—nearest neighbors—in the feature space and estimating the target value of a new sample by computing either a weighted or arithmetic average of these neighbors’ target values [90]. It is particularly well-suited for modeling the complex and nonlinear relationships inherent in foam concrete [91]. A least squares regression kernel learner is applied to improve the distance-weighting mechanism within the KNN framework, thereby improving prediction accuracy and robustness.

2.3.6. Ridge Regression

Ridge Regression (RR) is a robust regression technique that incorporates L2 regularization, making it particularly effective in addressing tasks related to multicollinearity and multi-dimensional feature spaces, which are prevalent in the prediction of foamed concrete performance [92]. The strong correlations among multiple variables often lead to significant multicollinearity. It undermines the predictive accuracy and stability of traditional regression models [93]. The primary advantage of RR arises from its capacity to deliver consistent and reliable predictions, even when input variables exhibit high degrees of interdependence. As such, it is particularly well-suited for modeling the intricate and correlated relationships that determine the different properties of foamed concrete.

2.3.7. Gaussian Process Regression

Gaussian Process Regression (GPR) is a non-parametric model that provides notable benefits for predicting the performance of foamed concrete [94]. Unlike conventional parametric regression methods, GPR eliminates the need for specifying a fixed model or a predetermined number of parameters. As a result, it offers superior flexibility in reflecting the intricate relationship. In this study, the squared exponential kernel was adopted as the covariance function, enabling the model to better reflect subtle variations in the data while maintaining high predictive accuracy.

2.3.8. Neural Network Regression

Neural Network Regression (NNR) is a powerful machine learning model designed to address regression tasks by using the computational framework of artificial neural networks. In the area of concrete research, NNR proves particularly adept at capturing intricate nonlinear dependencies between material parameters and key performance metrics, such as mechanical (compressive and flexural) strengths and thermal conductivity. In this study, the network architecture was configured with a single fully connected layer comprising 100 neurons. The training was conducted over a maximum of 1000 epochs with regularization intentionally disabled (λ = 0) to prevent excessive constraint on model parameters, thereby ensuring optimal feature learning from the limited experimental dataset.

2.4. Metrics for Assessing Predictive Accuracy

The statistical evaluation metrics for the different prediction models are summarized in Table 2, including root mean square error, mean absolute error, mean absolute percentage error, and the coefficient of determination. RMSE reflects the average magnitude of prediction errors and reveals higher priority to larger errors, increasing its vulnerability to extreme values. In contrast, MAE computes the mean of the absolute errors between predicted and observed values, operating as a straightforward indicator of prediction accuracy. MAPE represents the average percentage error relative to the actual values, offering a normalized measure of predictive accuracy in percentage terms. Finally, R2 quantifies the degree of fit between the predicted values and actual observations; a value closer to 1 indicates higher predictive accuracy.

3. Results and Discussion

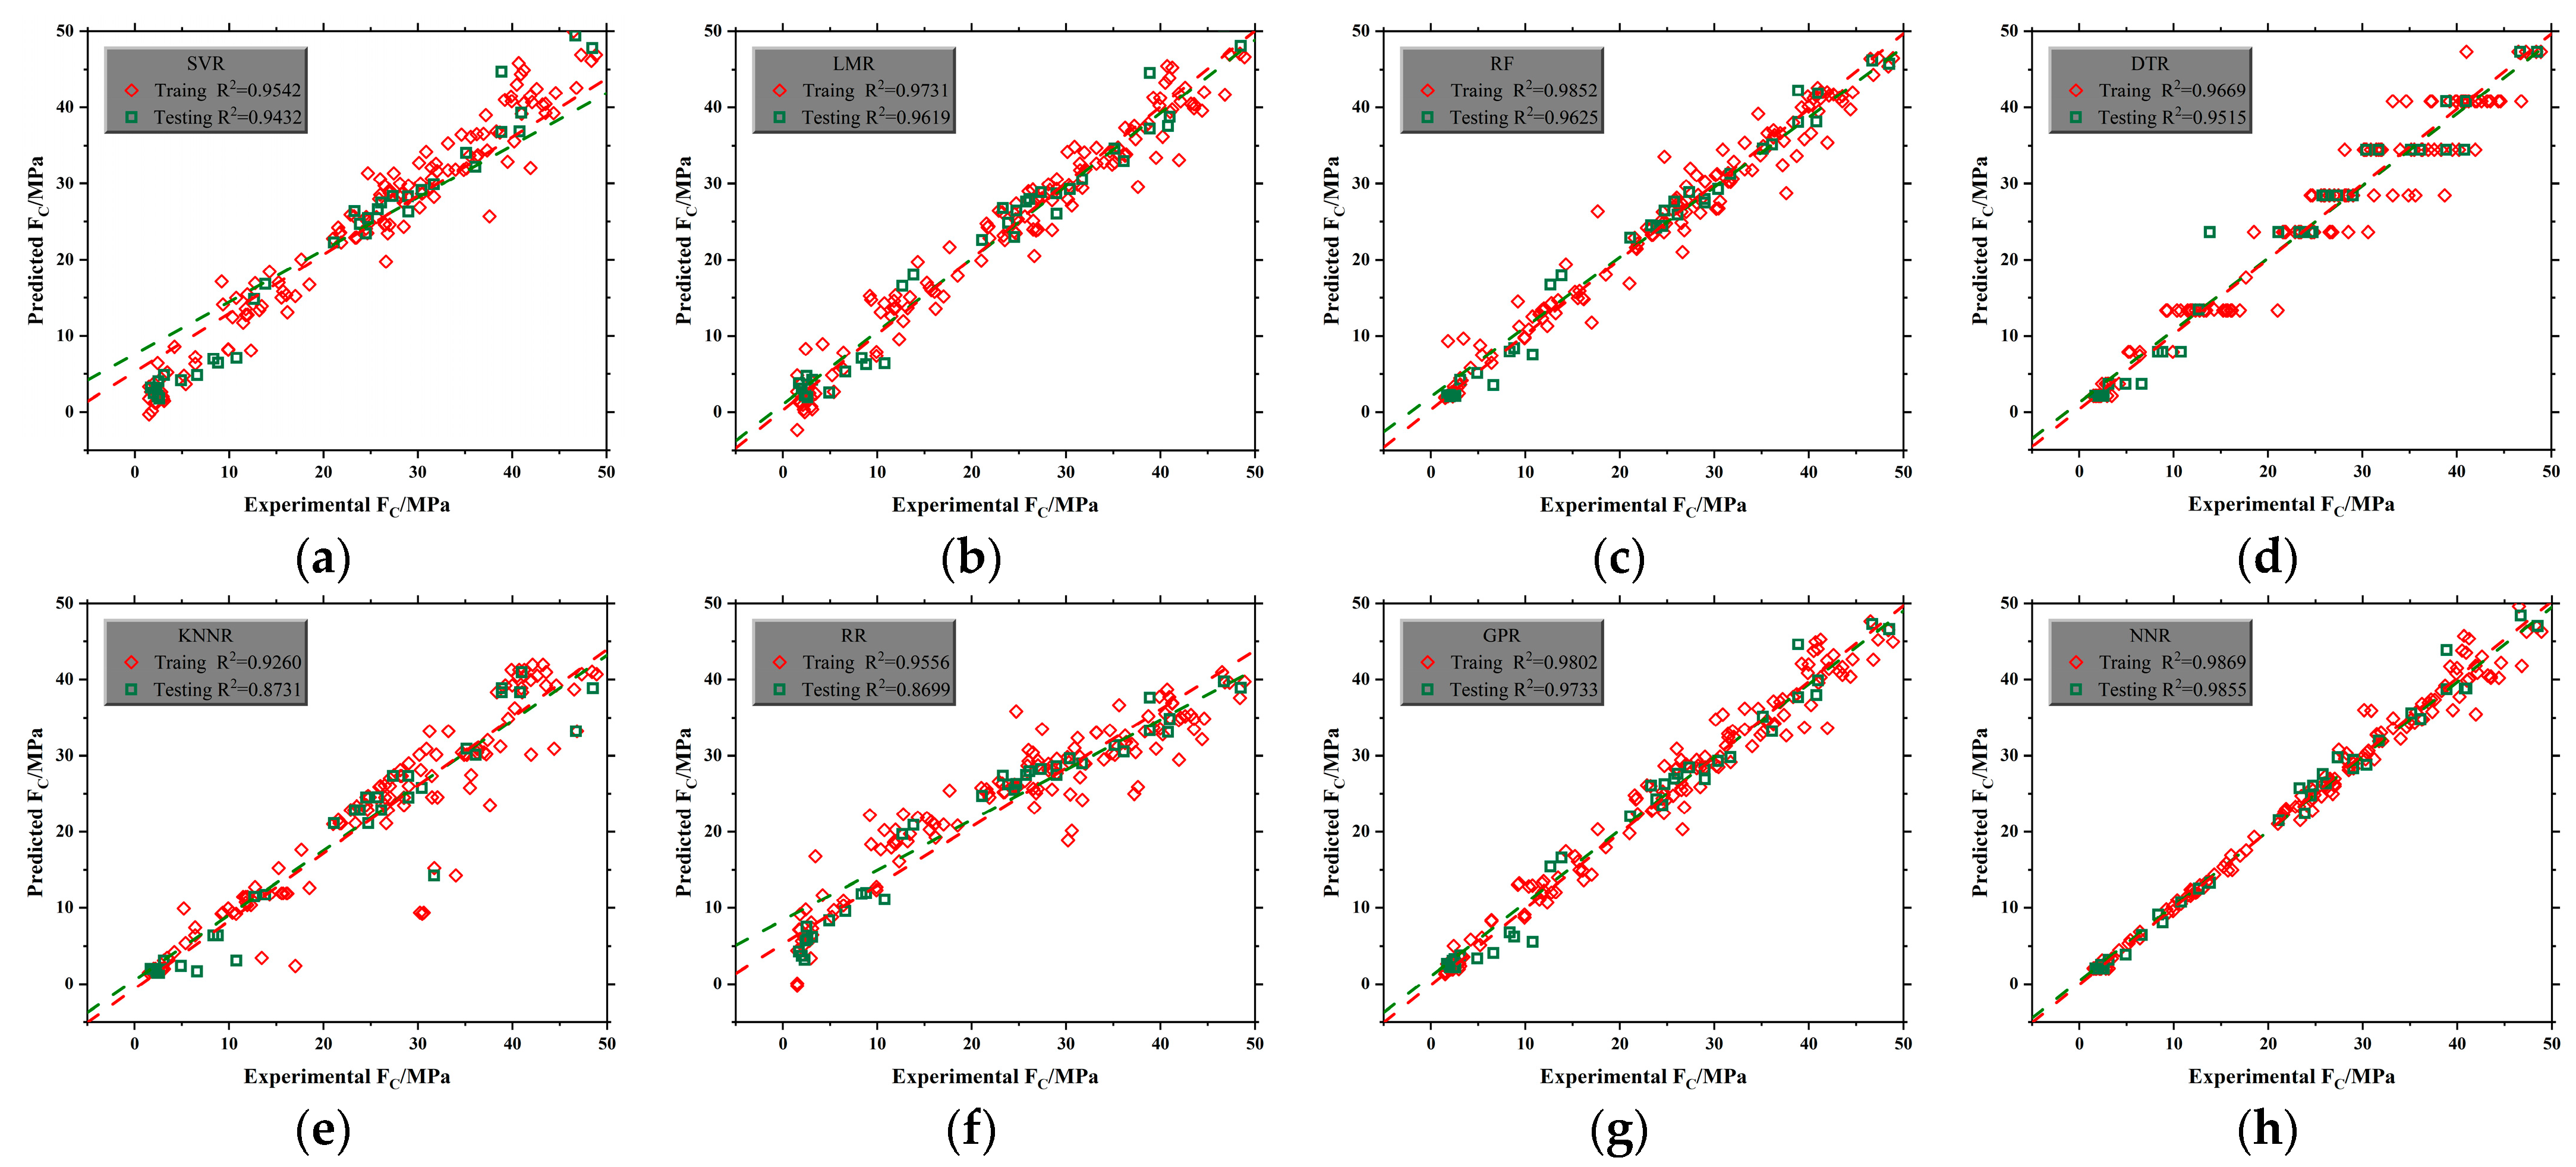
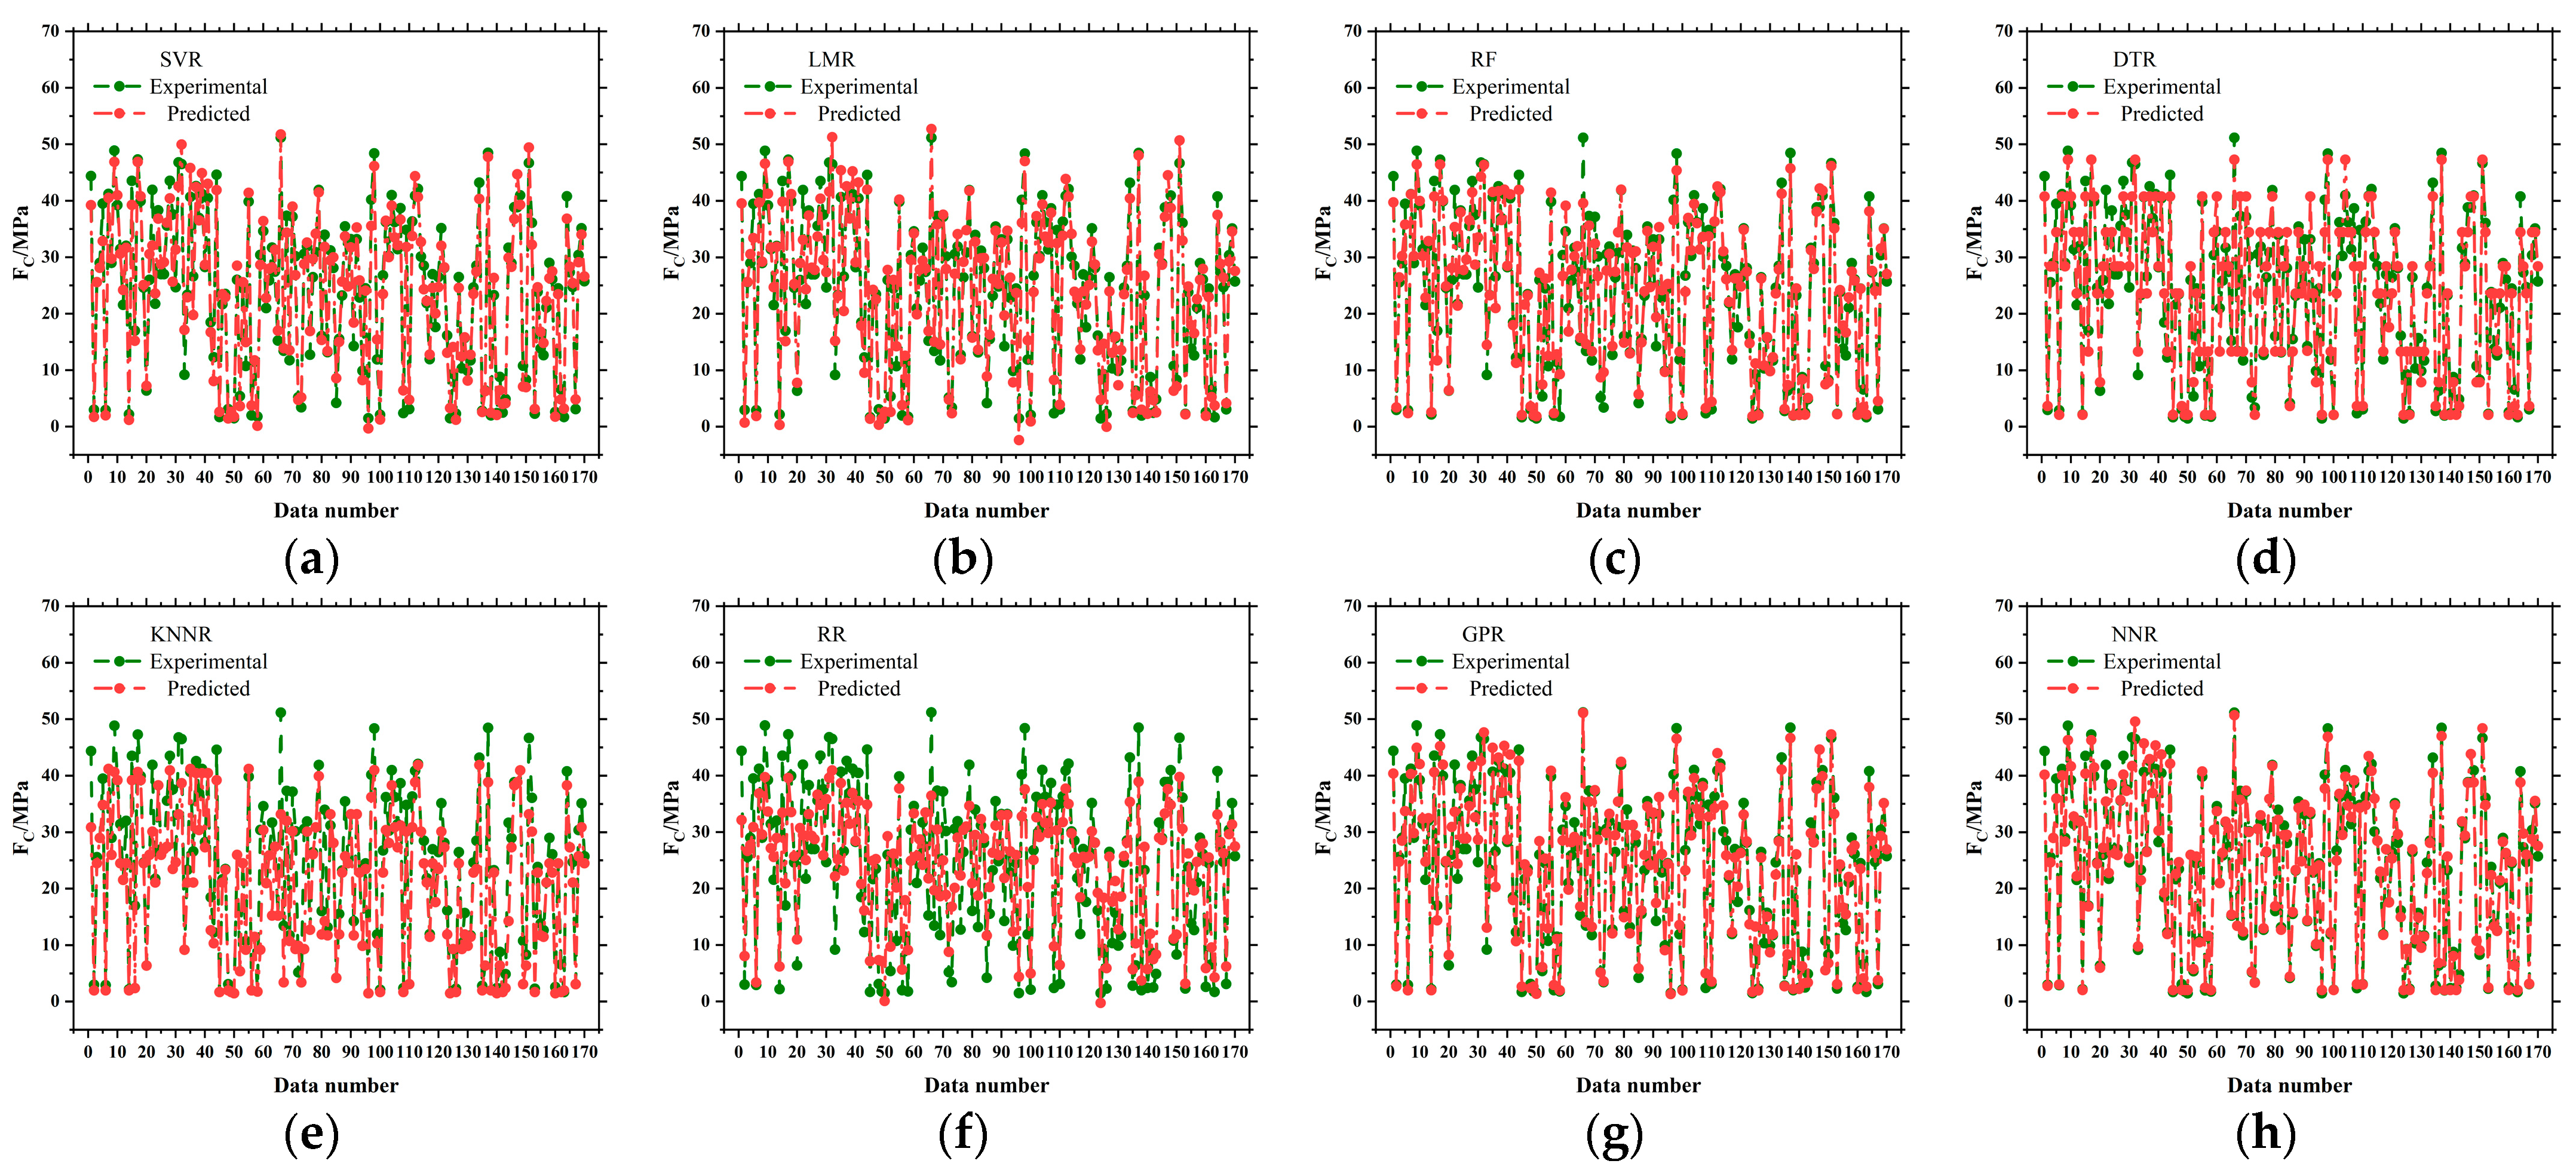
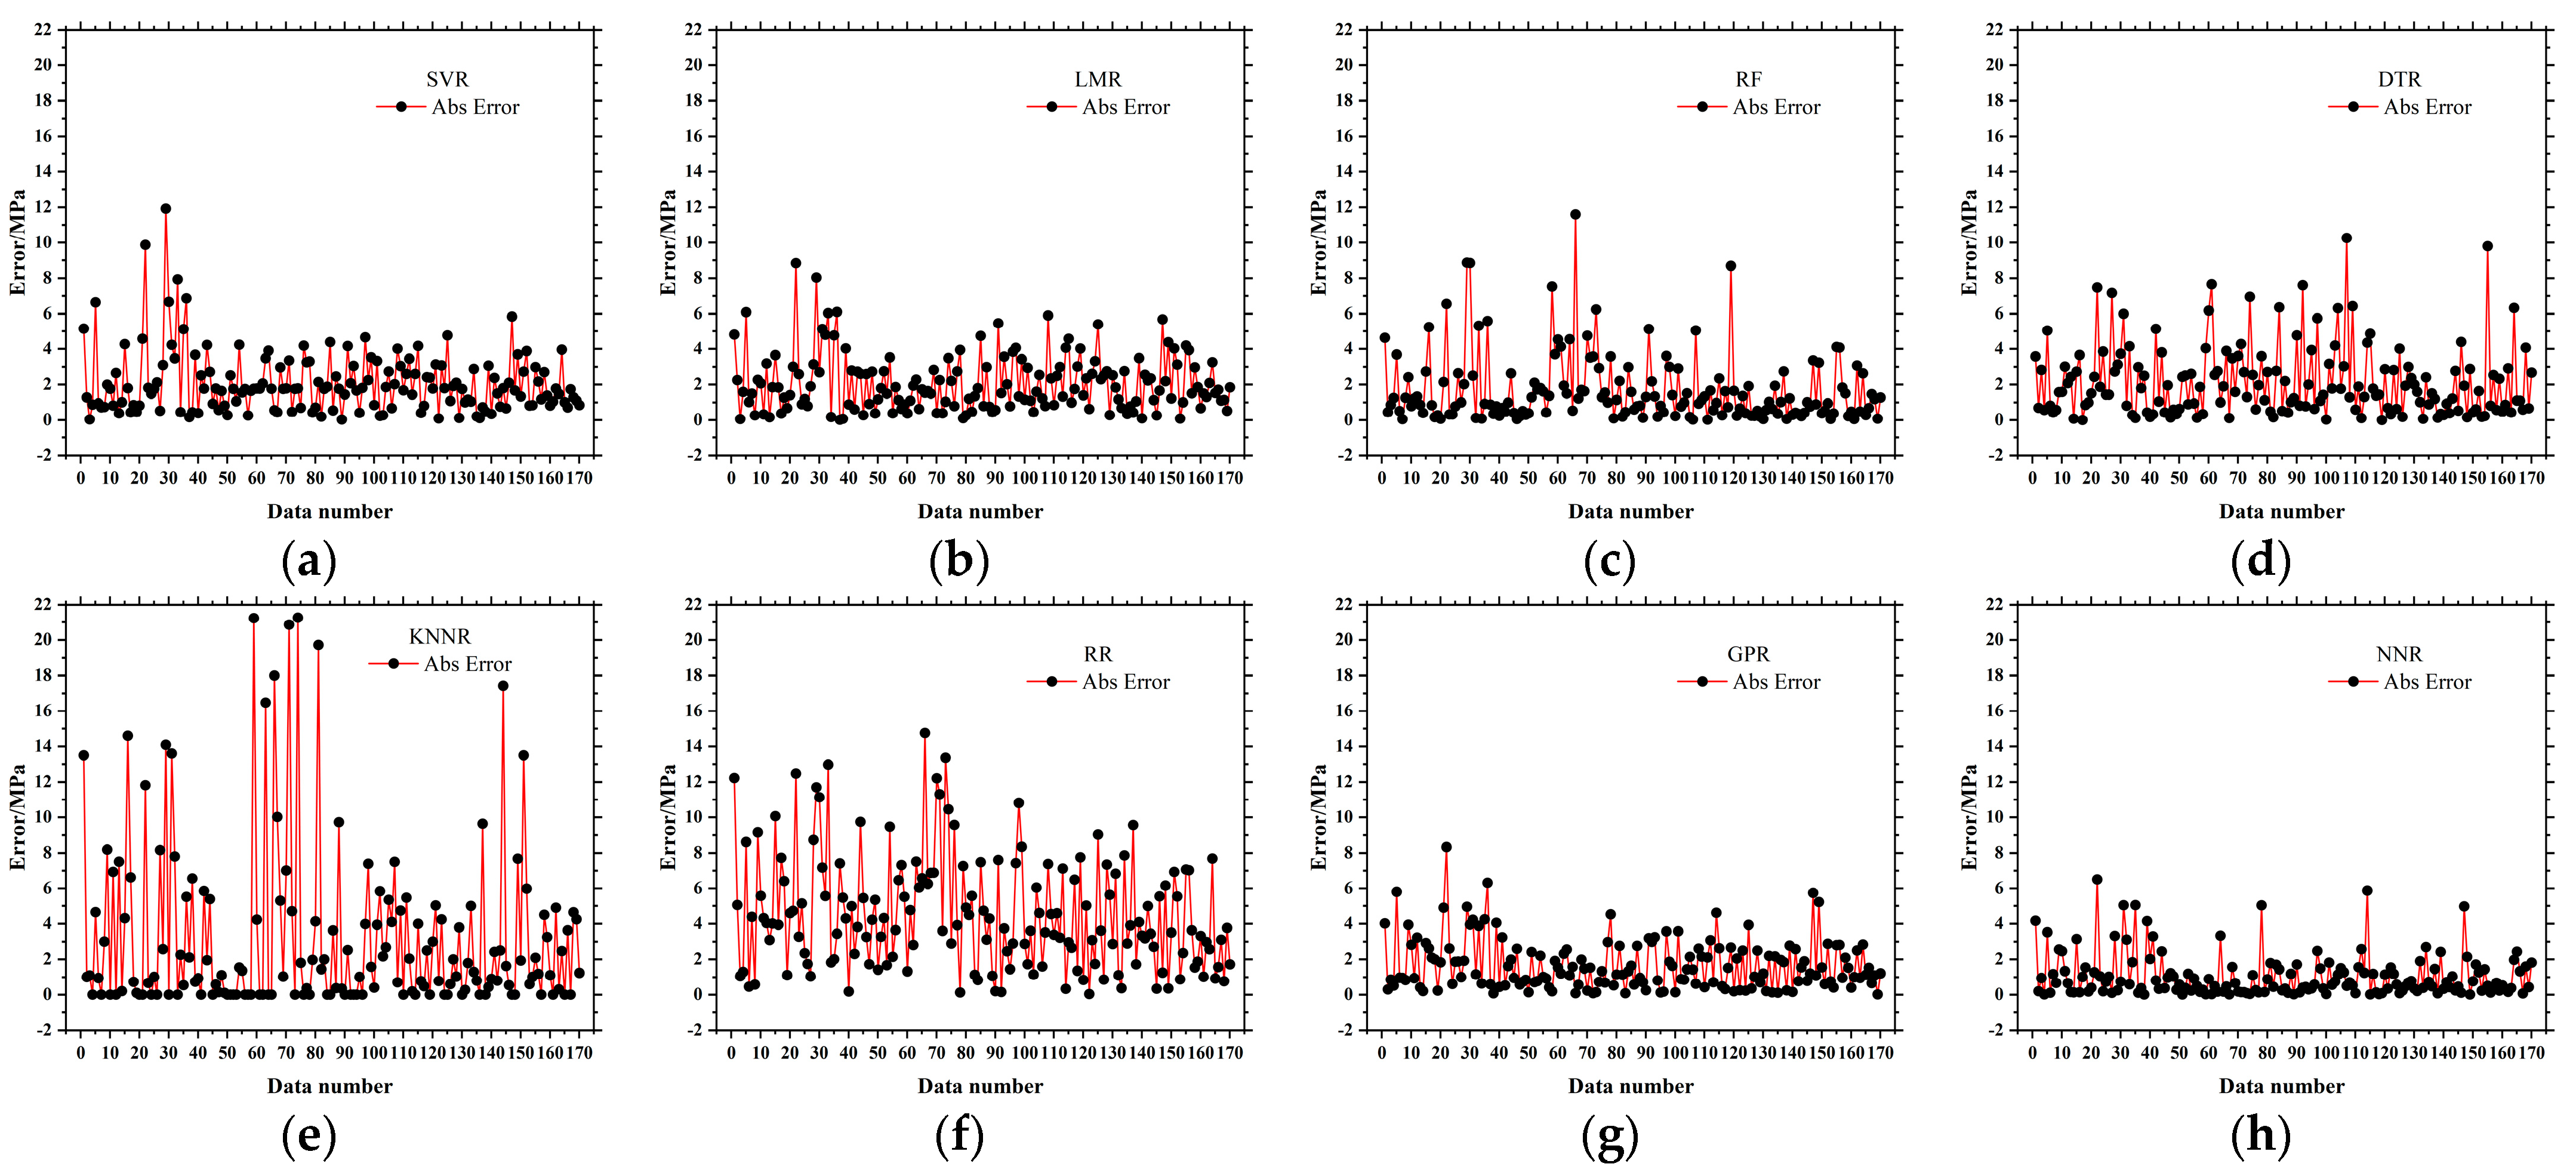
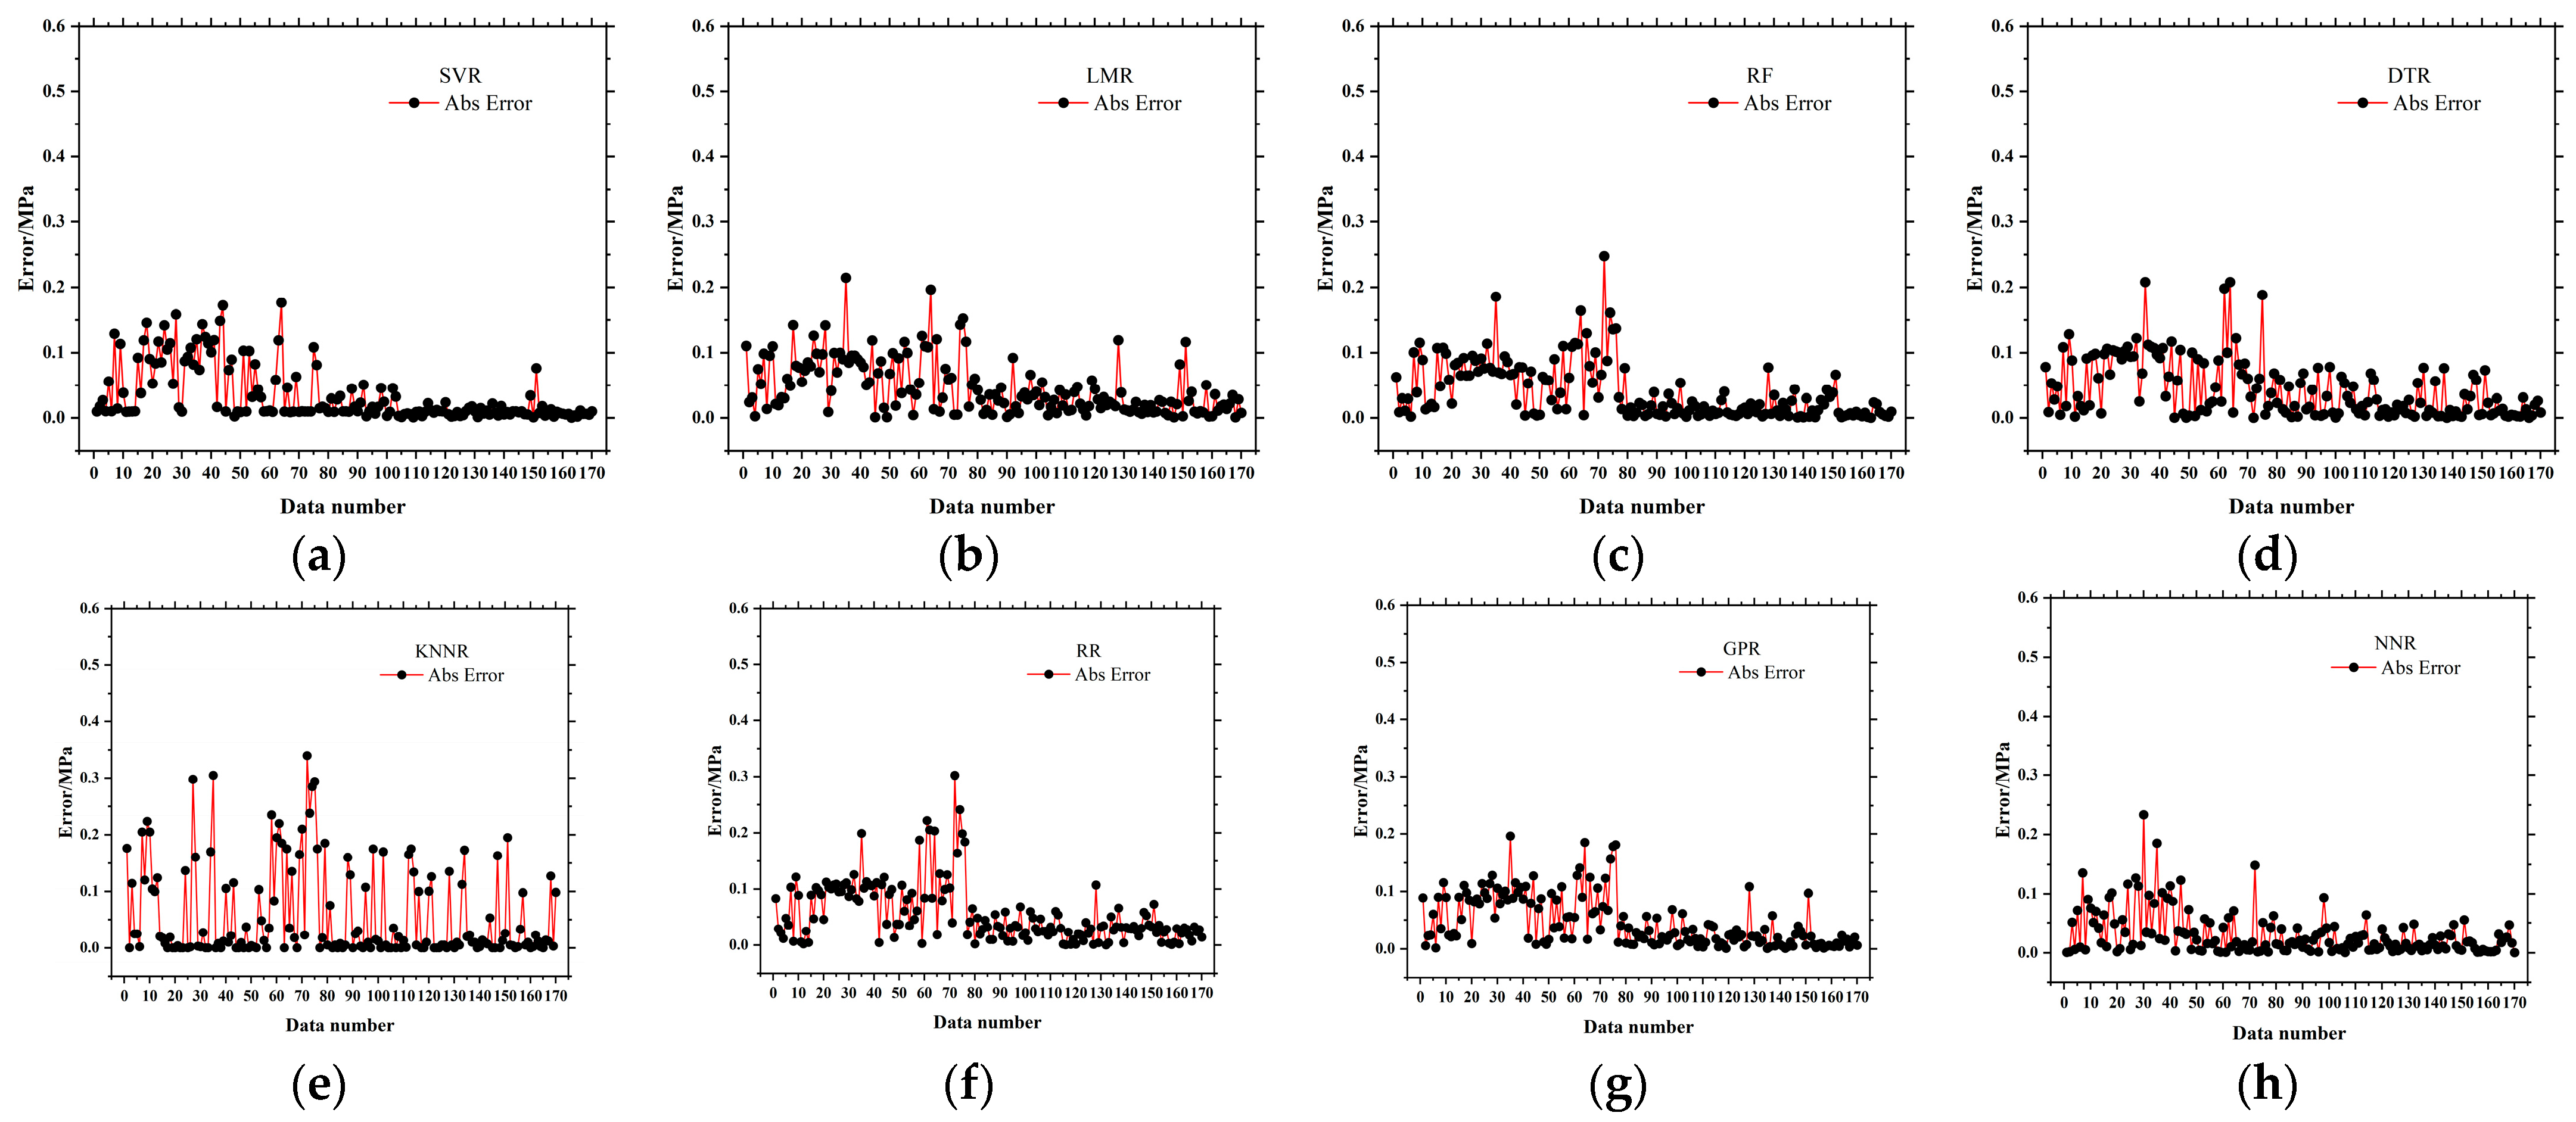
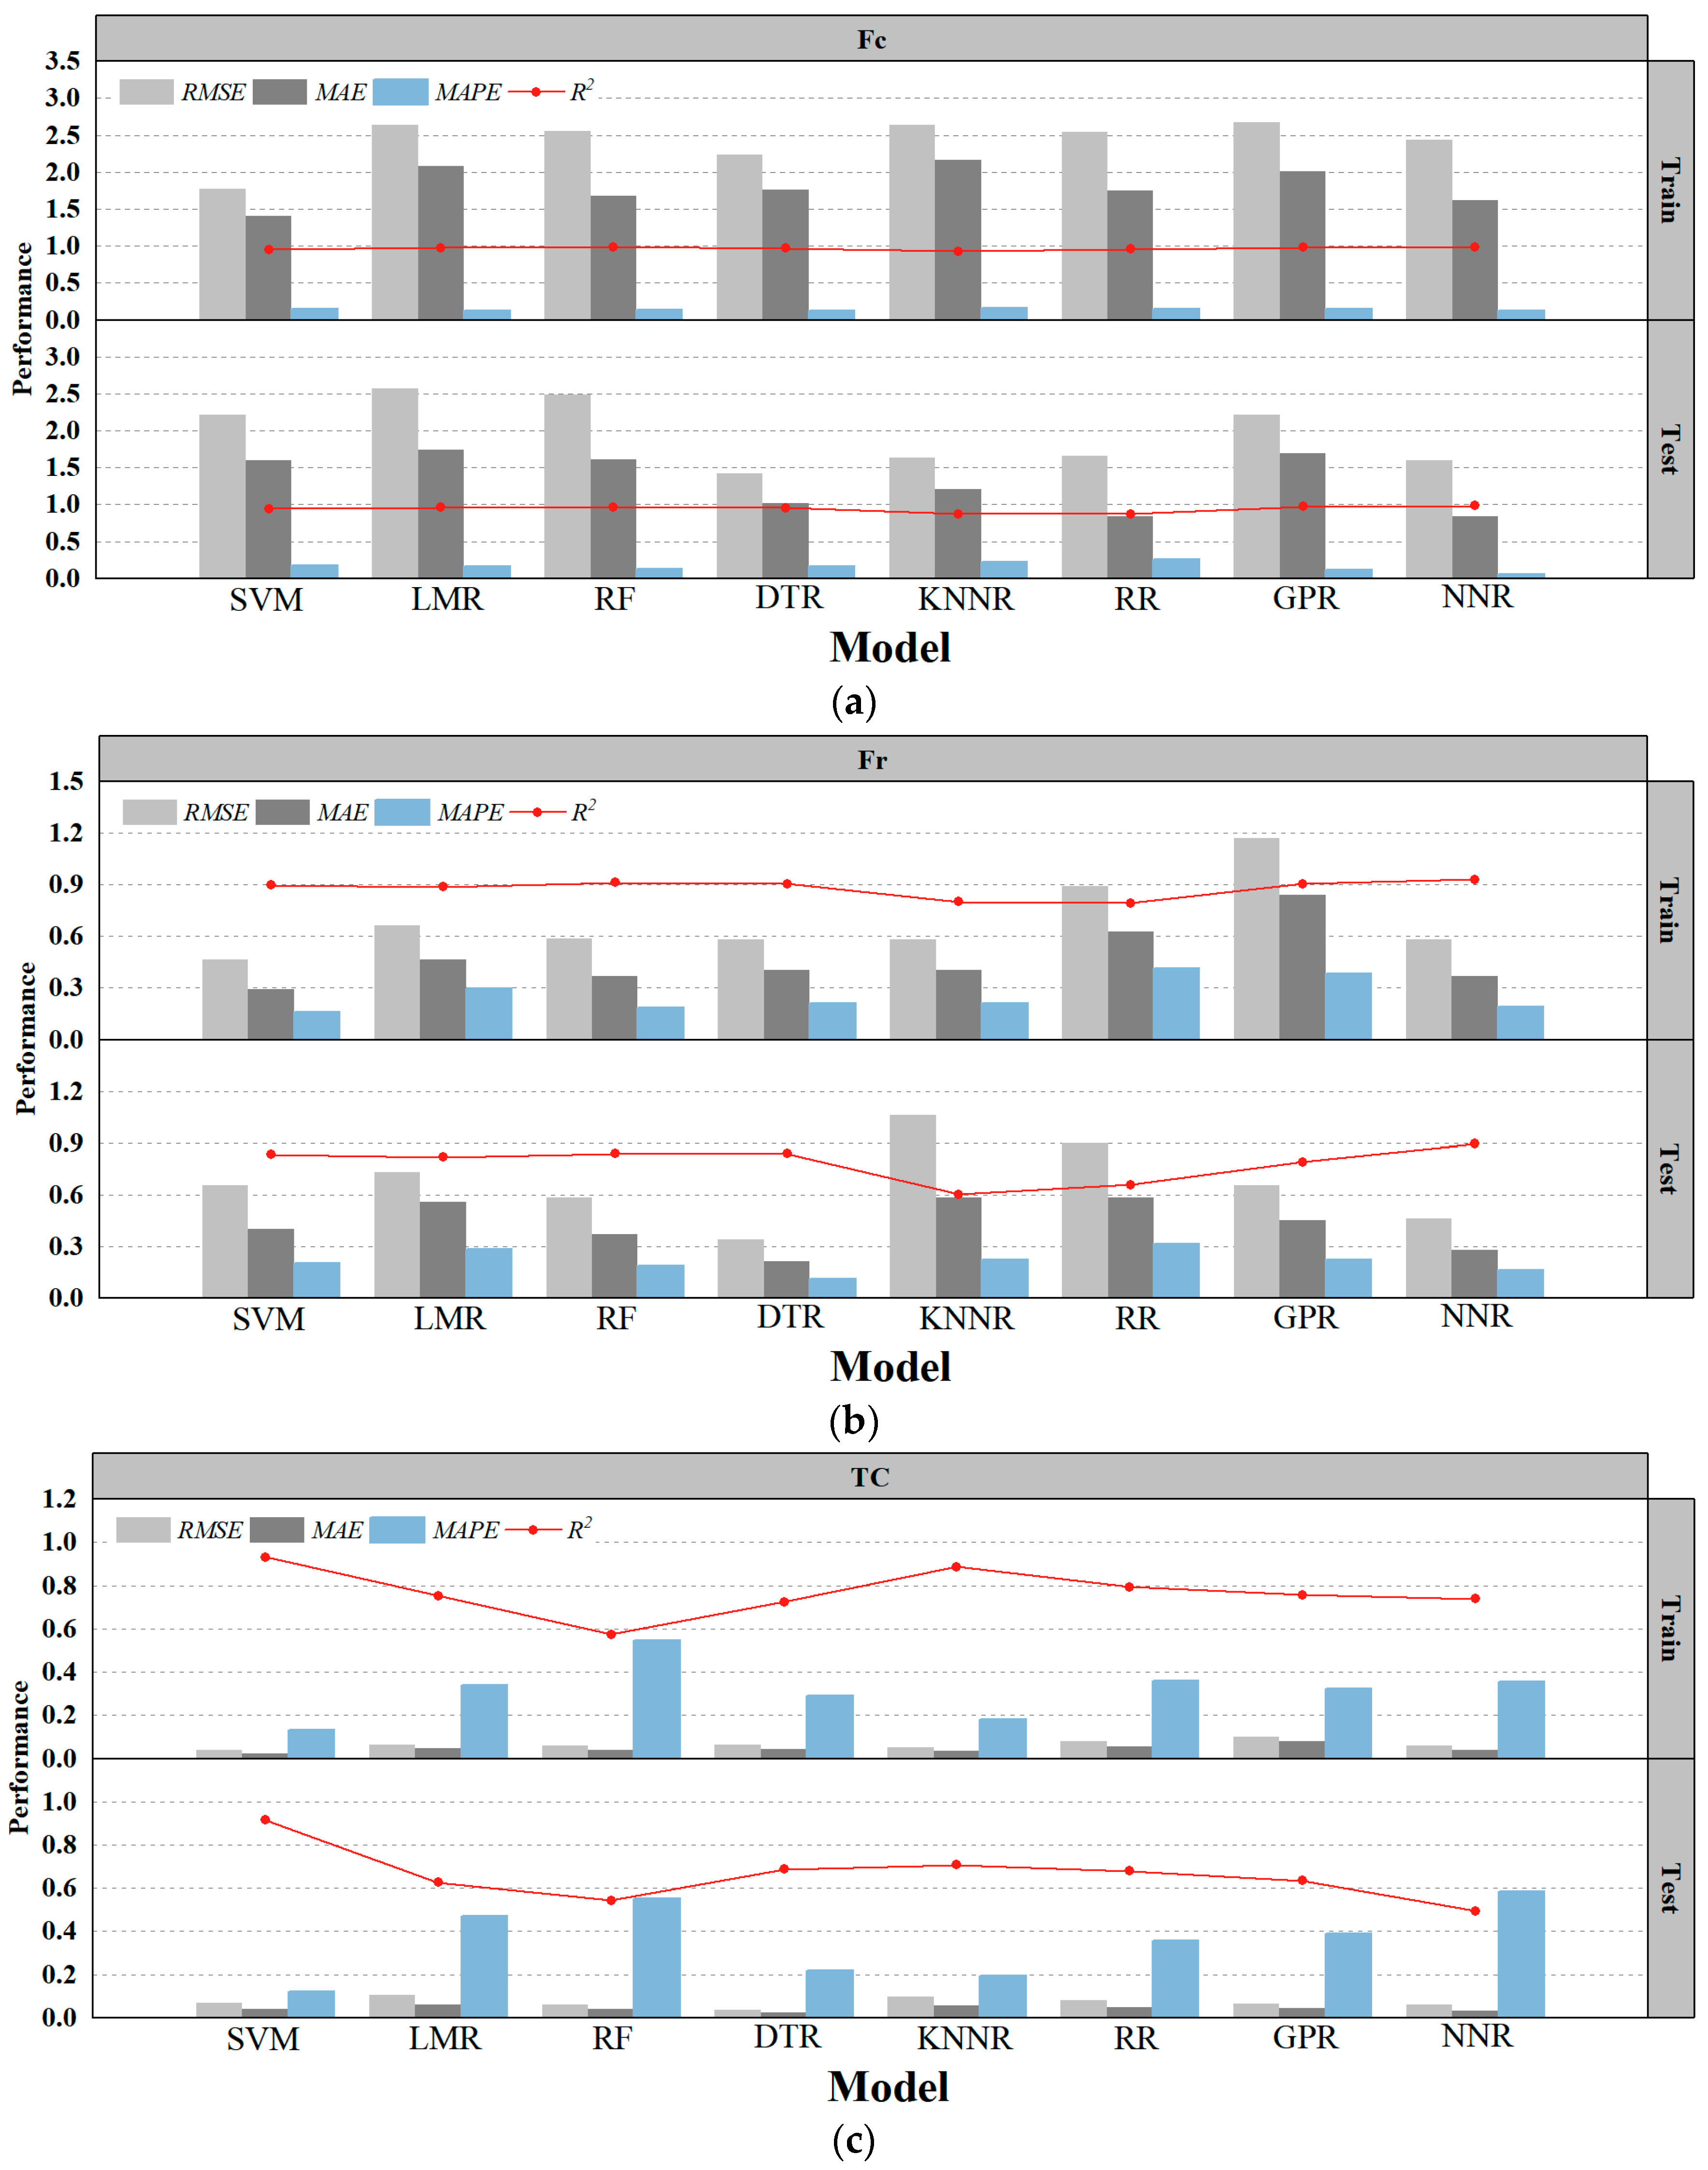
3.1. Machine Learning-Based Prediction of Compressive Strength

Based on the performance data of machine learning models in predicting compressive strength (Fc), a comprehensive evaluation of various algorithms was conducted. Figure 5 illustrates the relationship between experimentally measured values and machine learning (ML) predictions. In the training phase, NNR exhibited the best overall performance, achieving an R2 value of 0.9869, the highest among all models. Both RF and GPR also showed excellent predictive capabilities, with training R2 values of 0.9852 and 0.9802, respectively. In contrast, KNNR delivered the lowest correlation coefficient on the training set [95].
During the testing phase, the NNR model retained its superior performance, with a test R2 of 0.9855 and minimal decline compared to the training set, indicating strong generalization ability [96]. As shown in Figure 5, the NNR model predictions align closely with the diagonal reference line, indicating high accuracy and minimal bias. In contrast, the KNNR and LMR models display noticeable dispersion from the ideal line, particularly at the lower and upper extremes of compressive strength values, suggesting reduced generalization capacity.
The variation in performance between the training and testing models reveals key insights into their generalization characteristics [97]. Although RF reached a high training R2 of 0.9852, its test R2 dropped to 0.9625, suggesting a tendency toward overfitting. GPR showed slightly better performance on the test set (R2 = 0.9733) compared to the training set (R2 = 0.9802), which may imply suboptimal model convergence during training. Overall, NNR and DTR demonstrated the most stable and reliable predictive performance [98], particularly in the test phase, making them favorable choices for engineering applications involving compressive strength prediction. Future research should focus on parameter optimization and dataset expansion to validate their robustness. Statistically, the NNR model consistently delivered top-tier performance on both training and testing sets. It achieved exceptional R2 values of 0.9869 and 0.9855 under five-fold cross-validation, confirming its advantage [99,100].
Figure 6 offers a detailed comparison of the predicted and experimental compressive strengths. While the models exhibited high accuracy within the primary strength range of 20–50 MPa, significant systematic bias was observed in extreme regions. In the high-strength domain (>50 MPa), predictions were overestimated by approximately 5 MPa. Meanwhile, in the low-strength domain (<20 MPa), predictions were underestimated by approximately 2 MPa on average. These discrepancies may arise from several factors: (a) insufficient data samples in the extreme strength regions, which accounted for only 12% of the total dataset; (b) limited sensitivity of the models to the nonlinear hardening behavior of foamed concrete; and (c) excessive noise introduced by less influential input features [101,102]. Figure 6 highlights the absolute prediction errors between the measured and ML-predicted values. Figure 7 shows that NNR and DTR produce the lowest absolute errors across most data points, while RF and KNNR show larger error spikes, which may be due to their sensitivity to local variations or overfitting to small clusters of data.
The evident discrepancies observed may indicate the presence of overfitting. To address this issue and improve model generalization, several strategies can be considered. First, increasing the dataset size or incorporating additional samples can help reflect more underlying patterns [103,104]. Second, simplifying model configuration to reduce complexity is a viable approach, as overly complex models are prone to memorize noise artifacts rather than meaningful patterns [105].
A more detailed examination of Figure 5, Figure 6 and Figure 7 reveals distinct prediction behaviors across models. NNR consistently achieves high accuracy across the entire compressive strength range, with minimal over- or underestimation. DTR and RF perform well in the mid-strength region (20–50 MPa) but tend to overfit, as indicated by reduced accuracy on the test set. SVR underestimates high-strength values (>50 MPa), while GPR struggles with low-strength predictions (<20 MPa), though it improves in the mid-range. KNNR shows erratic predictions in low-strength regions due to sensitivity to sparse data, and LMR displays widespread error across all ranges, confirming its limited suitability for capturing nonlinear trends. These patterns underscore the varying strengths and weaknesses of each model depending on the data distribution.

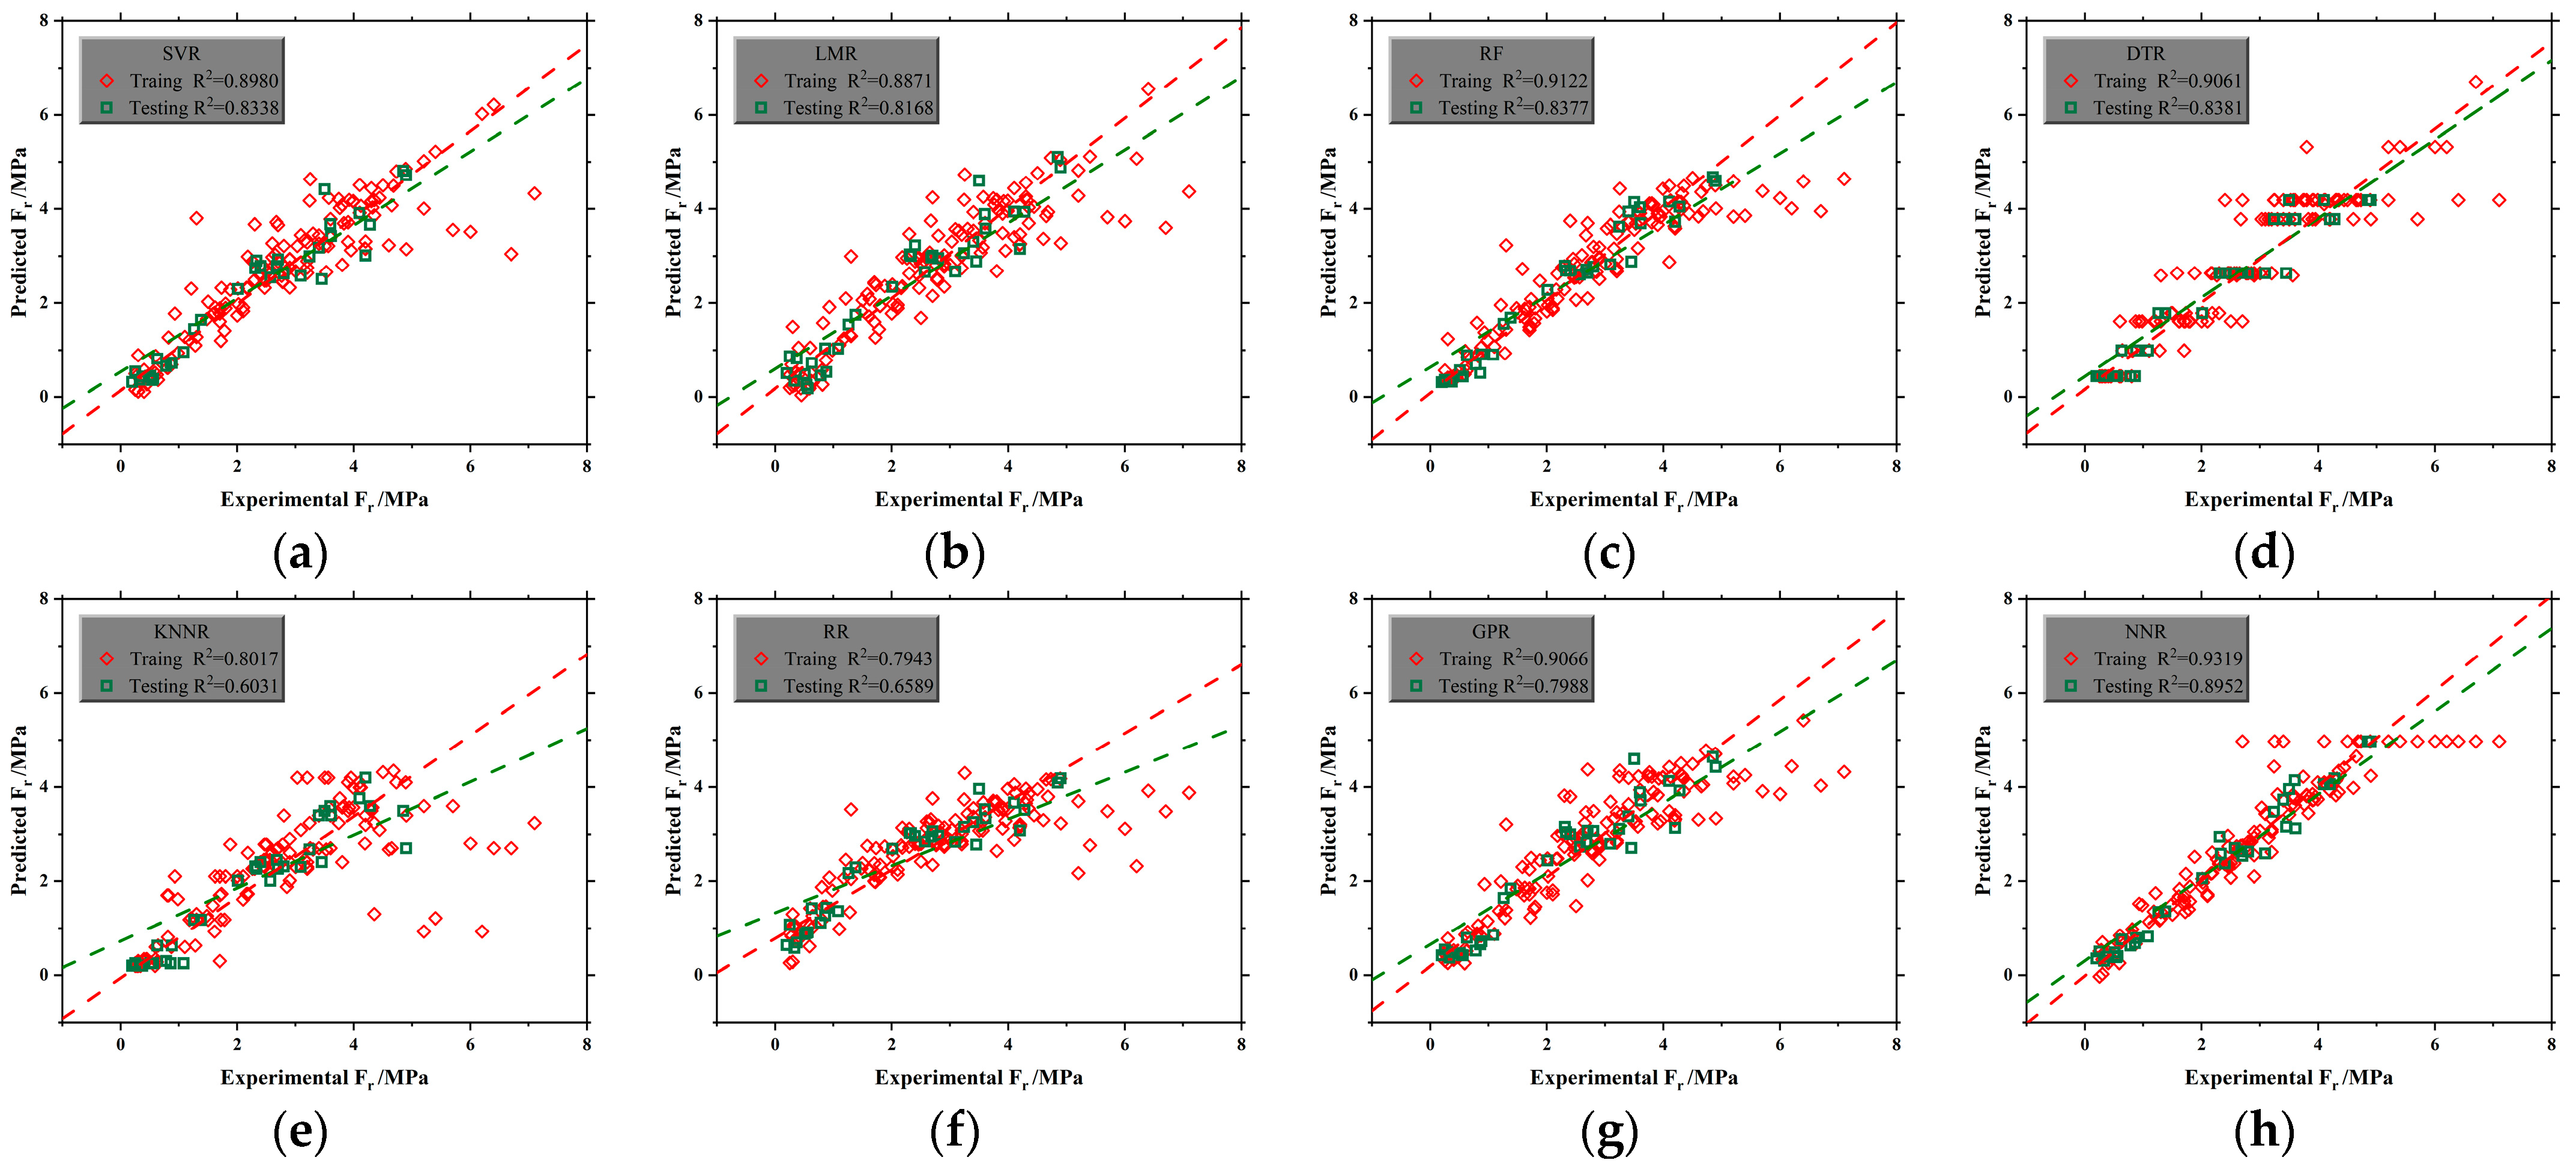
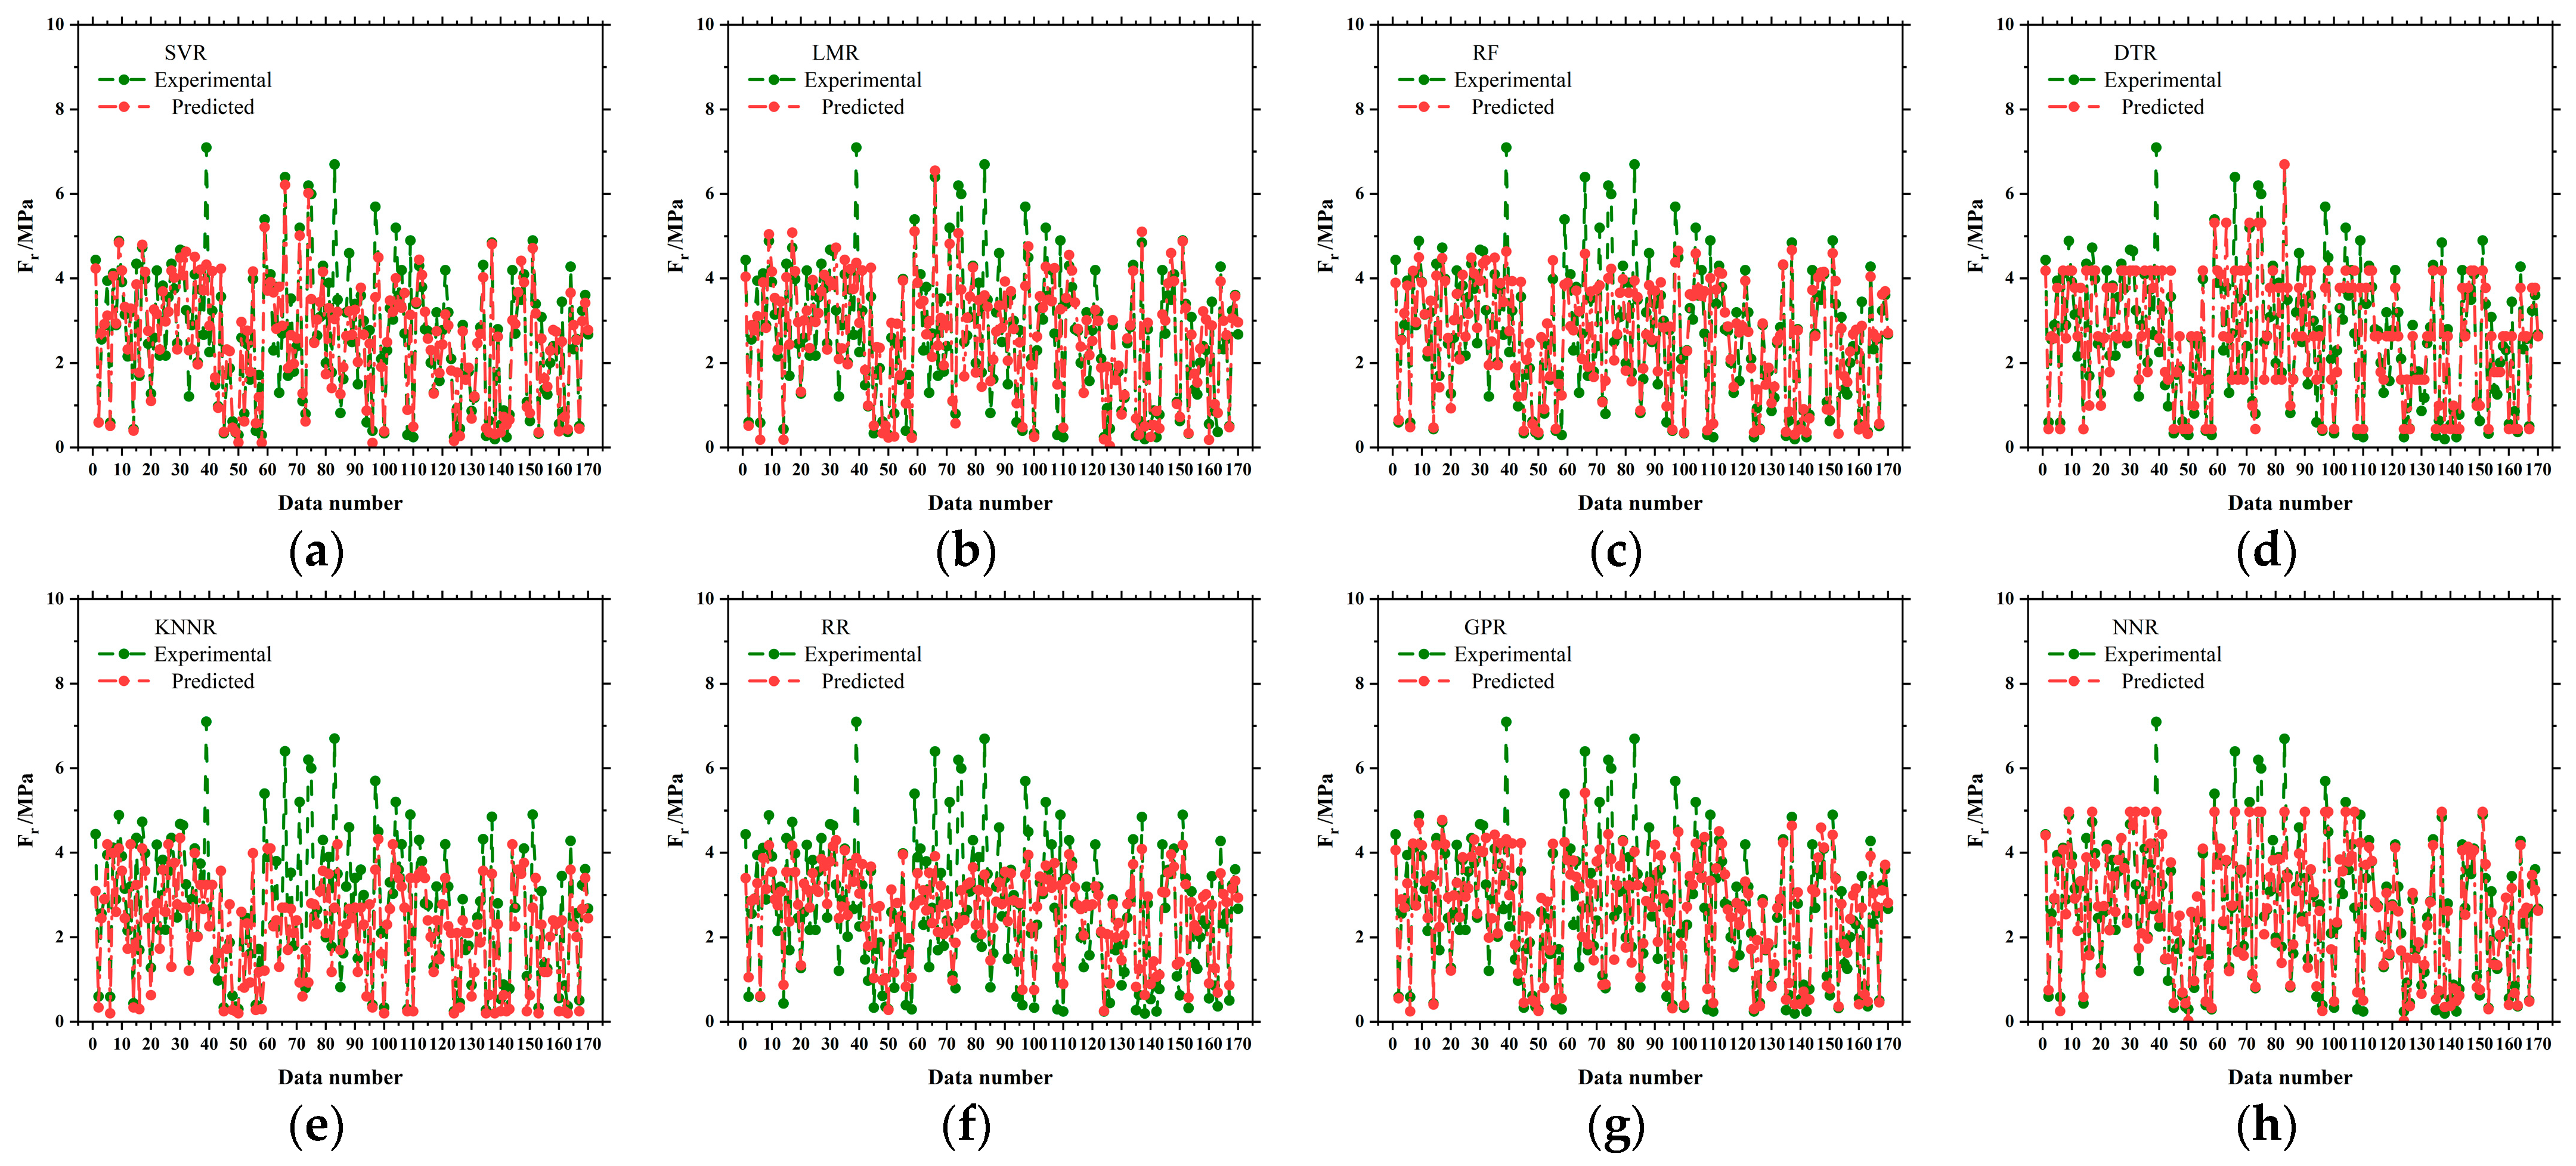
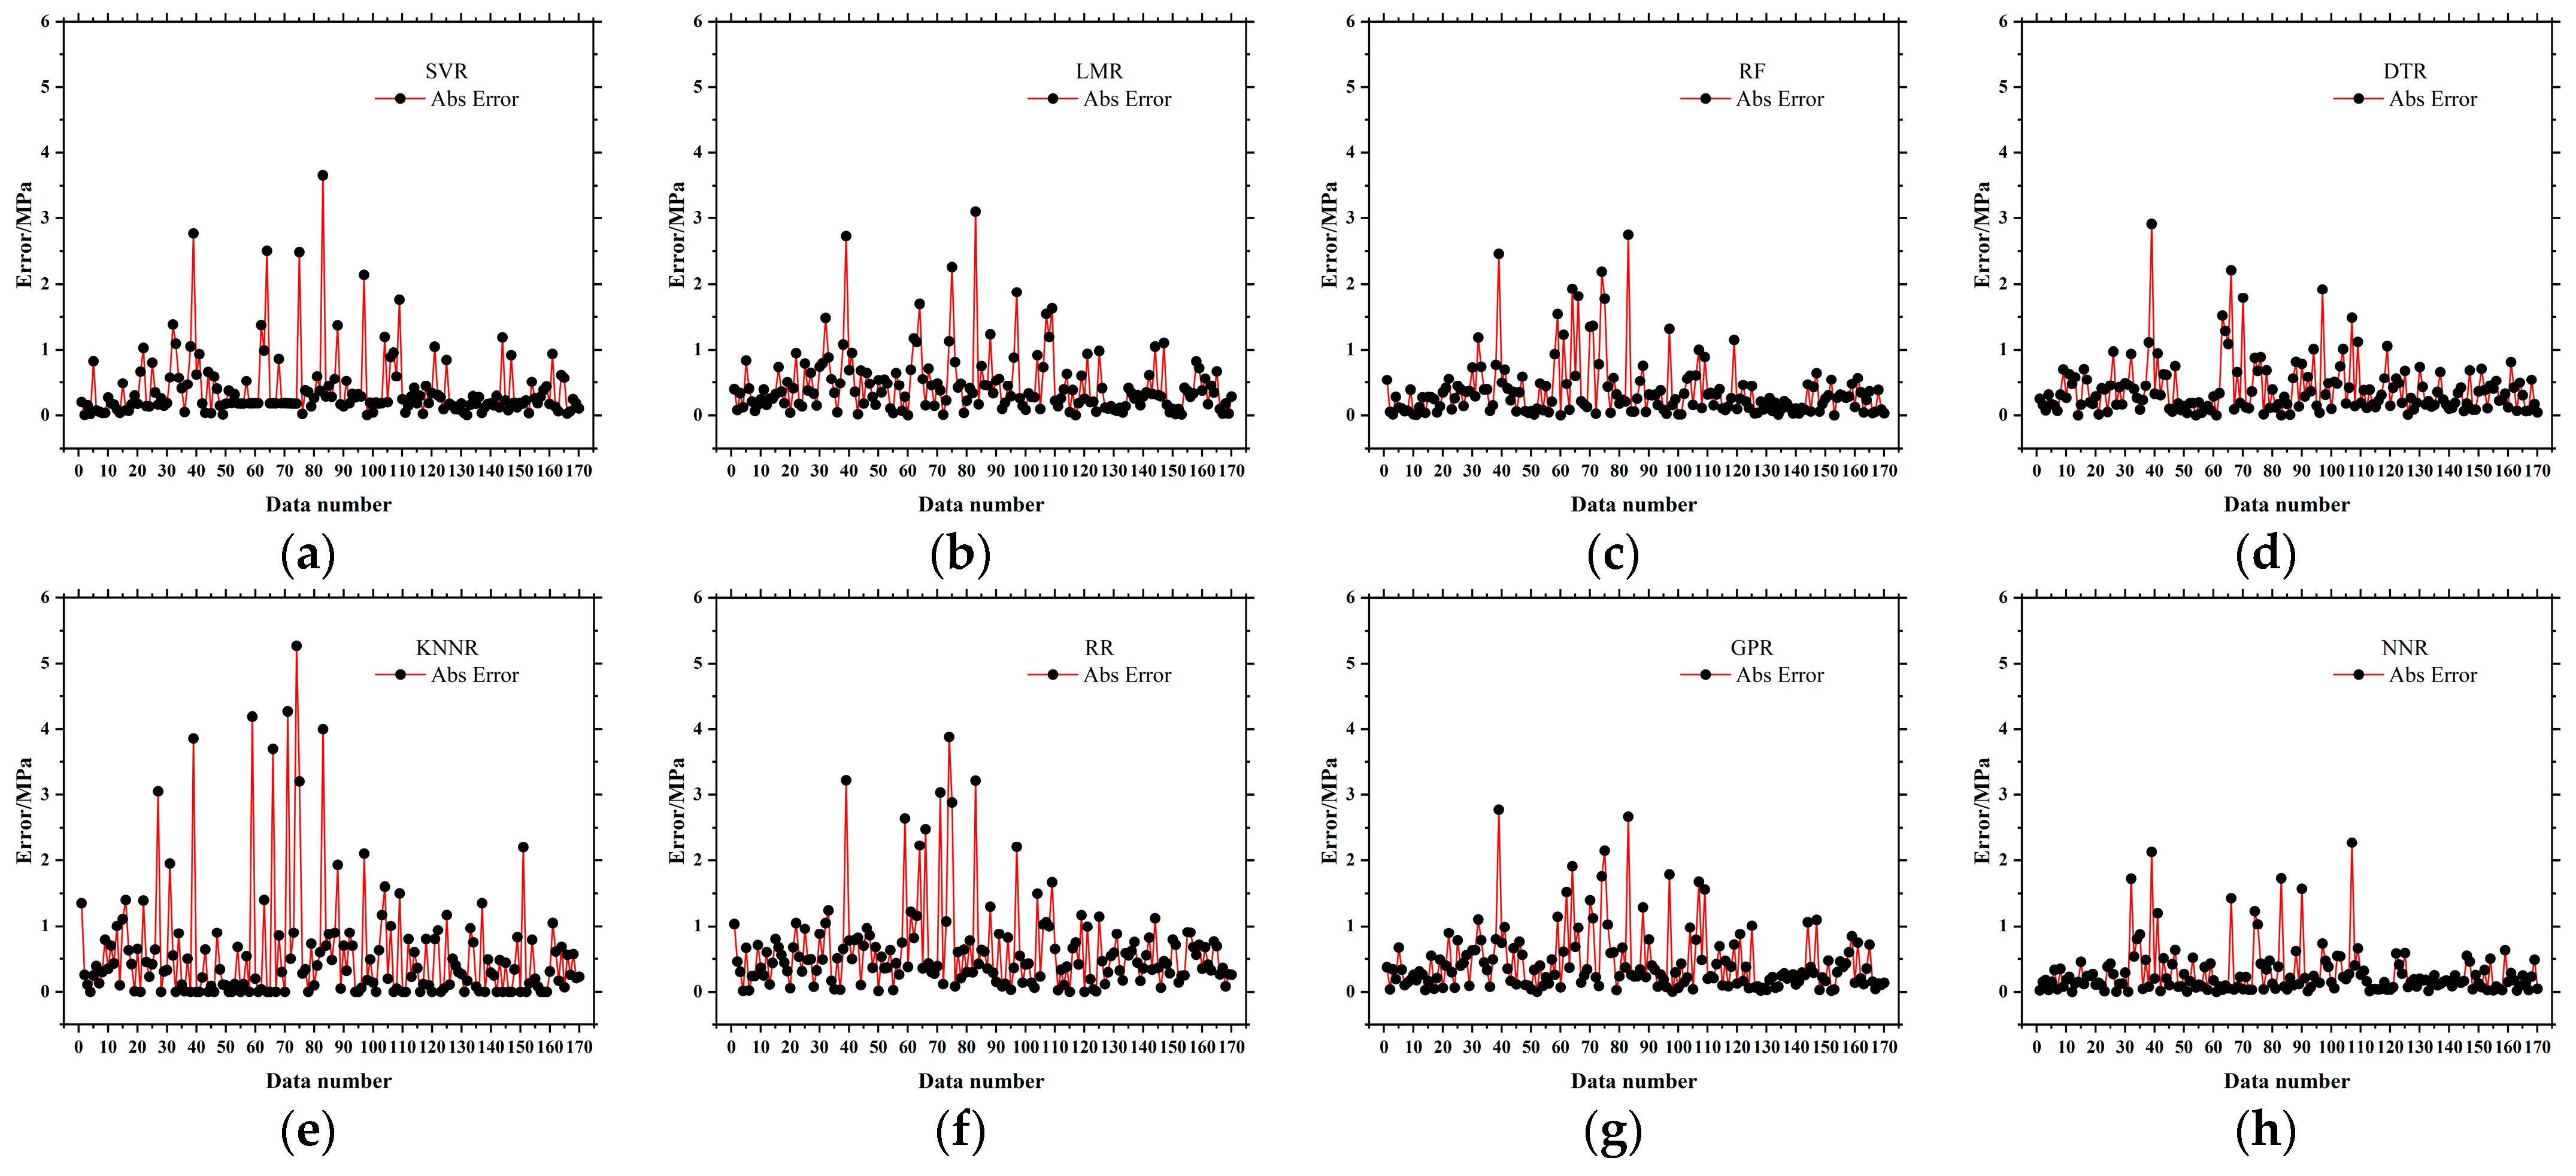
3.2. Machine Learning-Based Prediction of Flexural Strength

Figure 8 delivers the relationship between the actual measured flexural strength values and the machine learning (ML) predicted values. According to the findings of the training set, the NNR model demonstrates the best overall performance, achieving an R2 of 0.9319. The RF model ranks second, with an R2 of 0.9122. Both the DTR and KNNR models exhibit similar performance on the training set [106], while RR attains the worst with the lowest R2. During the testing phase, the NNR model continues to maintain optimal prediction performance, showcasing good generalization capability [107,108]. The DTR model significantly improves in the testing set, becoming the algorithm with the least absolute error. In contrast, the KNNR and RR models demonstrate a noticeable decline in performance on the testing set. Figure 9 conducts a comparative analysis between the actual measured compressive strength values of foam concrete and the machine learning predicted values. Figure 10 displays the absolute error values between the actual measurements and the ML predictions. Error analysis reveals that the RF model exhibits significant overfitting, while the GPR model maintains relative stability. The SVM model demonstrates excellent generalization capabilities. By comparing the performance differences between the training and testing sets [108,109,110], it is observed that the RF model shows clear overfitting, with an R2 of 0.9122 in the training set dropping to 0.8377 in the testing set. The R2 of the GPR model’s testing set is slightly lower than the training set, yet it remains relatively stable [110]. The SVM model exhibits good generalization capability [111], with a training and testing R2 difference of only 0.0642. Based on the combined evaluation of absolute error and correlation coefficients, it is recommended to prioritize the NNR and DTR models for practical engineering applications [112]. Meanwhile, optimizing the parameters of KNNR and RR models was required to improve their predictive performance. The NNR model consistently delivers accurate predictions across both low and high strength ranges, reflecting strong generalization. In contrast, the RF model performs well on the training set but shows signs of overfitting. The DTR model demonstrates a noticeable improvement during testing, especially in mid-to-high strength predictions, suggesting better adaptability. Conversely, the KNNR and RR models exhibit increased prediction error in both extremes of the strength range, indicating limited robustness. The GPR model provides relatively stable performance but slightly underestimates at the low-strength end. Meanwhile, the SVM model shows balanced behavior with minimal over- or underestimation, especially across moderate strength values, supporting its generalization capability. Overall, NNR and DTR offer the most reliable performance across the full range of values.

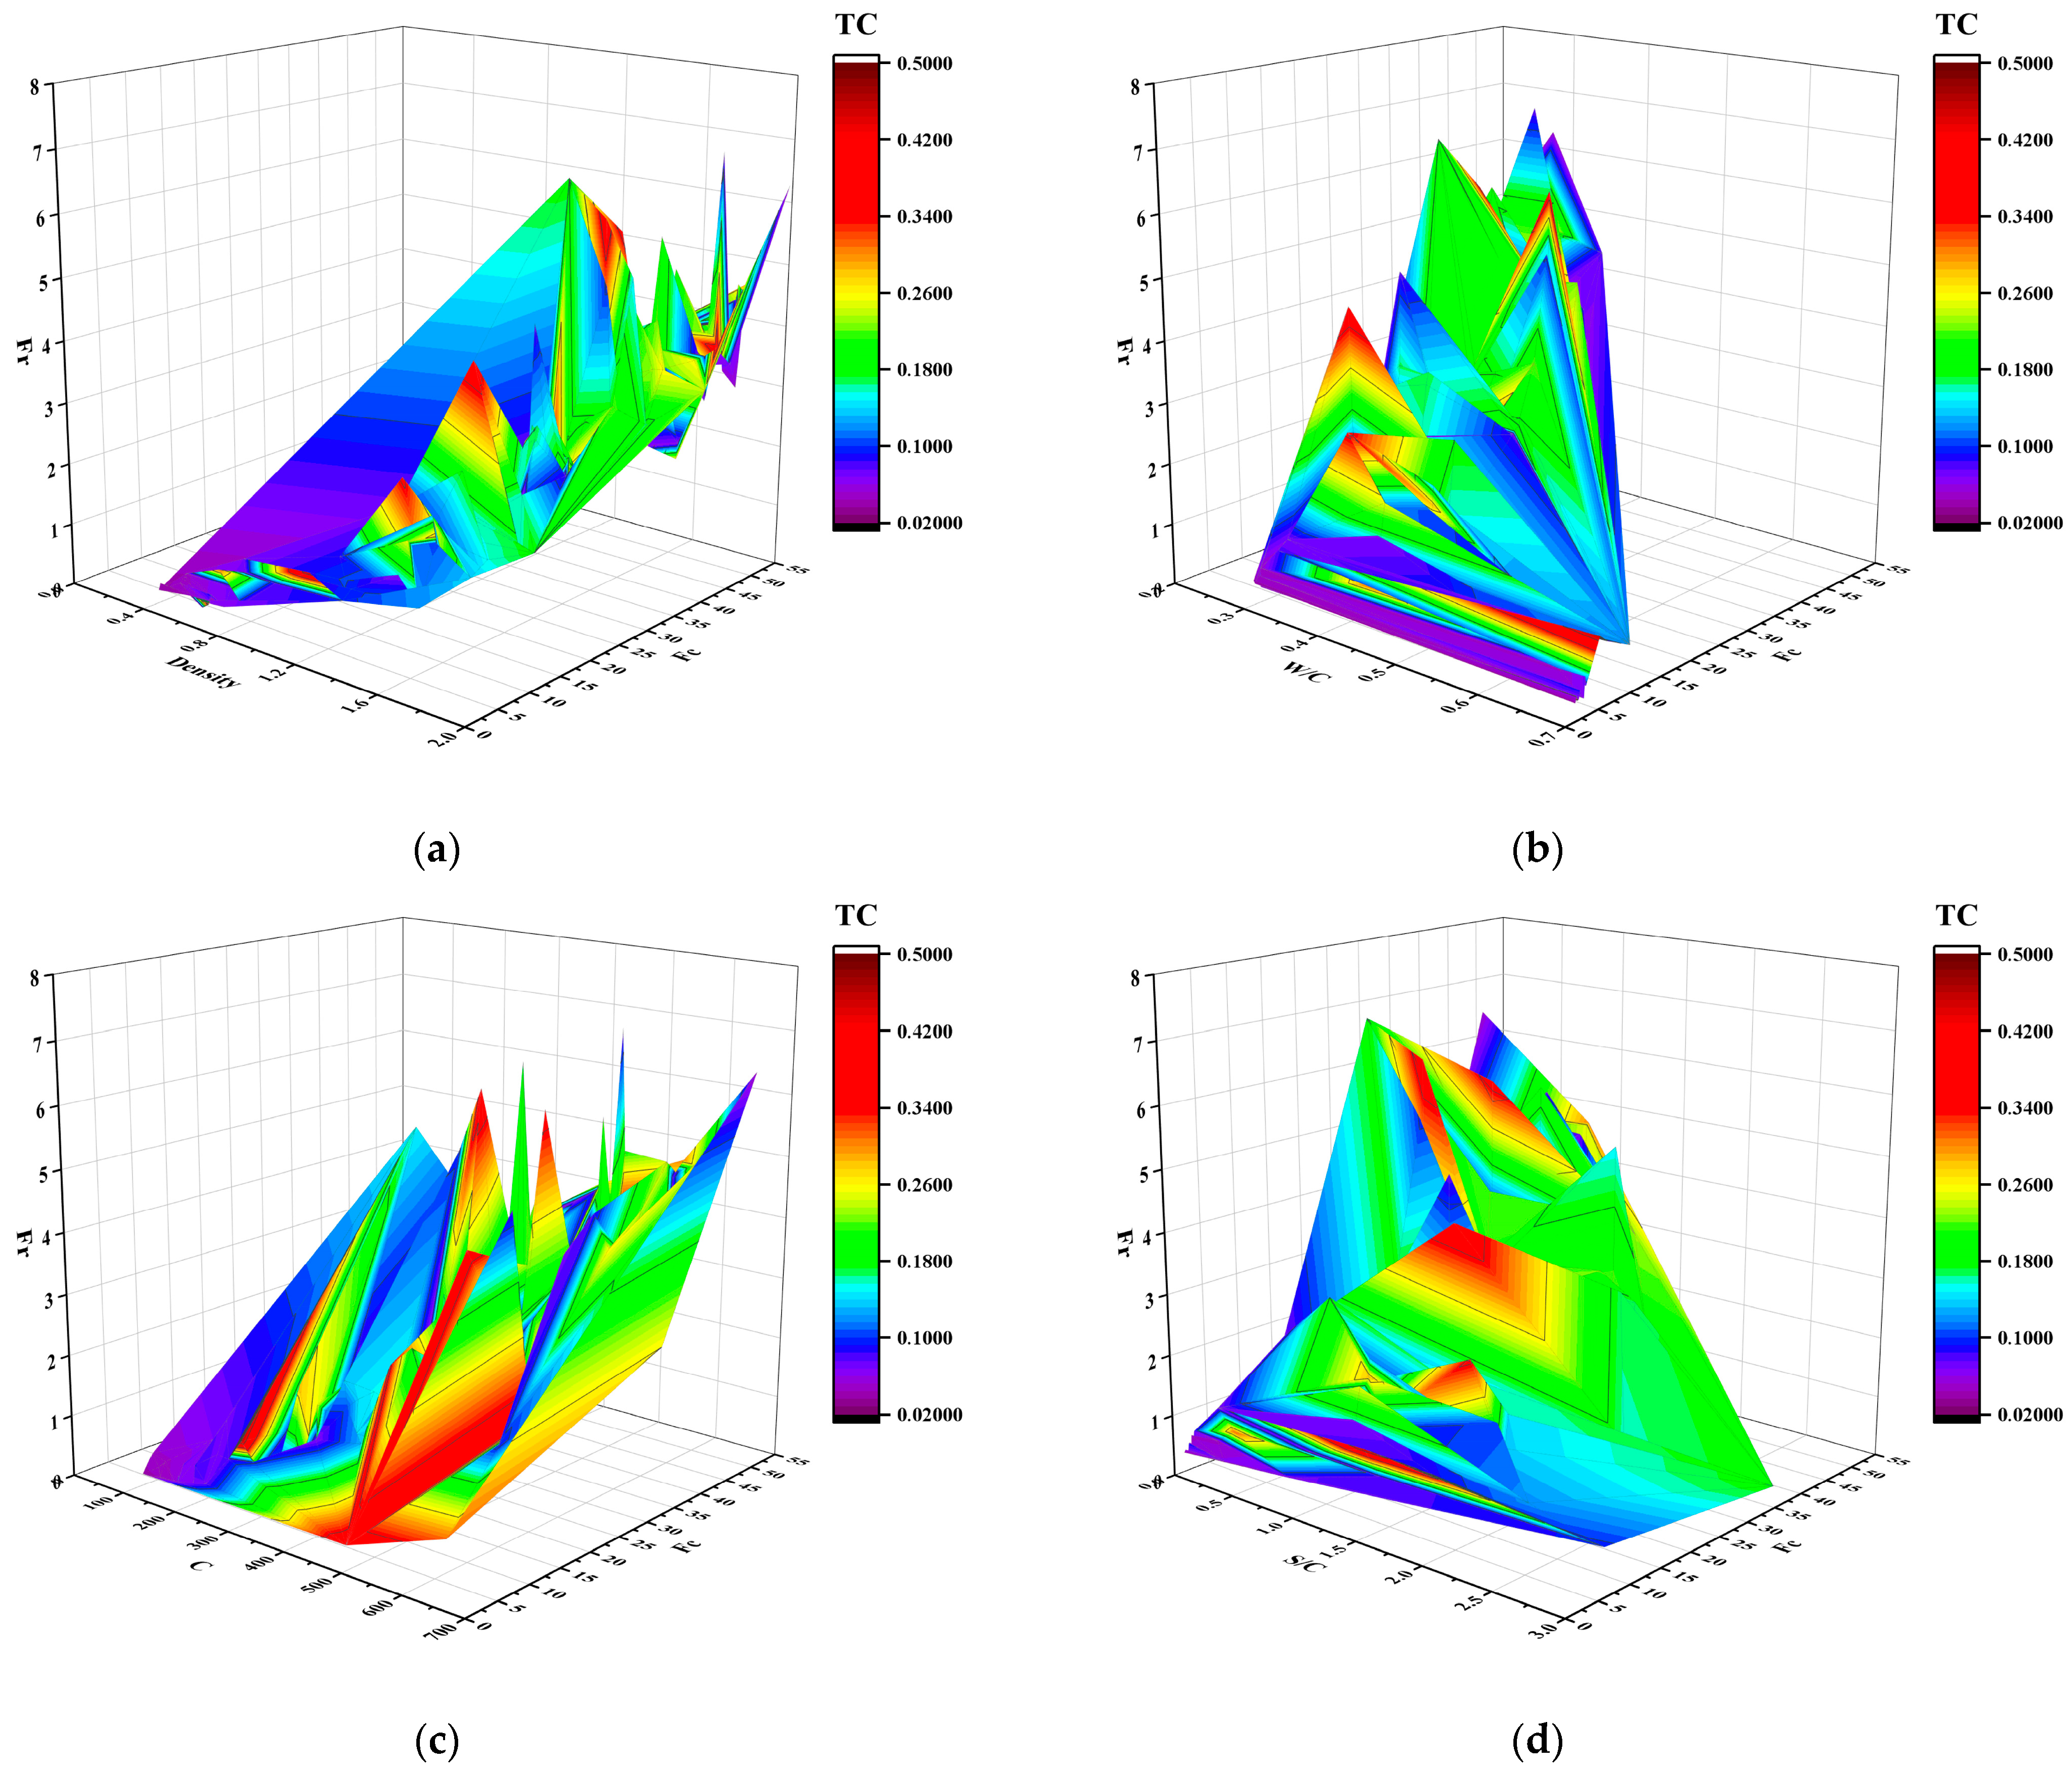
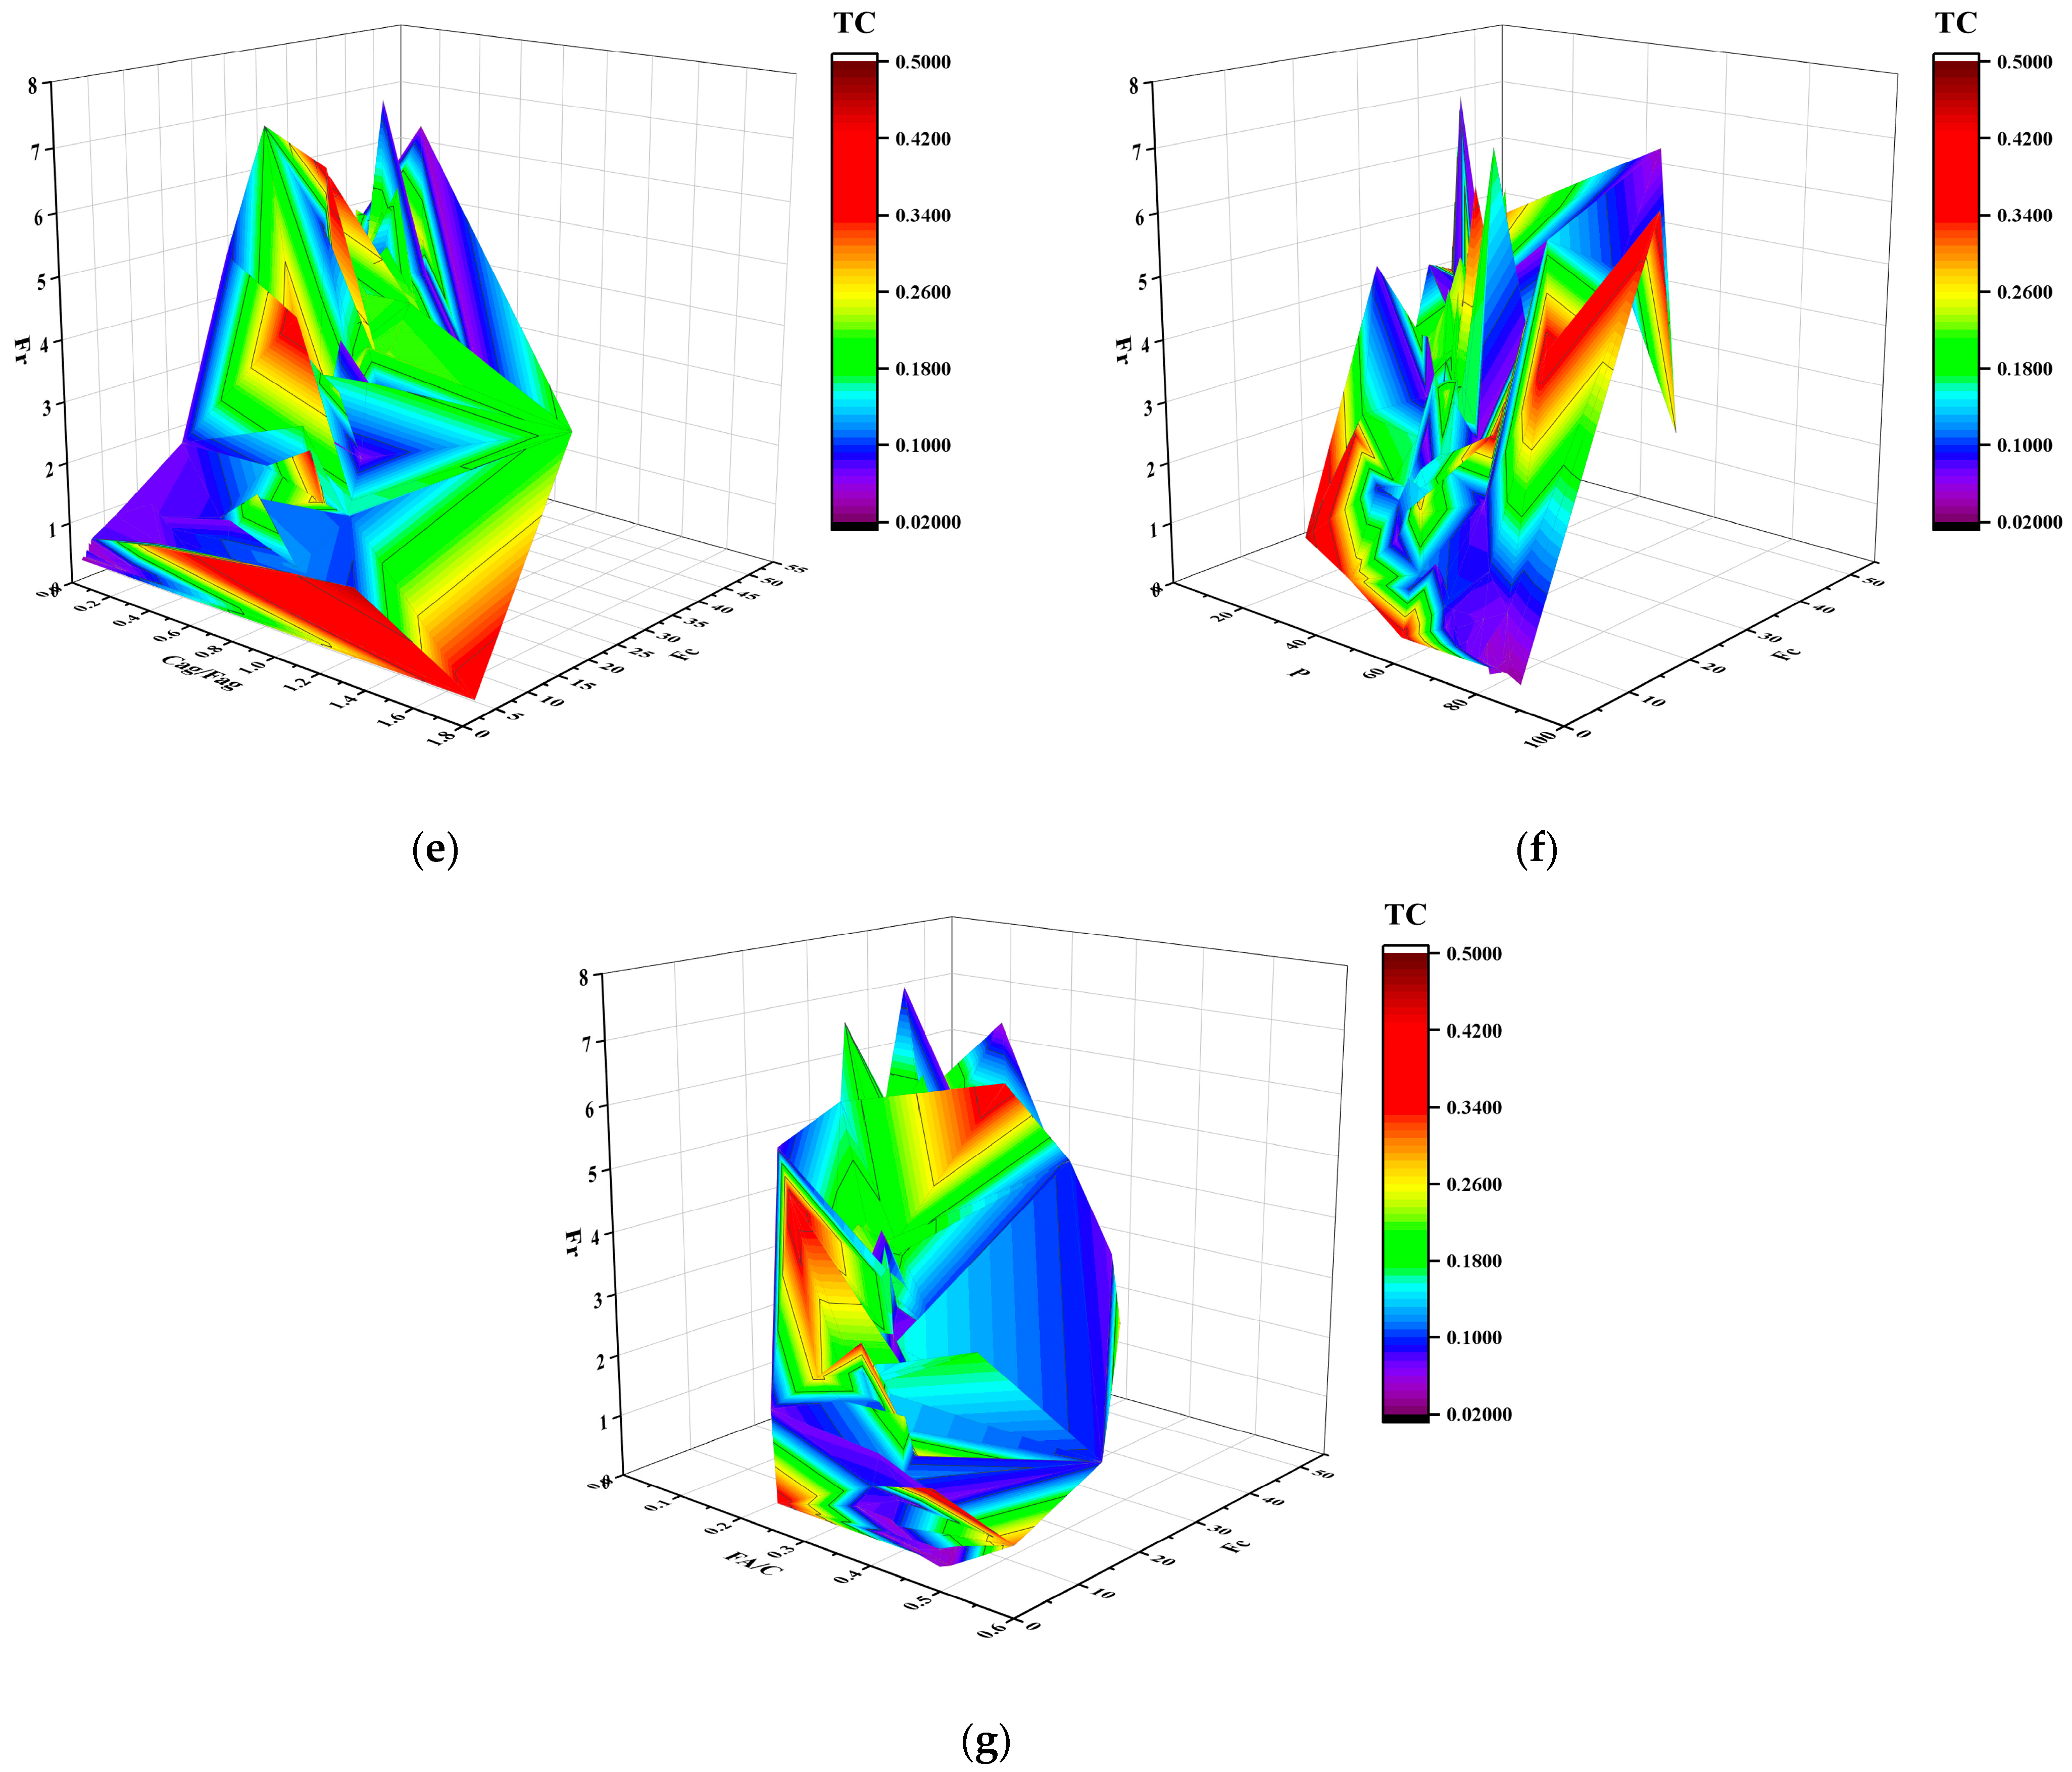
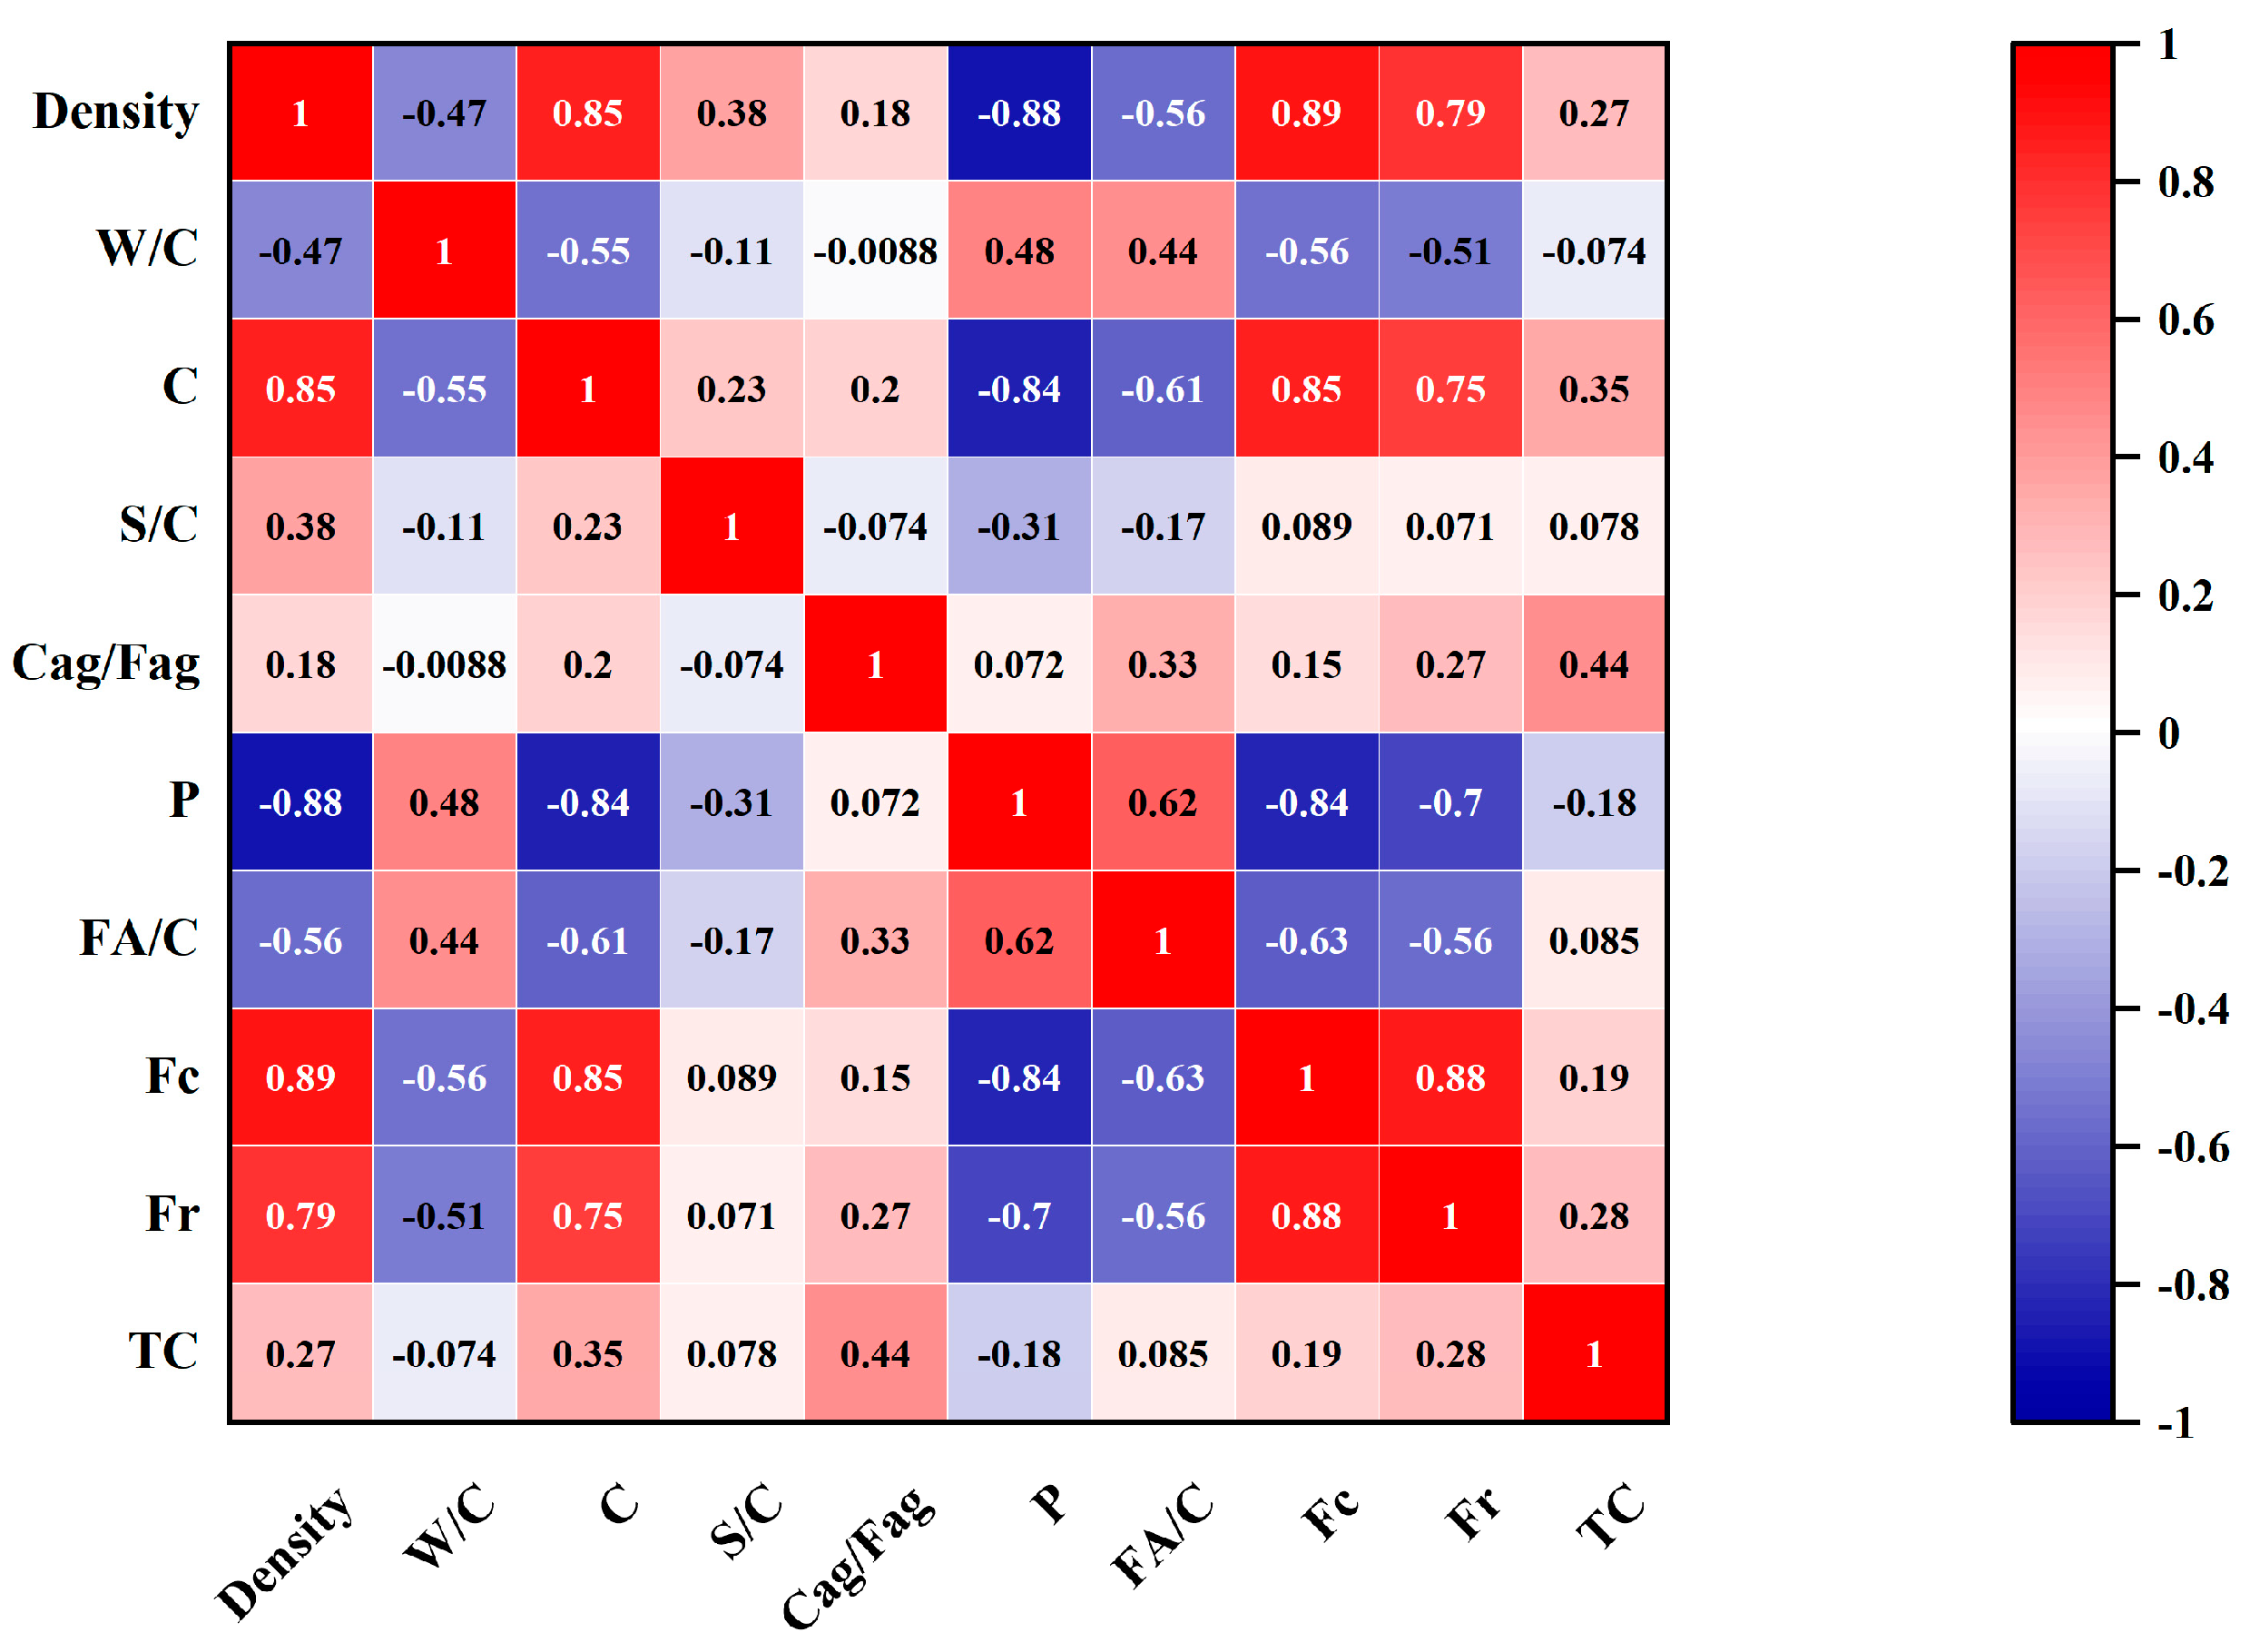
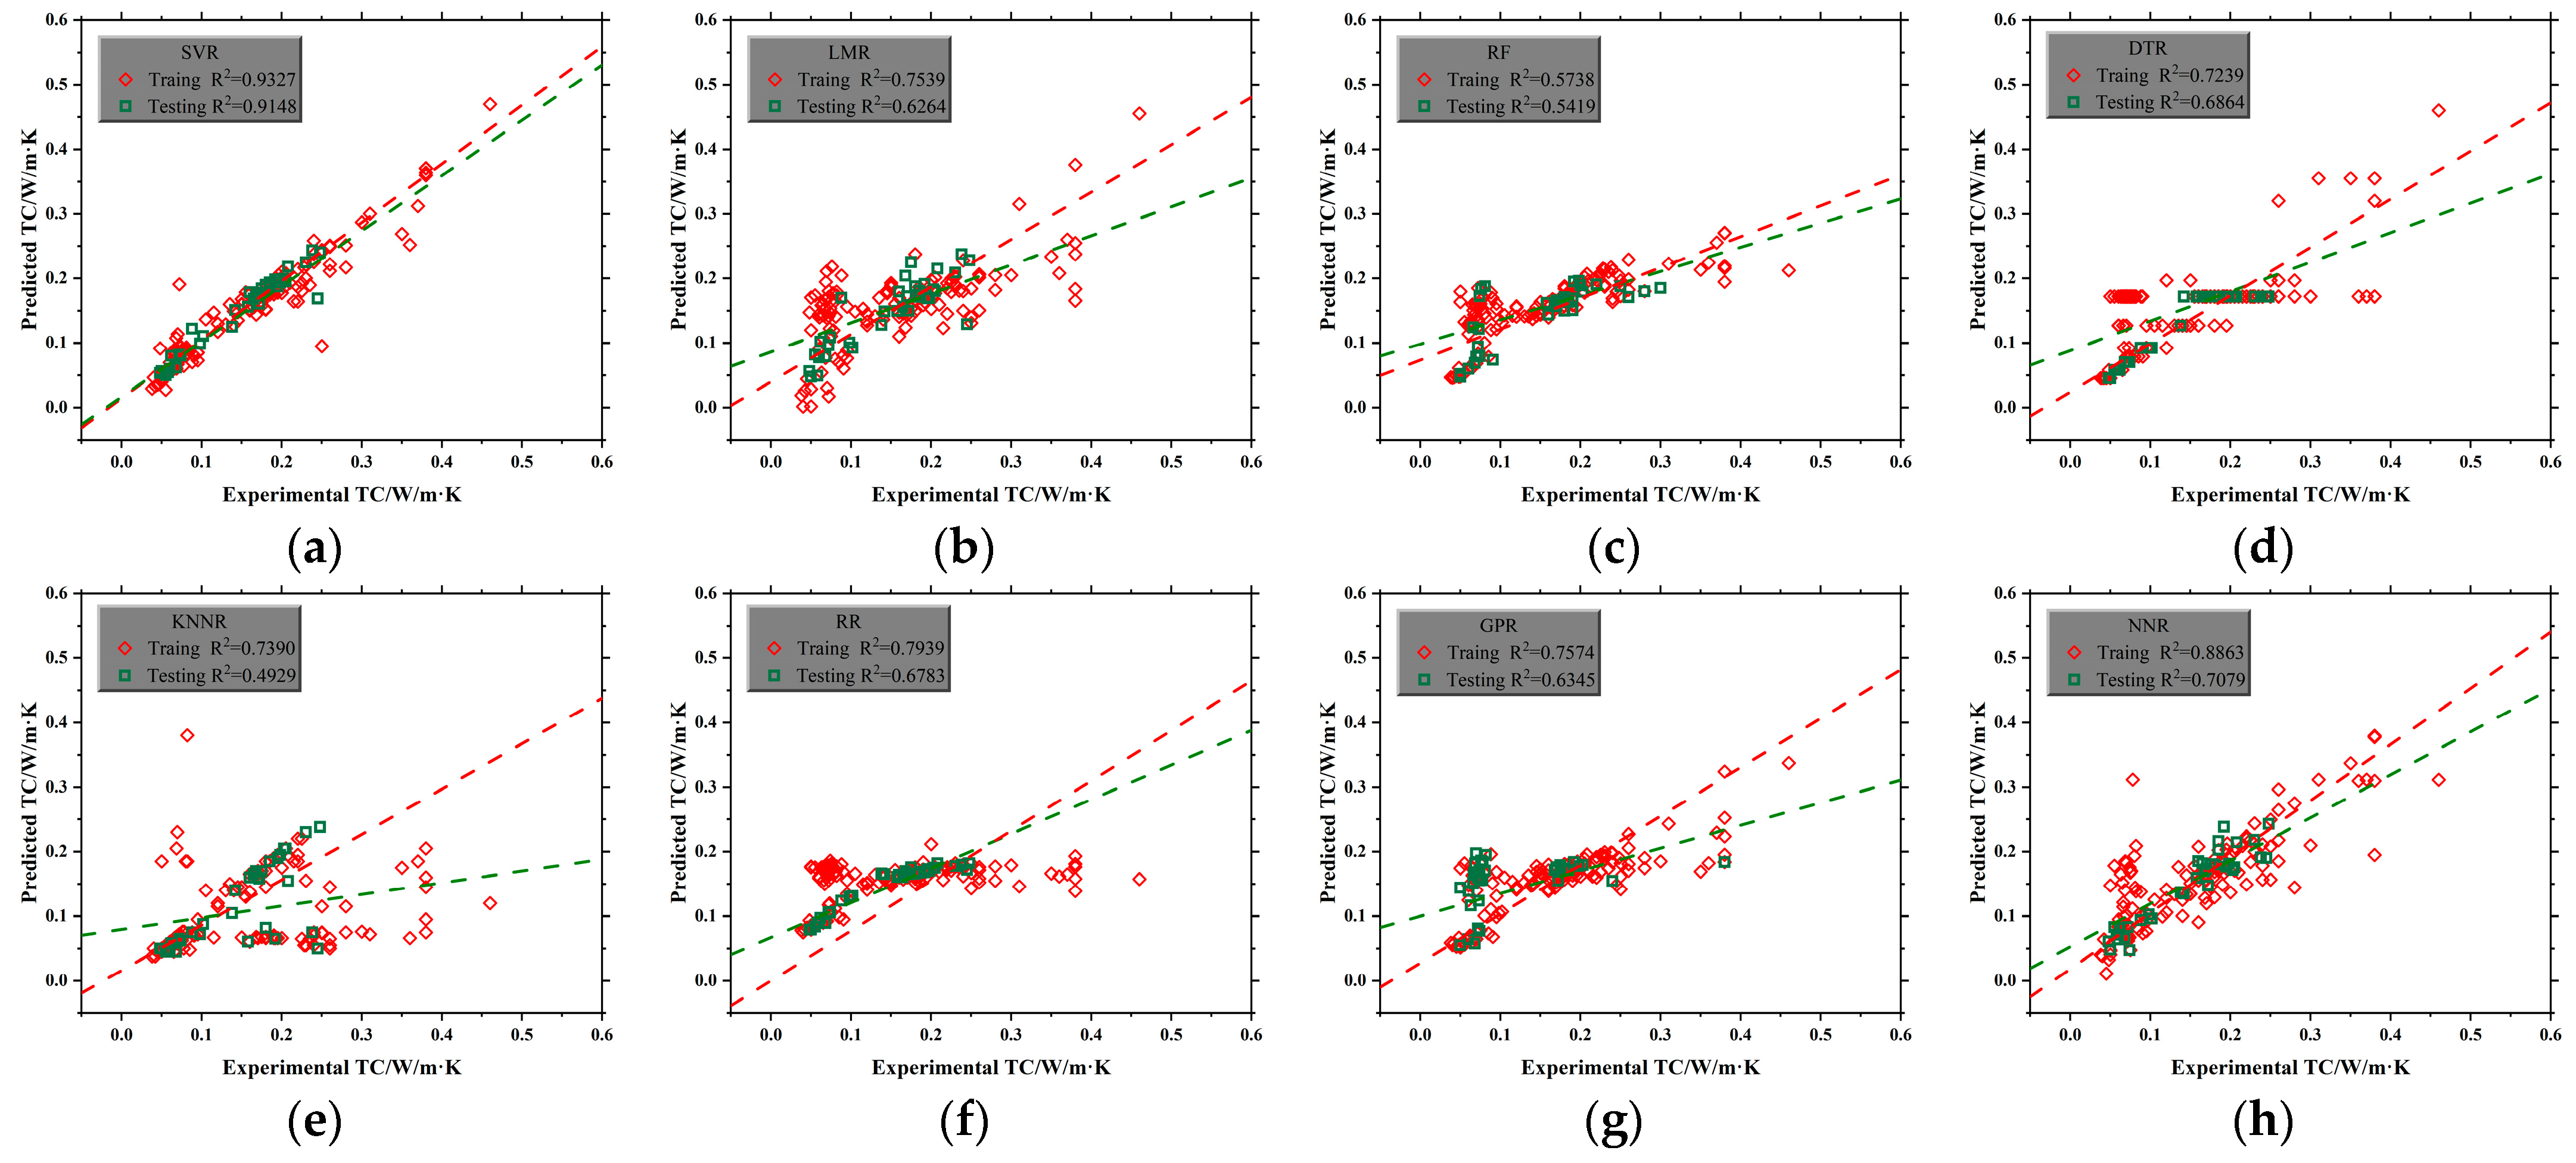
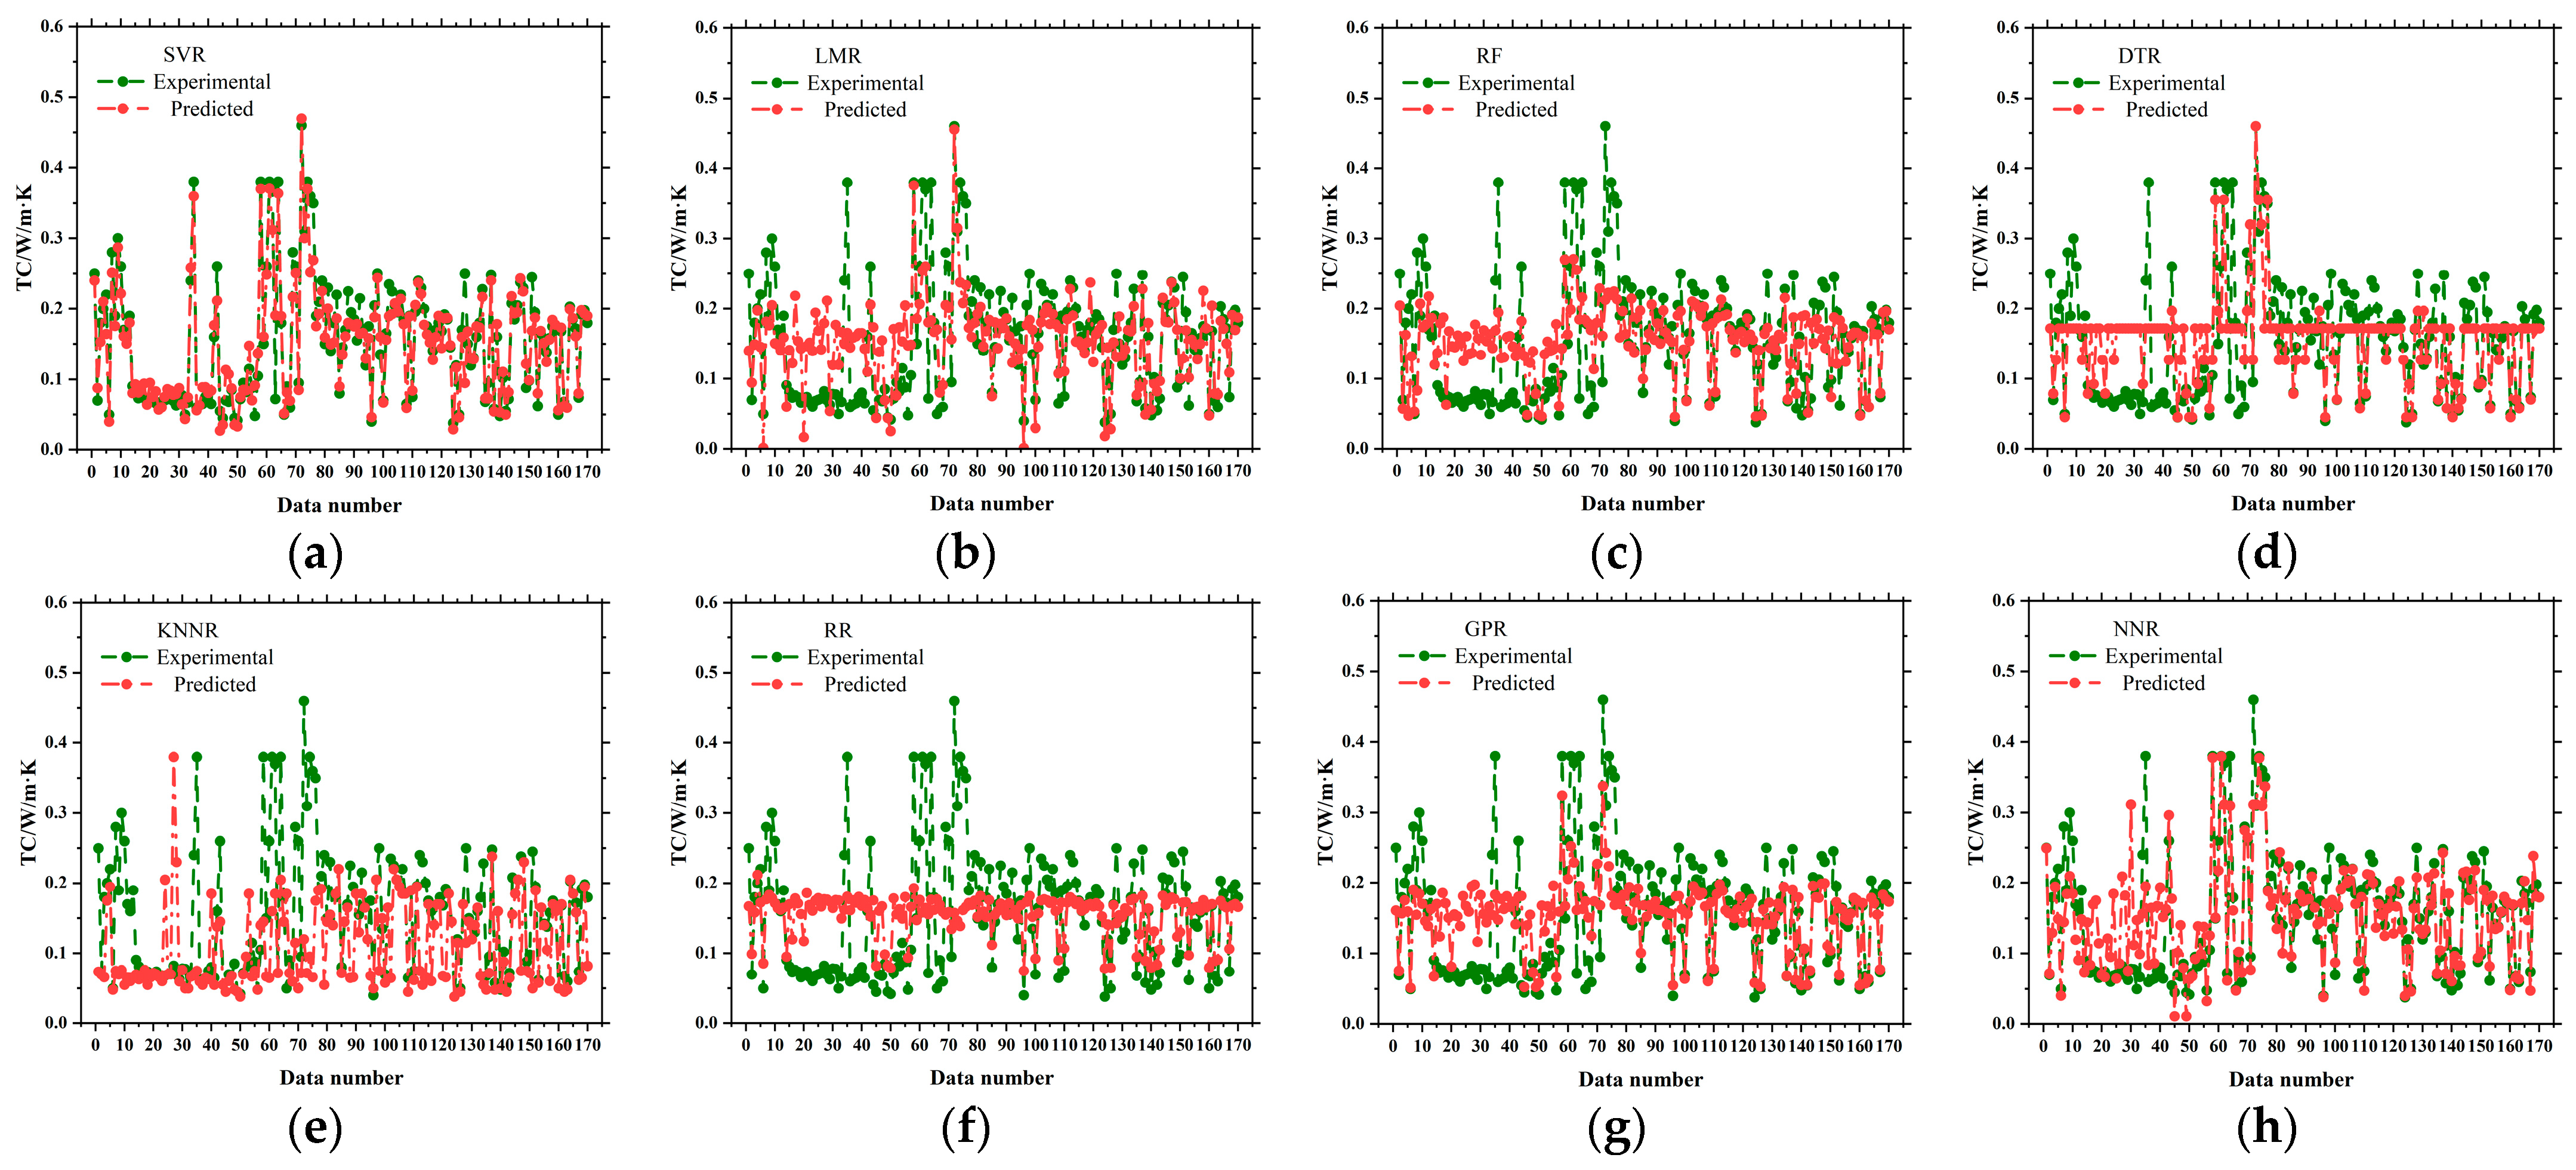
3.3. Machine Learning-Based Prediction of Thermal Conductivity

Figure 11 illustrates the links between the experimental thermal conductivity (TC) and the predicted values obtained from machine learning (ML) models. This section sequentially evaluates the predictive capability of eight different ML methods for estimating the TC of foamed concrete [106].
During the training phase, SVM demonstrated the most accurate predictive performance, achieving a coefficient of determination R2 of 0.9327. In contrast, KNNR and RF exhibited relatively poor and comparable prediction metrics, which may be attributed to their similar response mechanisms to specific data features [74,113]. In the independent test set validation, the SVM model maintained its superior performance, resulting in an R2 of 0.9148 and a mean absolute error of 0.0390 W/m·K. The DTR model showed a substantial performance improvement on the test set, with the MAE decreasing from 0.0434 W/m·K in the training set to 0.0220 W/m·K—a reduction of 49.3%. The improvement is likely due to the model’s inherent regularization effect, which mitigates overfitting. In contrast, the LMR model exhibited the poorest generalization capability [114,115], with the test set R2 dropping to 0.6264 and the mean absolute percentage error reaching as high as 67.71%.
As observed from Figure 12 and Figure 13, the error decomposition analysis indicates that the prediction error primarily originates from systematic bias and random error. Among the models, RF exhibited the greatest overfitting tendency, with a ΔR2 of 0.0319, whereas KNNR demonstrated the most stable generalization performance, with a ΔR2 of 0.1784 [77,116].
In the case of thermal conductivity (Figure 11, Figure 12 and Figure 13), the support vector regression (SVR) model provides the most consistent and centrally distributed predictions, as observed by its tight clustering around the ideal prediction line and minimal variance across the dataset. This is further supported by its high coefficient of determination and low mean absolute error, suggesting strong generalization and stability across both low and high thermal conductivity ranges. In contrast, the Linear Multidimensional Regression (LMR) model exhibits large systematic deviations, especially in the lower and upper bounds of thermal conductivity values. The prediction points show a clear spread away from the diagonal reference line, indicating both underestimation and overestimation in different regions. This performance aligns with its relatively low R2 and high MAPE values, which indicate poor fit and sensitivity to outliers or nonlinear behavior. Additionally, the Random Forest (RF) model demonstrates overfitting behavior, performing well in the training set but with increased dispersion and reduced accuracy in the testing set. The Decision Tree Regression (DTR) model, however, improves its accuracy in the testing phase, likely due to its built-in pruning mechanism, which reduces variance and enhances robustness. The KNNR and RR models show moderate performance, with noticeable fluctuations in sparse data regions, suggesting a dependency on local data structure and sensitivity to parameter scaling. Overall, these results confirm that some models perform better than others. SVR shows strong predictive accuracy for thermal conductivity. This is because they can capture nonlinear relationships and apply regularization. Thermal conductivity is affected by many factors, including density, cement content, and the Cag/Fag ratio.
Figure 11, Figure 12 and Figure 13 provide detailed insights into the prediction behavior of different models for thermal conductivity. The SVR model consistently produces accurate and well-centered predictions across the full range, with minimal overestimation or underestimation in both low- and high-conductivity regions. In contrast, the LMR model shows obvious deviations from the ideal prediction line. It tends to underestimate thermal conductivity at low values and overestimate it at high values. The RF model performs well on the training set but exhibits overfitting, with increased error and dispersion in the testing set. DTR improves noticeably during testing, suggesting better generalization due to its pruning mechanism. KNNR and RR models display scattered predictions in data-sparse regions, reflecting sensitivity to local variations. These patterns underscore the importance of model selection based on thermal conductivity range and data distribution.

3.4. Validations and Analysis

K-fold cross-validation is a rigorous model evaluation method that partitions the dataset into K mutually exclusive subsets {F1, F2, …, FK} [117]. Each subset is sequentially used as a test set, while the remaining K − 1 subsets are combined to form the training set. This method ensures that each data is used in training K−1 times and in testing exactly once, thereby significantly improving data utilization [118]. Moreover, averaging the results across multiple independent tests effectively reduces the randomness and variance in the evaluation outcomes. In this study, a 5-fold cross-validation was employed to systematically examine the model’s predictive quality [119]. As illustrated in Figure 14, the original dataset was stochastically divided into five non-overlapping and nearly equal partitions. During the validation process, each subset was used once as the test set, while the other four subsets served as the training set, resulting in five independent training–testing cycles. The procedure guarantees that every data sample is involved in four training phases and one testing phase. It allows for a comprehensive analysis of data dependencies while strictly adhering to the principle of independence in model validation.
This section presents a comparative evaluation of the predictive performance of eight ML methods across different datasets. Key evaluation metrics include RMSE, MAE, MAPE, and R2 [119]. These metrics were obtained after model training and are summarized in Figure 15. High R2 values, along with low RMSE and MAE, are indicative of a robust predictive model, reflecting high accuracy and low residual error [120]. Different machine learning models in this study show distinct behaviors in terms of prediction accuracy and generalization. The Random Forest (RF) model performs well on the training set but shows a noticeable drop in accuracy on the test set. This indicates overfitting, where the model learns the training data too closely and fails to generalize to new data. Similarly, the K-Nearest Neighbors Regression (KNNR) model shows inconsistent performance, especially in areas with fewer data points. This is due to its sensitivity to local variations and its lack of a global learning strategy. In contrast, the Neural Network Regression (NNR) and Decision Tree Regression (DTR) models maintain relatively stable performance across both training and testing sets. These models demonstrate stronger generalization ability, likely due to their flexibility and ability to model complex nonlinear relationships. The Linear Multidimensional Regression (LMR) model performs poorly overall, with large errors and weak generalization, as it cannot capture nonlinear effects between variables. These differences highlight the importance of model selection based on both training performance and generalization capability.
The results reveal that different performance indicators may favor different optimal models. Among the eight models evaluated, several techniques demonstrated distinct advantages worth deeper discussion. The Neural Network Regression (NNR) model consistently achieved the highest prediction accuracy for mechanical strength indicators. This can be attributed to its ability to capture complex nonlinear relationships, especially in datasets with multiple correlated input variables. The support vector regression (SVR) model showed superior performance in predicting thermal conductivity, likely due to the effectiveness of the quadratic kernel function in mapping input features into a higher-dimensional space. This kernel transformation was particularly useful in handling the subtle, nonlinear effects of parameters such as density and Cag/Fag on thermal conductivity. Although the Decision Tree Regression (DTR) model did not always outperform others in raw accuracy metrics, it consistently exhibited excellent generalization and stability, as evidenced by low ΔR2 values across all properties. This stability likely stems from its hierarchical, rule-based structure, which effectively partitions the data and identifies dominant threshold effects. In contrast, Random Forest (RF), while effective during training, showed signs of overfitting on the test set. This is likely due to the model’s tendency to memorize noise patterns when too many trees or weak learners are included without proper regularization. Finally, Linear and Ridge Regression models generally underperformed due to their limited capacity to model complex nonlinearities, although Ridge Regression showed slightly better robustness in cases of multicollinearity. These findings support the conclusion that NNR, SVR, and DTR each offer unique strengths in foam concrete property prediction and should be selected based on the specific performance target and data characteristics. Specifically, NNR reached the best performance in predicting compressive strength (R2 = 0.9869, MAE = 1.6123 MPa) and flexural strength (R2 = 0.9319, MAE = 0.37 MPa) [121,122]. In contrast, SVM demonstrated superior performance in predicting thermal conductivity (R2 = 0.9327, MAE = 0.0228 W/m·K). DTR showed excellent generalization capabilities, with an average performance improvement of 32.7% on the test set. In compressive strength prediction, the MAE decreased significantly from 2.161 MPa to 1.019 MPa—a reduction of 52.8%. Error analysis revealed a correlation in predictive accuracy across different target properties [123]. The highest accuracy was found in thermal conductivity predictions (MAE = 0.0385 W/m·K), followed by flexural strength (MAE = 0.4225 MPa), while compressive strength remained the most difficult task (MAE = 2.8926 MPa) [124]. The analysis of model stability reflected that DTR and NNR exhibited the most robust performance, with an average ΔR2 of 0.102, substantially outperforming LMR, which had an average ΔR2 of 0.284 [125,126].
The performance of the proposed models is generally consistent with or slightly better than those reported in recent studies. For example, Khan et al. [127] developed an optimized artificial neural network (ANN) to predict the compressive strength of concrete, achieving an R2 of 0.963 using a dataset. In this study, the Neural Network Regression model achieved an R2 of 0.987 with 170 samples, suggesting improved generalization through a more diverse dataset and 5-fold cross-validation. For thermal conductivity, Cakiroglu et al. [128] applied ensemble machine learning models, including XGBoost and CatBoost, on a larger dataset of 504 cement-based foam concrete samples. Their best-performing models achieved R2 values exceeding 0.98. Although our support vector regression model achieved a slightly lower R2 of 0.933, it is still within an acceptable range considering the heterogeneity of the input data compiled from multiple literature sources. These comparisons indicate that the models developed in this study offer competitive accuracy while maintaining robustness across different performance indicators.
As observed from Figure 16, feature importance scores were derived from the Random Forest models using Gini-based metrics. The top-ranked variables for strength prediction included W/C, cement content, and density, while thermal conductivity was most influenced by density and Cag/Fag ratio.
Based on the error and stability analysis, a tiered model selection strategy was proposed to balance efficiency and predictive accuracy. NNR is preferred for predicting mechanical properties. SVM is suited for thermal properties. DTR serves as a reliable general-purpose model across diverse properties [129,130].

4. Conclusions

In this study, machine learning (ML) methods were used to establish predictive models for evaluating the performance of foam concrete. By analyzing prediction accuracy and selecting the most suitable models for different indicators, the predictive precision of both mechanical strength and thermal conductivity was significantly improved. The major findings are concluded as follows:
1. The Pearson correlation method was used to analyze the relationships between key parameters and performance indicators of foamed concrete. The key parameters include cement type, cement content, density, and water-to-cement ratio. By applying this method, the correlations between material properties and mechanical or thermal performance are identified and examined. These parameters were selected as optimal inputs due to their significant influence on foam concrete’s mechanical and thermal properties.
2. The NNR model exhibited superior predictive performance for the mechanical properties of foam concrete. For compressive strength, it implemented a high coefficient of determination (R2 = 0.9869), with an MAE of 1.6123 MPa and MAPE of 12.69%. In predicting flexural strength, the model also performed well, reaching an R2 value of 0.9319, with corresponding MAE and MAPE values of 0.37 MPa and 18.83%, respectively. For thermal conductivity, the SVM model outperformed the other algorithms, attaining an R2 of 0.9327, with a low MAE of 0.0228 W/m·K and a MAPE of 22.11%.
3. Significant differences were identified in the predictive accuracy across different performance metrics. Compressive strength predictions were the most accurate, followed by flexural strength and thermal conductivity, the latter being the most challenging. The SVR model exhibited consistently stable performance across datasets, especially for predicting both compressive strength and thermal conductivity. Based on SVR, two high-performance predictive equations were selected for reliable evaluation of foam concrete properties.
4. DTR and NNR demonstrated the highest robustness, with an average ΔR2 = 0.102 and ΔMAPE < 8.5%, significantly outperforming linear regression. Random Forest showed the strongest overfitting tendency (ΔR2 = 0.0319), while KNNR had the most stable generalization capability (ΔR2 = 0.1784).
5. K-fold cross-validation was employed to assess the performance of all eight models. Results confirmed that SVR outperformed other models in foam concrete property prediction. Based on error analysis, a hierarchical model selection strategy was proposed: NNR is recommended for mechanical properties, SVR for thermal performance, and DTR as a general-purpose model. The model selection framework provides reliable technical support for engineering applications of foam concrete, improving both accuracy and efficiency in prediction.

Author Contributions

Conceptualization, L.L. and A.A.; methodology, L.L., A.A., W.C. and Z.L.; software, W.S.; validation, W.S. and L.Y.G.-Z.; formal analysis, W.S. and L.Y.G.-Z.; investigation, W.S.; resources, Z.L.; data curation, W.S.; writing—original draft, L.L. and W.S.; writing—review and editing, A.A., W.C., Z.L. and L.Y.G.-Z.; visualization, Z.L.; supervision, Z.L.; project administration, Z.L. All authors have read and agreed to the published version of the manuscript.

Funding

No external funding was received for this study.

Institutional Review Board Statement

Not applicable.

Informed Consent Statement

Not applicable.

Data Availability Statement

The data presented in this study are available on request from the corresponding author (W.S.) subject to confidentiality agreements with industry partners.

Acknowledgments

The authors gratefully acknowledge the invaluable contributions of our graduate researchers Haoran Ma, Chuanqi Gu, Xinshuo Cui, and Boyuan Ma in data validation. Their meticulous work ethic and technical expertise significantly enhanced this study’s reliability.

Conflicts of Interest

Authors Leifa Li, Askar Ayti, and Wangping Chen were employed by Xinjiang Jiaotou Construction Management Co., Ltd. The remaining authors declare that the re-search was con-ducted in the absence of any commercial or fi-nancial relationships that could be construed as a potential conflict of interest.

References

  1. Mohamed, A.M.; Tayeh, B.A.; Majeed, S.S.; Aisheh, Y.I.A.; Salih, M.N.A. Ultra-Light Foamed Concrete Mechanical Properties and Thermal Insulation Perspective: A Comprehensive Review. J. CO2 Util. 2024, 83, 102827. [Google Scholar] [CrossRef]
  2. Pan, Z.; Li, H.; Liu, W. Preparation and Characterization of Super Low Density Foamed Concrete from Portland Cement and Admixtures. Constr. Build. Mater. 2014, 72, 256–261. [Google Scholar] [CrossRef]
  3. Jiang, J.; Lu, Z.; Niu, Y.; Li, J.; Zhang, Y. Study on the Preparation and Properties of High-Porosity Foamed Concretes Based on Ordinary Portland Cement. Mater. Des. 2016, 92, 949–959. [Google Scholar] [CrossRef]
  4. Tayeh, B.A. Effects of Marble, Timber, and Glass Powder as Partial Replacements for Cement. J. Civ. Eng. Constr. 2018, 7, 63–71. [Google Scholar] [CrossRef]
  5. Datta, S.D.; Rana, M.J.; Assafi, M.N.; Mim, N.J.; Ahmed, S. Investigation on the Generation of Construction Wastes in Bangladesh. Int. J. Constr. Manag. 2023, 23, 2260–2269. [Google Scholar] [CrossRef]
  6. Yang, S.; Wang, X.; Hu, Z.; Li, J.; Yao, X.; Zhang, C.; Wu, C.; Zhang, J.; Wang, W. Recent advances in sustainable lightweight foamed concrete incorporating recycled waste and byproducts: A review. Constr. Build. Mater. 2023, 403, 133083. [Google Scholar] [CrossRef]
  7. Liu, Y.; Zhao, Z.; Amin, M.N.; Ahmed, B.; Khan, K.; Arifeen, S.U.; Althoey, F. Foam Concrete for Lightweight Construction Applications: A Comprehensive Review of the Research Development and Material Characteristics. Rev. Adv. Mater. Sci. 2024, 63, 20240022. [Google Scholar] [CrossRef]
  8. Cao, W.; Lv, X.; Li, J.; Lu, J.X.; Moon, J.; Poon, C.S. Enhancing the Mechanical and Thermal Properties of Foam Concrete by Incorporating Glass Lightweight Microspheres. Constr. Build. Mater. 2024, 447, 138103. [Google Scholar] [CrossRef]
  9. Wu, G.; Chen, W.; Tan, X.; Zhao, W.; Jia, S.; Tian, H.; Yang, J. Performance of New Type of Foamed Concrete in Supporting Tunnel in Squeezing Rock. Int. J. Geomech. 2020, 20, 04019173. [Google Scholar] [CrossRef]
  10. Lee, S.C. Prediction of Concrete Strength Using Artificial Neural Networks. Eng. Struct. 2003, 25, 849–857. [Google Scholar] [CrossRef]
  11. Nguyen, H.; Vu, T.; Vo, T.P.; Thai, H.T. Efficient Machine Learning Models for Prediction of Concrete Strengths. Constr. Build. Mater. 2021, 266, 120950. [Google Scholar] [CrossRef]
  12. Van, L.T.; Kim, D.V.; Xuan, H.N.; Tho, V.D.; Bulgakov, B.I.; Alexandrova, O.V. Modelling of the Effect of the Water-Cement Ratios on Properties Foam Concrete. J. Phys. Conf. Ser. 2019, 1425, 012189. [Google Scholar] [CrossRef]
  13. Ahmad, S.A.; Ahmed, H.U.; Rafiq, S.K.; Ahmad, D.A. Machine Learning Approach for Predicting Compressive Strength in Foam Concrete Under Varying Mix Designs and Curing Periods. Smart Constr. Sustain. Cities 2023, 1, 16. [Google Scholar]
  14. Liu, J.; Ge, T.; Wu, Y.; Chen, R. Effect of Sand-to-Cement Ratio on Mechanical Properties of Foam Concrete. Buildings 2022, 12, 1969. [Google Scholar] [CrossRef]
  15. Amran, Y.M.; Farzadnia, N.; Ali, A.A. Properties and Applications of Foamed Concrete: A Review. Constr. Build. Mater. 2015, 101, 990–1005. [Google Scholar] [CrossRef]
  16. Kearsley, E.P.; Wainwright, P.J. The Effect of High Fly Ash Content on the Compressive Strength of Foamed Concrete. Cem. Concr. Res. 2001, 31, 105–112. [Google Scholar] [CrossRef]
  17. De Nicolo, B.; Pani, L.; Pozzo, E. Strain of Concrete at Peak Compressive Stress for a Wide Range of Compressive Strengths. Mater. Struct. 1994, 27, 206–210. [Google Scholar] [CrossRef]
  18. Tan, X.; Chen, W.; Yang, D.; Liu, H.; Chan, A.H.C. Experimental and Theoretical Studies on Effect of Height-to-Diameter Ratios on Failure Forms and Mechanical Characteristics of Foamed Concrete. J. Mater. Civ. Eng. 2019, 31, 04018341. [Google Scholar] [CrossRef]
  19. Sargam, Y.; Wang, K.; Cho, I.H. Machine Learning Based Prediction Model for Thermal Conductivity of Concrete. J. Build. Eng. 2021, 34, 101956. [Google Scholar] [CrossRef]
  20. Sargam, Y.; Faytarouni, M.; Riding, K.; Wang, K.; Jahren, C.; Shen, J. Predicting Thermal Performance of a Mass Concrete Foundation—A Field Monitoring Case Study. Case Stud. Constr. Mater. 2019, 11, e00289. [Google Scholar] [CrossRef]
  21. Sargam, Y.; Wang, K.; Alleman, J.E. Effects of Modern Concrete Materials on Thermal Conductivity. J. Mater. Civ. Eng. 2020, 32, 04020058. [Google Scholar] [CrossRef]
  22. Xiao, J.Z.; Song, Z.W.; Zhang, F. An Experimental Study on Thermal Conductivity of Concrete. J. Build. Mater. 2010, 13, 17–21. [Google Scholar]
  23. Demirboğa, R. Thermal Conductivity and Compressive Strength of Concrete Incorporation with Mineral Admixtures. Build. Environ. 2007, 42, 2467–2471. [Google Scholar] [CrossRef]
  24. Jierula, A.; Li, H.; Chen, Y.; Wu, C.; Wu, X.; Yin, H. Study on the Influence of Density and Water–Cement Ratio on the Cement Utilization, Fluidity, Mechanical Properties, and Water Absorption of Foam Concrete. Buildings 2024, 14, 3550. [Google Scholar] [CrossRef]
  25. Yaseen, Z.M.; Deo, R.C.; Hilal, A.; Abd, A.M.; Bueno, L.C.; Salcedo-Sanz, S.; Nehdi, M.L. Predicting compressive strength of lightweight foamed concrete using extreme learning machine model. Adv. Eng. Softw. 2018, 115, 112–125. [Google Scholar] [CrossRef]
  26. Ullah, H.S.; Khushnood, R.A.; Farooq, F.; Ahmad, J.; Vatin, N.I.; Ewais, D.Y.Z. Prediction of Compressive Strength of Sustainable Foam Concrete Using Individual and Ensemble Machine Learning Approaches. Materials 2022, 15, 3166. [Google Scholar] [CrossRef]
  27. Fu, Y.; Wang, X.; Wang, L.; Li, Y. Foam Concrete: A State-of-the-Art and State-of-the-Practice Review. Adv. Mater. Sci. Eng. 2020, 2020, 6153602. [Google Scholar] [CrossRef]
  28. Salami, B.A.; Iqbal, M.; Abdulraheem, A.; Jalal, F.E.; Alimi, W.; Jamal, A.; Bardhan, A. Estimating Compressive Strength of Lightweight Foamed Concrete Using Neural, Genetic and Ensemble Machine Learning Approaches. Cem. Concr. Compos. 2022, 133, 104721. [Google Scholar] [CrossRef]
  29. Elhishi, S.; Elashry, A.M.; El-Metwally, S. Unboxing Machine Learning Models for Concrete Strength Prediction Using XAI. Sci. Rep. 2023, 13, 19892. [Google Scholar] [CrossRef]
  30. Cakiroglu, C.; Batool, F.; Islam, K.; Nehdi, M.L. Explainable Ensemble Learning Predictive Model for Thermal Conductivity of Cement-Based Foam. Constr. Build. Mater. 2024, 421, 135663. [Google Scholar] [CrossRef]
  31. Rosa, A.C.; Elomari, Y.; Calderón, A.; Mateu, C.; Haddad, A.; Boer, D. Methodology for the Prediction of the Thermal Conductivity of Concrete by Using Neural Networks. Appl. Sci. 2024, 14, 7598. [Google Scholar] [CrossRef]
  32. Lie, T.T.; Kodur, V.K.R. Thermal and Mechanical Properties of Steel-Fibre-Reinforced Concrete at Elevated Temperatures. Can. J. Civ. Eng. 1996, 23, 511–517. [Google Scholar] [CrossRef]
  33. Zhou, Z.; Hu, J.; Li, F.; Zhang, J.; Lei, M. Elastic Modulus Prediction Model of Foamed Concrete Based on the Walsh Formula. Appl. Sci. 2022, 12, 5142. [Google Scholar] [CrossRef]
  34. Song, I.; Tong, T.; Im, J.; Ceylan, H.; Cho, I.H. Impacts of Fractional Hot-Deck Imputation on Learning and Prediction of Engineering Data. In A Computational Framework for Data-Driven Infrastructure Engineering Using Advanced Statistical Learning, Prediction, and Curing; Iowa State University: Ames, IA, USA, 2018. [Google Scholar]
  35. Taiwo, R.; Yussif, A.M.; Adegoke, A.H.; Zayed, T. Prediction and Deployment of Compressive Strength of High-Performance Concrete Using Ensemble Learning Techniques. Constr. Build. Mater. 2024, 451, 138808. [Google Scholar] [CrossRef]
  36. Batool, F.; Prasad, N.N.; Bindiganavile, V. Statistical Modeling of Thermal Conductivity for Cement-Based Foam. J. Build. Eng. 2018, 19, 449–458. [Google Scholar] [CrossRef]
  37. Zhang, Z.; Provis, J.L.; Reid, A.; Wang, H. Mechanical, Thermal Insulation, Thermal Resistance and Acoustic Absorption Properties of Geopolymer Foam Concrete. Cem. Concr. Compos. 2015, 62, 97–105. [Google Scholar] [CrossRef]
  38. Xian, G.; Liu, Z.; Wang, Z.; Zhou, X. Study on the Performance and Mechanisms of High-Performance Foamed Concrete. Materials 2022, 15, 7894. [Google Scholar] [CrossRef]
  39. Dong, K.; Chen, S.; Liu, J.; Shi, X.; Zhang, J.; Meng, J. Effect of Nano- and Micron-Materials on the Thermal Properties Behavior in Wet Environments and Heat Transfer Mechanism of Foam Concrete. J. Build. Eng. 2025, 107, 112725. [Google Scholar] [CrossRef]
  40. Othman, R.; Jaya, R.P.; Muthusamy, K.; Sulaiman, M.; Duraisamy, Y.; Abdullah, M.M.A.B.; Sandu, A.V. Relation between Density and Compressive Strength of Foamed Concrete. Materials 2021, 14, 2967. [Google Scholar] [CrossRef]
  41. Dhasindrakrishna, K.; Pasupathy, K.; Ramakrishnan, S.; Sanjayan, J. Progress, Current Thinking and Challenges in Geopolymer Foam Concrete Technology. Cem. Concr. Compos. 2021, 116, 103886. [Google Scholar] [CrossRef]
  42. Zhu, Y.; Feng, M.; Zhu, H.; Zhang, M.; Wang, Z.; Guo, Z. Thermal Conductivity of Fiber-Reinforced Foam Concrete Filled with Crumb Rubber Powders. Innov. Infrastruct. Solut. 2024, 9, 421. [Google Scholar] [CrossRef]
  43. Hanif, A.; Diao, S.; Lu, Z.; Fan, T.; Li, Z. Green Lightweight Cementitious Composite Incorporating Aerogels and Fly Ash Cenospheres–Mechanical and Thermal Insulating Properties. Constr. Build. Mater. 2016, 116, 422–430. [Google Scholar] [CrossRef]
  44. Strzałkowski, J.; Garbalińska, H. Thermal and Strength Properties of Lightweight Concretes with the Addition of Aerogel Particles. Adv. Cem. Res. 2016, 28, 567–575. [Google Scholar] [CrossRef]
  45. Hu, N.; Liu, Y.; Ke, L.; Ye, Y.; Jia, J.; Sun, Z.; Chen, D. Preparation and Frothing Mechanism of Froth Concrete Based on Solid Waste: A Review. Constr. Build. Mater. 2023, 401, 132831. [Google Scholar] [CrossRef]
  46. Hajimohammadi, A.; Ngo, T.; Mendis, P.; Kashani, A.; van Deventer, J.S.J. Alkali Activated Slag Foams: The Effect of the Alkali Reaction on Foam Characteristics. J. Clean. Prod. 2017, 147, 330–339. [Google Scholar] [CrossRef]
  47. Bagheri, A.; Ghahremani, G. Macroporosity-Based Prediction Models for Mechanical Properties of Foamed Concrete. Mag. Concr. Res. 2022, 74, 945–955. [Google Scholar] [CrossRef]
  48. Xu, J.; Zhao, D.; Wang, S.; Chen, X.; Wu, X.; Han, Z.; Liu, Y. Quantitative Analysis of Pore Structure’s Impact on Early Mechanical Properties and Durability of Foam Concrete: Macroscopic and Mesoscopic Insights. Constr. Build. Mater. 2025, 459, 139775. [Google Scholar] [CrossRef]
  49. Gao, Z.H.; Chen, B.; Chen, J.L.; Yuan, Z.Y. Pore Structure and Mechanical Properties of Foam Concrete under Freeze-Thaw Environment. Acta Mater. Compos. Sin. 2024, 41, 827–838. [Google Scholar]
  50. Xu, F.; Gu, G.; Zhang, W.; Wang, H.; Huang, X.; Zhu, J. Pore Structure Analysis and Properties Evaluations of Fly Ash-Based Geopolymer Foams by Chemical Foaming Method. Ceram. Int. 2018, 44, 19989–19997. [Google Scholar] [CrossRef]
  51. Liu, M.Y.J.; Alengaram, U.J.; Jumaat, M.Z.; Mo, K.H. Evaluation of Thermal Conductivity, Mechanical and Transport Properties of Lightweight Aggregate Foamed Geopolymer Concrete. Energy Build. 2014, 72, 238–245. [Google Scholar] [CrossRef]
  52. Mydin, M.A.O.; Abdullah, M.M.A.B.; Sor, N.H.; Omar, R.; Dulaimi, A.; Awoyera, P.O.; Deifalla, A.F. Thermal Conductivity, Microstructure and Hardened Characteristics of Foamed Concrete Composite Reinforced with Raffia Fiber. J. Mater. Res. Technol. 2023, 26, 850–864. [Google Scholar] [CrossRef]
  53. Gołaszewski, J.; Klemczak, B.; Smolana, A.; Gołaszewska, M.; Cygan, G.; Mankel, C.; Koenders, E.A. Effect of Foaming Agent, Binder and Density on the Compressive Strength and Thermal Conductivity of Ultra-Light Foam Concrete. Buildings 2022, 12, 1176. [Google Scholar] [CrossRef]
  54. Batool, F.; Rafi, M.M.; Bindiganavile, V. Microstructure and Thermal Conductivity of Cement-Based Foam: A Review. J. Build. Eng. 2018, 20, 696–704. [Google Scholar] [CrossRef]
  55. Kumar, N.V.; Arunkumar, C.; Senthil, S.S. Experimental Study on Mechanical and Thermal Behavior of Foamed Concrete. Mater. Today Proc. 2018, 5, 8753–8760. [Google Scholar] [CrossRef]
  56. Mydin, M.A.O.; Sor, N.H.; Althoey, F.; Özkılıç, Y.O.; Abdullah, M.M.A.B.; Isleem, H.F.; Tawfik, T.A. Performance of Lightweight Foamed Concrete Partially Replacing Cement with Industrial and Agricultural Wastes. Ain Shams Eng. J. 2023, 14, 102546. [Google Scholar] [CrossRef]
  57. Li, L.; Wang, W.; Wang, Y.; Li, D.; Zhuang, M.L. Experimental Study on Pore Structure Characteristics and Thermal Conductivity of Fibers Reinforced Foamed Concrete. PLoS ONE 2023, 18, e0287690. [Google Scholar] [CrossRef]
  58. Zhang, X.; Yang, Q.; Shi, Y.; Zheng, G.; Li, Q.; Chen, H.; Cheng, X. Effects of Different Control Methods on the Mechanical and Thermal Properties of Ultra-Light Foamed Concrete. Constr. Build. Mater. 2020, 262, 120082. [Google Scholar] [CrossRef]
  59. Zhang, J.; Su, Y.; Xiong, Y.; He, J.; Xu, Q.; Gao, H. Influence of Foam Content on Mechanical Properties and Thermal Conductivity of Ceramsite Foam Concrete. Sci. Rep. 2025, 15, 16860. [Google Scholar] [CrossRef]
  60. Feng, S.; Gao, Y.; Xiao, H.; Xue, C. Influence of Fibers and Bubble Structure on Thermal Conductivity and Mechanical Performances of Foam Concrete. Constr. Build. Mater. 2024, 445, 137956. [Google Scholar] [CrossRef]
  61. Xiao, J.; Hao, L.; Cao, W.; Ye, T. Influence of Recycled Powder Derived from Waste Concrete on Mechanical and Thermal Properties of Foam Concrete. J. Build. Eng. 2022, 61, 105203. [Google Scholar] [CrossRef]
  62. Othuman Mydin, M.A.; Wang, Y.C. Thermal and Mechanical Properties of Lightweight Foamed Concrete at Elevated Temperatures. Mag. Concr. Res. 2012, 64, 213–224. [Google Scholar] [CrossRef]
  63. Wei, J.; Wang, T.; Zhong, Y.; Zhang, Y.; Leung, C.K. Performance Evaluation of Foamed Concrete with Lightweight Aggregate: Strength, Shrinkage, and Thermal Conductivity. Materials 2024, 17, 3869. [Google Scholar] [CrossRef] [PubMed]
  64. Xu, T.; Garrecht, H. Effects of Mixing Techniques and Material Compositions on the Compressive Strength and Thermal Conductivity of Ultra-Lightweight Foam Concrete. Materials 2024, 17, 2640. [Google Scholar] [CrossRef]
  65. Bayraktar, O.Y.; Kaplan, G.; Gencel, O.; Benli, A.; Sutcu, M. Physico-Mechanical, Durability and Thermal Properties of Basalt Fiber Reinforced Foamed Concrete Containing Waste Marble Powder and Slag. Constr. Build. Mater. 2021, 288, 123128. [Google Scholar] [CrossRef]
  66. Kilincarslan, Ş.; Davraz, M.; Akça, M. The Effect of Pumice as Aggregate on the Mechanical and Thermal Properties of Foam Concrete. Arab. J. Geosci. 2018, 11, 289. [Google Scholar] [CrossRef]
  67. Gökçe, H.S.; Hatungimana, D.; Ramyar, K. Effect of Fly Ash and Silica Fume on Hardened Properties of Foam Concrete. Constr. Build. Mater. 2019, 194, 1–11. [Google Scholar] [CrossRef]
  68. Chen, B.; Liu, N. A Novel Lightweight Concrete-Fabrication and Its Thermal and Mechanical Properties. Constr. Build. Mater. 2013, 44, 691–698. [Google Scholar] [CrossRef]
  69. Rong, X.; Zhang, X.; Zhang, J.; Xu, W.; Zhang, Z. Study on Mechanical and Thermal Properties of Alkali-Excited Fly Ash Aerogel Foam Concrete. Constr. Build. Mater. 2023, 408, 133770. [Google Scholar] [CrossRef]
  70. Wang, L.; Liu, P.; Jing, Q.; Liu, Y.; Wang, W.; Zhang, Y.; Li, Z. Strength Properties and Thermal Conductivity of Concrete with the Addition of Expanded Perlite Filled with Aerogel. Constr. Build. Mater. 2018, 188, 747–757. [Google Scholar] [CrossRef]
  71. Wu, D.; Zhang, Y.; Qin, S.; Deng, R. Effect of Foaming Gas on the Physical and Mechanical Properties of Foamed Concrete. Constr. Build. Mater. 2025, 478, 141465. [Google Scholar] [CrossRef]
  72. Wongkvanklom, A.; Posi, P.; Kasemsiri, P.; Sata, V.; Cao, T.; Chindaprasirt, P. Strength, Thermal Conductivity and Sound Absorption of Cellular Lightweight High Calcium Fly Ash Geopolymer Concrete. Eng. Appl. Sci. Res. 2021, 48, 487–496. [Google Scholar]
  73. Chen, G.; Wang, K. Mechanical and Thermal Properties of Glass Fibre-Reinforced Ceramsite-Foamed Concrete. Indoor Built Environ. 2018, 27, 890–897. [Google Scholar] [CrossRef]
  74. Maglad, A.M.; Mydin, M.A.O.; Majeed, S.S.; Tayeh, B.A.; Mostafa, S.A. Development of Eco-Friendly Foamed Concrete with Waste Glass Sheet Powder for Mechanical, Thermal, and Durability Properties Enhancement. J. Build. Eng. 2023, 80, 107974. [Google Scholar] [CrossRef]
  75. Batool, F.; Bindiganavile, V. Quantification of Factors Influencing the Thermal Conductivity of Cement-Based Foam. Cem. Concr. Compos. 2018, 91, 76–86. [Google Scholar] [CrossRef]
  76. Liu, F.T.; Ting, K.M.; Zhou, Z.H. Isolation-Based Anomaly Detection. ACM Trans. Knowl. Discov. Data 2012, 6, 1–39. [Google Scholar] [CrossRef]
  77. Wu, J.; Deng, Y.; Zheng, X.; Cui, Y.; Zhao, Z.; Chen, Y.; Zha, F. Hydraulic Conductivity and Strength of Foamed Cement-Stabilized Marine Clay. Constr. Build. Mater. 2019, 222, 688–698. [Google Scholar] [CrossRef]
  78. Zhu, C.; Dong, B.; Lazorenko, G.; Fang, G.; Wang, Y.; Zuo, J. Sandy Soil Based Foam Concrete with Ultra-Small Pore Structure Through In-Situ Mechanical Frothing. J. Build. Eng. 2024, 91, 109675. [Google Scholar] [CrossRef]
  79. He, J.; Gao, Q.; Song, X.; Bu, X.; He, J. Effect of Foaming Agent on Physical and Mechanical Properties of Alkali-Activated Slag Foamed Concrete. Constr. Build. Mater. 2019, 226, 280–287. [Google Scholar] [CrossRef]
  80. Mydin, M.A.O. Effective thermal conductivity of foamcrete of different densities. Concr. Res. Lett. 2011, 2, 181–189. [Google Scholar]
  81. Zhang, S.; Qi, X.; Guo, S.; Zhang, L.; Ren, J. A Systematic Research on Foamed Concrete: The Effects of Foam Content, Fly Ash, Slag, Silica Fume and Water-to-Binder Ratio. Constr. Build. Mater. 2022, 339, 127683. [Google Scholar] [CrossRef]
  82. Li, T.; Huang, F.; Zhu, J.; Tang, J.; Liu, J. Effect of Foaming Gas and Cement Type on the Thermal Conductivity of Foamed Concrete. Constr. Build. Mater. 2020, 231, 117197. [Google Scholar] [CrossRef]
  83. Shang, X.; Qu, N.; Li, J. Development and Functional Characteristics of Novel Foam Concrete. Constr. Build. Mater. 2022, 324, 126666. [Google Scholar] [CrossRef]
  84. Martínez-Merino, L.I.; Puerto, J.; Rodríguez-Chía, A.M. Ordered Weighted Average Support Vector Regression. Expert Syst. Appl. 2025, 274, 126882. [Google Scholar]
  85. Anand, P.; Rastogi, R.; Chandra, S. A Class of New Support Vector Regression Models. Appl. Soft Comput. 2020, 94, 106446. [Google Scholar] [CrossRef]
  86. Guo, L.; Xia, L.; Moore, J.B. Robust Recursive Identification of Multidimensional Linear Regression Models. Int. J. Control 1988, 48, 961–979. [Google Scholar] [CrossRef]
  87. Altork, Y. Comparative Analysis of Machine Learning Models for Wind Speed Forecasting: Support Vector Machines, Fine Tree, and Linear Regression Approaches. Int. J. Thermofluids 2025, 10, 1217. [Google Scholar] [CrossRef]
  88. Wen, H.; Li, J.; Liao, M.; Di, M.; Hu, J.; Liu, B. A Hybrid-Optimized Random Forest Interpretable Model for Debris Flow Susceptibility by Prior Model-Based Negative Sampling. Adv. Space Res. 2025, 76, 202–220. [Google Scholar] [CrossRef]
  89. Yang, K.; Wang, J.; Zhao, G.; Wang, X.; Cong, W.; Yuan, M.; Tao, J. NIDS-CNNRF Integrating CNN and Random Forest for Efficient Network Intrusion Detection Model. Internet Things 2025, 32, 101607. [Google Scholar] [CrossRef]
  90. Loh, W.Y. Classification and Regression Trees. Wiley Interdiscip. Rev. Data Min. Knowl. Discov. 2011, 1, 14–23. [Google Scholar]
  91. Probst, P.; Wright, M.N.; Boulesteix, A.L. Hyperparameters and Tuning Strategies for Random Forest. Wiley Interdiscip. Rev. Data Min. Knowl. Discov. 2019, 9, e1301. [Google Scholar]
  92. Cover, T.; Hart, P. Nearest Neighbor Pattern Classification. IEEE Trans. Inf. Theory 1967, 13, 21–27. [Google Scholar] [CrossRef]
  93. Chou, J.S.; Tsai, C.F.; Pham, A.D.; Lu, Y.H. Machine Learning in Concrete Strength Simulations: Multi-Nation Data Analytics. Constr. Build. Mater. 2014, 73, 771–780. [Google Scholar] [CrossRef]
  94. Yang, Y.; Wang, Y.; Cao, J. Prediction and Evaluation of Thermal Conductivity in Nanomaterial-Reinforced Cementitious Composites. Cem. Concr. Res. 2023, 172, 107240. [Google Scholar] [CrossRef]
  95. Naved, M.; Asim, M.; Ahmad, T. Prediction of Concrete Compressive Strength Using Deep Neural Networks Based on Hyperparameter Optimization. Cogent Eng. 2024, 11, 2297491. [Google Scholar] [CrossRef]
  96. Amiri, M.; Hatami, F. Prediction of Mechanical and Durability Characteristics of Concrete Including Slag and Recycled Aggregate Concrete with Artificial Neural Networks (ANNs). Constr. Build. Mater. 2022, 325, 126839. [Google Scholar] [CrossRef]
  97. Ghunimat, D.; Alzoubi, A.E.; Alzboon, A.; Hanandeh, S. Prediction of Concrete Compressive Strength with GGBFS and Fly Ash Using Multilayer Perceptron Algorithm, Random Forest Regression and K-Nearest Neighbor Regression. Asian J. Civ. Eng. 2023, 24, 169–177. [Google Scholar] [CrossRef]
  98. Aiyer, B.G.; Kim, D.; Karingattikkal, N.; Samui, P.; Rao, P.R. Prediction of Compressive Strength of Self-Compacting Concrete Using Least Square Support Vector Machine and Relevance Vector Machine. KSCE J. Civ. Eng. 2014, 18, 1753–1758. [Google Scholar] [CrossRef]
  99. Zou, Z.; Peng, B.; Xie, L.; Song, S. Enhanced Gaussian Process Model for Predicting Compressive Strength of Ultra-High-Performance Concrete (UHPC). Materials 2024, 17, 6140. [Google Scholar] [CrossRef]
  100. Barkhordari, M.S.; Armaghani, D.J.; Mohammed, A.S.; Ulrikh, D.V. Data-Driven Compressive Strength Prediction of Fly Ash Concrete Using Ensemble Learner Algorithms. Buildings 2022, 12, 132. [Google Scholar] [CrossRef]
  101. Sah, A.K.; Hong, Y.M. Performance Comparison of Machine Learning Models for Concrete Compressive Strength Prediction. Materials 2024, 17, 2075. [Google Scholar] [CrossRef]
  102. Shevade, S.K.; Keerthi, S.S.; Bhattacharyya, C.; Murthy, K.R.K. Improvements to the SMO Algorithm for SVM Regression. IEEE Trans. Neural Netw. 2000, 11, 1188–1193. [Google Scholar] [CrossRef]
  103. Liu, K.; Zhang, L.; Wang, W.; Zhang, G.; Xu, L.; Fan, D.; Yu, R. Development of Compressive Strength Prediction Platform for Concrete Materials Based on Machine Learning Techniques. J. Build. Eng. 2023, 80, 107977. [Google Scholar] [CrossRef]
  104. Wen, Z.; Zhou, R.; Su, H. MR and Stacked GRUs Neural Network Combined Model and Its Application for Deformation Prediction of Concrete Dam. Expert Syst. Appl. 2022, 201, 117272. [Google Scholar] [CrossRef]
  105. Sun, H.; Burton, H.V.; Huang, H. Machine Learning Applications for Building Structural Design and Performance Assessment: State-of-the-Art Review. J. Build. Eng. 2021, 33, 101816. [Google Scholar] [CrossRef]
  106. Nehdi, M.; Djebbar, Y.; Khan, A. Neural Network Model for Preformed-Foam Cellular Concrete. ACI Mater. J. 2001, 98, 402–409. [Google Scholar]
  107. Abd, A.M.; Abd, S.M. Modelling the Strength of Lightweight Foamed Concrete Using Support Vector Machine (SVM). Case Stud. Constr. Mater. 2017, 6, 8–15. [Google Scholar]
  108. Asadzadeh, S.; Khoshbayan, S. Multi-Objective Optimization of Influential Factors on Production Process of Foamed Concrete Using Box-Behnken Approach. Constr. Build. Mater. 2018, 170, 101–110. [Google Scholar] [CrossRef]
  109. Su, M.; Zhong, Q.; Peng, H.; Li, S. Selected machine learning approaches for predicting the interfacial bond strength between FRPs and concrete. Constr. Build. Mater. 2021, 270, 121456. [Google Scholar] [CrossRef]
  110. Zhao, W.; Feng, S.; Liu, J.; Sun, B. An Explainable Intelligent Algorithm for the Multiple Performance Prediction of Cement-Based Grouting Materials. Constr. Build. Mater. 2023, 366, 130146. [Google Scholar] [CrossRef]
  111. Vargas, J.F.; Oviedo, A.I.; Ortega, N.A.; Orozco, E.; Gómez, A.; Londoño, J.M. Machine-Learning-Based Predictive Models for Compressive Strength, Flexural Strength, and Slump of Concrete. Appl. Sci. 2024, 14, 4426. [Google Scholar] [CrossRef]
  112. Huang, J.; Zhou, M.; Yuan, H.; Sabri, M.M.S.; Li, X. Prediction of the Compressive Strength for Cement-Based Materials with Metakaolin Based on the Hybrid Machine Learning Method. Materials 2022, 15, 3500. [Google Scholar] [CrossRef]
  113. Wang, S.; Abdulridha, A.; Bravo, J.; Naito, C.; Quiel, S.; Suleiman, M.; Oztekin, A. Thermal Energy Storage in Concrete: Review, Testing, and Simulation of Thermal Properties at Relevant Ranges of Elevated Temperature. Cem. Concr. Res. 2023, 166, 107096. [Google Scholar] [CrossRef]
  114. Wu, M.; Li, M.; Xu, C.; He, Y.; Tao, W. The Impact of Concrete Structure on the Thermal Performance of the Dual-Media Thermocline Thermal Storage Tank Using Concrete as the Solid Medium. Appl. Energy 2014, 113, 1363–1371. [Google Scholar] [CrossRef]
  115. Kursuncu, B.; Gencel, O.; Bayraktar, O.Y.; Shi, J.; Nematzadeh, M.; Kaplan, G. Optimization of Foam Concrete Characteristics Using Response Surface Methodology and Artificial Neural Networks. Constr. Build. Mater. 2022, 337, 127575. [Google Scholar] [CrossRef]
  116. Cavalline, T.L.; Castrodale, R.W.; Freeman, C.; Wall, J. Impact of Lightweight Aggregate on Concrete Thermal Properties. ACI Mater. J. 2017, 114, 945. [Google Scholar] [CrossRef]
  117. Bergmeir, C.; Benítez, J.M. On the Use of Cross-Validation for Time Series Predictor Evaluation. Inf. Sci. 2012, 191, 192–213. [Google Scholar] [CrossRef]
  118. Hastie, T.; Tibshirani, R.; Friedman, J. The Elements of Statistical Learning: Data Mining, Inference, and Prediction, 2nd ed.; Springer: New York, NY, USA, 2009. [Google Scholar]
  119. James, G.; Witten, D.; Hastie, T.; Tibshirani, R. An Introduction to Statistical Learning; Springer: New York, NY, USA, 2013; Volume 112. [Google Scholar]
  120. Chicco, D.; Warrens, M.J.; Jurman, G. The Coefficient of Determination R-Squared is More Informative than SMAPE, MAE, MAPE, MSE and RMSE in Regression Analysis Evaluation. PeerJ Comput. Sci. 2021, 7, e623. [Google Scholar] [CrossRef]
  121. Joshi, D.A.; Menon, R.; Jain, R.K.; Kulkarni, A.V. Deep Learning Based Concrete Compressive Strength Prediction Model with Hybrid Meta-Heuristic Approach. Expert Syst. Appl. 2023, 233, 120925. [Google Scholar] [CrossRef]
  122. Chiew, F.H. Prediction of Blast Furnace Slag Concrete Compressive Strength Using Artificial Neural Networks and Multiple Regression Analysis. In Proceedings of the 2019 International Conference on Computer and Drone Applications (IConDA), Kuala Lumpur, Malaysia, 18–20 December 2019; pp. 54–58. [Google Scholar]
  123. Huang, Q.; Hong, D.; Niu, B.; Long, D.; Zhang, Y. An Interpretable Deep Learning Strategy for Effective Thermal Conductivity Prediction of Porous Materials. Int. J. Heat Mass Transf. 2024, 221, 125064. [Google Scholar] [CrossRef]
  124. Feng, D.C.; Liu, Z.T.; Wang, X.D.; Chen, Y.; Chang, J.Q.; Wei, D.F.; Jiang, Z.M. Machine Learning-Based Compressive Strength Prediction for Concrete: An Adaptive Boosting Approach. Constr. Build. Mater. 2020, 230, 117000. [Google Scholar] [CrossRef]
  125. Batool, F.; Bindiganavile, V. Air-void size distribution of cement based foam and its effect on thermal conductivity. Constr. Build. Mater. 2017, 149, 17–28. [Google Scholar] [CrossRef]
  126. Chou, J.S.; Chiu, C.K.; Farfoura, M.; Al-Taharwa, I. Optimizing the Prediction Accuracy of Concrete Compressive Strength Based on a Comparison of Data-Mining Techniques. J. Comput. Civ. Eng. 2011, 25, 242–253. [Google Scholar] [CrossRef]
  127. Khan, A.Q.; Awan, H.A.; Rasul, M.; Siddiqi, Z.A.; Pimanmas, A. Optimized Artificial Neural Network Model for Accurate Prediction of Compressive Strength of Normal and High Strength Concrete. Clean. Mater. 2023, 10, 100211. [Google Scholar] [CrossRef]
  128. Chaabene, W.B.; Flah, M.; Nehdi, M.L. Machine learning prediction of mechanical properties of concrete: Critical review. Constr. Build. Mater. 2020, 260, 119889. [Google Scholar] [CrossRef]
  129. Bhanja, S.; Sengupta, B. Investigations on the Compressive Strength of Silica Fume Concrete Using Statistical Methods. Cem. Concr. Res. 2002, 32, 1391–1394. [Google Scholar] [CrossRef]
  130. Zain, M.F.M.; Abd, S.M. Multiple Regression Model for Compressive Strength Prediction of High Performance Concrete. J. Appl. Sci. 2009, 9, 155–160. [Google Scholar] [CrossRef]
Figure 1. Diagram illustrating the multi-stage process adopted to evaluate machine learning models.
Applsci 15 07125 g001
Figure 2. Statistical characteristics of material parameters. (a) Density; (b) W/C ratio; (c) cement content; (d) S/C ratio; (e) Cag/Fag ratio; (f) porosity; (g) FA/C ratio.
Applsci 15 07125 g002aApplsci 15 07125 g002b
Figure 3. The Pearson correlation heatmap between the input variables and predicted performance indicators.
Applsci 15 07125 g003
Figure 4. Publications included in the dataset. (a) Temporal distribution; (b) parameter categorization.
Applsci 15 07125 g004
Figure 5. Regression graph for compressive strength. (a) SVR; (b) LMR; (c) RF; (d) DTR; (e) KNNR; (f) RR; (g) GPR; (h) NNR.
Applsci 15 07125 g005
Figure 6. Comparison of experimental and predicted compressive strength. (a) SVR; (b) LMR; (c) RF; (d) DTR; (e) KNNR; (f) RR; (g) GPR; (h) NNR.
Applsci 15 07125 g006
Figure 7. Absolute error of compressive strength prediction. (a) SVR; (b) LMR; (c) RF; (d) DTR; (e) KNNR; (f) RR; (g) GPR; (h) NNR.
Applsci 15 07125 g007
Figure 8. Regression graph for flexural strength. (a) SVR; (b) LMR; (c) RF; (d) DTR; (e) KNNR; (f) RR; (g) GPR; (h) NNR.
Applsci 15 07125 g008
Figure 9. Comparison of experimental and predicted flexural strength. (a) SVR; (b) LMR; (c) RF; (d) DTR; (e) KNNR; (f) RR; (g) GPR; (h) NNR.
Applsci 15 07125 g009
Figure 10. Absolute error of flexural strength prediction. (a) SVR; (b) LMR; (c) RF; (d) DTR; (e) KNNR; (f) RR; (g) GPR; (h) NNR.
Applsci 15 07125 g010
Figure 11. Regression graph for thermal conductivity prediction. (a) SVR; (b) LMR; (c) RF; (d) DTR; (e) KNNR; (f) RR; (g) GPR; (h) NNR.
Applsci 15 07125 g011
Figure 12. Comparison of experimental and predicted thermal conductivity. (a) SVR; (b) LMR; (c) RF; (d) DTR; (e) KNNR; (f) RR; (g) GPR; (h) NNR.
Applsci 15 07125 g012
Figure 13. Absolute error of thermal conductivity prediction. (a) SVR; (b) LMR; (c) RF; (d) DTR; (e) KNNR; (f) RR; (g) GPR; (h) NNR.
Applsci 15 07125 g013
Figure 14. A flow diagram representing the K-fold validation process and final assessment of model performance.
Applsci 15 07125 g014
Figure 15. Integrated evaluation of machine learning algorithms. (a) Fc; (b) Fr; (c) TC.
Applsci 15 07125 g015
Figure 16. Feature importance scores. (a) Compressive strength; (b) flexural strength; (c) thermal conductivity coefficient.
Applsci 15 07125 g016
Table 1. Data statistical characteristics.
StatisticsDensity (g/cm3)W/C RatioCement Content (kg/m3)S/C RatioCag/Fag RatioP (%)FA/C RatioCompressive Strength (MPa)Flexural Strength (MPa)Thermal Conductivity Coefficient (W/m·K)
Mean1.530.41414.940.990.4337.610.2224.152.630.15
Max2.070.706733.611.8880.651.27.10.46
Min0.430.261200080150.20.04
Range1.640.445533.611.8800.649.76.90.42
Median1.650.35445.510.4320.1826.062.660.16
SE0.030.019.820.050.021.670.011.080.120.01
Mode1.640.3048010280.21.52.90.18
Skewness−1.211.35−0.720.610.780.790.57−0.160.290.85
Kurtosis3.353.942.753.764.982.542.381.892.573.53
SD0.430.120.120.680.3121.910.1414.011.550.01
Table 2. Metrics for evaluating model performance.
Evaluation ParametersRMSE (Root Mean Squared Error)MAE (Mean Absolute Error)MAPE (Mean Absolute Percentage Error)R2 (Coefficient of Determination)
Equation R M S E = i = 1 n ( y i y ^ i ) 2 n M A E = i = 1 n y i y ^ i n M A P E = 100 % n i = 1 n y i y ^ i y i R 2 = 1 i = 1 n ( y ^ i y i ) 2 i = 1 n ( y i y ¯ ) 2
Range[0, +∞)[0, +∞)[0%, +∞)(−∞, 1]
Optimal value000%1
Note: where yi is the i-th measured value, ŷi is the i-th predicted value, and n denotes the total number of data points.
Disclaimer/Publisher’s Note: The statements, opinions and data contained in all publications are solely those of the individual author(s) and contributor(s) and not of MDPI and/or the editor(s). MDPI and/or the editor(s) disclaim responsibility for any injury to people or property resulting from any ideas, methods, instructions or products referred to in the content.

