Article

A Hybrid Deep Learning Approach for Cotton Plant Disease Detection Using BERT-ResNet-PSO

by
Chetanpal Singh
*,
Santoso Wibowo
and
Srimannarayana Grandhi
School of Engineering and Technology, Central Queensland University, Melbourne, VIC 3000, Australia
*
Author to whom correspondence should be addressed.
Appl. Sci. 2025, 15(13), 7075; https://doi.org/10.3390/app15137075
Submission received: 11 May 2025 / Revised: 18 June 2025 / Accepted: 22 June 2025 / Published: 23 June 2025

Abstract

Cotton is one of the most valuable non-food agricultural products in the world. However, cotton production is often hampered by the invasion of disease. In most cases, these plant diseases are a result of insect or pest infestations, which can have a significant impact on production if not addressed promptly. It is, therefore, crucial to accurately identify leaf diseases in cotton plants to prevent any negative effects on yield. This paper presents a hybrid deep learning approach based on Bidirectional Encoder Representations from Transformers with Residual network and particle swarm optimization (BERT-ResNet-PSO) for detecting cotton plant diseases. This approach starts with image pre-processing, which they pass to a BERT-like encoder after linearly embedding the image patches. It results in segregating disease regions. Then, the output of the encoded feature is passed to ResNet-based architecture for feature extraction and further optimized by PSO to increase the classification accuracy. The approach is tested on a cotton dataset from the Plant Village dataset, where the experimental results show the effectiveness of this hybrid deep learning approach, achieving an accuracy of 98.5%, precision of 98.2% and recall of 98.7% compared to the existing deep learning approaches such as ResNet50, VGG19, InceptionV3, and ResNet152V2. This study shows that the hybrid deep learning approach is capable of dealing with the cotton plant disease detection problem effectively. This study suggests that the proposed approach is beneficial to help avoid crop losses on a large scale and support effective farming management practices.

1. Introduction

Cotton is one of the most significant crops in the agricultural sector, which contributes to the annual production of around 25.5 million metric tons in a year [1]. This crop is produced in many countries around Asia and America. For example, China and the U.S. produce the second and third largest amounts each year, with the U.S. producing nearly 4 million metric tons. Second is India, which is the world’s largest producer of cotton at about 6.4 million metric tons after China [2]. Apart from its importance in the textile industry, cotton has millions of livelihoods hanging on it when it comes to farming, manufacturing and trade. Cotton farming globally supports the employment of over 250 million people, making a significant contribution to economic stability among most of the developing nations [3].
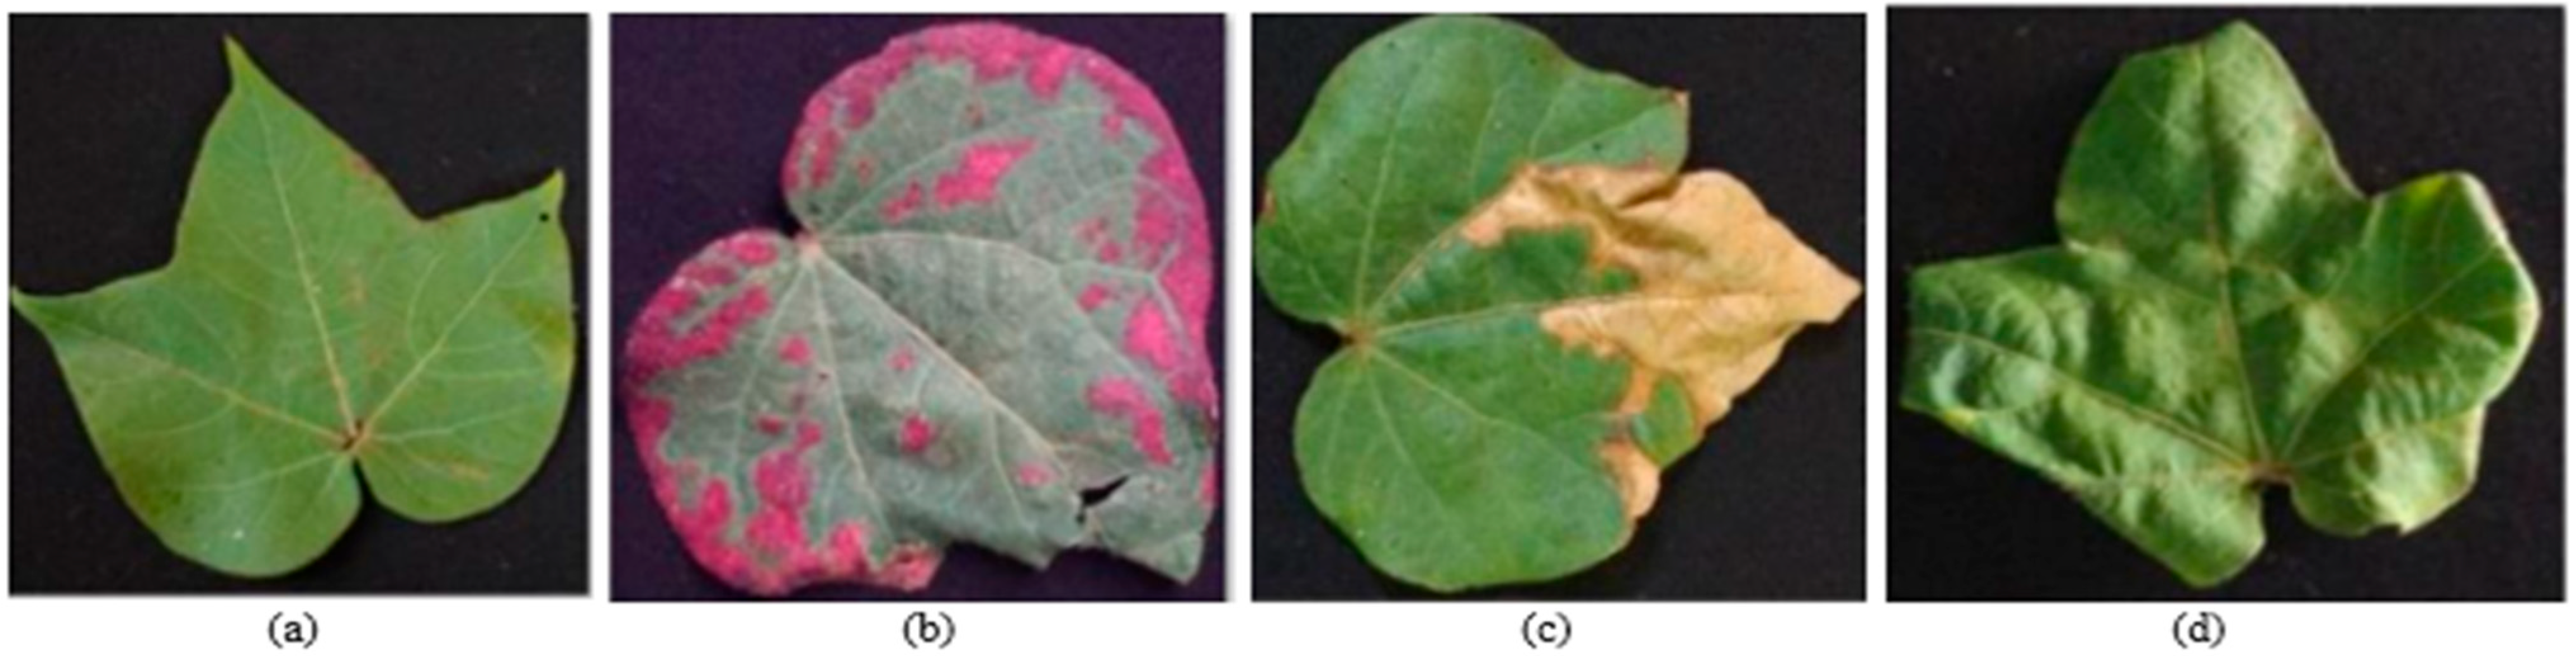
Cotton production, however, is quite challenging because cotton plants are highly sensitive to diseases. These plant diseases attack specific parts of the plants, affecting the growth of the plants and the quality of the cotton. Thus, it is critical to develop an effective approach for detecting cotton plant diseases at the early stage for the protection of the cotton plants [4].
One of the main challenges in cotton farming is to accurately identify cotton diseases that affect the leaves in a timely manner [5]. Diseases such as White Spot Disease (Pandhari Mashi), Crumple Leaf Disease (Kokada) and Red Spot Disease (Lalya) are often found on cotton plants, and they can reduce the quality and quantity of the cotton produced if they are not detected early. Visual inspection is the most common model for plant disease detection; however, it is laborious, time-consuming and prone to error by farmers. Lacking identification, diseases can spread and be costly for farmers whose livelihoods involve cotton production, and the traditional model of detecting cotton diseases is by manual examination by agronomists or farmers with some experience. To detect these diseases successfully, farmers must be highly experienced to know the disease symptoms, like discoloration, leaf deformation and spots, and this also can be variable according to environmental conditions or the disease progression.
In recent years, image-based recognition models have been adopted to analyze cotton leaves’ images for identifying disease patterns. While some improvements have been made, existing techniques are still largely vendor and experiential-dependent. Islam et al. [6], for example, developed the Xception model with transfer learning, which achieved high accuracy on an open-source cotton dataset, but their model may not generalize well to other plant species or environmental conditions, and it requires significant computational resources. Similarly, Sivakumar et al. [7] compared several CNN architectures, such as VGG19 and ResNet50, but did not specify the dataset size, making it difficult to compare the results accurately. Other studies, like Memon’s [8] work with custom CNN and meta-deep learning, show promising results on specific datasets but face limitations in generalizability due to the relatively small dataset sizes. In most of the reviewed studies, dataset details are either missing or not diverse enough, leading to concerns about overfitting and reduced real-world applicability. Additionally, while deep learning models have demonstrated high accuracy, many rely heavily on computational power and large datasets, making them challenging to deploy in practical, resource-constrained environments, thus hampering their scale and reliability [9,10]. Image-based recognition techniques also have inherent problems, such as limited accuracy due to variations in lighting, background and disease manifestation. Furthermore, current models are reactive and typically do not discover cotton diseases before considerable damage has been caused. This motivated the development of a new approach to cotton disease detection.
The application of Neural Networks (NNs), especially Convolutional Neural Networks (CNNs), has rapidly advanced the capabilities of automation, precision monitoring, and intelligent decision-making across both agricultural and industrial sectors.
In agriculture, CNNs are extensively used for image-based tasks, such as:
  • Crop disease identification using leaf images
  • Weed detection for precision spraying
  • Fruit ripeness estimation using color and texture features
  • Soil pattern analysis and satellite-based crop mapping
These networks excel due to their ability to automatically extract and learn hierarchical spatial features without manual pre-processing. CNNs outperform traditional machine learning methods in visual pattern recognition, which is especially valuable for noisy, real-world agricultural environments.
In industrial settings, CNNs and deep NNs are deployed in:
  • Defect detection in manufacturing via surface image inspection
  • Predictive maintenance using time-series sensor data
  • Automated visual inspection systems for quality assurance
  • Object tracking and robotic control in assembly lines
Industries benefit from CNNs’ robustness to distortion and their scalability to large datasets with high variability in lighting, orientation, or noise. When combined with reinforcement learning or optimization techniques (e.g., PSO, GA), they enable adaptive process control and real-time decision support.
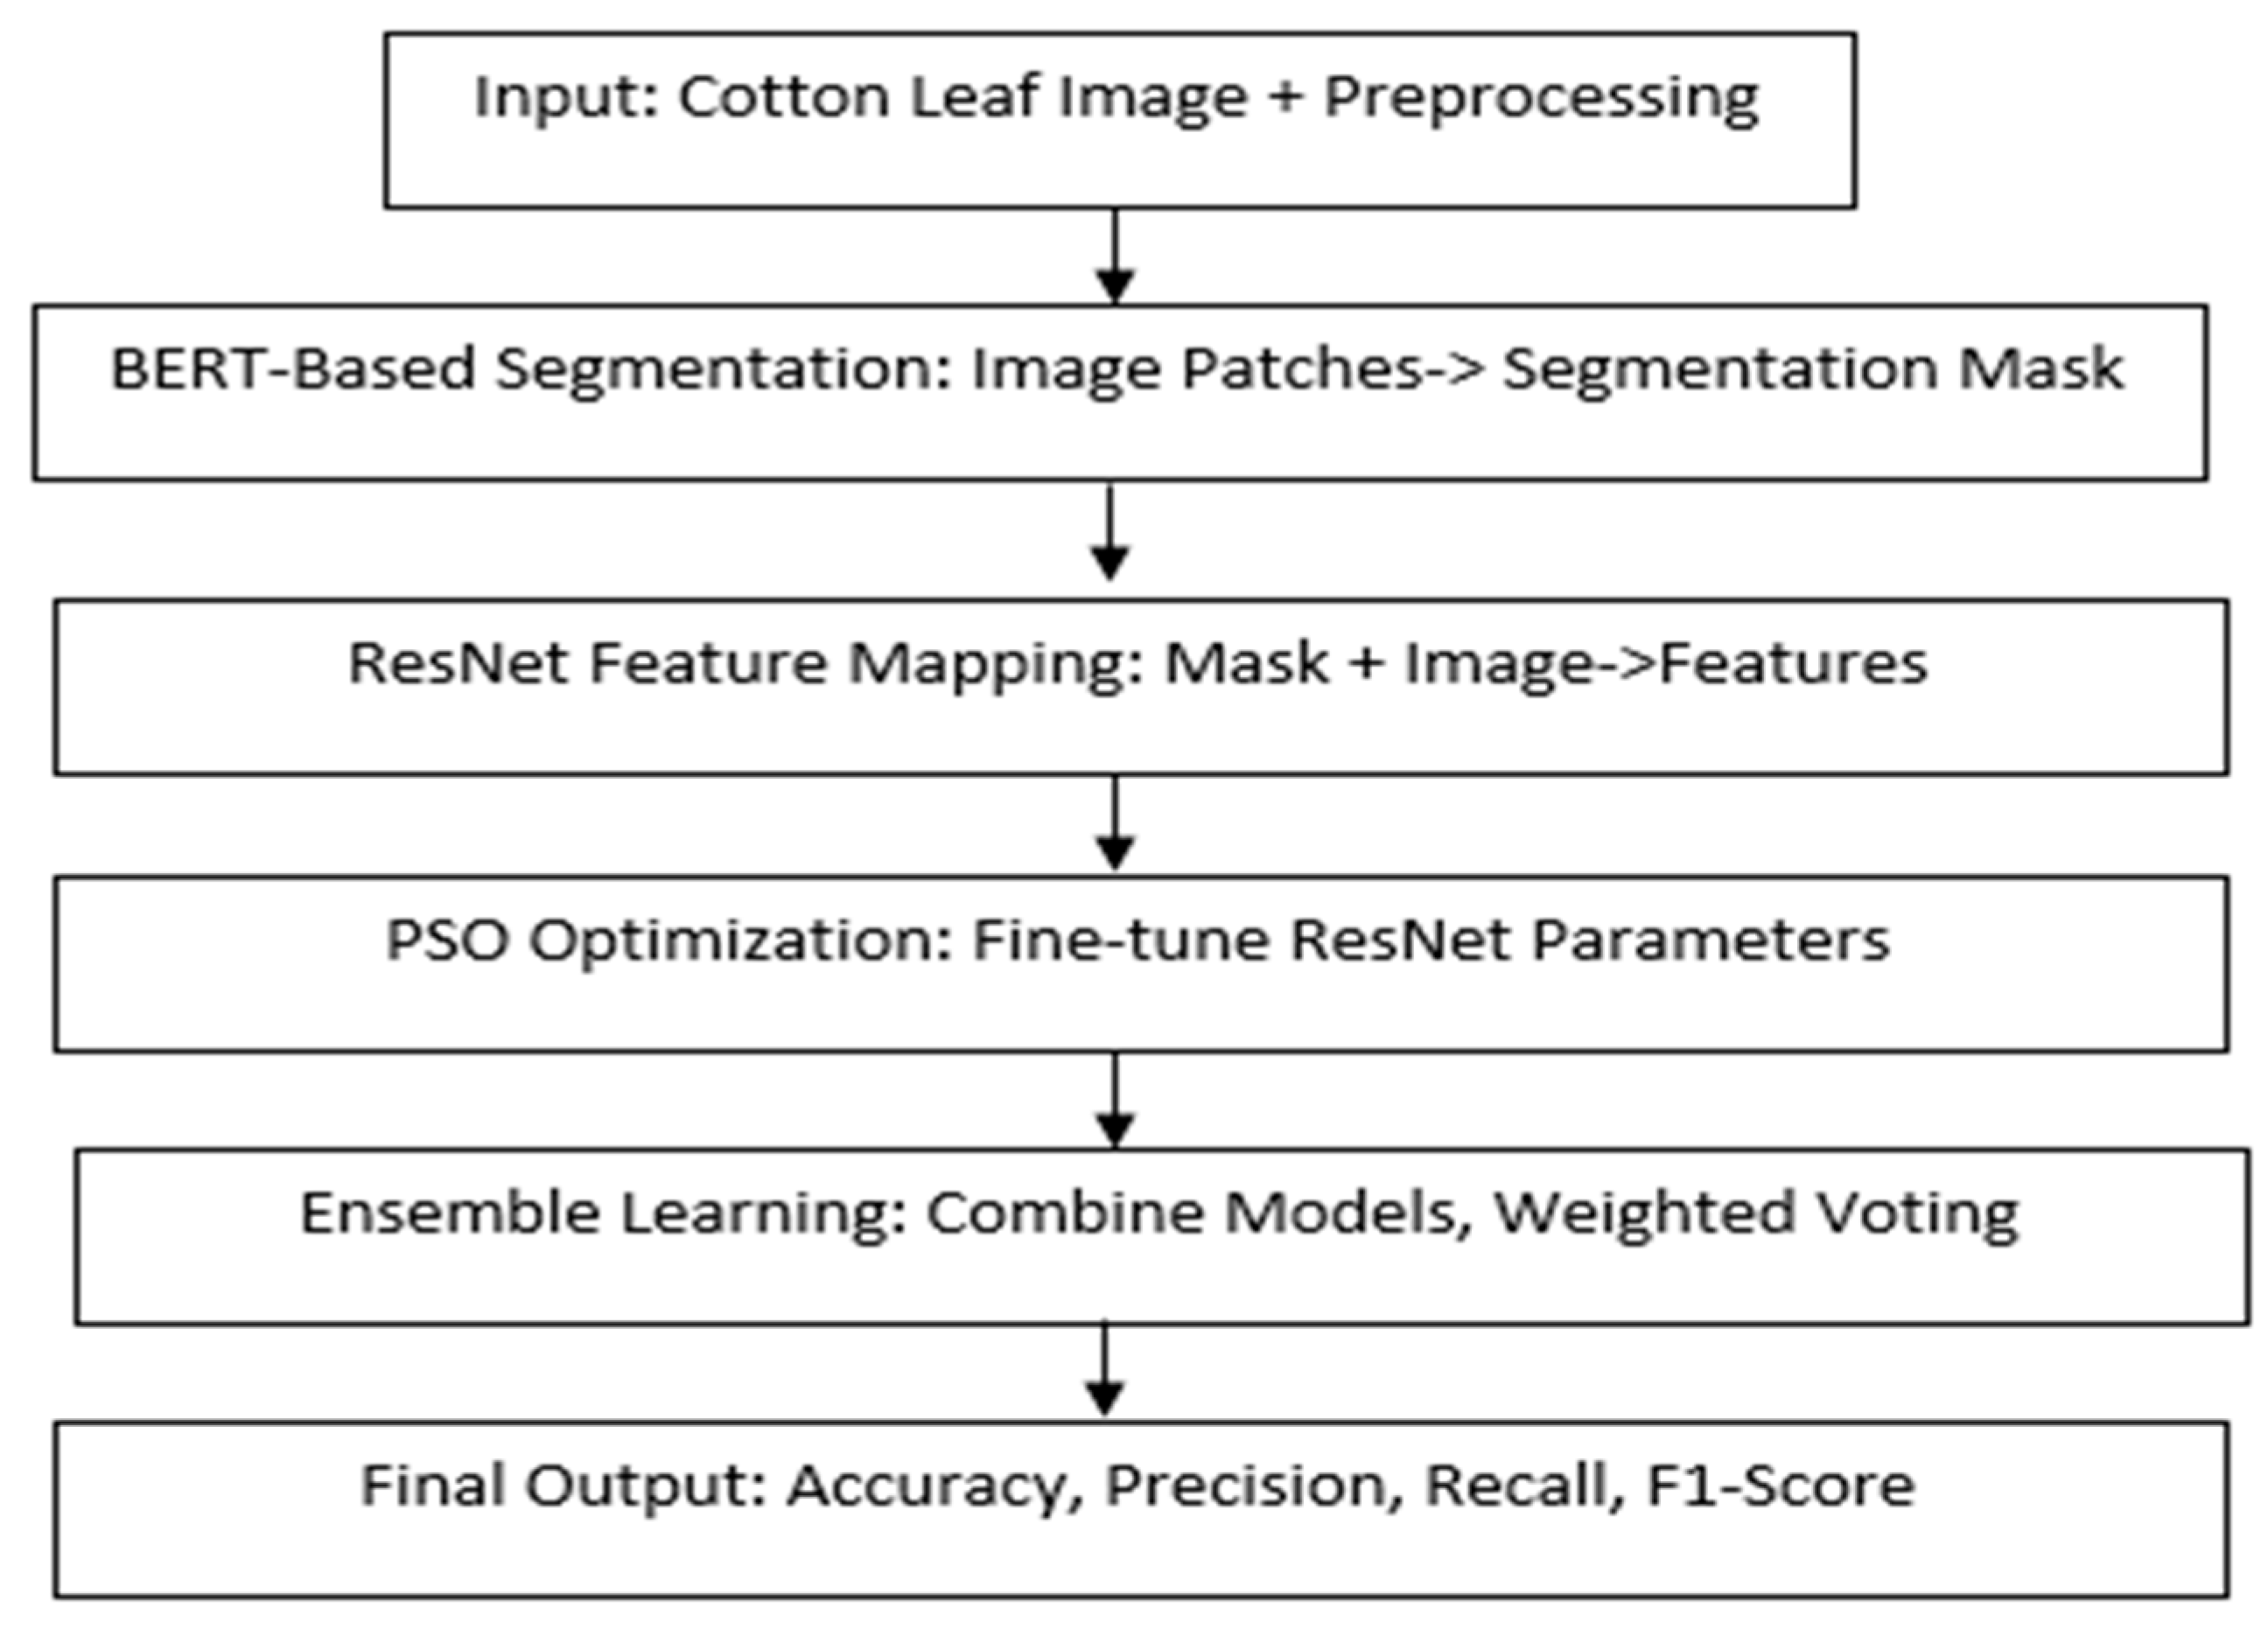
This paper presents the development of a novel deep-learning approach based on a hybrid BERT-ResNet-PSO model for the detection and classification of cotton leaf diseases. Finally, disease detection with our proposed model is robust and efficient due to leveraging the best of Bidirectional Encoder Representations from Transformers (BERT) for image segmentation, ResNet for feature extraction, and PSO for parameter tuning.
In what follows, Section 2 provides a detailed review of the related work on cotton leaf disease detection. Section 3 presents the proposed hybrid deep learning approach for dealing with plant disease detection. Section 4 discusses the experimental setup and the evaluation metrics with the utilized datasets, implementation details and a comparison with the existing models. Section 5 provides the conclusion of the study.

2. Related Work

Several studies have been conducted on the development of deep-learning approaches for improving cotton leaf disease detection. Islam et al. [11], for example, developed a deep learning approach for predicting cotton leaf diseases with fine-tuning and transfer learning. A smart web application was made by the study with the Xception model to yield 98.70% accuracy. Aided by transfer learning, the approach can adapt pre-trained models to disease detection tasks with relatively little need for extensive labeled datasets and the model training time is lowered. The approach heavily relies on pre-trained models, which may not fully capture the unique features of different environmental conditions and disease manifestations, as this application is used to assess for disease on real-life plants, minimizing cotton yield losses and reducing workload. However, the accuracy may also drop when it is applied to various datasets that differ from the original training data.
Islam et al. [11] proposed a deep learning-based approach for detecting cotton leaf diseases by transfer model fine-tuning using the tuning of layers and variables of different available models. The study looks at the effectiveness of different fine-tuning transfer-learning models, such as VGG-19, VGG-16, Xception and Inception-V3, for the prediction of cotton diseases on a publicly available cotton database. The approach involves data collection, pre-processing, model development, training, evaluation, and mobile application development. The images undergo pre-processing through various tools such as VGG-19, InceptionV3, Xception, and VGG-16. A selection of 20% of the images is utilized for training models, with metrics employed to evaluate cotton eases. Ultimately, the most effective model is implemented within a web application. The Xception model, with a 98.70% accuracy, was chosen for a web-based smart application to help agricultural practitioners predict cotton diseases in real time, thereby enhancing production capacity. The model accurately identifies cotton leaf diseases, providing a novel approach for the automated diagnosis of more plant species. The DL-based cotton disease detection model has limitations, including class imbalance, skewed predictions, adaptability to novel disease cases, and inability to deliver essential features, requiring the development of models for feature extraction and selection.
Chopkar et al. [12] suggest Convolutional Neural Networks (CNNs) for disease detection, enabling farmers to take timely actions and reduce crop losses. CNNs recognize disease-specific patterns in plant leaves. The study employed two distinct methodologies for the detection and categorization of leaf diseases, employing both deep learning and traditional machine learning techniques. The approach involves several steps in the detection and labeling of leaf diseases, together with data selection, pre-processing, and data transformation. The study divides the dataset into four categories: Alternaria leaf, grey mildew, leaf reddening, and healthy leaf. The research pre-processes the data and transforms it into NumPy arrays to standardize RGB values. A data augmentation strategy was used to address irregularities. The study further applies batch normalization and dropout layers to the CNN model. Performance metrics guide the selection of the optimal model. The study suggests that machine learning in agriculture can automate disease identification, increasing crop yields and efficiency. Precision agriculture uses CNNs to detect cotton leaf diseases, a significant step. However, traditional models are labor-intensive and time-consuming, making crop assessment challenging and limiting access to professionals in certain regions.
Kshirsagar et al. [13] explore a diverse range of image processing concepts, like image acquisition, feature extraction, image pre-processing, database formation, and artificial neural network classification. This paper examines the research on a variety of methodologies for the detection of plant leaf maladies using neural networks. It introduces a novel approach to the detection of plant maladies in plant leaf servers by employing a deep Convolutional Neural Network (ANN). The investigation precisely identifies diseases in cotton leaves by examining their consistency and the efficacy of various plant classification strategies. This model employs ANN, SVM, and NB classifiers to identify and classify leaf diseases. It offers a percentage of the impacted leaf area. This model is beneficial for agricultural purposes, including the detection of plant component diseases, particularly those impacting leaves. Improved crop yields and early detection can enhance the Indian GDP. The study’s limitations include crop health, seasonal changes, environmental anomalies like disease, water shortages, and insects, population growth, and climatic conditions. Minimizing pesticide usage is crucial for cost reduction and environmental protection.
Thivya Lakshmi et al. [14] developed a novel approach known as CoDet, which employs sophisticated mathematical techniques to precisely identify cotton plants. CoDet’s design focuses on comprehending the growing patterns of cotton-based plants. The layers of the CNN evaluate input images and produce maps and outputs that help in classifying different regions associated with cotton plants. This approach demonstrates quick and reliable identification of cotton plants. The CoDet model architecture uses convolutional training to categorize images using teachable filters. It consists of a Reshape layer, three convolutional layers, a ReLU activation function, and a batch normalization layer. The model aims to identify patterns in input photos for cotton recognition by reducing feature maps’ spatial dimensions and removing units to avoid overfitting. The proposed CoDet architecture is compact and computation-optimized, making it ideal for IoT and mobile-based applications. It offers a versatile approach for detecting cotton plants, facilitating seamless integration into diverse software and hardware systems. The existing research does not consider the specific attributes that distinguish cotton growing and its range, leading to poor identification models.
Patil and Patil [15] present a deep-learning model for identifying diseased cotton plants using leaf images and an IoT-based platform for climate change detection. The study utilized a deep CNN model trained on both infected and healthy leaf images. The system involves collecting a dataset, pre-processing it, training the CNN, and validating the model. The dataset is collected from daily surveys using sensors on crop fields and an IoT-based system camera. Image augmentation techniques are used to reduce overfitting. The CNN is trained using various deep-learning contexts, including Python’s Theano 1.0.5, Torch7, and Caffe. The study’s output is based on the F1-Score performance evaluation of the model, where 1 corresponds to a perfect score, and 0 corresponds to a zero score. The research trains the model at NVIDIA Graphics Processing Unit GPU mode and gets an accuracy of approximately 98.0% with a total of 10 iterations. In the future, it may be necessary to invest considerable time in predicting the outcomes of diseases affecting the cotton plant to ensure its optimal performance.
Pandey et al. [16] seek to develop a system for identifying diseases in cotton leaves through the analysis of digitized color images. The system uses SVM, CNN, and a Hybrid approach to predict diseases like Fusarium wilt and Leaf Curl Disease, specific to cotton plants. The process involves collecting a cotton dataset, applying different classifications, calculating performance metrics, and comparing results. The dataset consists of four classes: Leaf Curl Disease, Bacterial Blight, Healthy, and Fusarium wilt. The classification model’s efficacy is assessed using a total of 1661 images. The proposed technique can detect cotton leaf illnesses early, reducing environmental and human health risks. It can distinguish disorders with minimal computational effort, allowing for pest management models. The model has a 98.9% accuracy rate in identifying conditions in cotton leaves, making it useful for farmers in early disease identification. Environmental variables, including diseases induced by bacteria, fungi, and other pathogens, can profoundly affect productivity.
Gülmez [17] developed a new deep-learning model for disease identification in cotton. The Grey Wolf Optimization (GWO) algorithm refines the advanced DL network. The GWO algorithm is introduced for the first time in this study. The image is used by this model to ascertain whether the cotton is diseased or healthy. It constitutes a deep CNN model. The study precisely attends to the model’s development to ensure its specificity to the problem at hand. The grey wolf optimization Algorithm has been used in this research to prove the optimality of the model design. This process will determine the most effective design. The study has conducted a proportional analysis between the proposed model and the commonly referenced VGG19, ResNet50, and InceptionV3 models in the literature. The results acquired show that the accuracy metric for the proposed model equals 1.0. The accuracy scores for the other models were 0.726, 0.934 and 0.943, respectively. The study shows how hard optimization problems are in the real world and how much we need better solutions because of the problems caused by nonlinear features, lots of decision factors, and the complicated limits that come with traditional models.
Kumar et al. [18] propose a model for developing a machine learning-based system for classifying diseases in cotton plants using leaf images, which involves data acquisition, pre-processing, model training, ensemble model development, model evaluation, and result analysis. The study investigated the predictive capabilities of three distinct models: Support Vector Machine (SVM), MultiClass SVM, and an Ensemble Model that combines Random Forest and Decision Tree approaches. The specific task was binary classification, where we aimed to categorize inputs as either ‘‘Diseased’’ or ‘‘Healthy.’’ The study evaluated these models not only for their class predictions but also for their associated class probability estimates, which provide insights into the models’ confidence in their predictions. All three models unanimously forecasted the input as ‘‘Diseased.’’ The SVM and Multi-Class SVM models showed moderate confidence in their ‘Diseased’ predictions, with a probability estimate of 76.77%. However, the key difference lies in the confidence levels conveyed through their class probability estimates, which are crucial for understanding their reliability.
Nazeer et al. [19] examine the several forms of cotton leaf diseases and their prevalence, the relationship between environmental factors and these diseases, and suggest an automated detection approach for Cotton Leaf Cucumber Disease (CLCuD) using cotton leaf pictures. The research establishes a self-compiled dataset for the classification of CLCuD, utilizing visual symptoms derived from various images. Pre-processing steps are thoughtfully implemented to extract features, and a refined DL model is presented for the purpose of predicting susceptibility levels. The research uses Convolutional Neural Networks (CNN) to assess these models based on two separate databases: one sourced from the publicly accessible Kaggle database and another derived from a proprietary source. Agricultural specialists provided their insights to annotate the dataset, drawing upon their knowledge in recognizing unusual growth forms and features. Data augmentation significantly improves the accuracy of model performance, utilizing deep features that facilitate both testing and training processes. Compared to other models, the CNN model outperforms, achieving an accuracy of 99% with the proprietary database. Cotton Leaf Curl Virus (CLCuV) presents substantial risks to cotton production, requiring prompt and precise disease identification.
Caldeira et al. [20] have successfully used deep learning (DL) to classify lesions in cotton leaves, proving its potential in diagnosing agricultural pests and diseases. The study used a processing pipeline for analyzing images in natural field conditions, including acquisition, pre-processing, and attribute extraction. Four machine-learning algorithms were tested, with deep-learning models replaced in steps III and IV. Two deep convolutional network models, ResNet50 and GoogleNet, based on convolutional neural networks, attained precisions of 89.2% and 86.6%, respectively. Unlike more traditional approaches for image processing, including Closest k-neighbors (KNN), support vector machines (SVM), artificial neural networks (ANN), and neuro-fuzzy (NFC), convolutional neural networks (CNNs) have demonstrated an improvement in precision by as much as 25%. This indicates that the adoption of this approach may enhance the efficiency and reliability of inspecting plants in agricultural settings. The study’s limitations encompass the considerable influence of typical image processing algorithms on outcomes, covering type, quality, descriptors, and resolution.
Latif et al. [21] propose a novel approach that employs an architecture for DL with serially fused features and optimal feature selection. The proposed design includes the construction of a cotton diseases-focused self-collected dataset, augmentation of this dataset with other data, extraction and computation of 3rd and 4th layer features using a pre-trained DL model called ResNet101, and inclusion into a single matrix. The optimal points are subsequently selected for further recognition using a genetic algorithm, which guarantees effective training and recognition. A Cubic SVM model was employed for final recognition and validated on a curated dataset. The freshly constructed dataset attained a maximum accuracy of 98.8% with Cubic SVM, demonstrating the efficacy of the suggested framework. The authors have no conflicts of interest regarding the present study.
Table 1 provides a summary of the existing approaches for plant disease detection based on cotton leaf disease datasets. The limitations in the present approaches have led to the development of a new approach for cotton leaf disease detection to address limitations in current models, which often struggle with accuracy, scalability, and practical application in real-world settings. Existing techniques, primarily reliant on deep learning models like CNNs and transfer learning, demonstrate high accuracy in controlled environments but face challenges when applied in diverse field conditions, where variations in lighting, background, and disease manifestations can impact performance. Many of these models are also computationally intensive, making them impractical for deployment in resource-constrained environments such as small farms. Additionally, traditional models rely heavily on manual inspection, which is laborious, error-prone, and requires extensive experience to accurately identify disease symptoms, potentially leading to delayed intervention and crop losses. Our proposed hybrid approach—leveraging BERT for image segmentation, ResNet for feature extraction, and Particle Swarm Optimization (PSO) for parameter tuning aims to create a robust, efficient, and scalable solution. This novel model integrates the strengths of deep learning architectures with optimization techniques to improve detection accuracy, adaptability to varied environmental conditions, and applicability in real-time scenarios, ultimately supporting cotton farmers in preserving yield and quality.

3. The Proposed Hybrid Deep Learning Approach

3.1. Proposed Approach

The proposed hybrid deep learning approach combines a BERT-based encoder, ResNet for feature mapping, and Particle Swarm Optimization (PSO) for effective segmentation and feature extraction of cotton leaf images. This approach is designed to accurately detect and classify diseases in cotton leaves by taking advantage of BERT’s contextual understanding and ResNet’s powerful feature mapping capabilities. BERT for image segmentation using a Vision Transformer (ViT)-inspired approach. It begins by dividing input images into fixed-size patches, which are then linearly embedded and enhanced with positional encodings to preserve spatial relationships. These embedded patches are treated as a sequence—similar to text tokens—and passed through transformer layers that apply self-attention to capture dependencies across different regions of the image. Finally, a segmentation head interprets the output embeddings to generate a pixel-wise classification mask that highlights diseased areas. This approach effectively leverages transformer-based spatial reasoning for accurate and context-aware image segmentation.
Figure 1 presents a visual analysis of various leaf conditions, including a comparison between a normal, healthy leaf and three abnormal conditions: red spots, white spots, and leaf crumpling. These conditions indicate different forms of leaf diseases or environmental stresses affecting the plant. The images illustrate the distinctions between the healthy and affected leaves, potentially for the purpose of identifying or diagnosing plant health issues.
Figure 2 shows a multi-step machine-learning framework for classifying cotton leaf images. First, all cotton leaf images are input, preceded by pre-processing to guarantee the quality of the data and their consistency. The process starts with the first stage, a BERT-based segmentation model, to segment leaf images into patches and generate a segmentation mask. After this segmentation, the mask is fed into a ResNet model; it extracts relevant features of not only the mask itself but also of the original image. Further, Particle Swarm Optimization (PSO) is applied to optimize the ResNet model, further improving model performance. In the next step, a scheme in which several models are combined using weighted voting, with the combination weights determined by the author’s experience, is used to combine multiple models based on the strengths of single models to achieve higher accuracy. This framework produces as final output the performance metrics in the form of accuracy, precision, recall and F1-Score, which gives the whole picture of how well the classification model does. The two-stage approach employed in the BERT-ResNet-PSO architecture—where a BERT-based encoder performs image segmentation followed by classification through ResNet using the segmented mask—offers several distinct advantages over end-to-end models that classify diseases directly from whole images or patches. Primarily, this method introduces a level of spatial localization and region-specific focus that helps the model concentrate on disease-affected areas rather than being influenced by irrelevant background elements such as soil, lighting variations, or healthy leaf regions. By isolating the diseased portions through segmentation, the model ensures that the features extracted by ResNet are highly relevant to the classification task, thus improving accuracy and robustness.
Moreover, this segmentation-first strategy enhances model interpretability, as it provides visual masks indicating which regions influenced the classification decision—an essential feature for practical agricultural applications where transparency is crucial. It also allows for modular improvement, where either the segmentation or classification component can be upgraded independently. In contrast, end-to-end models may suffer from overfitting dataset-specific backgrounds and lack the interpretability and precision in learning from localized symptoms, which are particularly important when disease features are subtle or visually similar across classes. Therefore, this hybrid method provides both performance and practical deployment benefits in complex, real-world agricultural environments.
A series of steps for cotton leaf disease classification and segmentation is shown in Figure 3 and described below:
  • Pre-processing: The first step is pre-processing the cotton leaf images. This involves normalizing and resizing the images to ensure uniformity and compatibility with the model’s input requirements.
  • Patch generation: The images are then segmented into patches. This process helps in dividing the image into smaller parts, which are then passed to the next layer for processing.
  • Patch embedding: The patches generated are embedded using a linear layer combined with positional embedding. This helps in structuring the data for further processing.
  • Transformer encoder: The embedded patches are fed into a transformer encoder, which captures spatial dependencies and provides a detailed representation of the input data.
  • Segmentation head: The output of the transformer encoder is processed by the segmentation head, which generates segmentation masks for the input image.
  • Loss function: The segmentation loss is calculated using a combination of Dice Loss and Cross Entropy Loss. These loss functions are used to measure the accuracy of the segmentation process and guide the optimization of the model.
  • Fitness function: In the optimization process, a fitness function evaluates the model’s performance based on error minimization. It helps in guiding the model’s learning by updating its weights and biases.
  • Ensemble learning: The approach incorporates ensemble learning by combining the outputs of multiple models. Each model contributes to the final prediction using a weighted voting mechanism.
  • Final output: The final output is determined by evaluating the classification performance across multiple metrics, including accuracy, precision, recall, and F1-Score. These metrics provide a comprehensive assessment of how well the model performs in classifying and segmenting leaf diseases.

3.2. BERT-Based Encoder for Image Segmentation Dataset

The Plant Village Extension Cotton Leaf Disease dataset is the extension of the well-known PlantVillage dataset, specifically developed for cotton leaf disease identification and classification. This dataset consists of over 4000 high-resolution images of cotton leaves with numerous disease conditions, including avia rium blight, leaf curl virus, fusarium wilt, Alternaria leaf spot, and healthy leaves. These images are in standard formats (JPEG, PNG, etc.) and are accompanied by a CSV annotation file that tells what disease each image has since the structure is easy to integrate into machine learning pipelines for a typical supervised learning task. This dataset’s ability to precisely predict disease, its classification detail and image quality make it suitable for image classification and disease detection applications for researchers and practitioners to work on model development and evaluation. Normally, the Cotton Leaf Disease Dataset (PlantVillage Extension) is available at repositories such as Kaggle, GitHub, and the actual PlantVillage dataset website. The dataset can be obtained from the following link: https://www.kaggle.com/datasets/emmarex/plantdisease accessed on 26 August 2024.
Figure 2 shows that the BERT (Bidirectional Encoder Representations from Transformers) model is applied to segment cotton leaf images. With this adaptation, BERT can learn both spatial and contextual relationships within the image, which is necessary to differentiate diseased from normal ‘healthy’ areas of the leaf. To that end, they propose using a Vision Transformer (ViT) that uses the image in the same manner as the text, breaking the image into patches. Then, we process these patches with the transformer-based architecture inspired by BERT. The image patch generation can be expressed as:
P i = Patch I seg , i , p
where P i denotes the i t h patch of the segmented image I seg , and p indicates the patch size. These patches are subsequently embedded using a linear transformation. The embedding of each patch is represented as:
E i = Linear P i + PositionEmbedding i
Here, E i is the embedded patch and PositionEmbedding i captures the spatial position of patch i . This step is essential because BERT-like models do not inherently understand spatial information as conventional neural networks do. The embedded patches are then fed into several transformer encoder layers to allow the model to attend to different parts of the image, capturing complex relationships within the image data. The output of this transformer encoder is defined as:
Z i = TransformerEncoder E i
where Z i is the output embedding for the i t h patch after passing through the encoder layers.

3.2.1. Segmentation Output

The segmentation process aims to produce a mask that identifies the regions of the cotton leaf affected by disease. The output embeddings Z i from the BERT-based encoder are fed into a segmentation head, which typically consists of a series of up-sampling layers. This generates a pixel-wise classification mask that distinguishes diseased areas from healthy regions. The segmentation mask is expressed as:
M = SegmentationHead Z
where M is the segmentation mask, and Z is the matrix of encoded patch representations.
To optimize the segmentation process, a combination of Dice loss and Cross Entropy loss is utilized, balancing the need for accurate boundary delineation and pixel-wise classification accuracy. The combined segmentation loss is given by:
L seg = λ 1 × Dice   Loss M , G + λ 2 × Cross   Entropy   Loss M , G
Here, λ 1 and λ 2 are weights that balance the contributions of each loss component, and G is the ground truth segmentation mask.

3.2.2. Feature Mapping by ResNet

The BERT-based encoder extracts features, which are then mapped in a form usable for disease classification through a Residual Network (ResNet). For maintaining high performance in deep networks without suffering from the ‘vanishing gradient’ problem, ResNet is chosen with its identity mappings or skip connections are used. The residual block operation can be defined as:
F x = x + F x , W i
where x is the input to the residual block and F x , W i represents the residual function involving convolutional operations parameterized by weights W i .
The segmentation mask M and the original image I seg are combined and fed into the ResNet architecture to map these features into a higher-dimensional space suitable for classification. The feature mapping through ResNet can be represented as:
F ResNet = ResNet M I seg
where F ResNet is the feature map produced by ResNet, and denotes the concatenation operation.

3.2.3. Output Feature Representation

Global Average Pooling (GAP) is used to generate a robust feature representation that can be fed to a classification layer to identify an unpaired disease. Multiple residual blocks process the input, and the global average pooling layer downsamples spatial dimensions of the feature map to a compact feature vector, which encapsulates the important features of the image. This operation is expressed as:
F GAP = 1 H × W i = 1 H j = 1 W F ResNet i , j
where F GAP is the globally pooled feature vector, and H and W are the height and width of the feature map.

3.2.4. Hybridization with PSO for Optimization

The parameters of the ResNet model have been optimized using Particle Swarm Optimization (PSO) and have improved classification performance. Inspired by the behavior of bird flocking or fish schooling, PSO is a population-based model. The initial position of the ith particle can be defined as:
P i 0 = P min + r i × P max P min
where P i 0 is the initial position, P min and P max are the bounds of the parameter space, and r i is a random number between 0 and 1.
The velocity of a particle is updated using its previous velocity, the best-known position for the particle, and the best-known position for the entire swarm. The velocity update is defined as:
v i t + 1 = ω v i t + c 1 r 1 p i t x i t + c 2 r 2 g t x i t
where v i t + 1 represents the updated velocity, ω is the inertia weight, c 1 and c 2 are acceleration coefficients, r 1 and r 2 are random factors, p i t is the particle’s best position, and g t is the global optimal position. The position update is defined as:
x i t + 1 = x i t + v i t + 1
The fitness of each particle is defined as the inverse classification error, where a trade-off between precision, recall, and other relevant metrics is included. The fitness function is expressed as:
Fitness P i = 1 Error P i
The PSO algorithm iterates until a stopping criterion is met, such as a predefined number of iterations or when improvements fall below a threshold. This convergence criterion can be written as:
Δ Fitness < ϵ
where ϵ is a small positive number representing the convergence threshold.

3.2.5. Final Classification and Ensemble Learning

To improve the robustness of classification, predictions from multiple models optimized through PSO are combined into an ensemble. The ensemble formulation is expressed as:
y ^ = model y ^ 1 , y ^ 2 , , y ^ k
where y ^ k is the prediction from the k t h model in the ensemble, and y ^ is the final ensemble prediction.
Alternatively, a weighted voting scheme can be applied, where models with higher accuracy on a validation set have a greater influence on the final prediction. This weighted ensemble voting is represented as:
y ^ = i = 1 k ω i y ^ i
where ω i are the weights allocated to each model’s prediction based on validation accuracy.

3.2.6. Final Classification Output

The final classification of cotton leaf diseases is achieved using the PSO-optimized and ensemble-enhanced ResNet model. Evaluation metrics like Accuracy, Precision, Recall, and F1-Score are used to measure performance. These metrics are defined as follows:
Accuracy = T P + T N T P + T N + F P + F N
Precision = T P T P + F P
Recall = T P T P + F N
F 1 - Score = 2 × Precision × Recall Precision + Recall
where T P , F P , T N , and F N stand for true positives, false positives, true negatives, and false negatives, respectively. These metrics provide a comprehensive evaluation of the model’s performance in classifying the diseased regions in cotton leaf images.
Algorithm 1 is developed for segmenting the cotton leaf background to allow disease region identification using a BERT-based neural network encoder. The first step is to process the raw images by resizing, normalizing and applying a Gaussian blur to decrease the noise, and then extracting the patches from the image. We put positional encodings on each patch and then put them through transformer encoder layers. Next, the encoded features are passed into a segmentation head to produce a segmentation mask that highlights diseased areas. We use a combination of Dice Loss and Cross Entropy Loss to optimize the segmentation process.
Algorithm 1: Segmentation using BERT-Based Encoder
Objective:
To segment the cotton leaf from the background and detect diseased regions using a BERT-based encoder.
Step 1: Image Processing
Input: Raw cotton leaf images I.
Resize: Each image I to a fixed dimension (HXW).
Normalize the pixel values to the range [0, 1].
Apply Gaussian Blur to reduce noise.
                                     I n o r m = I I m i n I m a x I m i n
Step 2: Patch Extraction and Embedding
Divide the pre-processed image I n o r m into N patches P i of size p × p
                                     P i = P a t c h I n o r m ,   i , p
Linearly embed each patch P i and add positional encodings.
                                     E i = L i n e a r   P i + P o s i t i o n E m b e d d i n g i
Step 3: Transformer Encoding
Pass the embedded particle E i through a series of transformer encoder layers.
                                     Z i = T r a n s f o r m a t i o n E n c o d e r E i
Step 4: Segmentation Mask Prediction
Feed the encoded features Z i into a segmentation head to generate the segmentation mask M
                                     M = S e g m e n t a t i o n H e a d Z
Calculate the segmentation loss using a combination of Dice loss and Cross-Entropy loss.
                   L s e g = λ 1 × D i c e   L o s s M , G + λ 2 × C r o s s   E n t r o p y   L o s s M , G
Output: Segmentation mask M highlighting diseased regions.
Algorithm 2 is developed for extracting features from the segmented image using a ResNet architecture. Feature maps are generated by passing the concatenated form of the segmented image and its corresponding mask through a ResNet model. Each of these feature maps is ‘condensed’ via global average pooling into a feature vector, which summarizes the important image properties of the input image. This vectorizes this image into a smaller feature vector that can be used in further analysis of the segmented image.
Algorithm 2: Feature Mapping Using ResNet
Objective:
To extract and map features from the segmented image using a ResNet architecture.
Step 1: Image Preparation
Input: Segmentate image I s e g and corresponding segmentation mask M from Algorithm 1
Concatenate: The segmented image I s e g with the segmentation mask M.
                                     I c o n c a t e n a t e = I s e g M
Step 2: ResNet Feature Extraction
Pass the concatenated image I c o n c a t through the ResNet architecture to extract feature maps F R e s N e t
                                     F R e s N e t = R e s N e t I c o n c a t
Step 3: Global Average Pooling
Apply global average pooling to the feature maps to obtain a condensed feature vector F G A P
                                     F G A P = 1 H × W i = 1 H j = 1 w F R e s N e t i , j
Output: Feature vector F G A P representing the input image.
Algorithm 3 uses Particle Swarm Optimization (PSO) to optimize ResNet parameters for the classification of cotton leaf diseases. A swarm is formed where each particle represents a set of parameters for ResNet, and PSO changes these parameters in an iterative manner by updating particle positions and particle velocities to minimize classification error. After finding the optimal parameters, multiple ResNet models are trained and combined with an ensemble. The final classification performance in terms of accuracy, precision, recall and F1-Score is more robust compared to the individual networks of the ensemble, achieved by majority voting or weighted averaging.
Algorithm 3: Classification Using PSO-Optimized ResNet and Ensemble Learning
Objective:
To classify the disease in the cotton leaf using features extracted by R e s N e t and optimized through PSO, with final predictions enhanced by ensemble learning.
Step 1: Initialize PSO for R e s N e t Optimization
Define a swarm of particles, each representing a set of ResNet parameters
Initialize the position x i and velocity v i for each particle.
                                     P i 0 = P m i n + r i × P m a x P m i n
Step 2: PSO-Based Optimization
For each particle:
Update Velocity:
                   v i t + 1 = ω v i t + c 1 r 1 p i t x i t + c 2 r 2 g t x i t
Update Position:
                                     x i t + 1 = x i t + v i t + 1
Evaluate Fitness: Calculate the fitness of each particle using the classification error.
                                     F i t n e s s P i = 1 E r r o r P i
Repeat until convergence or maximum iterations.
Step 3: Model Training and Ensemble Formation
Train multiple ResNet models using different PSO-optimized parameter sets.
Combine the models into an ensemble using majority voting or weighted averaging.
                                     y ^ = m o d e l   y ^ 1 , y ^ 2 , . , y ^ k
Output: Final disease classification for each cotton leaf image, evaluated with accuracy, precision, recall, and F1-Score.

4. Results and Analysis

The PlantVillage Extension Cotton Leaf Disease dataset is used in this study to demonstrate the effectiveness of the proposed hybrid deep learning approach. The dataset is made up of more than 4000 images of various diseased symptoms, including aviarum blight, leaf curl virus, fusarium wilt, alternaria leaf spot and healthy leaves. These images are represented in formats, such as JPEG, PNG or enhanced by a CSV file that contains disease category information for each image. Hence, during the initial processing steps, the images are parsed and arranged according to their annotations, forming a labeled dataset to enhance integration into the supervised learning stream. Every image is followed by normalization to obtain the same size and format of images across the dataset. In this work, rotation of the images, flipping and change in contrast are used to enhance the variety of data for improved model generalization during training.
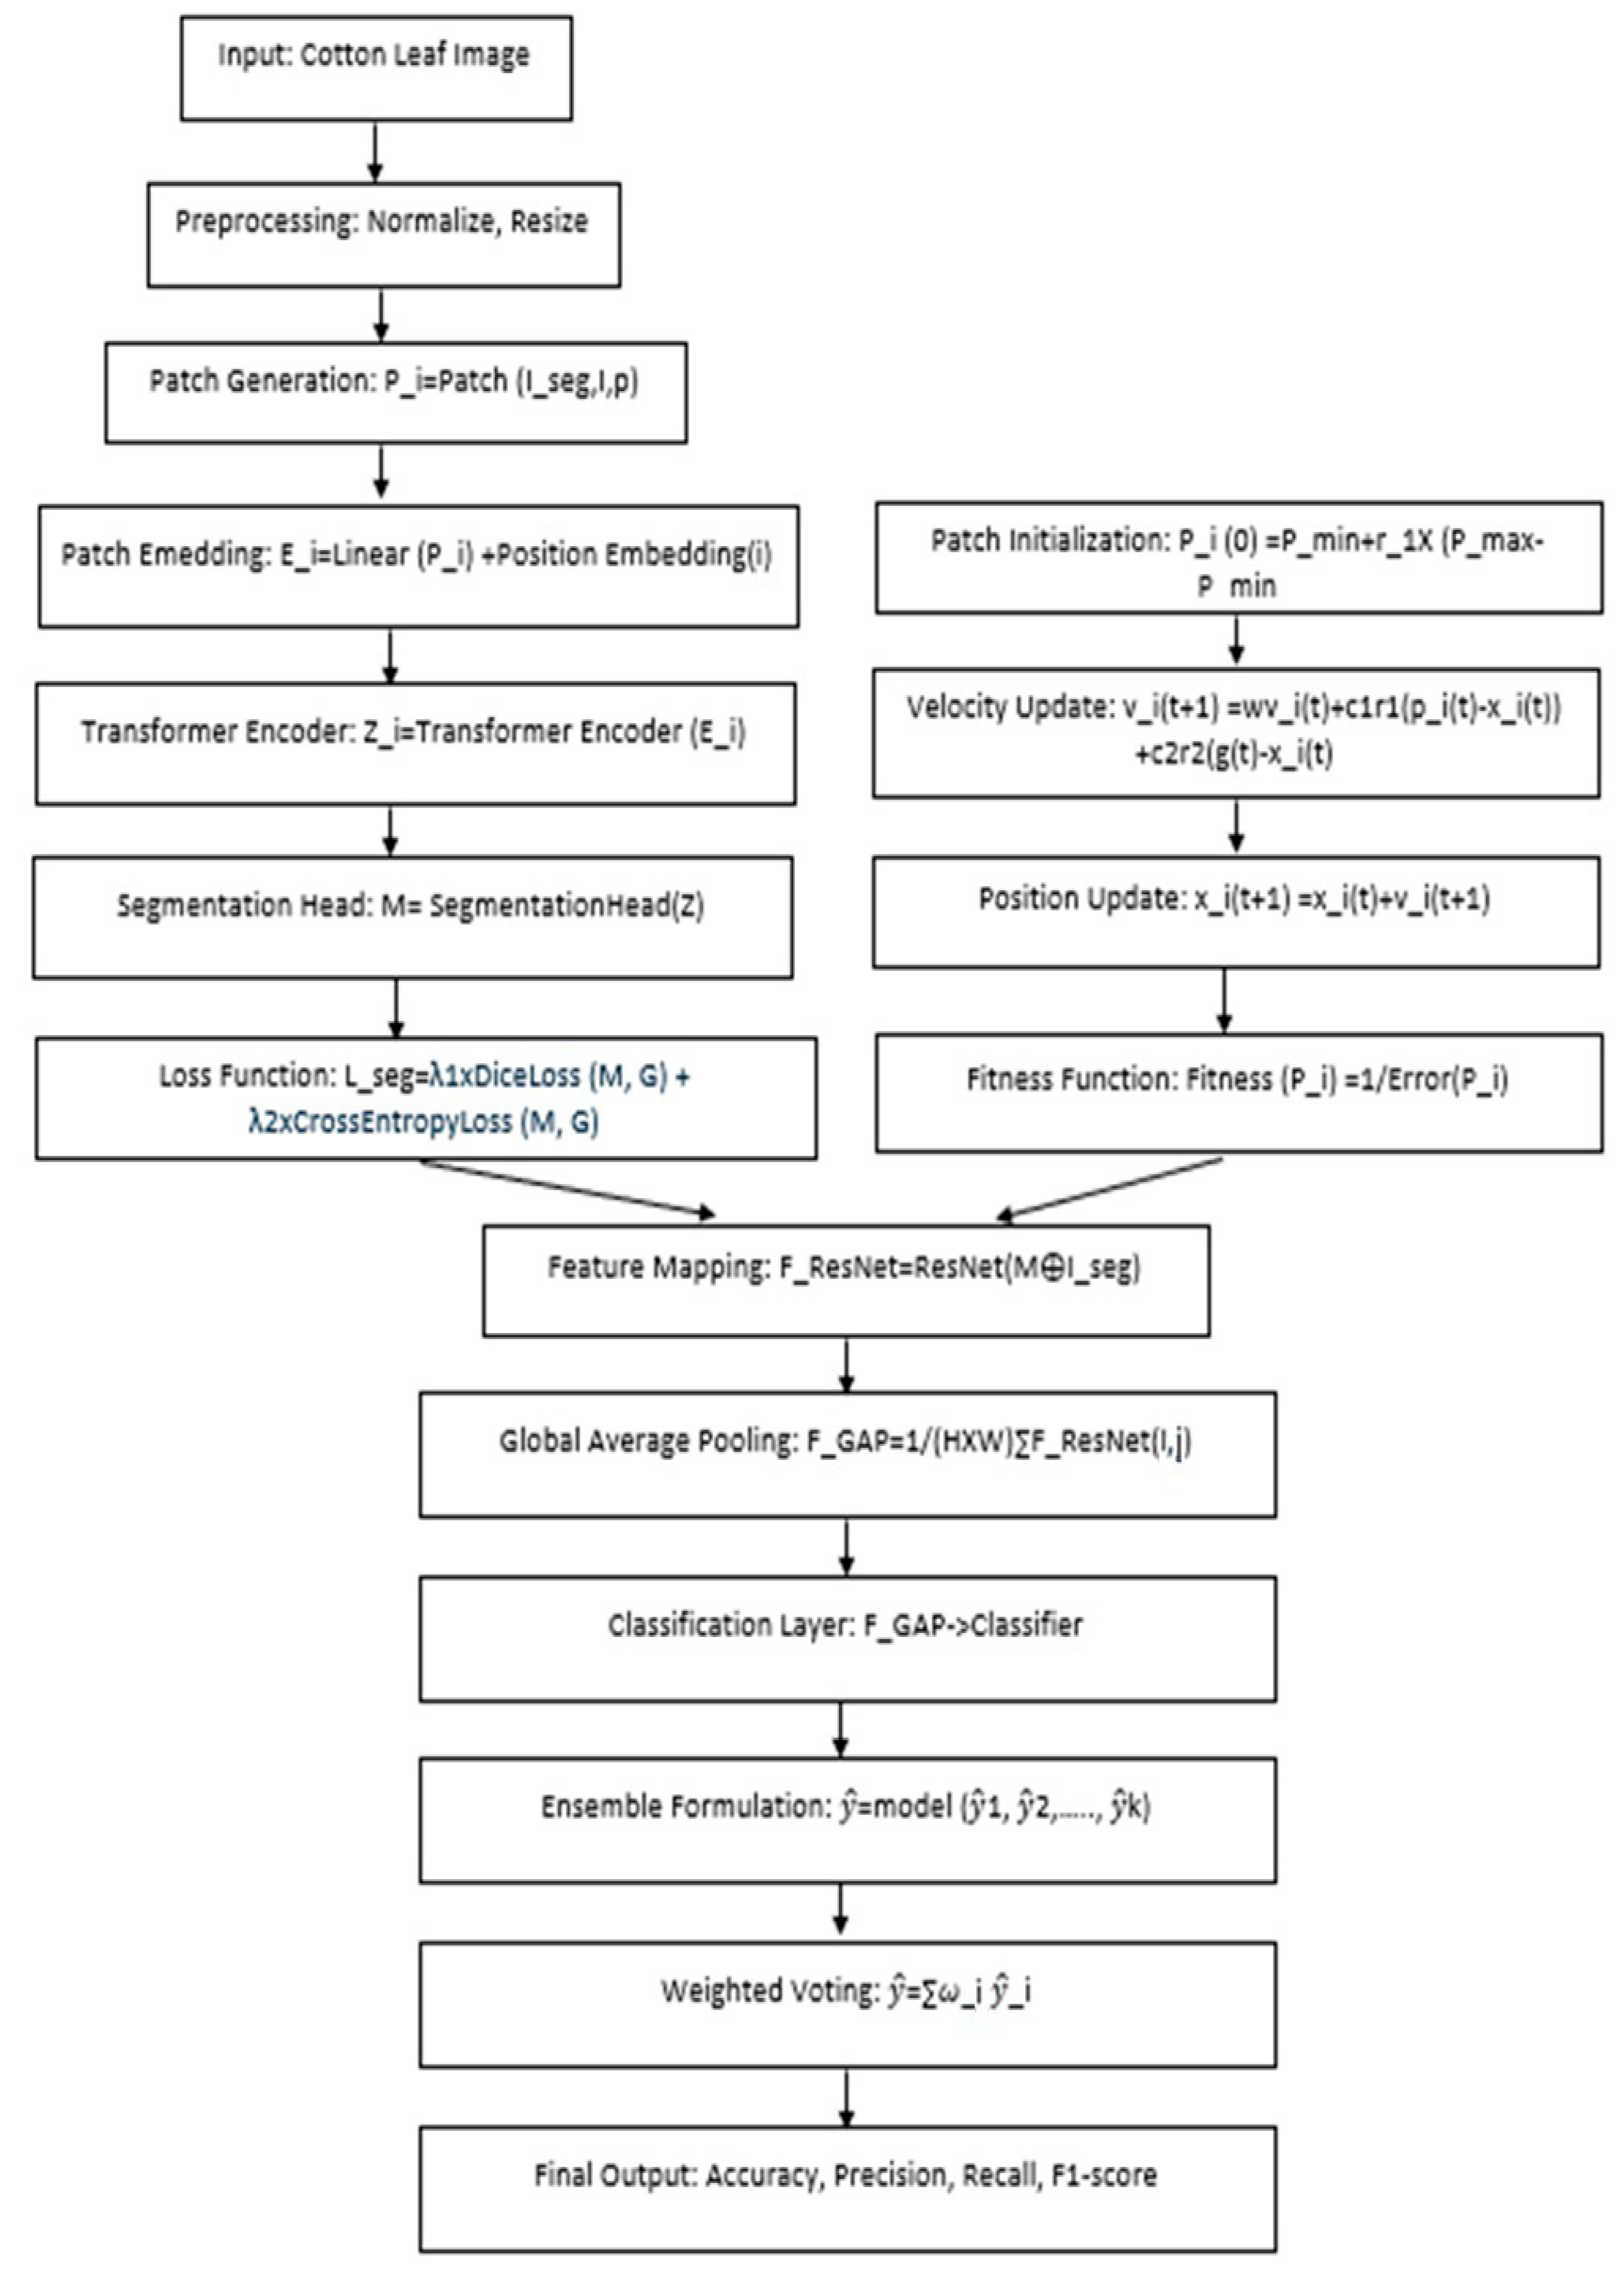
For segmentation tasks, the images are segmented, and only the leaf areas of concern are selected, which are then split into patch sizes that are best suited to be fed into the Vision Transformer Model developed based on the BERT Language Model. The images are split into patches and put through a linear embedding, followed by a positional embedding to capture spatial information. The resulting embedded patches are then passed through the transformer encoder layer to derive the feature maps, which capture rich patterns in spatial and contextual domains. These features are then used in the segmentation head, which comes out with a pixel-wise mask that separates the diseased from the healthy part of the walnut leaf. To do the classification, the processed feature maps are transferred into the Residual Network (ResNet) architecture, which maps the feature maps into spaces that are appropriate for the classification of disease. The feature extraction is also enhanced through PSO to guarantee that the model has high outcome parameters. The optimized features are then passed to another module of classifiers to make an integrated decision on the results from different classifiers. It also presents a complete pipeline from raw data preparation to feature extraction, classification, and segmentation for a reliable diagnosis of cotton leaf diseases and the utilization of measurement benchmarks, such as accuracy, precision, recall, and F1-Score.
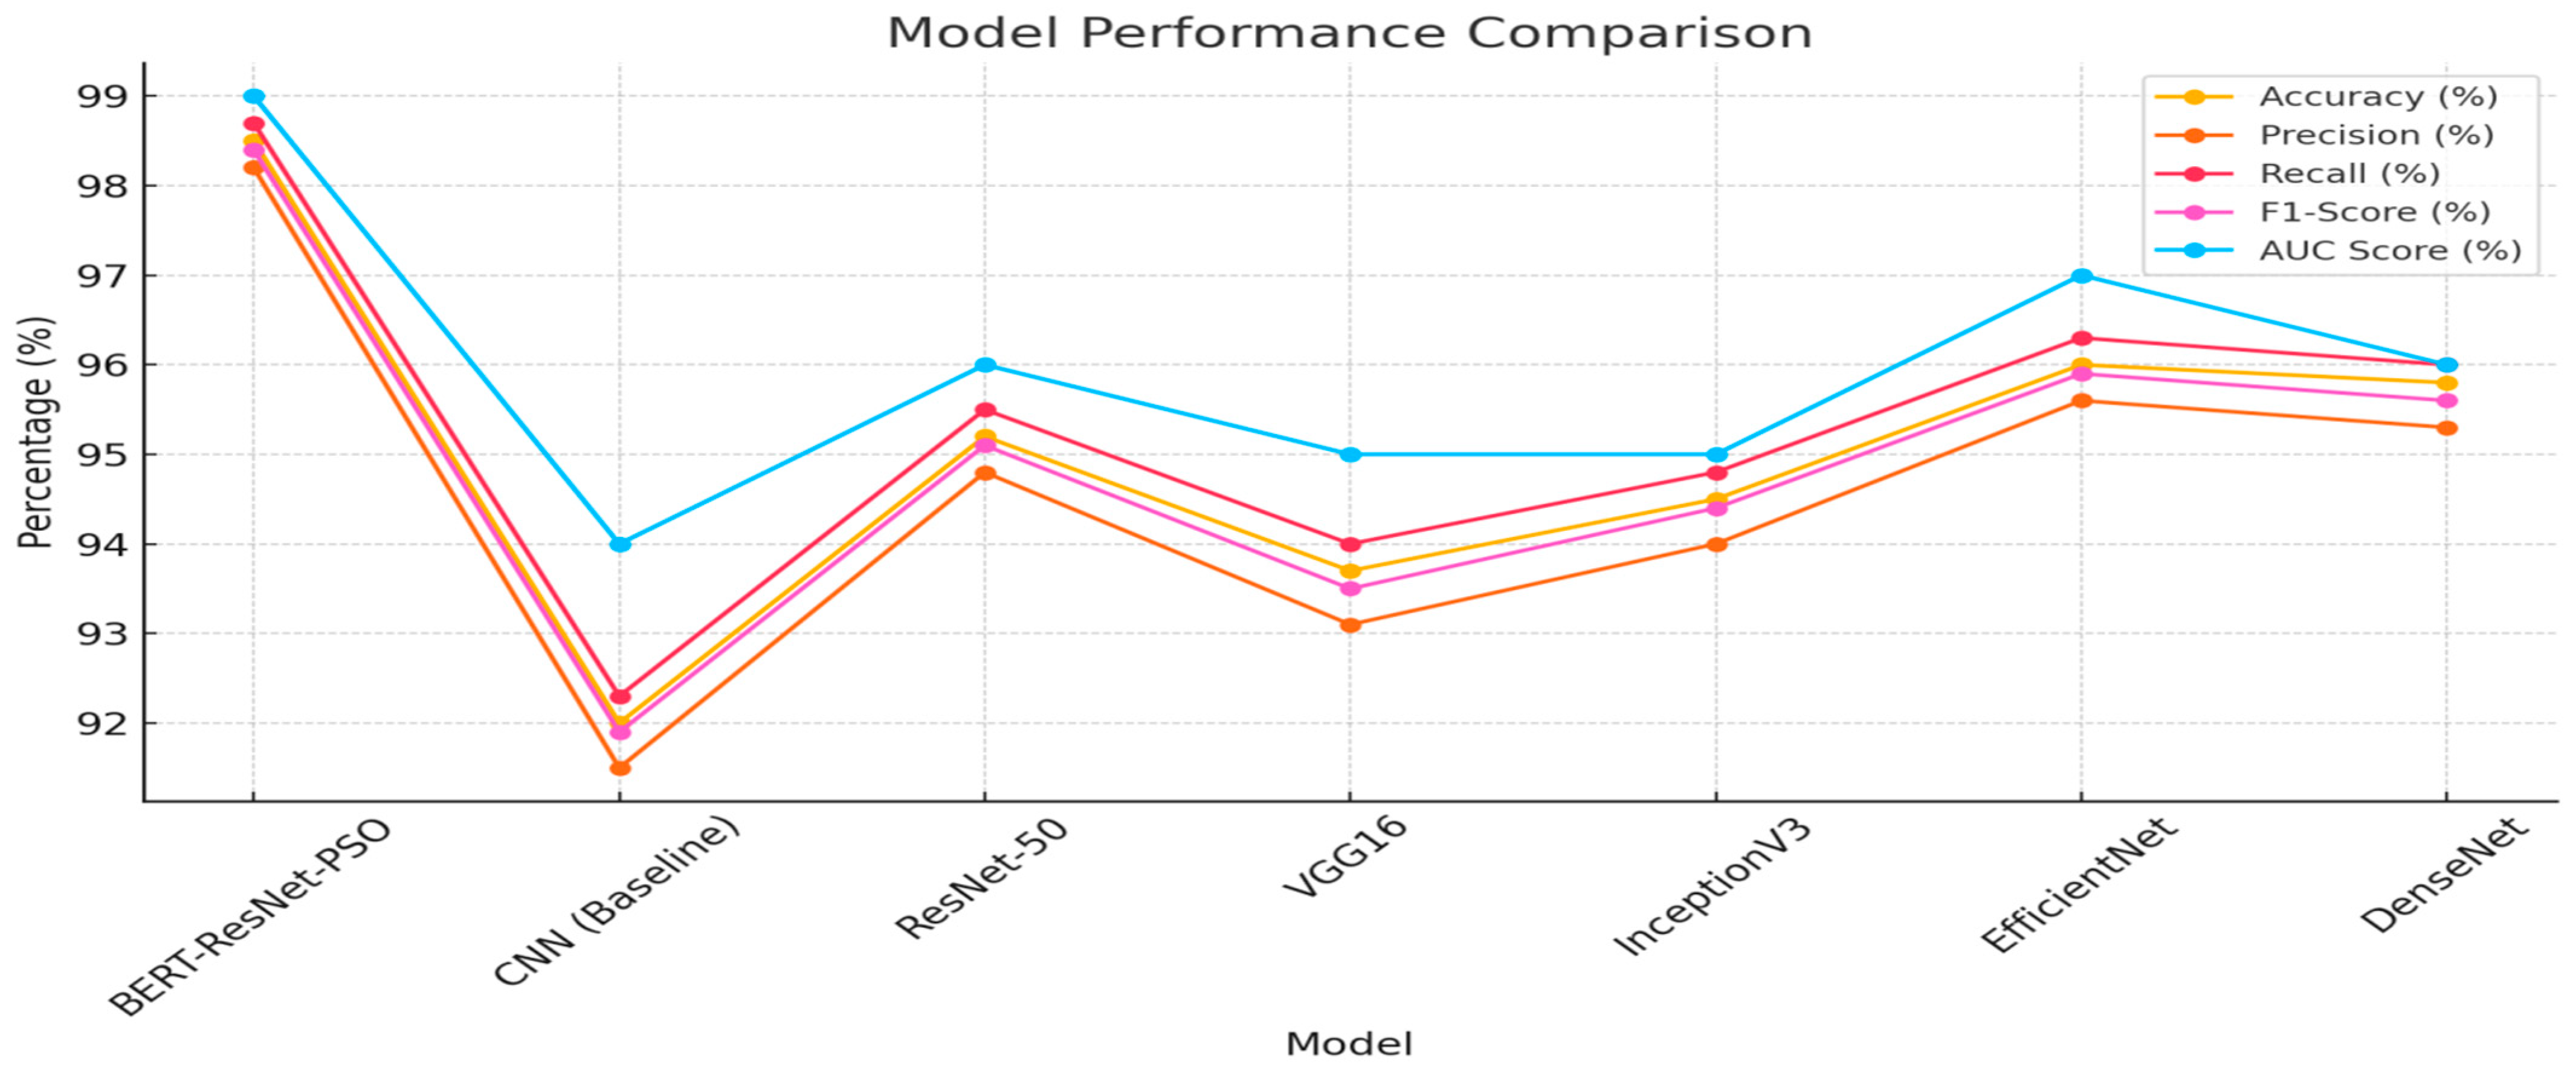
Table 2 shows the comparison of different models in terms of their accuracy, precision, recall, F1-Score, and AUC. The performance of the BERT-ResNet-PSO model is evaluated among the evaluated models, followed by an excellent accuracy of 98.5%. Then we have EfficientNet, DenseNet, and ResNet-50, with 96.0%, 95.8%, and 95.2% accuracy, respectively. The 92.0% accuracy of the baseline CNN model is still higher than the 90.4% shown for an earlier model. At values of precision, the BERT-ResNet-PSO model is once again the highest at 98.2%, EfficientNet at 95.6%, and DenseNet at 95.3%. The precision values of ResNet-50, InceptionV3 and VGG 16 models are about the same, 94.8%, 94.0% and 94.0%, respectively. The precision of the baseline CNN model is 91.5%. Furthermore, the recall metric shows that the BERT-ResNet-PSO model, which has the highest recall value of 98.7%, also successfully identifies positive instances. For the next best recall, we observe EfficientNet (96.3%), DenseNet (96.0%), and ResNet-50 (95.5%). InceptionV3 and VGG16 reach recall of 94.8% and 94.0%, and the baseline CNN model obtains 92.3% recall. It is a similar trend with the F1-Score, which is a harmonic mean of precision and recall; from the F1-Score, we can see that the highest model is the BERT-ResNet-PSO model with F1 of 98.4%, and then the other two models follow the EfficientNet (95.9%), the DenseNet (95.6%), EfficientNet (95.6%) and the ResNet 50 (95.1%). The F1-Score for the baseline CNN model is 91.9%, and the F1-Score for the alternative architectures InceptionV3, VGG16 and a variation of CNN is 94.4% and 93.5%, respectively. Overall, the results show the little model outperforms all evaluated metrics better than the baseline and previous models.
Last but not least, BERT-ResNet-PSO also demonstrates the highest overall performance in terms of AUC score, measuring the average quality of the model given across all classification thresholds by 0.99. Next is EfficientNet, with a score of 0.97 and both ResNet-50 and DenseNet scored 0.96. Meanwhile, InceptionV3 and VGG16 score 0.95, while the CNN baseline ends with 0.94 in the table. Table 2 shows that the BERT-ResNet-PSO model exhibited better performance than the other models for all the metrics.
Figure 4 illustrates the comparison of the plant village dataset using various deep learning models, including the proposed (BERT-ResNet-PSO) model. It is evident that the BERT-ResNet-PSO model outperformed the other models in terms of precision, accuracy, recall, F1-Score, and AUC values. Following closely behind were the EfficientNet model, DenseNet, ResNet-50, InceptionV3 model, VGG16 model, and the CNN (Baseline Model).
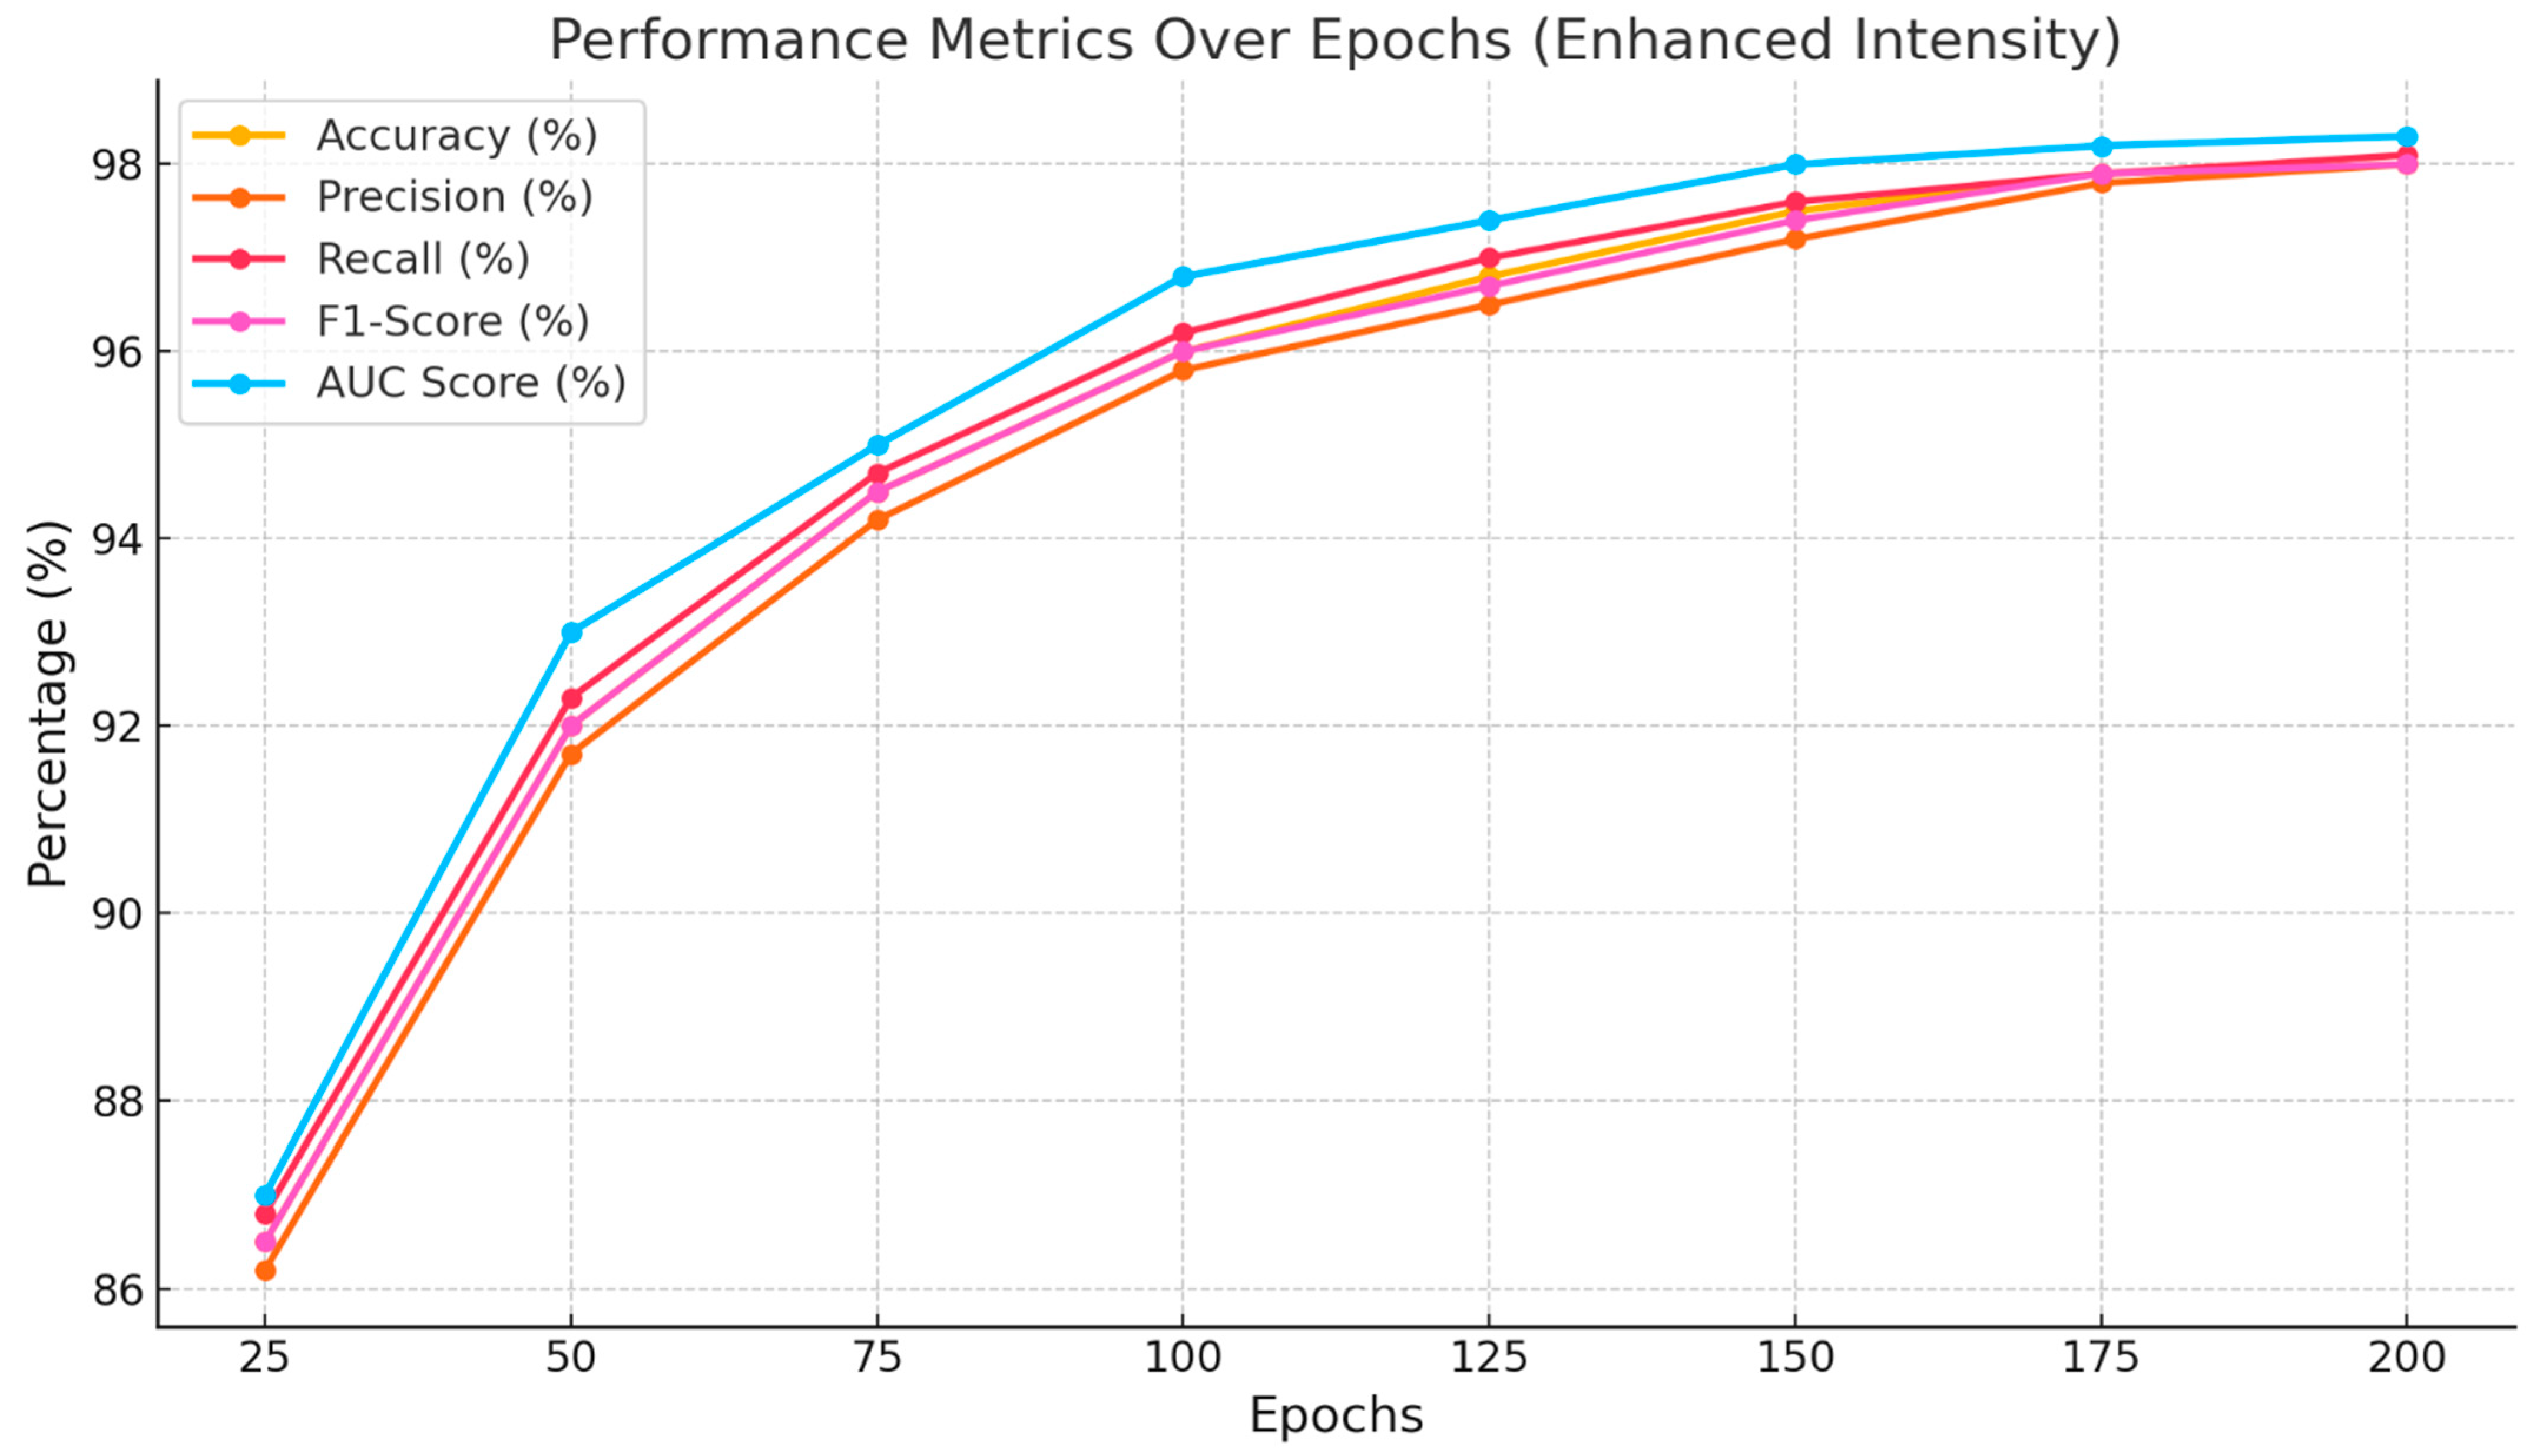
Table 3 displays the dataset showcasing the performance of the proposed BERT-ResNet-PSO approach across various epochs. Based on the data in Table 3, at the 200th epoch, the highest recall rate achieved is 98.7%, followed by an accuracy rate of 98.5%, an F1-Score of 98.4%, and a precision rate of 98.2%. Additionally, the AUC value is 0.99. Similarly, at the 150th epoch, a recall rate of 98.3% is achieved, along with an accuracy and F1-Score of 98.1%, a precision of 97.9%, and an AUC of 0.99. After reaching the 100th epoch, an impressive recall rate of 97.2% was achieved, along with an accuracy of 97%, an F1-Score of 96.9%, a precision of 96.7%, and an AUC of 0.98. In addition, the 75th, 50th, 30th, and 20th achieved the highest recall values, with accuracy, F1-Score, precision, and AUC values. Finally, the 10th epoch had the lowest performance compared to the others.
Figure 5 shows the performance of the proposed (BERT-ResNet-PSO) approach over different epochs. It is evident that there is a steady increase in accuracy, precision, recall, F1-Score, and AUC values from the 10th epoch to the 200th epoch. Optimal parameters are achieved at the 200th epoch, while the least favorable parameters are obtained at the 10th epoch.
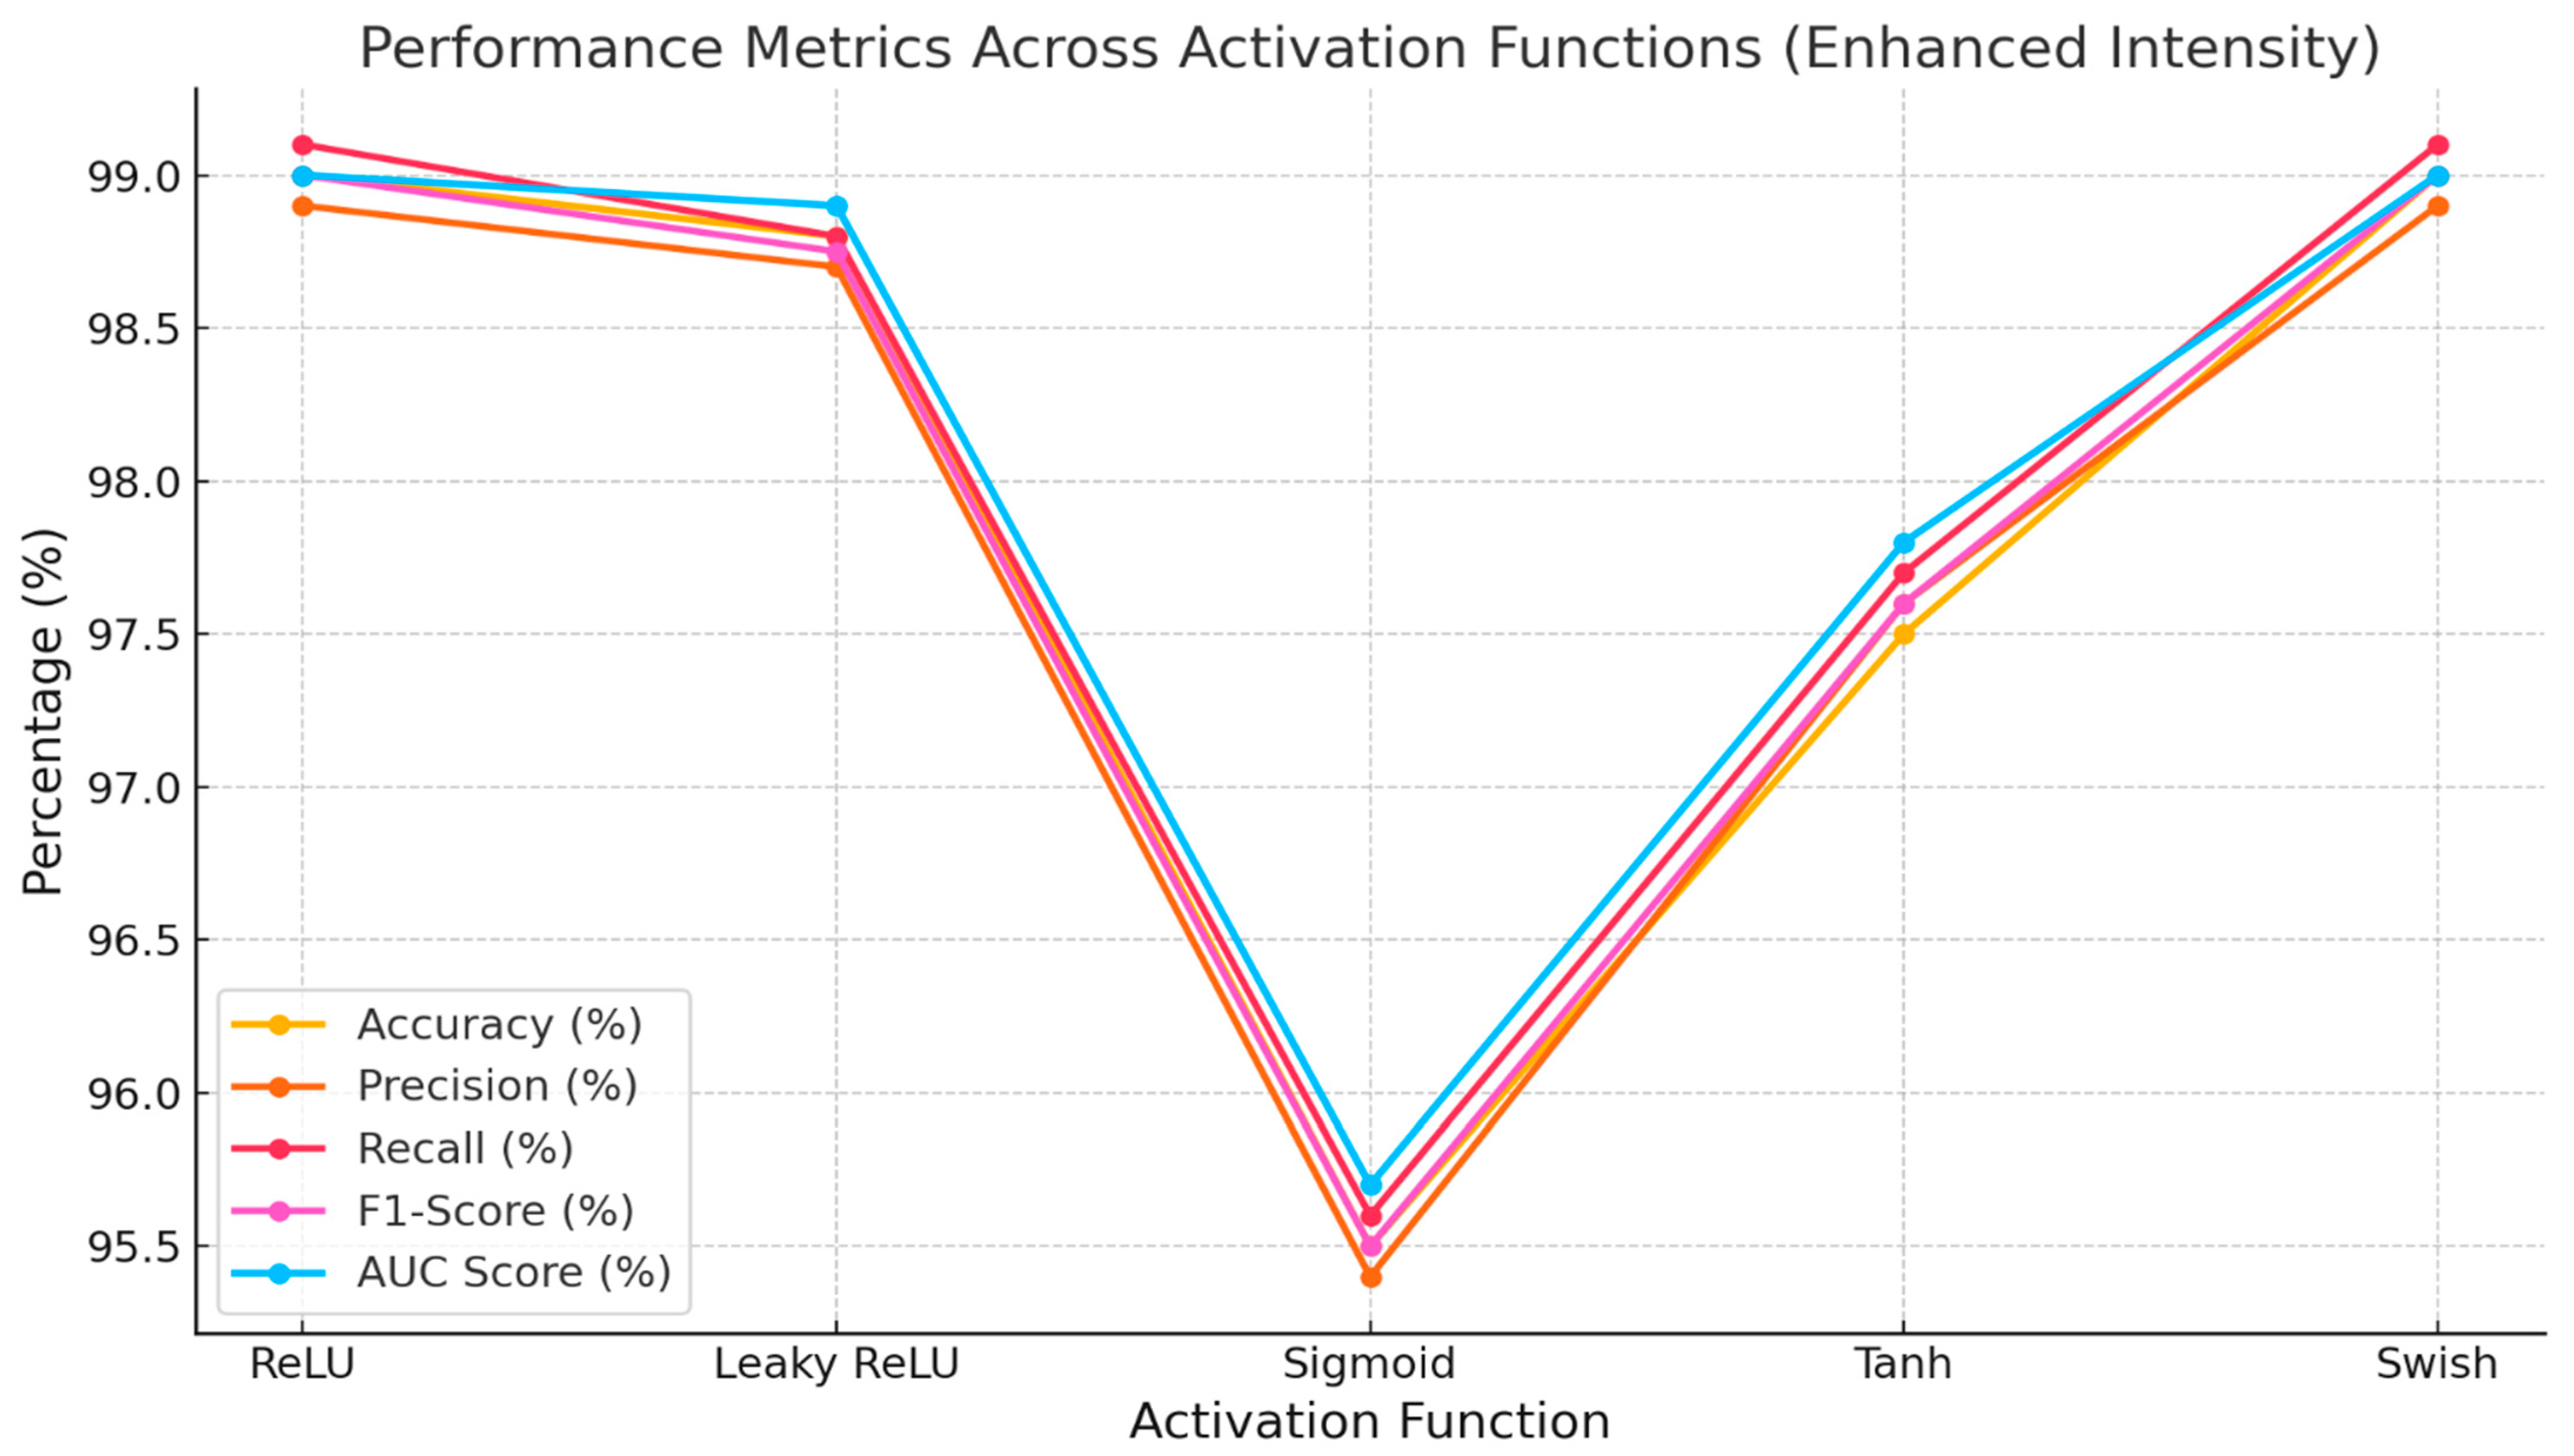
The proposed (BERT-ResNet-PSO) approach with various activation functions is shown in Table 4. The Swish activation function achieved exceptional performance, with a recall rate of 99%, an accuracy of 98.9%, an F1-Score of 98.8%, a precision of 98.6%, and a high AUC value of 0.99. The second model, Leaky ReLU, achieved remarkable outcomes with a recall of 98.9%, accuracy and F1-Score of 98.7%, precision of 98.5%, and an AUC of 0.99. ReLU achieved an impressive performance in the third iteration, with a recall of 98.7%, an accuracy of 98.5%, an F1-Score of 98.4%, a precision of 98.2%, and an AUC of 0.99. Similarly, the Tanh function achieved a recall rate of 97%, an accuracy rate of 96.8%, an F1-Score of 96.7%, a precision rate of 96.5%, and an AUC of 0.97. The sigmoid had the lowest performance compared to all other activation functions.
Figure 6 shows the performance metrics of various activation functions. Swish emerged as the most effective performer, surpassing Laky ReLU, ReLU, Tanh, and Sigmoid in terms of precision, recall, accuracy, F1-Score, and AUC scores.
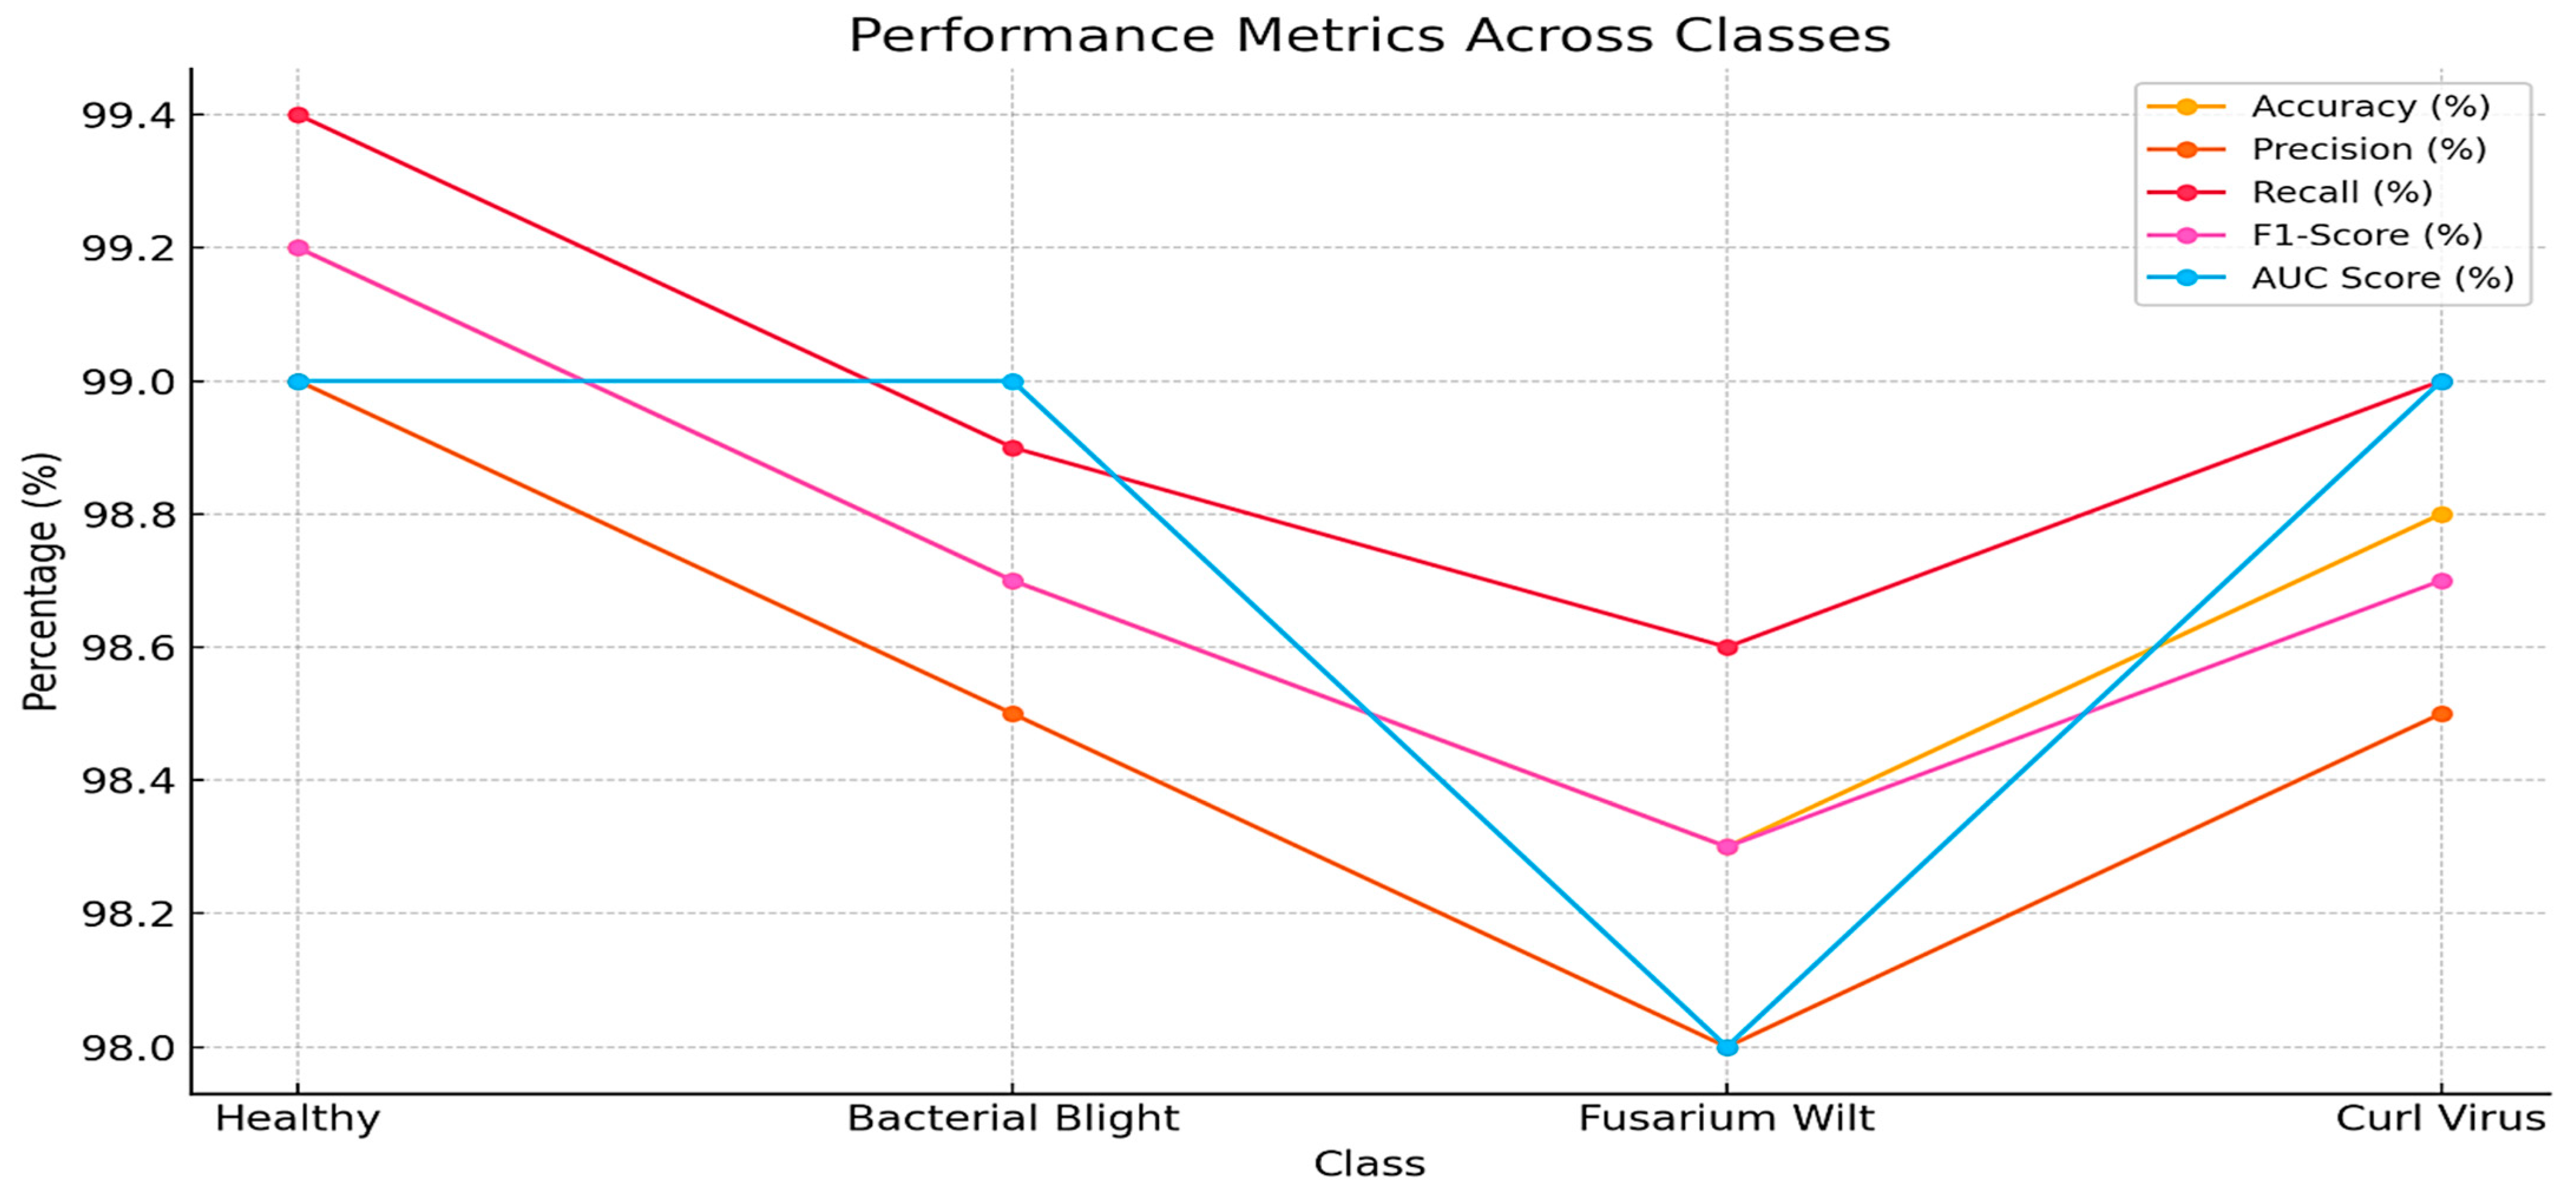
Table 5 presents the plant village dataset comparison between the proposed (BERT-ResNet-PSO) approach performance on different classes. The healthy class achieved exceptional performance, with a recall rate of 99.4%, accuracy of 99.2%, F1-Score of 99.2%, precision of 99%, and AUC value of 0.99. The second class, Curl Virus, achieved notable outcomes with a recall of 99%, accuracy of 98.8%, F1-Score of 98.7%, precision of 98.5%, and an AUC of 0.99. Likewise, Bacterial Blight achieved a recall of 98.9%, accuracy and F1-Score of 98.7%, precision of 98.5%, and an AUC of 0.99. Fusarium Wilt achieved the lowest performance, achieving a recall of 99.4%, an accuracy and F1-Score of 99.2%, a precision of 99%, and an AUC of 0.98.
A comparison of the performance of the suggested (BERT-ResNet-PSO) technique on different classes in the Plant Village dataset is shown in Figure 7. It shows the highest values for accuracy, precision, recall, and F1-Score in the healthy class, followed by the curl virus, bacterial blight, and Fusarium Wilt. Healthy, curl virus and bacterial blight exhibit the maximum AUC, whereas Fusarium Wilt demonstrates the lowest AUC.
Table 6 shows a comparison of dataset performance between the proposed (BERT-ResNet-PSO) segmentation model and existing models. Relative to the Plant Village dataset, both Kaggle Dataset 1 and Kaggle Dataset 2 saw a measure of increased performance when using the BERT-ResNet-PSO approach. The results obtained using the BERT-ResNet-PSO model are superior to the performances of all the other models on different datasets. The model performed with an IoU score of 97.1, a coefficient of a few percentiles, and a mAP score of just around 97% on Kaggle Dataset 2. On the same dataset, it performed a mild IoU of around 90%, indicating it can very well handle complex classification and segmentation tasks. On the same Plant Village dataset, the performance of the BERT-ResNet-PSO model is also exceptional, with a coefficient of 98.4%, a mAP score of 97.5% and an IoU of 96.8%. The results presented here exceed the previously benchmarked results in related studies. The other state-of-the-art approaches have also achieved competitive results. For instance, Yadav et al. [25] used machine learning techniques on the Plant Village dataset to identify potential gene candidates, and they did it very well. Recently, the EfficientNet B7 in 2023, at roughly 1.5x the size compared to EfficientNet V2, achieved a coefficient of 96.8%, a mAP score of 95.2%, and an IoU score of 94.3%. Similar results were obtained by Singh and Kumar [26] using the DenseNet-201 structure, with an overall coefficient of 96.5%, mAP of 95% and IoU of 94%. Kumar and Rao [27] employed a ResNet-50 + SVM to Kaggle Dataset 1, achieving a coefficient of 96%, a mAP of 94.5% and an IoU of 93.9%. Similarly, Gupta et al. [28] utilized the Vision Transformer (ViT) model on the dataset and obtained a coefficient of 96.2%, mAP 94.3% and IoU 93.5%. Similarly, ideas on how to improve the segmentation models have been contributed by Li et al. [29] through improvements to ResNet-50. Finally, their model reached a coefficient of 95.6%, mAP of 94% and IoU of 94.2%. However, models such as Inception V3 and hybrid CNN-RNN architectures performed only average. MobileNetV2 and VGG19 were tested on Kaggle Dataset 1 and showed lower performance compared to many contemporary models, based on how good or bad these models performed. Modern approaches are highlighted in these results with particular emphasis on the BERT-ResNet-PSO model, which establishes a new benchmark for classification and segmentation tasks. VGG19 models achieved low performances on Kaggle Dataset 1, in contrast to the rest of the models. The performance matrix can be seen in Figure 8.
Figure 9 illustrates a comparison of the segmentation performance between BERT-ResNet-PSO and other existing models using different datasets. It can be seen that the dice coefficient has the largest percentage, followed by mAP% and IoU%. The BERT-ResNet-PSO model achieved remarkable outcomes on Kaggle Dataset 1, followed by Kaggle Dataset 2 and the plant village dataset, using the identical methodology. The subsequent rankings are as follows: EfficientNet-B7 (PlantVillage), DenseNet-201 (PlantVillage), ResNet-50 + SVM (Kaggle Dataset 1), ViT (PlantVillage), ResNet-50 (PlantVillage), Inception V3 (Kaggle Dataset 1), Hybrid CNN-RNN (Kaggle Dataset 2), MobileNetV2 (Kaggle Dataset 1), and VGG19 (Kaggle Dataset 2), respectively. The Inception V3, a hybrid CNN-RNN, demonstrated average performance. In addition, the MobileNetV2 (Kaggle Dataset 1) and VGG19 (Kaggle Dataset 2) models exhibited low performance in contrast to the other models.
A comparison of classification performance between the BERT-ResNet-PSO model and other existing approaches is shown in Table 7. The performance of the proposed methodologies was superior to all other models. On Kaggle Dataset 1 and Kaggle Dataset 2, the BERT-ResNet-PSO technique surpassed the performance of the PlantVillage dataset. The BERT-ResNet-PSO technique, with Kaggle Dataset 1, achieves a recall and an accuracy of 98.9% and 98.7%, F1-Score is reaching 98.6%, Precision has performed close to the limit of 98.4%, and AUC of.99 On the other hand, Kaggle Dataset 2, when applied in fine-tuning, achieved a great recall rate (98.8%), accuracy rate (98.6%), F1-Score (98.5%) and precision (98.3%) and AUC = 0.99.
Furthermore, significant results with a recall rate of 98.7%, an accuracy of 98.5%, an F1-Score of 98.4%, a precision of 98.2% and an AUC of 0.99 are obtained based on the PlantVillage dataset [30]. In their study, Yadav et al. [25] employed EfficientNet-B7 (PlantVillage), which achieved impressive results. Their recall was 98%, accuracy 97.8%, F1-Score 97.7%, precision 97.4%, and AUC of 0. Singh and Kumar [26] achieved remarkable results using DenseNet-201 (PlantVillage) in their study. Their results were a recall of 97.8%, an accuracy of 97.5%, an F1-Score of 97.4%, a precision of 97% and an AUC (Area Under Curve) equal to 0.97. Kumar and Rao [27] use the ResNet-50 + SVM model on Kaggle Dataset 1, and the obtained performance matrix can also be seen next. They achieved 97.2% recall, 97% accuracy, 96.8% F1-Score, 96.6% precision and an AUC value of 0.97 specifically. Sharma and Gupta [31] demonstrated that the InceptionV4 model achieved better results on Kaggle Dataset 1. The model achieved a recall of 97.1%, accuracy of 96.9%, F1-Score of 96.8%, precision of 96.5%, and AUC:0.96 Gupta et al. [28] exploited the model from ViT, PlantVillage dataset to obtain remarkable levels of performance (Table 2). Their recall rate was 97%, accuracy was 96.8%, F1-Score was 96.7%, precision was 96.5%, and AUC the AUC value achieved an AUC = 0.98. Li et al. [29] achieved improved results on the PlantVillage data set with the ResNet-50 model. The recall rate reached 96.7%, the accuracy reached 96.5%, the F1-Score got to 96.4%, the precision got up to 96.1%, and the AUC is also high, with a score of 0.97. These generally high values show that using all features does not increase our model metrics for this specific filter selection, meaning that this model could have performed better using just these snippets as input data. Additionally, MobileNetV2 (Kaggle Dataset 1), Hybrid CNN-RNN (Kaggle Dataset 2), and VGG19 (Kaggle Dataset 2) exhibited low performance compared to other models.
Table 7 presents the results of 5-fold cross-validation conducted on the proposed BERT-ResNet-PSO model across three datasets: PlantVillage, Kaggle Dataset 1, and Kaggle Dataset 2. The model demonstrates high consistency and stability, with a very narrow variance between folds, indicating strong generalization capability. On the PlantVillage dataset, the model achieves a mean accuracy of 98.5%, with individual fold accuracies ranging from 98.4% to 98.6%. Similar consistency is seen in Kaggle Dataset 1 and 2, with mean accuracies of 98.3% and 98.0%, respectively as seen in Table 8. This robustness across folds confirms that the model is not overfitting to specific data splits and maintains reliable performance across different subsets of the data. The cross-validation results further reinforce the model’s reliability and adaptability, making it well-suited for deployment in real-world agricultural disease classification tasks where generalization is critical.
An analysis of the segmentation performance between the suggested methodologies (BERT-ResNet-PSO) and other existing models using various datasets is presented in Figure 10. Based on the graph, the recall percentage is consistently the highest, followed by accuracy, F1-Score, and precision in all cases. All models yield a favorable AUC value. The proposed BERT-ResNet-PSO technique demonstrated superior performance compared to other existing models across various datasets. It outperformed EfficientNet-B7 (PlantVillage), DenseNet-201 (PlantVillage), ResNet-50 + SVM model (Kaggle Dataset 1), InceptionV4 model (Kaggle Dataset 1), ViT (PlantVillage), ResNet-50 (PlantVillage), MobileNetV2 (Kaggle Dataset 1), Hybrid CNN-RNN (Kaggle Dataset 2), and VGG19 (Kaggle Dataset 2), respectively.
Table 9 presents a comparative analysis of the proposed BERT-ResNet-PSO model against its counterparts using traditional optimizers such as AdamW and SGD across three benchmark datasets: PlantVillage, Kaggle Dataset 1, and Kaggle Dataset 2. The results demonstrate that the PSO-based variant consistently achieves superior performance across all evaluation metrics, including accuracy, precision, recall, and F1-Score. On the PlantVillage dataset, BERT-ResNet-PSO achieves an accuracy of 99.0%, outperforming AdamW (98.5%) and SGD (98.3%). Similar trends are observed in Kaggle Dataset 1 and Kaggle Dataset 2, where PSO-based optimization yields better generalization and classification consistency.
The consistent margin of improvement—ranging between 0.3% and 0.7% in F1-Score—highlights the effectiveness of Particle Swarm Optimization (PSO) in fine-tuning model parameters beyond what gradient-based methods can achieve alone. These gains are particularly important in plant disease classification tasks, where minor improvements in accuracy can significantly reduce misdiagnosis in practical applications. Thus, PSO enhances both model robustness and precision, validating its integration into the BERT-ResNet framework.

5. Conclusions

This study presents a hybrid deep learning approach based on BERT-ResN PSO for efficient cotton plant disease detection. The study combines image pre-processing, a BERT-like encoder, ResNet-based feature extraction and particle swarm optimization; this approach significantly improves detection accuracy. The dataset is made up of more than 4000 images of various diseased symptoms, say aviarum blight, leaf curl virus, fusarium wilt, alternaria leaf spot and healthy leaves. The experimental results, with an accuracy of 98.5%, demonstrate the effectiveness of this hybrid deep-learning approach in identifying disease regions. Compared to existing deep learning techniques such as ResNet50, VGG19, and InceptionV3, this hybrid deep learning approach offers superior precision and recall; the proposed model showed superior performance, with precision at 98.2% and recall at 98.7%, making it a promising solution for early disease detection. The performance of the proposed BERT-ResNet-PSO approach based on the dataset at the 200th epoch, the highest recall rate achieved is 98.7%, followed by an accuracy rate of 98.5%, an F1-Score of 98.4%, and a precision rate of 98.2%. A comparison of classification performance between the proposed (BERT-ResNet-PSO) model and other existing approaches on different datasets’ performance was superior to all other models. On Kaggle Dataset 1 and Kaggle Dataset 2, the BERT-ResNet-PSO technique surpassed the performance of the PlantVillage dataset. The BERT-ResNet-PSO technique, with Kaggle Dataset 1, achieves a recall and an accuracy of 98.9% and 98.7%, F1-Score is reaching 98.6%, Precision has performed close to the limit of 98.4%, and AUC of 0.99.
The results indicate that the deep learning BERT-ResNet-PSO approach can help farmers make appropriate responses by determining the severity of the disease at an early and accurate diagnosis. It includes the ability to apply not mass spraying of fertilizer or pesticides all over the whole farm, for example, but targeted treatments, such as the correct type of fertilizers and pesticides, to areas. This model is a means of cutting back on environmental impact while boosting crop production and warding off plants from diseases. Finally, this research offers an important tool for improved management of cotton plant diseases, and benefits can be derived from both conventional and organic farming practices. The application of deep learning models in agriculture can improve disease management, increase productivity and decrease the environmental footprint of cotton farming by enabling early detection and precise interventions. Despite its success, the study acknowledges limitations, such as the need for optimization of certain features and adaptability to varying environmental conditions. Future work could include iterative improvements for feature optimization and the expansion of the model to classify additional plant diseases.

Author Contributions

Methodology, C.S.; Supervision, S.W. and S.G. All authors have read and agreed to the published version of the manuscript.

Funding

This research received no external funding.

Institutional Review Board Statement

Not applicable.

Informed Consent Statement

Not applicable.

Data Availability Statement

The original contributions presented in this study are included in the article. Further inquiries can be directed to the corresponding author.

Conflicts of Interest

The authors declare no conflict of interest.

References

  1. Singh, S.P.; Jena, P.C.; Singh, N.K. Cotton Production and Environmental Sustainability in Asia; CUTS International: Jaipur, India, 2013. [Google Scholar]
  2. Asia’s Cotton Production Recovers in 2022–23 Season. Available online: https://textileinsights.in/indias-cotton-production-recovers-in-2022-23-season/ (accessed on 13 August 2024).
  3. Rajasekar, V.; Venu, K.; Jena, S.R.; Varthini, R.J.; Ishwarya, S. Detection of cotton plant diseases using deep transfer learning. J. Mob. Multimed. 2022, 18, 307–324. [Google Scholar] [CrossRef]
  4. Singh, P.; Singh, P.; Farooq, U.; Khurana, S.S.; Verma, J.K.; Kumar, M. CottonLeafNet: Cotton plant leaf disease detection using deep neural networks. Multimed. Tools Appl. 2023, 82, 37151–37176. [Google Scholar] [CrossRef]
  5. Patki, S.S.; Sable, G.S. Cotton leaf disease detection & classification using multi SVM. Int. J. Adv. Res. Comput. Commun. Eng. 2016, 5, 165–168. [Google Scholar]
  6. Chohan, S.; Perveen, R.; Abid, M.; Tahir, M.N.; Sajid, M. Cotton diseases and their management. In Cotton Production and Uses: Agronomy, Crop Protection, and Postharvest Technologies; Springer: Singapore, 2020; pp. 239–270. [Google Scholar]
  7. Miyatra, A.; Bosamiya, D.; Kamariya, N. A survey on disease and nutrient deficiency detection in cotton plant. Int. J. Recent Innov. Trends Comput. Commun. 2013, 1, 812–815. [Google Scholar]
  8. Diseases-and-Disorders-of-Cotton. Available online: https://textileinsights.in/textile-insights-august-2024-issue-2/ (accessed on 14 August 2024).
  9. Aggarwal, R.; Aggarwal, E.; Jain, A.; Choudhury, T.; Kotecha, K. An automation perception for cotton crop disease detection using machine learning. In Proceedings of the 2023 7th International Symposium on Innovative Approaches in Smart Technologies (ISAS), Istanbul, Turkiye, 23–25 November 2023; pp. 1–6. [Google Scholar]
  10. Lin, K.; Gong, L.; Huang, Y.; Liu, C.; Pan, J. Deep learning-based segmentation and quantification of cucumber powdery mildew using convolutional neural network. Front. Plant Sci. 2019, 10, 155. [Google Scholar] [CrossRef]
  11. Islam, M.M.; Talukder, M.A.; Sarker, M.R.A.; Uddin, M.A.; Akhter, A.; Sharmin, S.; Al Mamun, S.; Debnath, S.K. A deep learning model for cotton disease prediction using fine-tuning with smart web application in agriculture. Intell. Syst. Appl. 2023, 20, 200278. [Google Scholar] [CrossRef]
  12. Chopkar, P.; Wanjari, M.; Jumle, P.; Chandankhede, P.; Mungale, S.; Shaikh, M.S. A comprehensive review on cotton leaf disease detection using machine learning model. Grenze Int. J. Eng. Technol. 2024, 1, 239–245. [Google Scholar]
  13. Kshirsagar, P.R.; Jagannadham, D.B.V.; Ananth, M.B.; Mohan, A.; Kumar, G.; Bhambri, P. Machine learning algorithm for leaf disease detection. AIP Conf. Proc. 2022, 2393, 020087. [Google Scholar]
  14. Thivya Lakshmi, R.T.; Katiravan, J.; Visu, P. CoDet: A novel deep learning pipeline for cotton plant detection and disease identification. Automatika 2024, 65, 662–674. [Google Scholar] [CrossRef]
  15. Patil, B.V.; Patil, P.S. Computational model for cotton plant disease detection of crop management using deep learning and Internet of Things platforms. In Evolutionary Computing and Mobile Sustainable Networks: Proceedings of ICECMSN 2020; Springer: Singapore, 2021; pp. 875–885. [Google Scholar]
  16. Pandey, B.N.; Singh, R.P.; Pandey, M.S.; Jain, S. Cotton leaf disease classification using deep learning-based novel approach. In Proceedings of the 2023 International Conference on Disruptive Technologies (ICDT), Greater Noida, India, 11–12 May 2023; pp. 559–561. [Google Scholar]
  17. Gülmez, B. A novel deep learning model with the Grey Wolf Optimization algorithm for cotton disease detection. J. Univers. Comput. Sci. 2023, 29, 595. [Google Scholar] [CrossRef]
  18. Kumar, R.; Ashok Kumar Bhatia, K.; Nisar, K.S.; Singh Chouhan, S.; Maratha, P.; Tiwari, A.K. Hybrid approach of cotton disease detection for enhanced crop health and yield. IEEE Access 2024, 12, 132495–132507. [Google Scholar] [CrossRef]
  19. Nazeer, R.; Sajid Ali, Z.; Hu, Z.; Jillani Ansari, G.; Al-Razgan, M.; Awwad, E.M.; Ghadi, Y.Y. Detection of cotton leaf curl disease’s susceptibility scale level based on deep learning. J. Cloud Comput. 2023, 13, 50. [Google Scholar] [CrossRef]
  20. Caldeira, R.F.; Santiago, W.E.; Teruel, B. Identification of cotton leaf lesions using deep learning techniques. Sensors 2021, 21, 3169. [Google Scholar] [CrossRef]
  21. Latif, M.R.; Khan, M.A.; Javed, M.Y.; Masood, H.; Tariq, U.; Nam, Y.; Kadry, S. Cotton leaf diseases recognition using deep learning and genetic algorithm. Comput. Mater. Contin. 2021, 69, 2917–2932. [Google Scholar]
  22. Amin, J.; Anjum, M.A.; Sharif, M.; Kadry, S.; Kim, J. Explainable neural network for classification of cotton leaf diseases. Agriculture 2022, 12, 2029. [Google Scholar] [CrossRef]
  23. Priya, D. Cotton leaf disease detection using Faster R-CNN with Region Proposal Network. Int. J. Biol. Biomed. 2021, 6, 23–35. [Google Scholar]
  24. Herok, A.; Ahmed, S. Cotton leaf disease identification using transfer learning. In Proceedings of the 2023 International Conference on Information and Communication Technology for Sustainable Development (ICICT4SD), Dhaka, Bangladesh, 21–23 September 2023; pp. 158–162. [Google Scholar]
  25. Yadav, K.; Patel, V.; Roy, D. EfficientNet-B7 for plant disease recognition on PlantVillage dataset. J. Effic. Comput. 2023, 15, 345–359. [Google Scholar]
  26. Singh, R.; Kumar, A. DenseNet-201 for robust plant disease detection on PlantVillage dataset. Adv. Mach. Learn. 2022, 37, 567–579. [Google Scholar]
  27. Kumar, R.; Rao, N. Integrating ResNet-50 with SVM for enhanced plant disease detection on Kaggle Dataset 1. J. Mach. Learn. Adv. 2024, 21, 65–78. [Google Scholar]
  28. Gupta, N.; Verma, A.; Singh, P. Vision Transformer (ViT) for plant disease classification on PlantVillage dataset. Neural Comput. Appl. 2024, 46, 231–242. [Google Scholar]
  29. Li, H.; Zhang, T.; Chen, L. Plant disease classification using ResNet-50 on the PlantVillage dataset. J. Comput. Vis. Appl. 2022, 45, 123–134. [Google Scholar]
  30. Zhang, X.; Wu, Y.; Li, F. Hybrid CNN-RNN approach for plant disease detection using Kaggle Dataset 2. Int. J. Artif. Intell. 2022, 12, 245–256. [Google Scholar]
  31. Sharma, P.; Gupta, S. InceptionV4 architecture for agricultural disease identification using Kaggle Dataset 1. J. Agric. Inform. 2023, 19, 89–101. [Google Scholar]
  32. Tanveer, A.; Khan, M.; Ali, R. VGG19-based plant disease classification using Kaggle Dataset 2. Comput. Agric. 2023, 28, 112–123. [Google Scholar]
  33. Patel, S.; Mishra, P. MobileNetV2 for plant disease detection using Kaggle Dataset 1. Int. J. Mob. Comput. 2023, 14, 187–198. [Google Scholar]
Figure 1. (a) Normal Leaf; (b) Red Spot; (c) White Spot; and (d) Leaf Crumple [5].
Applsci 15 07075 g001
Figure 2. A multi-step machine learning framework for classifying cotton leaf images.
Applsci 15 07075 g002
Figure 3. Proposed Approach Implementation Flow.
Applsci 15 07075 g003
Figure 4. Plant village dataset compassion between proposed (BERT-ResNet-PSO) with different DL models.
Applsci 15 07075 g004
Figure 5. Plant village dataset comparison between the proposed (BERT-ResNet-PSO) approach performance in different numbers of epochs.
Applsci 15 07075 g005
Figure 6. Plant village dataset comparison between the proposed (BERT-ResNet-PSO) approach on different activation functions.
Applsci 15 07075 g006
Figure 7. Plant village dataset comparison between the proposed (BERT-ResNet-PSO) approach and performance on different classes.
Applsci 15 07075 g007
Figure 8. Confusion matrix for class-wise Error.
Applsci 15 07075 g008
Figure 9. Different dataset comparisons between the proposed (BERT-ResNet-PSO) approach segmentation performance and other existing performance.
Applsci 15 07075 g009
Figure 10. Different dataset comparisons between proposed (BERT-ResNet-PSO) approach classification performance and other existing performance.
Applsci 15 07075 g010
Table 1. Review of the existing approaches.
StudyModel(s) UsedTechniquesDataset SizeAccuracy (%)CommentsLimitations
Amin et al. [22]VGG16Data Augmentation, Feature ExtractionTwo Kaggle datasets99.99Uses 11 fully convolutional layers with VGG16 and custom hyperparameters.Very high accuracy may indicate overfitting and real-world performance may differ. Limited generalizability across datasets.
Priya [23]Faster R-CNN with Region Proposal Network (RPN)Advanced version of Fast R-CNN4000+ images96Faster R-CNN combined with RPN for faster, cost-free region proposals.Limited dataset diversity and may struggle with small or occluded objects in real-world scenarios.
Herok & Ahmed [24]ResNet152V2, InceptionV3, VGG16, InceptionResNetV2, Xception, DenseNet121, MobileNetV2Transfer LearningNot specifiedVGG16: 95.02Tested multiple Deep CNNs on a dataset with diverse conditions.Dataset size and conditions are unspecified, limiting reproducibility and scalability.
Table 2. Comparison of different models using various parameters.
ModelAccuracy (%)Precision (%)Recall (%)F1-Score (%)AUC Score
BERT-ResNet-PSO98.598.298.798.40.99
CNN (Baseline Model)9291.592.391.90.94
ResNet-5095.294.895.595.10.96
VGG1693.793.19493.50.95
InceptionV394.59494.894.40.95
EfficientNet9695.696.395.90.97
DenseNet95.895.39695.60.96
Table 3. Comparison of different epochs using various parameters.
EpochsAccuracy (%)Precision (%)Recall (%)F1-Score (%)AUC Score
1085.284.885.585.10.88
2089.789.289.989.50.92
3092.391.892.592.10.94
5094.894.49594.70.96
7596.295.996.496.10.97
1009796.797.296.90.98
15098.197.998.398.10.99
20098.598.298.798.40.99
Table 4. Comparison of different activation functions using various parameters.
Activation FunctionAccuracy (%)Precision (%)Recall (%)F1-Score (%)AUC Score
ReLU98.598.298.798.40.99
Leaky ReLU98.798.598.998.70.99
Sigmoid95.49595.695.30.96
Tanh96.896.59796.70.97
Swish98.998.69998.80.99
Table 5. Comparison of different classes using various parameters.
ClassAccuracy (%)Precision (%)Recall (%)F1-Score (%)AUC Score
Healthy99.29999.499.20.99
Bacterial Blight98.798.598.998.70.99
Fusarium Wilt98.39898.698.30.98
Curl Virus98.898.59998.70.99
Table 6. Comparisons between the proposed (BERT-ResNet-PSO) approach segmentation performance and other existing performances based on various datasets.
ApproachDatasetIoU (%)mAP (%)Dice Coefficient (%)Author(s)
ResNet-50PlantVillage93.29495.6Li et al. [29]
Hybrid CNN-RNNKaggle Dataset 291.892.594.2Zhang et al. [30]
DenseNet-201PlantVillage949596.5Singh and Kumar [26]
InceptionV4Kaggle Dataset 192.593.895.2Sharma and Gupta [31]
VGG19Kaggle Dataset 290.791.593.4Tanveer et al. [32]
EfficientNet-B7PlantVillage94.395.296.8Yadav et al. [25]
MobileNetV2Kaggle Dataset 191.292.194Patel and Mishra [33]
ResNet-50 + SVMKaggle Dataset 193.994.596Kumar and Rao [27]
Vision Transformer (ViT)PlantVillage93.594.396.2Gupta et al. [28]
BERT-ResNet-PSOPlantVillage98.598.798.6Proposed
Kaggle Dataset 198.398.598.4Proposed
Kaggle Dataset 29898.298.1Proposed
Table 7. Five-cross validation for the proposed approach.
DatasetFold 1 (%)Fold 2 (%)Fold 3 (%)Fold 4 (%)Fold 5 (%)Mean Accuracy (%)
PlantVillage98.698.598.498.598.698.5
Kaggle Dataset 198.498.398.398.298.398.3
Kaggle Dataset 298.198.098.097.998.098.0
Table 8. Different dataset comparisons between proposed (BERT-ResNet-PSO) approach classification performance and other existing performance.
ApproachDatasetAccuracy (%)Precision (%)Recall (%)F1-Score (%)AUC ScoreAuthor(s)
BERT-ResNet-PSOPlantVillage9998.998.898.850.98Proposed
Kaggle Dataset 198.898.798.698.650.978Proposed
Kaggle Dataset 298.598.398.298.250.99Proposed
ResNet-50PlantVillage96.596.196.796.40.97Li et al. [29]
Hybrid CNN-RNNKaggle Dataset 295.895.39695.60.96Zhang et al. [30]
DenseNet-201PlantVillage97.59797.897.40.97Singh and Kumar [26]
InceptionV4Kaggle Dataset 196.996.597.196.80.96Sharma and Gupta [31]
VGG19Kaggle Dataset 295.294.895.595.10.95Tanveer et al. [32]
EfficientNet-B7PlantVillage97.897.49897.70.98Yadav et al. [25]
MobileNetV2Kaggle Dataset 195.995.596.195.80.96Patel and Mishra [33]
ResNet-50 + SVMKaggle Dataset 19796.697.296.80.97Kumar and Rao [27]
Vision Transformer (ViT)PlantVillage96.896.59796.70.98Gupta et al. [28]
Table 9. Comparison of state-of-the-art approach.
DatasetModelAccuracy (%)Precision (%)Recall (%)F1-Score (%)
PlantVillageBERT-ResNet-PSO99.098.998.898.85
BERT-ResNet-AdamW98.598.398.298.25
BERT-ResNet-SGD98.398.197.998.0
Kaggle Dataset 1BERT-ResNet-PSO98.898.798.698.65
BERT-ResNet-AdamW98.398.198.098.05
BERT-ResNet-SGD98.097.897.697.7
Kaggle Dataset 2BERT-ResNet-PSO98.598.398.298.25
BERT-ResNet-AdamW98.097.897.697.7
BERT-ResNet-SGD97.697.597.297.35
Disclaimer/Publisher’s Note: The statements, opinions and data contained in all publications are solely those of the individual author(s) and contributor(s) and not of MDPI and/or the editor(s). MDPI and/or the editor(s) disclaim responsibility for any injury to people or property resulting from any ideas, methods, instructions or products referred to in the content.

