Article

Study on the Propulsion Characteristics of a Flapping Flat-Plate Pumping Device

College of Mechanical Engineering, Zhejiang University of Technology, Hangzhou 310023, China
*
Author to whom correspondence should be addressed.
Appl. Sci. 2025, 15(13), 7034; https://doi.org/10.3390/app15137034
Submission received: 20 May 2025 / Revised: 13 June 2025 / Accepted: 18 June 2025 / Published: 22 June 2025
(This article belongs to the Special Issue Application of Computational Fluid Mechanics in Fluid Machinery)

Abstract

Featured Application

This study focuses on the parameter optimization of a bionic flapping flat-plate hydrofoil device operating under low-head conditions in plain river network areas, aiming to address issues such as poor circulation in minor tributaries, sluggish flow velocity, and insufficient self-purification capacity of water bodies. Existing research predominantly concentrates on structural design and motion parameter adjustments of hydrofoils, achieving water propulsion through the coupled heaving and pitching motions. To further enhance the device’s engineering applicability, this work systematically analyzes the influence of the flow channel outlet angle on wake structures and fluid transport. By comparing the wake vortex structures and pumping efficiencies under simple harmonic and quasi-harmonic flapping modes, the study clarifies the critical role of key design parameters in improving pumping efficiency. The findings not only provide a theoretical basis for optimizing ultra-low-head bionic hydrofoil devices, but also facilitate their efficient operation within complex river network ecological environments, contributing to the enhancement of ecological water self-purification functions and the improvement of water quality.

Abstract

To improve hydrodynamic conditions and self-purification in plain river networks, this study optimized an existing hydrofoil-based pumping device and redesigned its flow channel. Using the finite volume method (FVM) and overset grid technique, a comparative numerical analysis was conducted on the pumping performance of hydrofoils operating under simple harmonic and quasi-harmonic flapping motions. Based on the tip vortex phenomenon observed at the channel outlet, the flow channel structure was further designed to inform the structural optimization of bionic pumping devices. Results show both modes generate reversed Kármán vortex streets, but the quasi-harmonic mode induces a displacement in vorticity distribution, whereas that of the simple harmonic motion extends farther downstream. Pumping efficiency under simple harmonic motion consistently outperforms that of quasi-harmonic motion, exceeding its peak by 20.2%. The pumping and propulsion efficiencies show a generally positive correlation with the outlet angle of the channel, both reaching their peak when the outlet angle α is −10°. Compared to an outlet angle of 0°, an outlet angle of −10° results in an 8.5% increase in pumping efficiency and a 10.2% increase in propulsion efficiency.

1. Introduction

With accelerating urbanization, many small channels in plain river networks have suffered from eutrophication and poor water quality due to flat terrain and insufficient hydrodynamic conditions [1,2,3]. To address this issue, water conservancy infrastructures such as pumping stations and sluice gates are commonly used to enhance hydrodynamics and self-purification [4]. However, in narrow tributaries [5] and under low-lift conditions, this approach is costly and often yields limited effectiveness [6], failing to fully resolve water quality degradation in small rivers. Bionic pumping devices [7,8] inspired by fish tail flapping offer high efficiency, low noise, and ecological compatibility under low-lift conditions, providing an effective means of enhancing flow in small rivers—especially under shallow water conditions where they demonstrate distinct advantages [9].
This advantage is closely related to the body structure and swimming mechanisms of fish, which enable low-energy, high-efficiency propulsion and have found applications in fields such as communication engineering, tidal energy harvesting, and underwater rescue [10,11,12,13]. In recent years, with the advancement of hydrofoil fluid dynamics research, the kinematic parameters and optimization of flapping hydrofoils have emerged as key research topics in this field. Tianlong Lin et al. [14] conducted a numerical study on a hydrofoil with an aspect ratio of two under low-Reynolds-number conditions. They found that the thrust coefficient reached its maximum—an increase of 137.12%—when the phase difference between spanwise bending and pitching was 150°, while propulsion efficiency peaked at a phase difference of 270°, exceeding that of a rigid hydrofoil by up to 110.87%. In the study by Xiang Mingwang et al. [15], the bidirectional fluid–structure interaction method was investigated for optimizing the stiffness and flapping modes of flexible hydrofoils. The study employed numerical simulations to analyze the effects of varying stiffness and flapping modes on the hydrodynamic performance of hydrofoils. This provides an optimization approach for ecological water purification under low-head conditions. Ding Hao et al. [16] performed numerical simulations of unsteady hydrodynamic characteristics during flapping hydrofoil propulsion using the Realizable k-ε turbulence model combined with dynamic mesh techniques. The study focused on analyzing how kinematic parameters such as flapping frequency, heave amplitude, and pitch amplitude affect thrust and propulsion efficiency. Du Xiaoxu et al. [17] developed a two-degree-of-freedom model of a two-dimensional rigid flapping hydrofoil to compare four typical flapping modes. Their analysis of average thrust, lift, and flow field structure revealed that the mode with the largest initial pitch angle and synchronized heave and pitch motions achieved the best propulsion performance. Liu Huanxing et al. [18], using the RANS method and fluid–solid interaction modules, investigated the effects of various non-sinusoidal flapping modes on hydrofoil thrust and efficiency. They found that when the maximum effective angle of attack remained below 20°, both average thrust coefficient and propulsion efficiency improved, with maximum efficiency gains reaching up to 40%. Peng et al. [19] built a bidirectional fluid–structure interaction model to study how different flapping modes and structural flexibility affect the propulsion performance of three-dimensional bionic hydrofoils. The results showed that asymmetric flapping achieved higher peak thrust under similar power input, while moderate flexibility enhanced both propulsion efficiency and thrust output. Hua Ertian et al. [19] aimed to improve flow conditions in small river channels and conducted numerical and experimental studies on three different flapping modes. They found that the mode starting with a maximum upward pitch and with pitch and heave in the same direction generated continuous forward thrust throughout the motion cycle, achieving a peak pumping efficiency of 34.1%. These studies collectively contribute to a deeper understanding of flapping hydrofoil propulsion by addressing a variety of influencing factors. For instance, several studies have examined the influence of motion parameters—such as flapping frequency, amplitude, and phase difference—on thrust generation and propulsion efficiency. Others have focused on structural characteristics, including hydrofoil stiffness and flexibility, and their effects on hydrodynamic performance. In addition, a number of works have addressed fluid–structure interactions and wall proximity effects, particularly under low-Reynolds-number or confined flow conditions. Collectively, these investigations offer valuable guidance for the optimization of flapping kinematics, hydrofoil geometry, and channel design in bionic propulsion systems.
However, current research on flapping hydrofoils primarily focuses on kinematic parameters, hydrofoil geometry, and hydrodynamic analysis of propulsion characteristics. Most studies emphasize underwater propulsion systems or energy harvesting applications, typically using unbounded open flow fields in numerical simulations. This approach often neglects the wall effects present in confined environments and lacks investigations into performance differences under varied flapping modes. In terms of flow channel design, Wu Feng et al. [20] proposed a gradually contracting–suddenly expanding channel configuration and systematically studied the effects of three contraction geometries, dimensional ratios, and sidewall distances on emitter flow rate, energy consumption, and flow regime index through combined numerical and experimental approaches. Li Yongcheng et al. [21] conducted comprehensive simulations of a two-dimensional NACA0012 hydrofoil undergoing pitching motions at various wall distances, focusing on how wall proximity, pitch amplitude, and reduced frequency affect thrust coefficient and propulsion efficiency. Jiang et al. [22] were the first to propose integrating a flow channel structure into a flapping hydrofoil system to enhance inflow velocity and improve energy extraction performance. Xu et al. [23] introduced a flapping-hydrofoil device equipped with a diffuser structure and analyzed, using orthogonal design and numerical simulation, the influence of channel design parameters on power coefficient and energy collection efficiency. Dahmani and Sohn [24] proposed a novel bionic energy harvesting system consisting of tandem flapping hydrofoils placed inside a converging guide vane. They investigated the effects of channel contraction ratio, flapping frequency, and phase difference on energy harvesting performance.
This study employs the CFD software Ansys Fluent-2024R2 to numerically investigate the effects of flapping motion patterns and outlet channel structures on flow characteristics and hydrodynamic performance in different pumping devices. Furthermore, it explores optimal configurations of outlet channels, aiming to provide theoretical support and practical guidance for the engineering design and application of bionic pumping systems.

2. Physical Model

2.1. Structure and Working Principle of the Flapping Flat-Plate Device
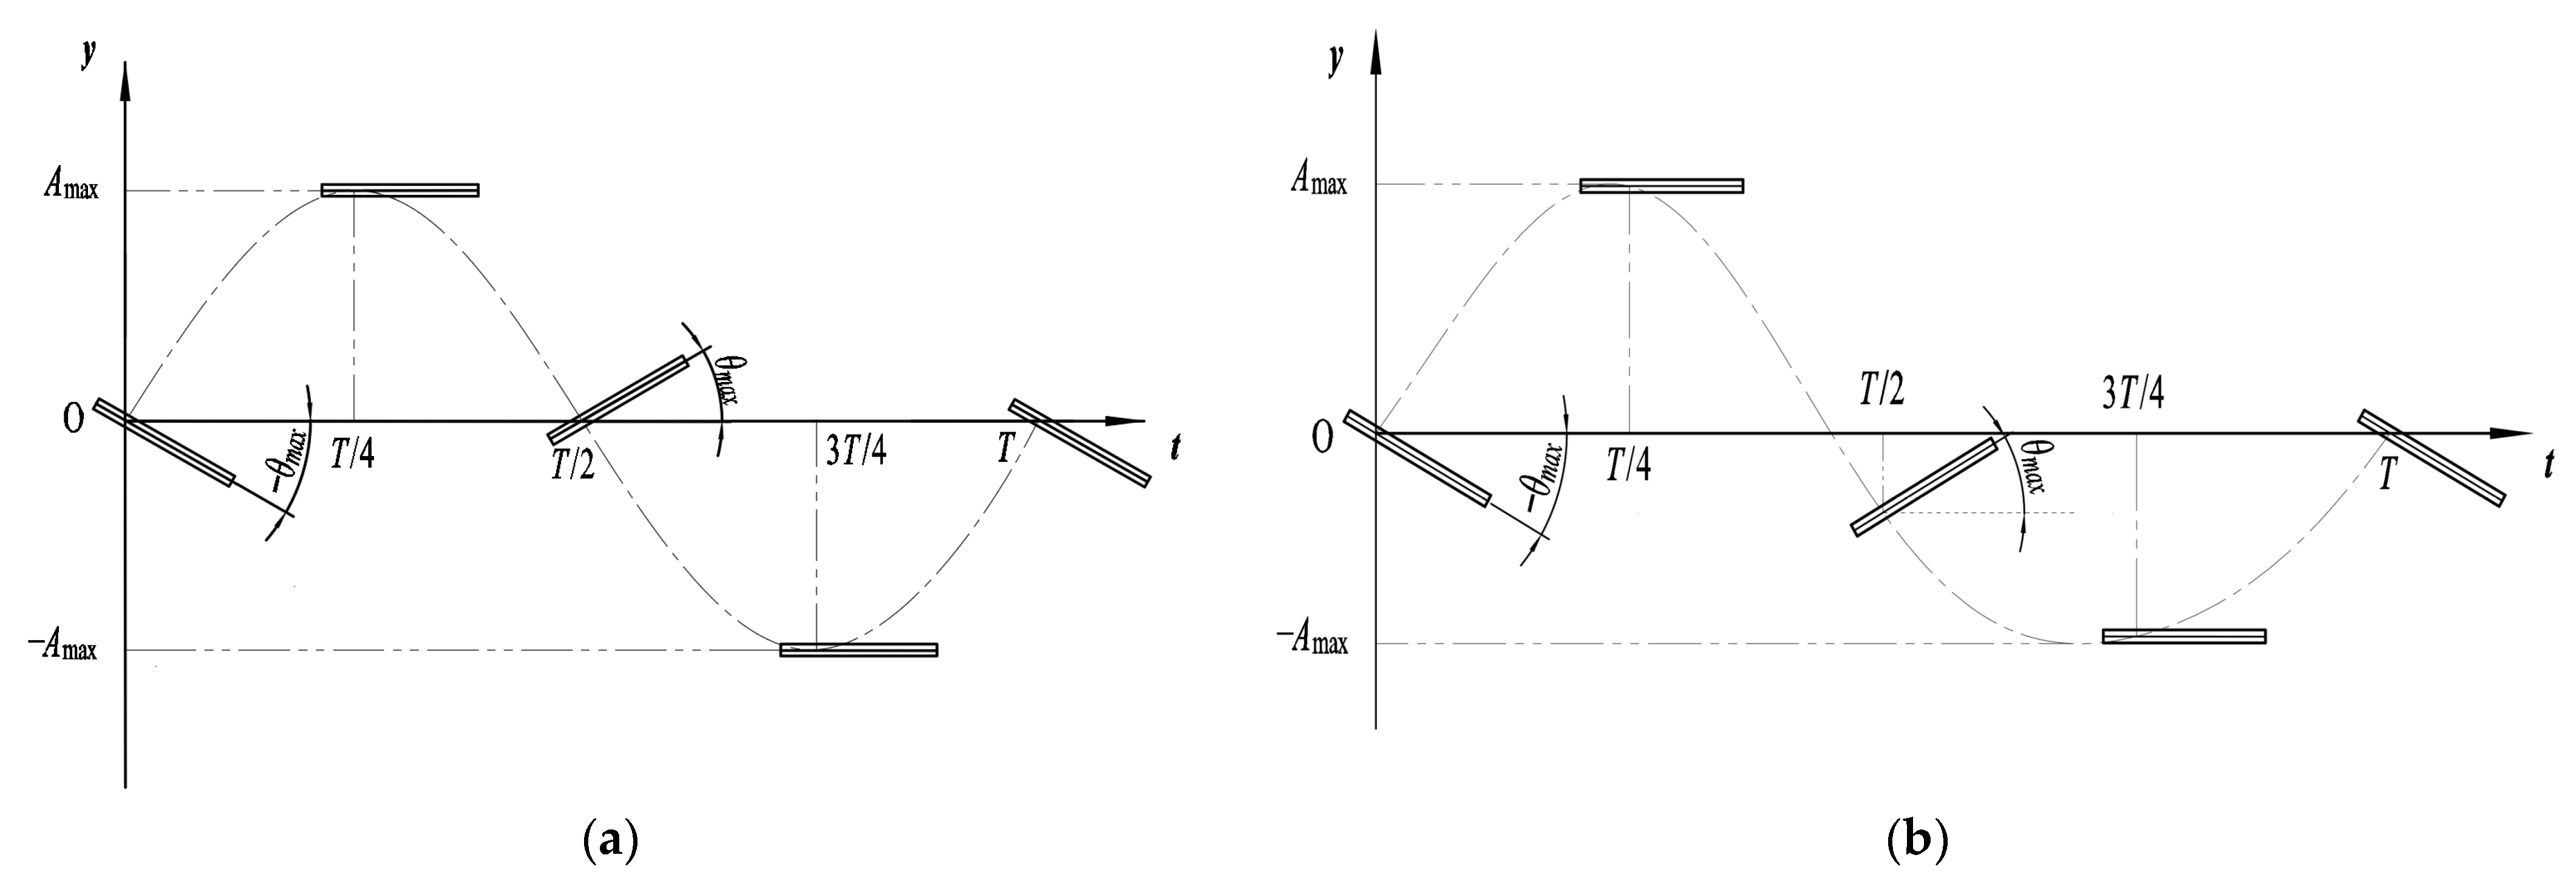
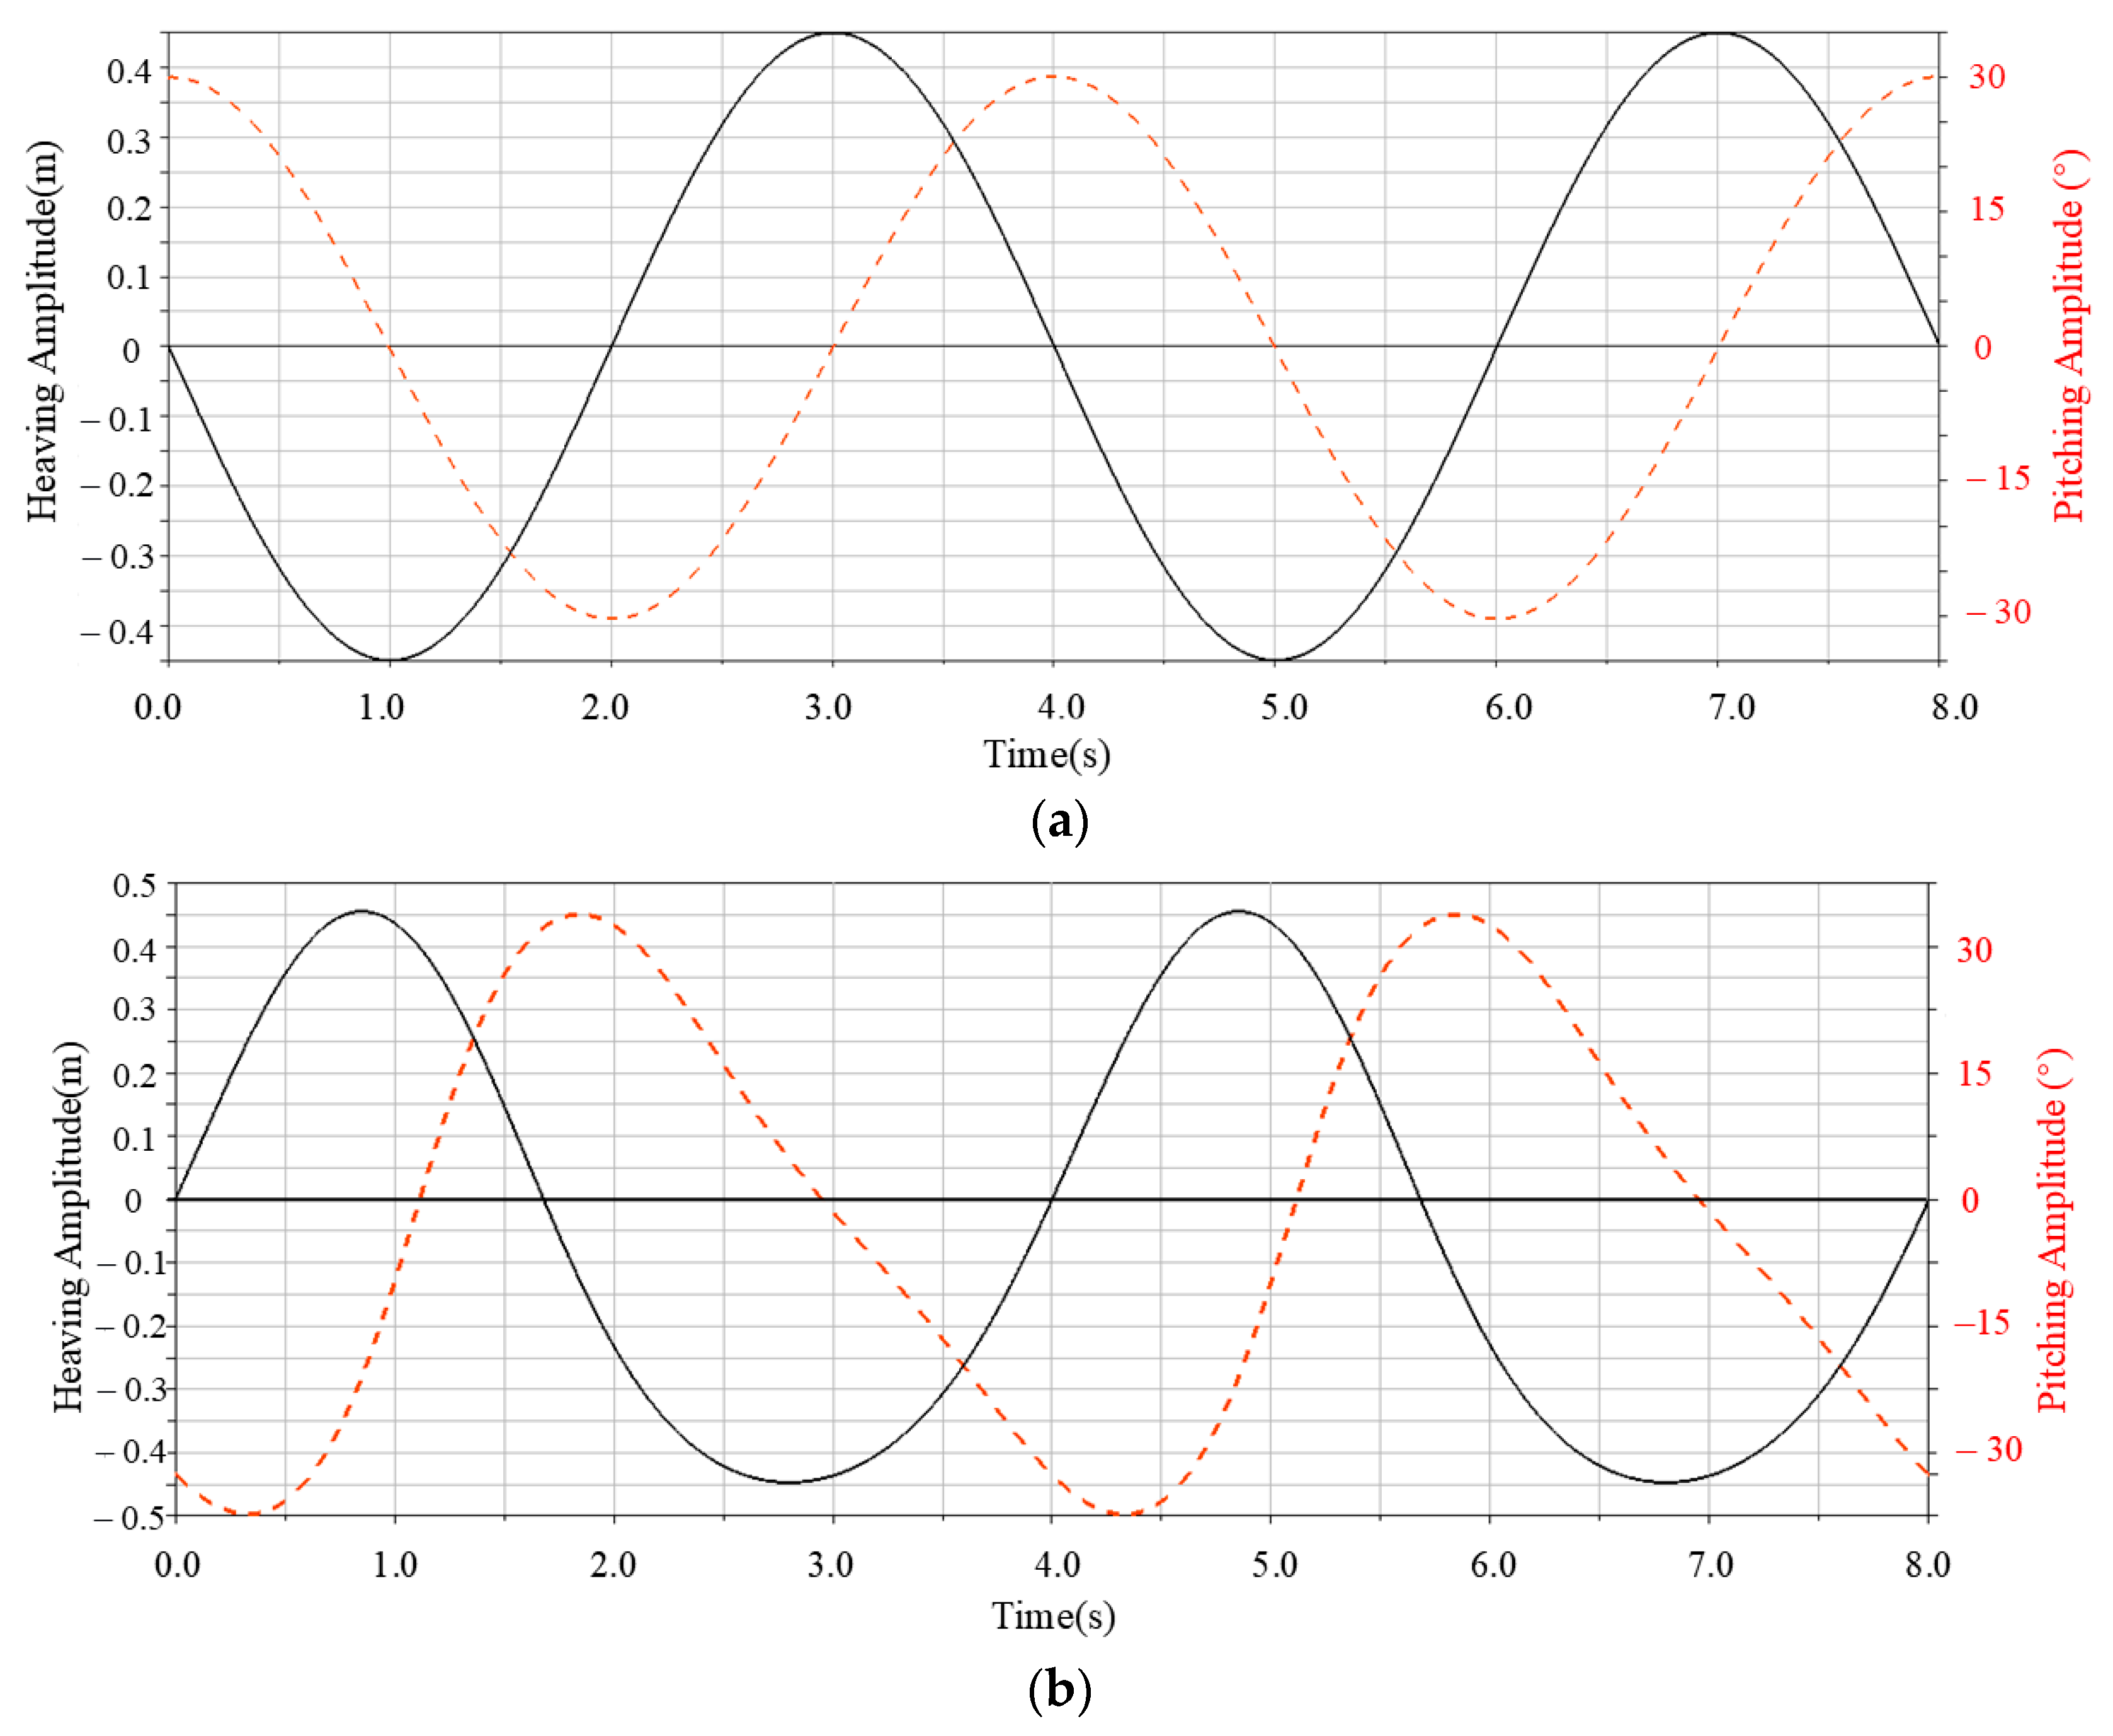
In this study, a flat-plate hydrofoil was selected as the hydrofoil profile, and a non-NACA profile device was used to simplify the model while maintaining control over experimental conditions. In the early stage of research, the flat-plate hydrofoil effectively captures the fundamental flapping and fluid interaction characteristics, reducing additional deviations caused by geometric complexity and facilitating parameter adjustment and result reproducibility. Moreover, experiments with flat-plate hydrofoils provide a theoretical foundation for subsequent studies involving more complex wing profiles, ensuring experimental controllability and continuity. The crank-slider drive mechanism consists of a stepper motor, gearbox, double crank-slider, connecting rod, flat-plate wing, and slide rail, as illustrated in Figure 1. The motor drives the connecting rod, and the crank-slider transmission induces the flat-plate wing to perform heaving and pitching quasi-harmonic motions.
The synchronous belt drive mechanism mainly consists of a stepper motor, gearbox, synchronous belt module, slide platform, slider, connecting rod, flat-plate hydrofoil, and slide rail, as shown in Figure 2. The motor driver input signals are controlled by a microcontroller, enabling the synchronous belt module to drive the slide platform in reciprocating motion. The slide platform, via the connecting rod, drives the flat-plate hydrofoil to perform harmonic motion.
In the experimental design, the crank-slider drive mechanism was chosen as the flapping hydrofoil drive due to its simple structure, low manufacturing cost, and ease of implementing periodic flapping motion. The drive system employs a stepper motor without closed-loop control, making real-time compensation for nonlinear acceleration during the mechanism’s motion unattainable. Under these conditions, the slider displacement exhibits a nonlinear functional relationship with the crank angle. Especially near dead points, the slider acceleration changes abruptly, resulting in asymmetric and nonlinear quasi-harmonic motion of the hydrofoil during flapping.
In contrast, the subsequently introduced synchronous belt drive mechanism, combined with a stepper motor and microcontroller system, modulates pulse signals to control the slider position following a sinusoidal trajectory, approximating ideal harmonic motion. The introduction of the control system effectively improves the tunability and precision of the motion trajectory, serving as a crucial prerequisite for achieving standardized harmonic motion. In summary, the crank-slider drive mechanism offers advantages in cost and assembly convenience but inherently produces quasi-harmonic motion due to its kinematic characteristics and control limitations. Conversely, the synchronous belt mechanism achieves a harmonic flapping motion closer to the ideal model through high-precision control strategies.

2.2. Motion Model

The flapping flat-plate hydrofoil pumping device is inspired by fish locomotion patterns, where coordinated movements of the body and tail generate jet-like vortices that produce thrust, maintaining high propulsion efficiency during swimming and flapping. Fish locomotion can be considered as a coupled heaving and pitching motion of the tail, based on which the motion trajectory model of the flat-plate hydrofoil is established as shown in Figure 3. In the figure, Amax represents the heaving amplitude of the flat-plate hydrofoil; θmax denotes the pitching amplitude; and T indicates the motion period.
The synchronous belt drive mechanism is controlled by a synchronous belt, and its motion follows simple harmonic motion. The motion equation of the flapping flat-plate hydrofoil is given as follows:
y ( t ) = A m a x sin ( ω t ) θ ( t ) = θ m a x sin ( ω t + φ )
where y(t) represents the heaving displacement of the flapping flat-plate hydrofoil; θ(t) represents the pitching displacement; ω is the angular frequency of flapping; φ denotes the phase difference between heaving and pitching motions.
The motion equation of the crank-slider drive mechanism follows quasi-harmonic motion, expressed as follows:
y ( t ) = r w c o s ( w t ) ( l o f f s e t r s i n ( w t ) ) l r w s i n ( θ 20 + w t ) θ ( t ) = ( r w s i n ( θ 20 + w t ) r w s i n ( θ 30 + w t ) ) b ( ( r c o s ( θ 20 + w t ) r c o s ( θ 30 + w t ) ) 2 b 2 + l )
where r represents the crank radius; w is the crank angular frequency; loffset denotes the offset distance; θ20 is the initial phase of the heaving crank; θ30 is the initial phase of the pitching crank; b is the distance between sliders; and l is the length of the connecting rod.
In this study, the actual heaving and pitching trajectories for both the crank-slider mechanism and synchronous belt mechanism were obtained using ADAMS-2020 software. These actual motion trajectories were then compared with the theoretical trajectories derived from the kinematic models, and the results are presented in Figure 4. The comparison reveals that the actual motion trajectories align well with the theoretical predictions, validating the reliability of the modeled kinematics for both drive mechanisms.
To investigate the effect of the flow channel outlet angle on the hydraulic performance of the device, comparative analyses were conducted to select the optimal outlet design. Figure 5 illustrates the flapping flat-plate hydrofoil device structures under various outlet design schemes. In this study, to standardize the notation of the outlet angle, the following convention is adopted: when the outlet opens outward relative to the baseline reference line (horizontal line), the angle is considered positive; conversely, when the outlet contracts inward, the angle is negative.

2.3. Hydrodynamic Performance Parameters

To evaluate the performance of the flapping flat-plate hydrofoil, parameters such as thrust coefficient, lift coefficient, flapping hydrofoil efficiency, pumping efficiency, and head are quantified. During the study of its motion, the Strouhal number S t is defined as S t = 2 f H m a x / U ¯ , where U ¯ is the mean flow velocity of the steady flow field and f is the flapping frequency [25].
The instantaneous thrust coefficient C T and instantaneous lift coefficient C L of the flapping flat-plate hydrofoil are given as follows [26]:
C T = F ( t ) 1 2 ρ U ¯ 2 A ,
C L = L ( t ) 1 2 ρ U ¯ 2 A ,
where F ( t ) denotes the instantaneous thrust generated by the flapping flat-plate hydrofoil; L ( t ) represents the instantaneous lift; ρ is the fluid density; and A is the projected area of the flapping flat-plate hydrofoil.
The mean thrust coefficient C T ¯ and mean lift coefficient C L ¯ of the flapping flat-plate hydrofoil are defined as follows:
C T ¯ = 1 T t t + T C T ( t ) d t ,
C L ¯ = 1 T t t + T C L ( t ) d t ,
where T denotes the motion period.
The formula for the average input power P a ¯ of the flapping flat-plate hydrofoil is as follows:
P a ¯ = 1 T 0 T L ( t ) y ( t ) d t + 0 T M ( t ) θ ( t ) d t ,
where y ( t ) represents the heaving velocity of the flapping flat-plate hydrofoil, θ ( t ) denotes the pitching angular velocity, and M ( t ) is the instantaneous moment of the flapping flat-plate hydrofoil.
To further investigate the propulsion performance of the flapping hydrofoil, parameters such as propulsion efficiency, flow rate, head, and pumping efficiency are introduced.
The propulsion efficiency η of the flapping flat-plate hydrofoil is calculated as follows:
η = F x ¯ U ¯ P a ¯ ,
where F x ¯ denotes the mean thrust of the hydrofoil.
The formula for the average outlet flow rate Q ¯ after stabilization is as follows:
Q ¯ = U ¯ W A ,
where W represents the channel width.
The formula for the head H generated by the flapping flat-plate hydrofoil is as follows:
H = Δ P ¯ ρ g ,
where Δ P ¯ denotes the pressure difference between the average inlet pressure and average outlet pressure of the flow channel.
To represent realistic ultra-low-head conditions typically found in plain river network areas, especially in narrow tributaries and shallow channels, the head values used in this simulation are maintained within the range of 0.03 m to 0.06 m. This range is consistent with documented field data and engineering references for low-lift pumping systems in similar hydrological contexts.
All efficiency evaluations and percentage improvements reported in this study are based on this defined operating head range, ensuring their applicability to real-world riverine hydraulic conditions [5,6].
The pumping efficiency η p e of the flapping flat-plate hydrofoil is calculated as follows:
η p e = Δ P ¯ Q ¯ P a ¯ ,
The paragraph has been revised as follows: The performance graphs, including flow velocity and vorticity contour plots, are based on numerical simulations conducted using ANSYS Fluent 2024R2. These simulations model the fluid dynamics around the flapping hydrofoil under different operating conditions.

3. Numerical Simulation Method

3.1. Governing Equations and Turbulence Model

This study employs the finite volume method (FVM) coupled with the CFD simulation software ANSYS FLUENT for numerical computation. The Reynolds-averaged continuity and momentum conservation equations are used to describe the characteristics of the incompressible flow field, with the governing equations as follows [27]:
u ¯ i x i = 0 ,
ρ v ¯ t + v ¯ v ¯ = p ¯ + μ 2 v ¯ + ρ f ¯ ( ρ v i v j ¯ ) ,
where ρ v i , v j , ¯ is the Reynolds stress tensor associated with fluctuating momentum, representing the effect of turbulent fluctuations on the mean flow.
During the flapping process, vortices are generated and shed from the leading and trailing edges of the flapping flat-plate hydrofoil, which significantly affect its propulsion performance. The Realizable k-ε turbulence model effectively captures the characteristics of complex flow fields, particularly those involving vortex movement and shedding. Therefore, this model is selected for simulation analysis. The turbulence kinetic energy k equation is given as follows [28]:
ρ k t + x j ρ u j k x j μ + μ t σ k k x j = τ t i j S i j ρ ε + ϕ k ,
The transport ε equation for the dissipation rate is as follows:
ρ ε t + x j ρ u j ε μ + μ t σ ε ε x j = c ε 1 ε k τ t i j S i j c ε 2 f 2 ρ ε 2 k + ϕ ε ,

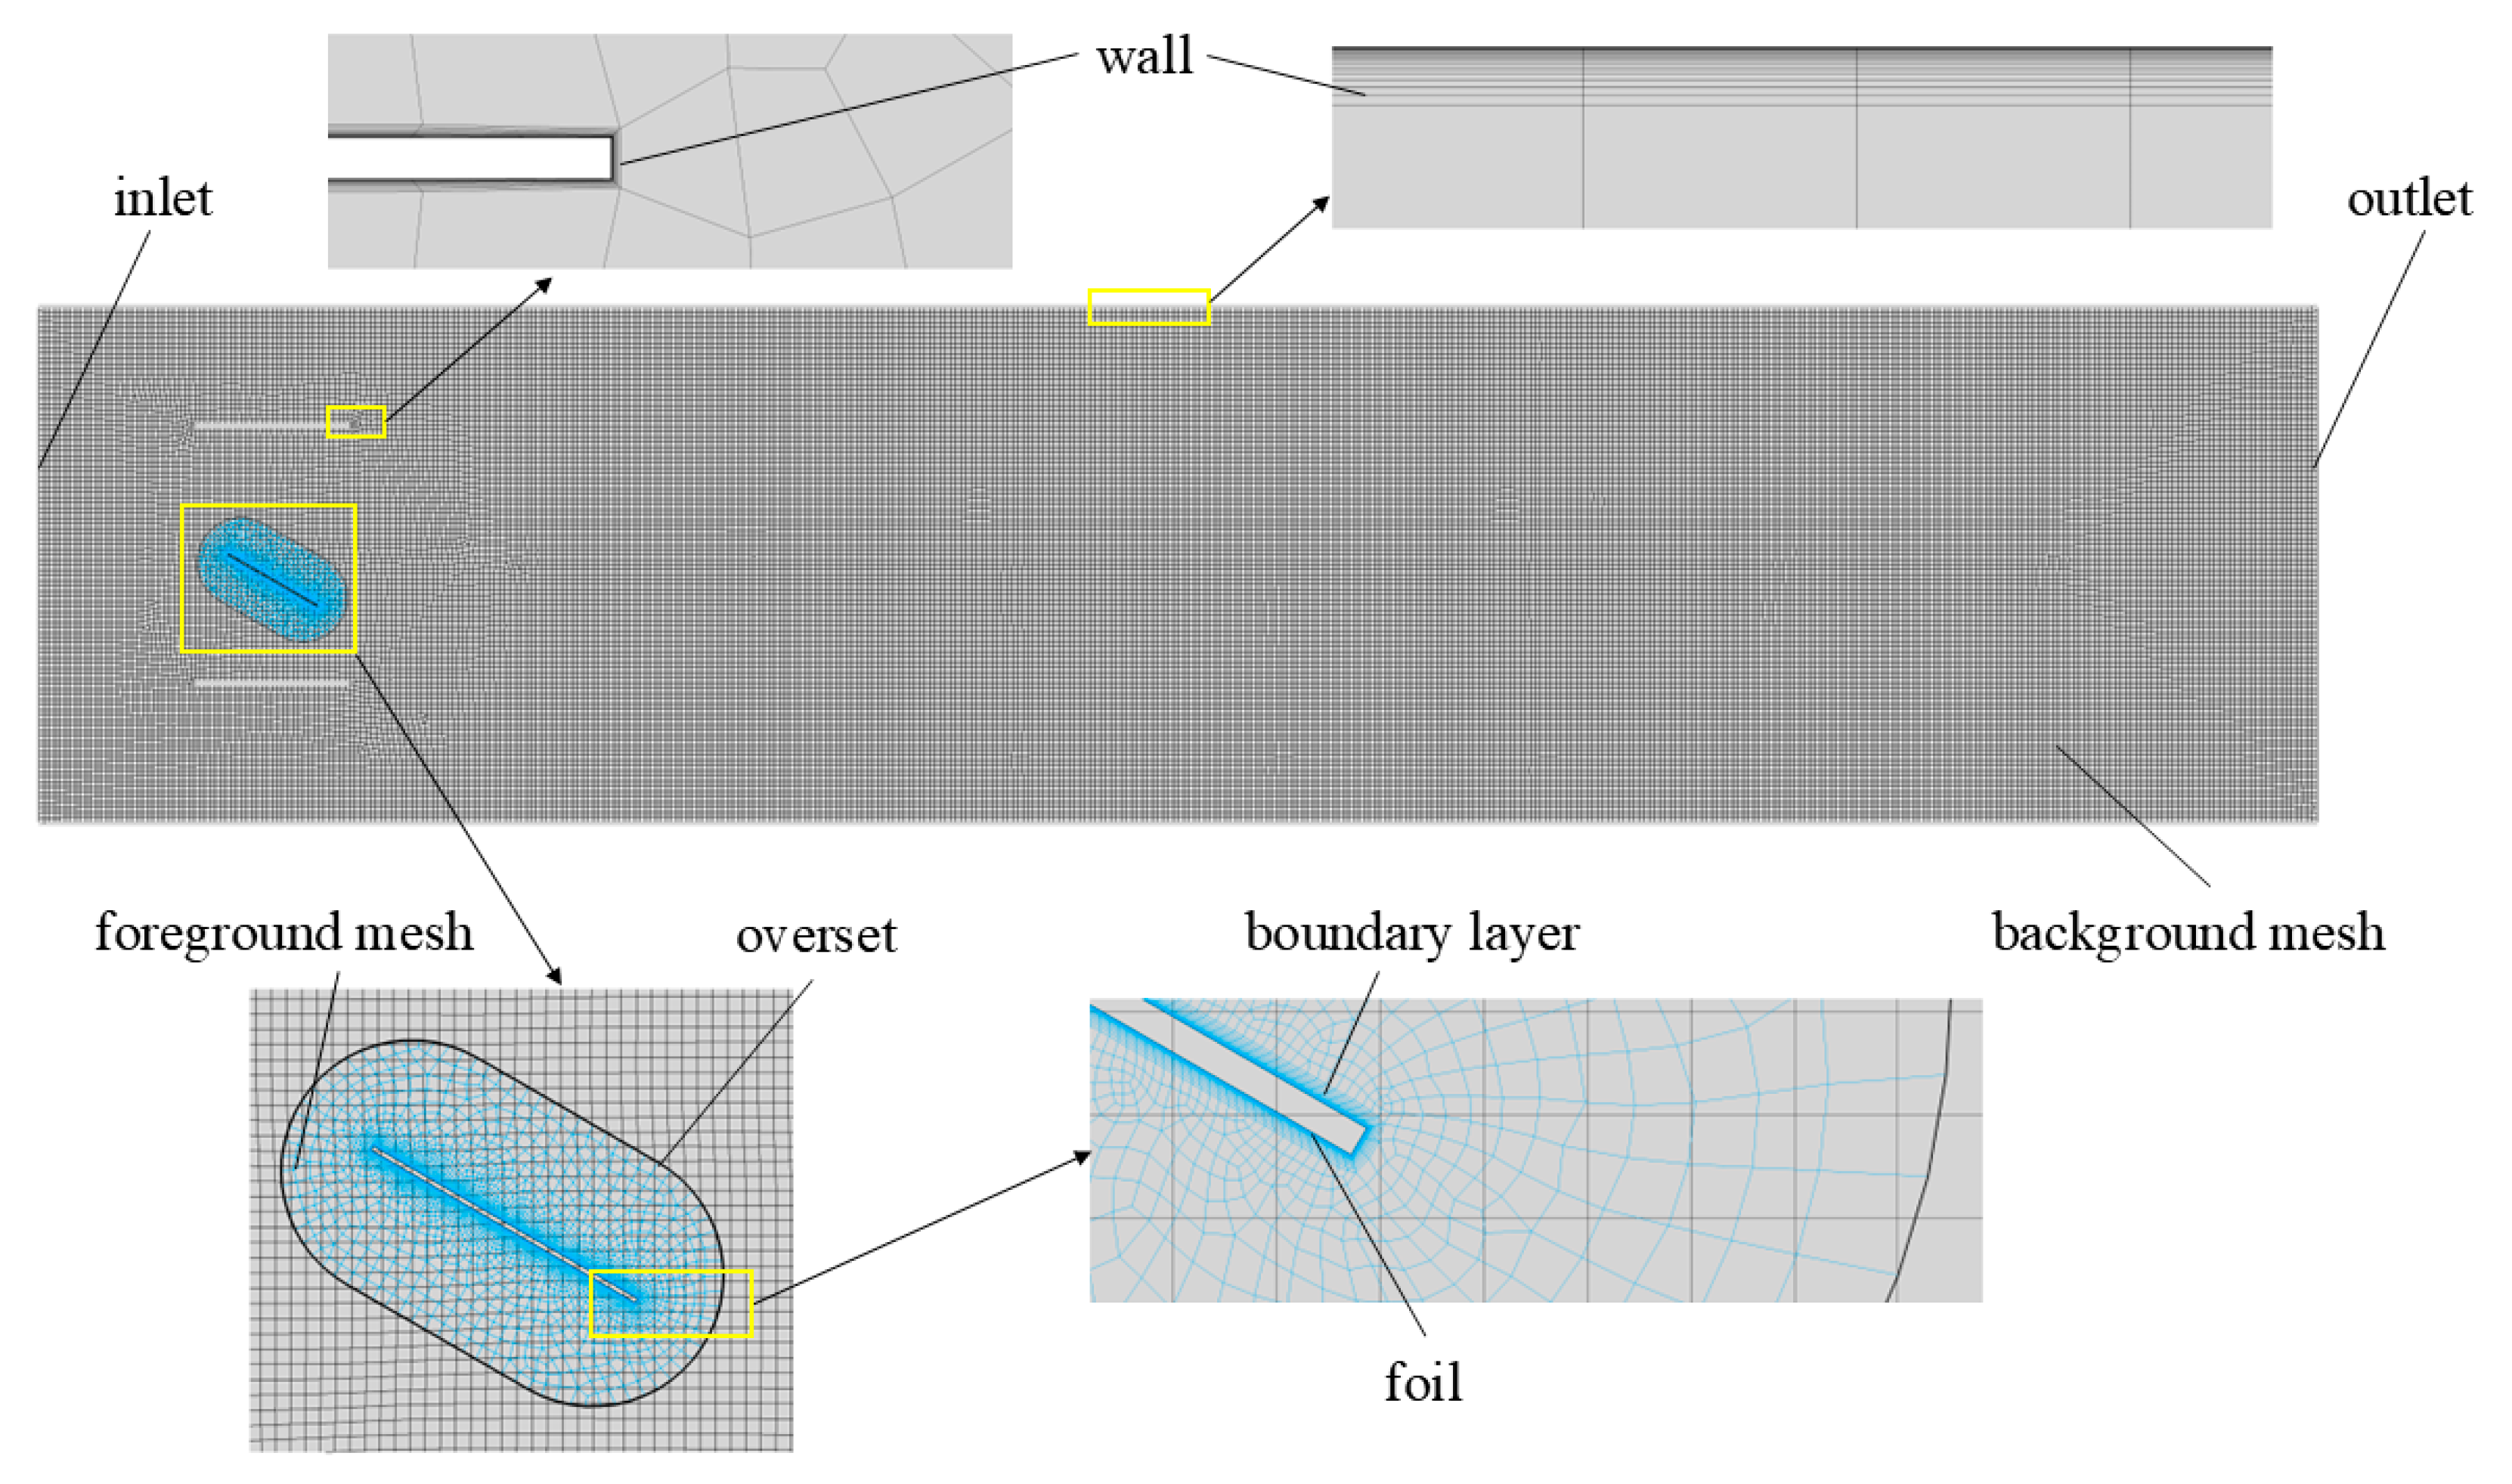
3.2. Mesh Generation and Computational Setup

The size of the computational domain and far-field boundary conditions significantly impact the results. To ensure full development of the wake behind the flapping wing, the total domain length is typically set to 20c. To efficiently utilize computational resources and avoid negative cell volumes, overset dynamic mesh technology is employed to handle the motion of the flapping flat-plate hydrofoil. The computational domain consists of a moving foreground mesh and a stationary background mesh, as shown in Figure 6. The foreground mesh is a hybrid mesh covering the hydrofoil motion region; the background mesh is a structured mesh with a maximum cell size of 30 mm, representing a 5 m × 20 m rectangular river channel.
The turbulence modeling in this study is based on the Realizable k-ε model, which is effective in capturing complex flow dynamics, particularly in regions involving vortex shedding and near-wall effects. The outer layer of the foreground mesh is sized consistently with the background mesh to further ensure computational accuracy. Different turbulence models and wall functions impose varying Y+ requirements [29,30]. To accurately capture wall flow features and ensure computational stability, boundary layer meshes are deployed on the channel walls and hydrofoil surface. The first layer mesh height on the flapping flat-plate hydrofoil surface is set to 0.000046 mm, corresponding to a Y+ value of 1, which ensures that the boundary layer is well-resolved and the near-wall effects are captured accurately. This mesh configuration guarantees that the turbulence model effectively resolves the flow structures near the hydrofoil surface, which is critical for accurately simulating the flow characteristics in this study.
In the numerical simulation, the pressure-based solver in FLUENT is used to solve the Navier–Stokes equations. The Coupled algorithm handles the pressure–velocity coupling. The turbulence kinetic energy and dissipation rate equations are discretized using first-order upwind schemes, while the momentum equations use second-order upwind schemes. Boundary conditions are set as follows: the inlet uses a pressure-inlet condition, the outlet uses a pressure-outlet condition, the outer boundary of the foreground mesh is set as overset, and the river channel, flow channel, and flapping flat-plate hydrofoil surfaces are set as wall boundaries. The overset mesh method is applied in overlapping regions. The motion of the flapping flat-plate hydrofoil is implemented via a User-Defined Function (UDF).
In this study, a traditional mesh-based method (finite volume method) was employed for simulating the flapping hydrofoil motion. However, recent advancements have introduced mesh-free methods and collocation-based approaches, which can offer several advantages over traditional mesh-dependent methods, particularly in handling large deformations and dynamic boundaries. These methods do not rely on predefined grid structures and have shown promise in simulating complex fluid–structure interaction problems with improved flexibility and reduced computational cost [31,32].
While the present study uses the finite volume method with overset grids, we acknowledge the potential of mesh-free methods as a promising direction for future work. These methods could improve computational efficiency and accuracy in simulations involving highly dynamic systems, such as bionic propulsion devices.

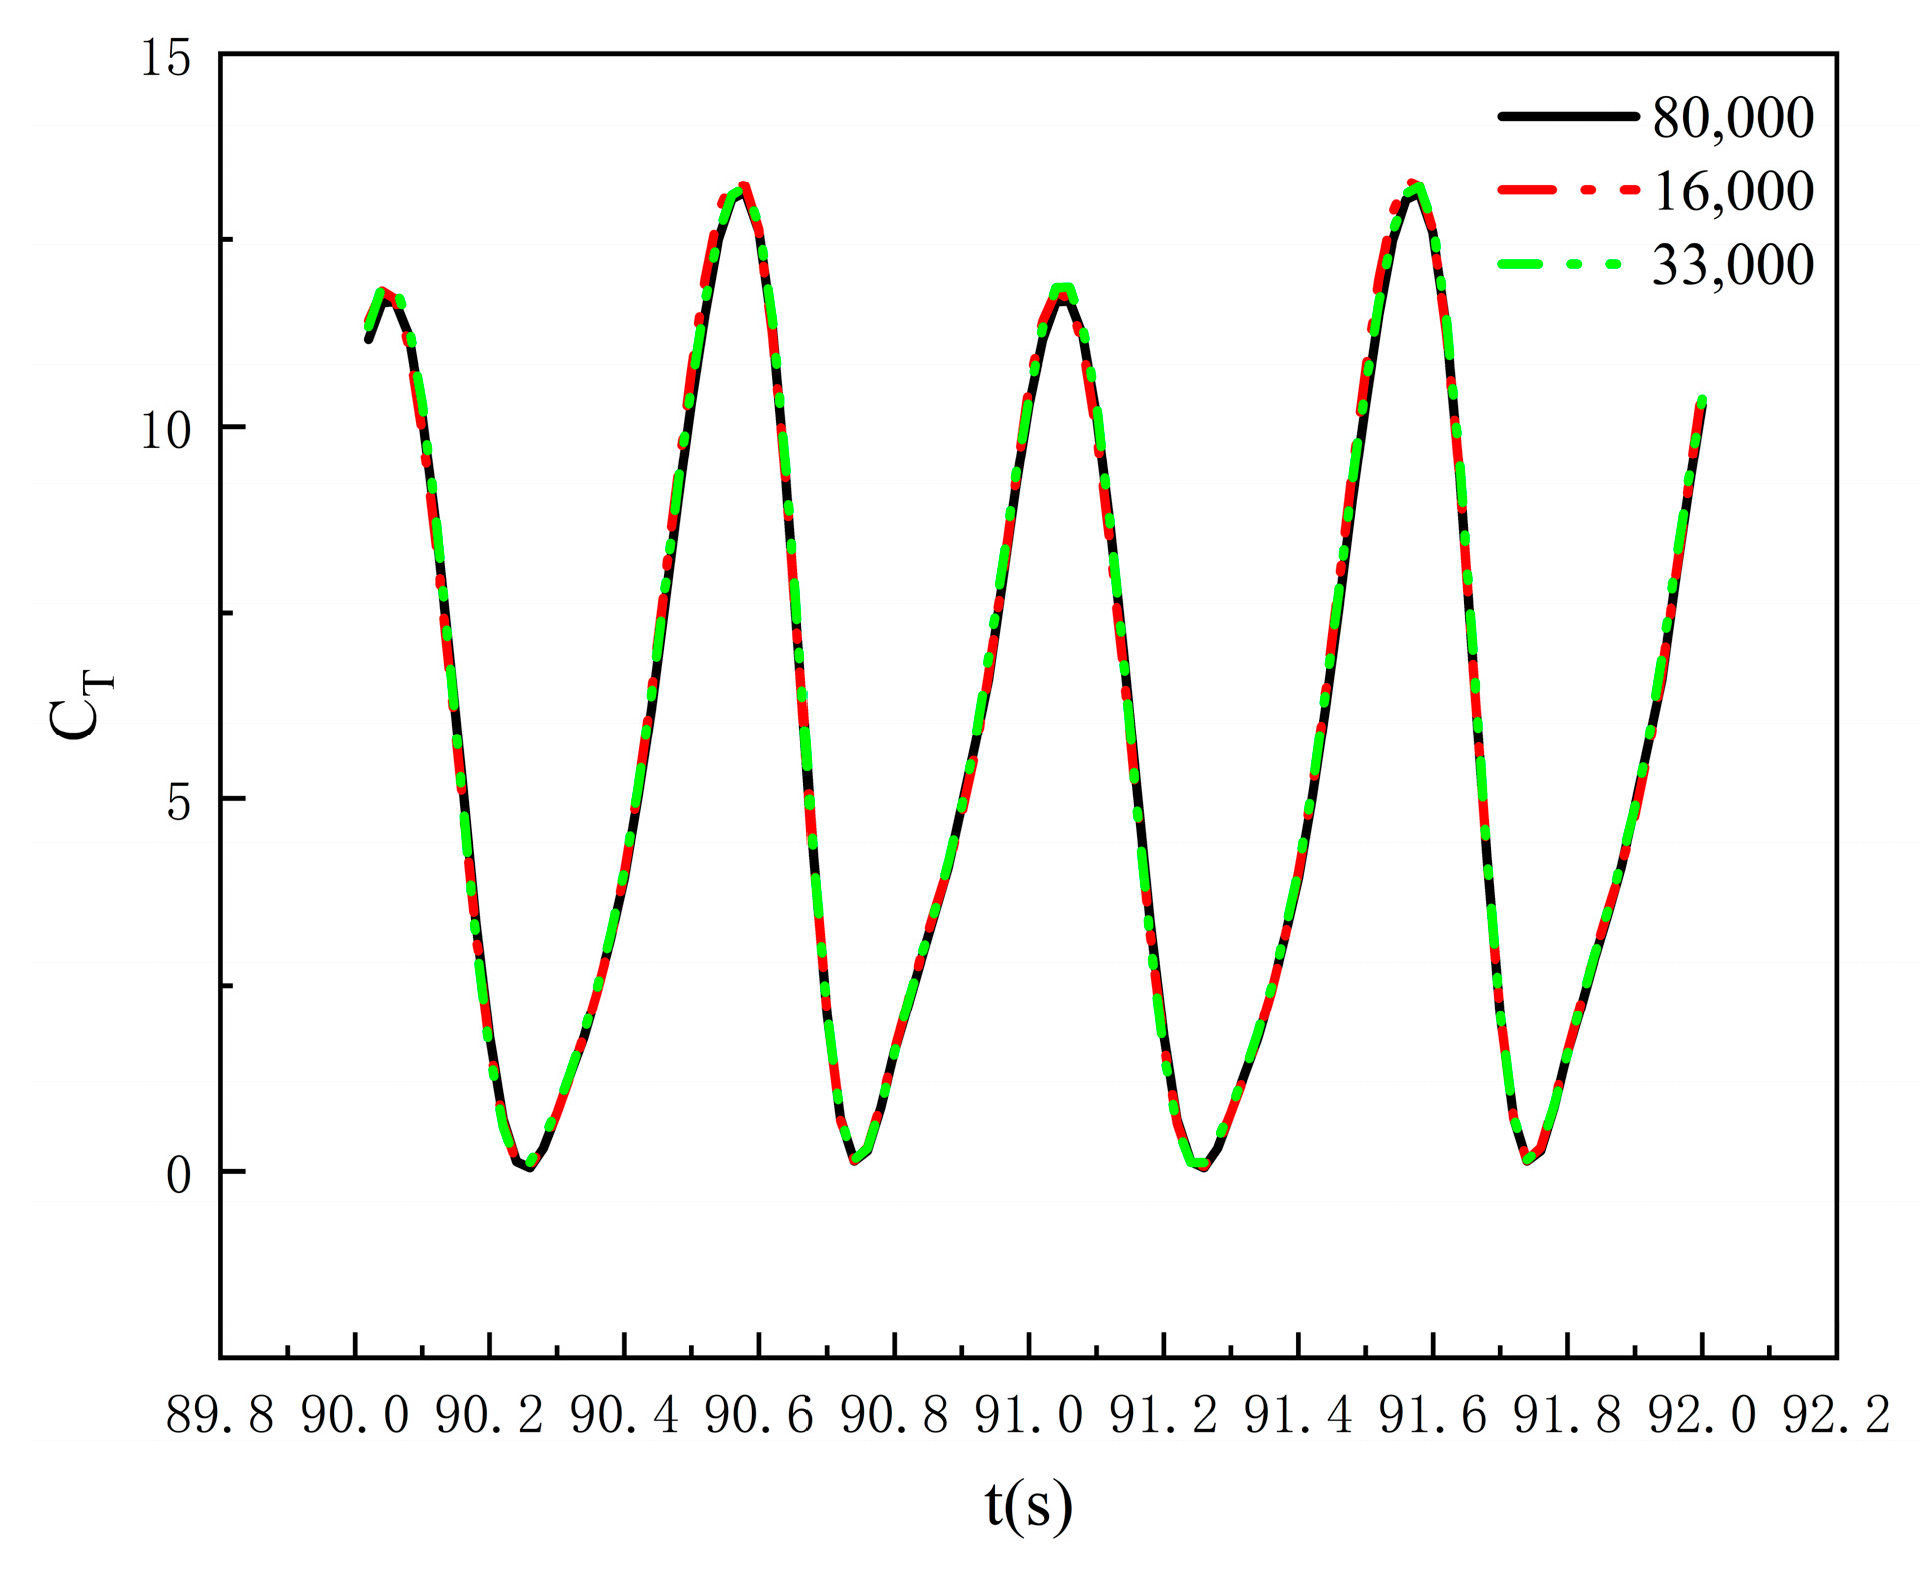
3.3. Grid Independence Verification

The mesh refinement level directly affects the accuracy and computational speed of numerical results. Therefore, conducting grid independence verification is a crucial step to ensure the accuracy and reliability of the computational outcomes. The test condition for verification involves a flapping flat-plate hydrofoil with chord length c = 1.0 m, frequency f = 1 Hz, heaving amplitude A = 0.45 m, pitching amplitude θmax = 30°, and Φ = −π/2.
To verify grid independence, numerical simulations were performed with three different mesh sizes (10,000, 160,000, and 330,000 cells), with results shown in Figure 7. Comparative analysis revealed that the instantaneous thrust coefficient results are essentially consistent across the three mesh sizes. Considering the balance between computational efficiency and accuracy, a mesh of 160,000 cells was selected for further calculations. This mesh refinement study serves as a grid convergence analysis, confirming that the 160,000-cell mesh provides accurate and stable results for the hydrofoil thrust coefficient with deviations under 5% compared to finer grids.

3.4. Method Validation

To validate the effectiveness of the simulation method, the simulation data under the same operating conditions were compared with the experimental data obtained from the literature [33], verifying the accuracy of the numerical simulation method.
The simulation parameters were set to be consistent with the experimental conditions in the literature: bionic flapping wing chord length c = 0.1 m, inlet velocity U = 0.4 m/s, phase difference Φ = −π/2, heaving amplitude Amax = 0.075 m, and a maximum angle of attack of 20°. The numerical simulation results of the mean thrust coefficient of the flapping hydrofoil as a function of Strouhal numbers were compared with the experimental data from the literature. The results, shown in Figure 8, indicate that the numerical simulation results are in good agreement with the experimental data, confirming the accuracy and validity of the simulation method used in this study.

4. Results

To study the impact of the flapping modes of the two devices’ flapping flat-plate hydrofoils on propulsion mechanisms and the influence of flow channel structure on propulsion efficiency, the parameter settings for each flapping mode computational model are as follows: heaving amplitude Hmax = 450 mm, pitching amplitude θmax = 30°, and phase difference Φ = −π/2. The selected parameters were determined based on previous studies and the actual design of the device.

4.1. Impact of Flapping Mode on Water Body

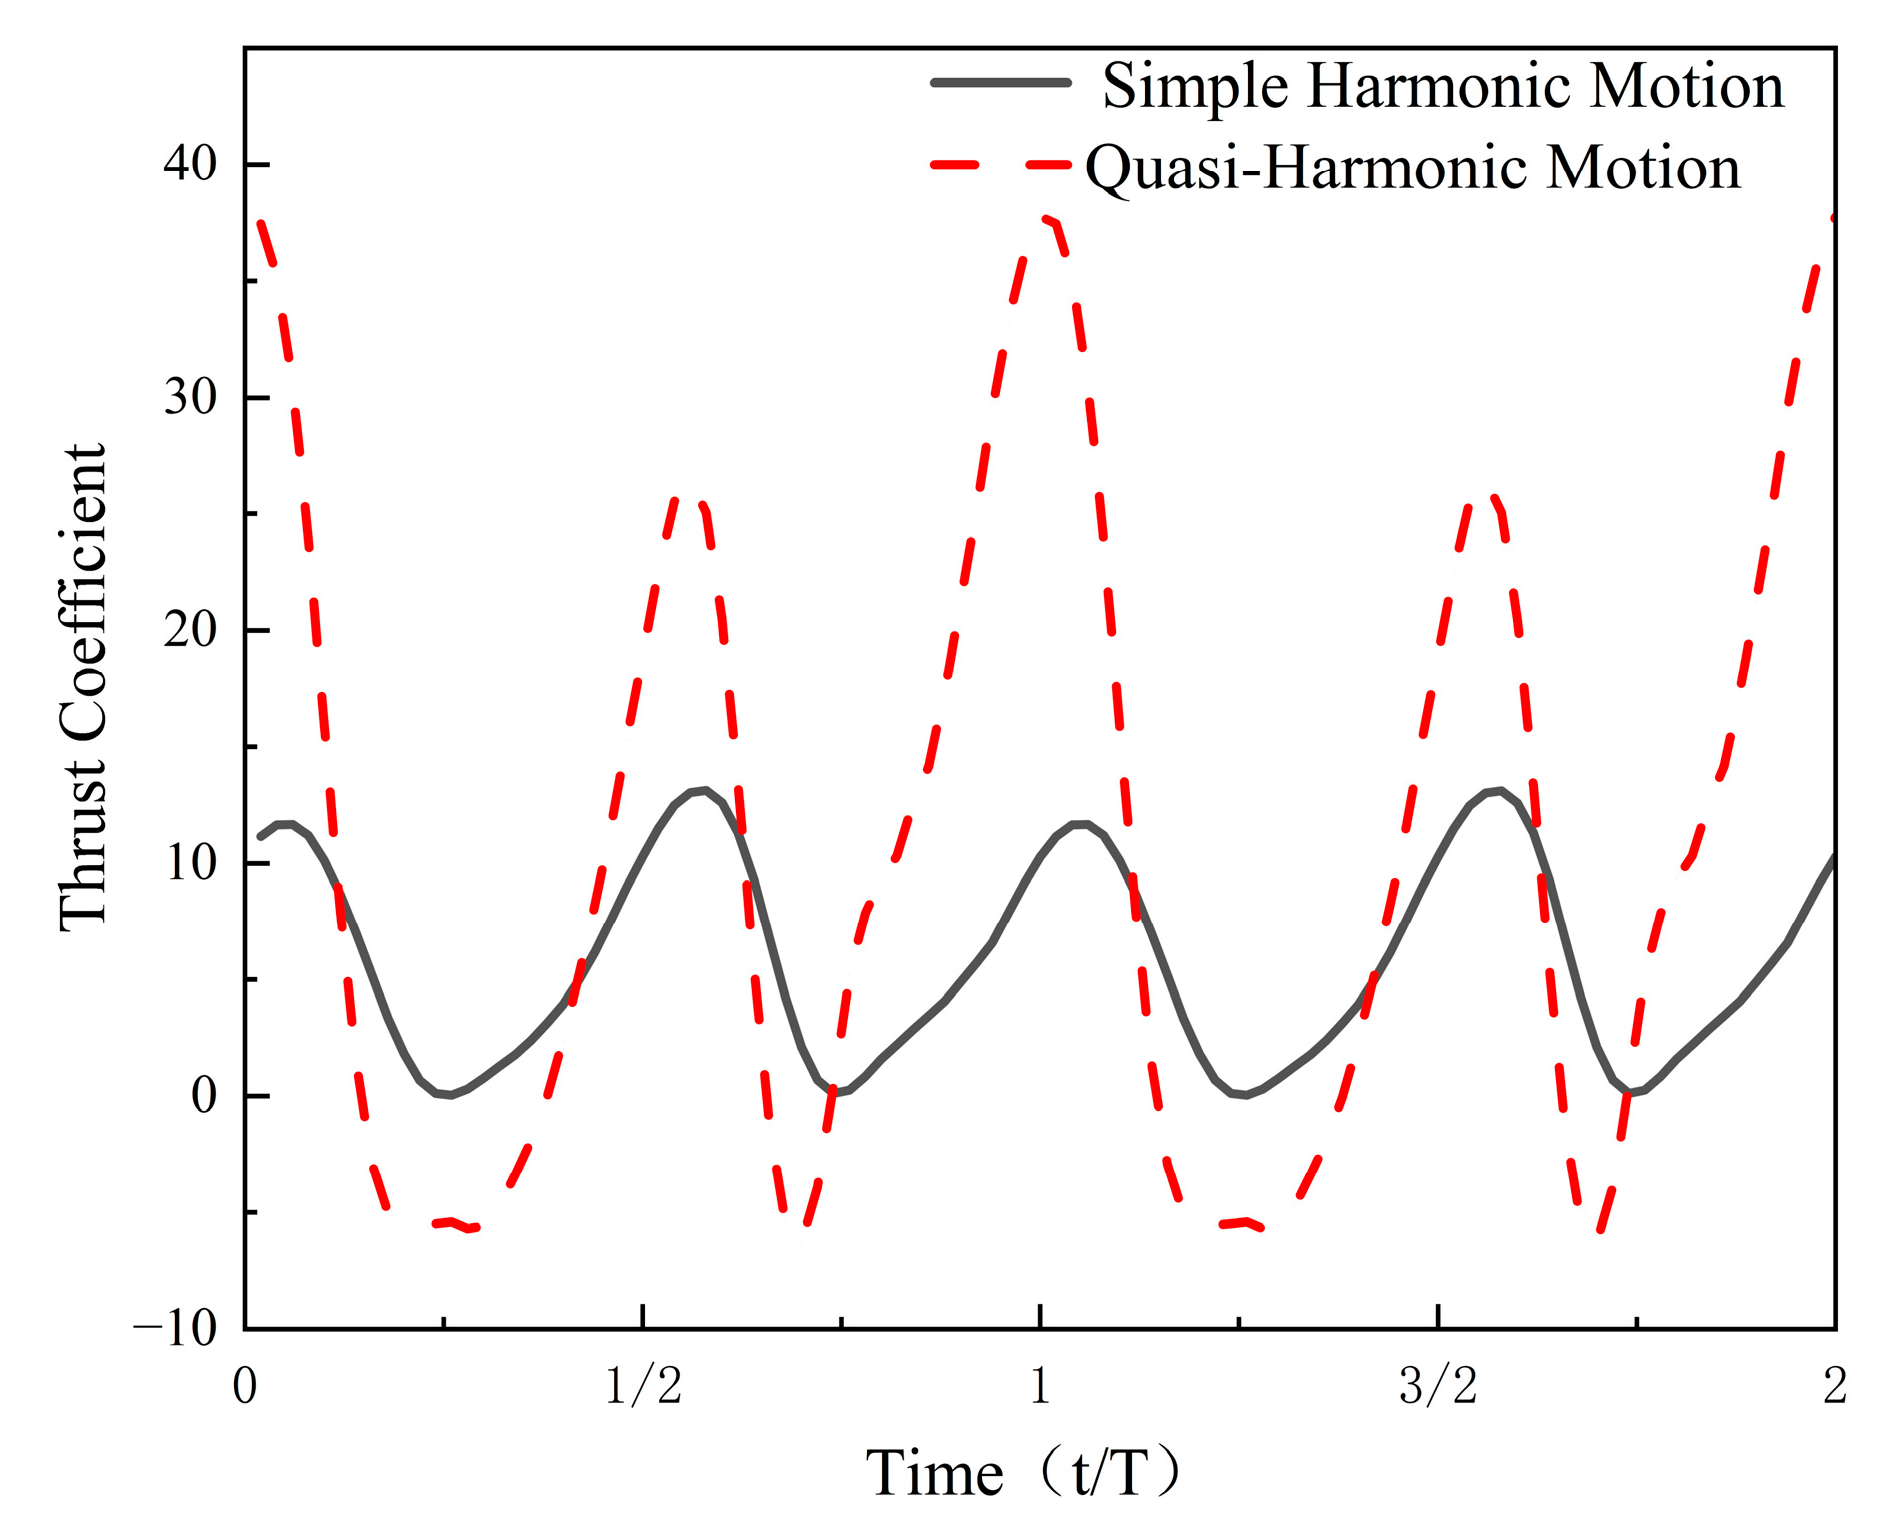
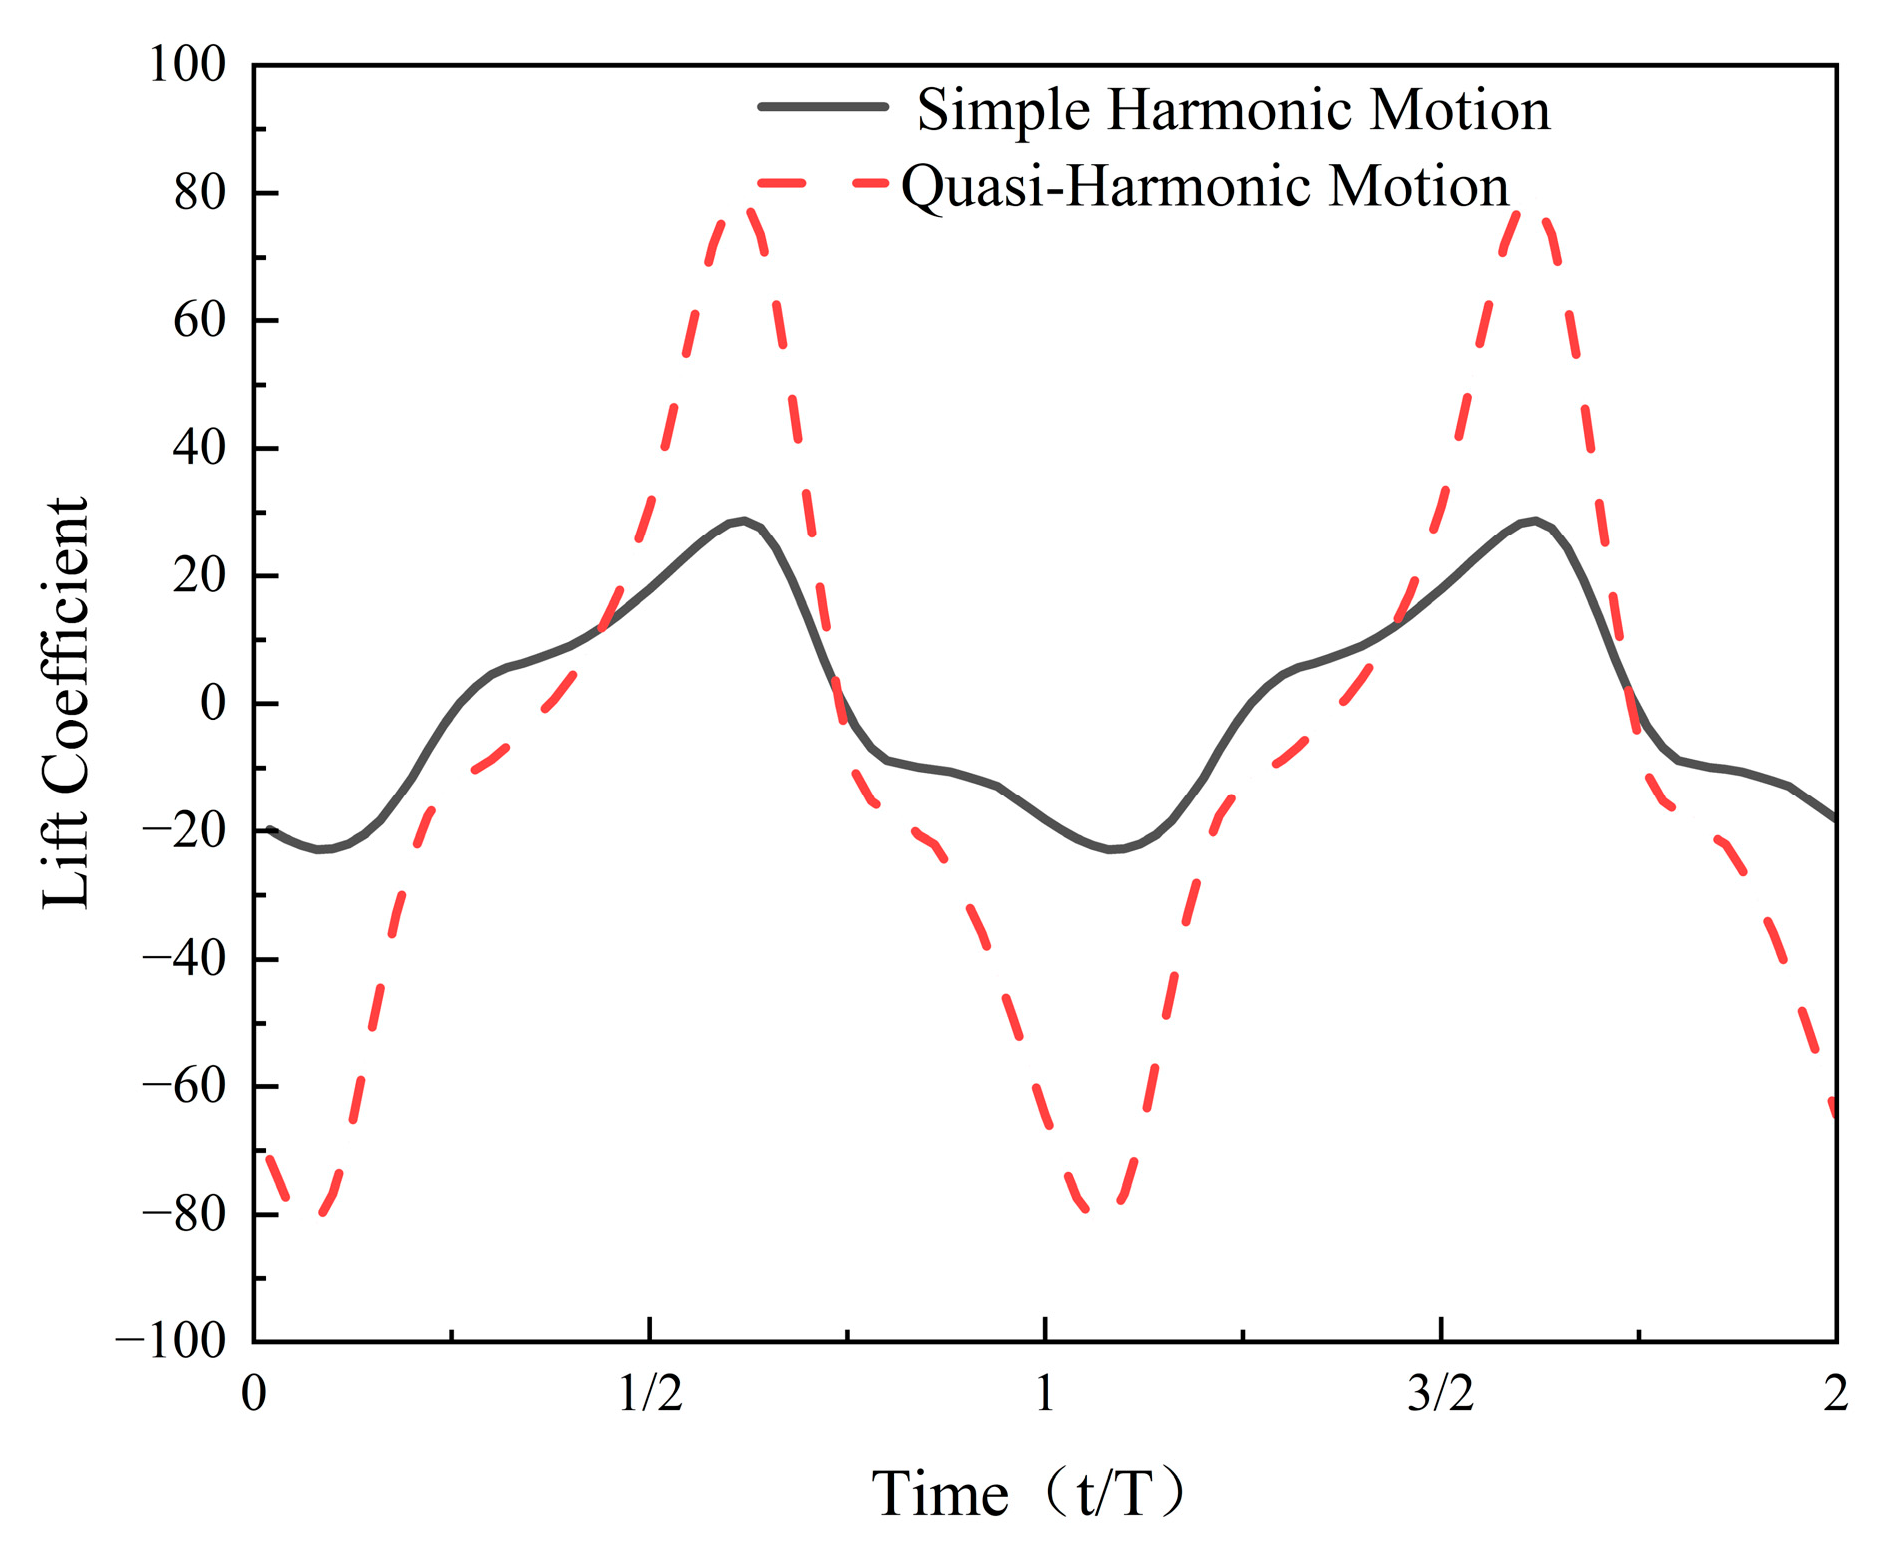
4.1.1. Effect of Flapping Mode on Thrust and Lift

To study the effect of different flapping modes of the two devices’ flapping flat-plate hydrofoils on thrust and lift, calculations were performed for the conditions corresponding to a flapping frequency of f = 1 Hz for both modes.
Figure 9 shows the instantaneous thrust coefficient curves for the two flapping modes over two complete motion cycles. For both modes, the thrust coefficient exhibits a double-peak pattern within each cycle, corresponding to the reciprocal oscillatory motion of the hydrofoil. It can be observed that the variation trends of the instantaneous thrust coefficient in the two flapping modes shown in the figure exhibit similar periodic evolution characteristics.
When the hydrofoil begins its periodic flapping, the instantaneous thrust coefficient gradually decreases with the increase in flapping amplitude, reaching the minimum value of the cycle at the maximum flapping amplitude. As the hydrofoil moves toward its equilibrium position, the thrust coefficient begins to increase and reaches the maximum value of the cycle just before equilibrium. During the reverse flapping phase, the thrust coefficient again undergoes an asymmetric fluctuation process, first decreasing and then increasing, ultimately forming a bimodal periodic variation.
It is also noteworthy that the fluctuations in the instantaneous thrust coefficient differ between the two flapping modes. The simple harmonic motion, driven by the synchronous belt, exhibits a smooth sinusoidal waveform with typical periodic fluctuations, while the quasi-harmonic motion, driven by the crank-slider mechanism, generates two distinct peaks within two periods. Since the synchronous belt drive provides uniform periodic motion, the amplitude and frequency of the hydrofoil’s motion remain consistent, resulting in a smooth and symmetric variation in the thrust coefficient. The thrust coefficient follows a typical sinusoidal waveform with a fluctuation frequency corresponding to the flapping frequency of the hydrofoil, exhibiting a symmetric and smooth trend over one period. Moreover, the thrust coefficient remains entirely positive throughout the cycle, indicating continuous forward thrust generation and stable propulsion.
However, the instantaneous thrust coefficient of quasi-harmonic motion exhibits more complex variations, particularly with two distinct peaks occurring over two periods. This phenomenon arises from the nonlinear motion characteristics of the crank-slider mechanism. Unlike the smooth motion of the synchronous belt drive, the crank-slider mechanism causes asymmetric and nonlinear oscillations of the hydrofoil. During the hydrofoil’s oscillation, the crank-slider mechanism can induce significant acceleration at certain moments, especially during the acceleration phase, where the speed variation of the hydrofoil is more pronounced, resulting in sharp fluctuations in the thrust coefficient. As a result, in quasi-harmonic motion, the instantaneous thrust coefficient exhibits multiple peaks, which are closely related to the acceleration changes, asymmetric motion frequency, and amplitude of the hydrofoil. Notably, the thrust coefficient becomes negative during parts of the cycle, indicating transient drag generation. This behavior results from the nonlinear acceleration profile introduced by the crank-slider mechanism, particularly near the turning points of the flapping cycle. The two unequal thrust peaks per cycle result from the non-uniform motion characteristics of the quasi-harmonic flapping, where the hydrofoil experiences asymmetric velocity and acceleration profiles across different phases of the cycle.
A comparison reveals that in quasi-harmonic motion, there are moments when the instantaneous thrust coefficient is negative, indicating that both thrust and drag are generated during the quasi-harmonic motion [34], whereas in simple harmonic motion, thrust is always generated in the direction of propulsion.
Figure 10 shows the instantaneous lift coefficient curves corresponding to the two flapping modes over two periods.
It can be observed that overall, the lift coefficients exhibit periodic fluctuations with one positive and one negative peak per cycle, typically occurring near the hydrofoil’s equilibrium position where the rate of change in angle of attack is greatest. Compared to the simple harmonic motion, which shows smooth and symmetric variations, the quasi-harmonic motion exhibits greater peak-to-peak amplitude, indicating more abrupt pitching behavior and increased flow asymmetry. Despite these differences, the lift coefficients for both modes are symmetrically distributed over the cycle, resulting in a mean value close to zero.

4.1.2. Effect of Motion Mode on the Flow Field

In the combined heaving and pitching motion of the flapping flat-plate hydrofoil, clockwise vortices are periodically generated and shed from the lower surface of the hydrofoil, while counterclockwise vortices are generated and shed from the upper surface. The alternating vortices are transported downward with the fluid, forming a stable, periodic vortex street structure. Due to the continuous motion of the flat-plate hydrofoil, these vortices align along the flow direction, exhibiting a pattern with clockwise vortices below and counterclockwise vortices above. This vortex street, which is opposite to the classic Kármán vortex street arrangement, is referred to as a reverse Kármán vortex street [35]. It generates a jet effect at the trailing edge of the flat-plate hydrofoil, thereby driving the fluid flow.
To analyze the vortex structure within the flow field, the vorticity in the z-direction component is selected as the characteristic quantity, with its calculation formula given as in [36].
Ω z = u y x u x y ,
Figure 11 shows the vorticity contour plots for different flapping modes at various frequencies. It can be observed that in both flapping modes, the reverse Kármán vortex street gradually forms towards the rear and extends backward within the flow field. As the frequency increases, the vortex street structure becomes more pronounced in both flapping modes, with an enhancement in vorticity and more intense variations.
It is noteworthy that under simple harmonic motion at low frequency, the wake vortices are relatively symmetric, forming a reverse Kármán vortex street aligned along the centerline of the flow field. However, at 3 Hz, the increased flapping speed of the flat-plate hydrofoil causes a more rapid change in the angle of attack, altering the direction of lift exerted by the fluid on the hydrofoil. The resulting upward average lift at the tail leads to an upward shift of the entire vortex street. Under quasi-harmonic motion, the trailing vortices of the flapping flat-plate hydrofoil exhibit a downward deflection at all frequencies, and this downward shift becomes more pronounced as the frequency increases. This is due to the fact that quasi-harmonic flapping is driven by a crank-slider mechanism, which inherently exhibits a quick-return characteristic. During the upward stroke, the flapping hydrofoil is in the working phase, moving more slowly and producing relatively uniform fluid disturbances. During the downward stroke, which serves as the return phase, the flapping flat-plate hydrofoil accelerates, producing greater instantaneous thrust. This increased thrust induces significant asymmetry in the fluid motion, thereby influencing the formation and evolution of the vortex street.

4.1.3. Effect of Motion Mode on Water-Pushing Performance

To investigate the effect of different flapping modes on water-pushing performance at varying frequencies, the flapping frequency was gradually increased from 0.1 Hz to 1 Hz in 0.1 Hz increments, and then increased by 1 Hz intervals up to a maximum of 3 Hz.
Figure 12 shows the pumping efficiency of the two flapping modes under different flapping frequencies. There is a significant difference between the two modes: the simple harmonic motion maintains a relatively high pumping efficiency overall. Between 0.1 and 2 Hz, its efficiency remains relatively stable, reaching a maximum of 21.5% at 0.7 Hz, followed by a notable decline between 2 Hz and 3 Hz. As shown in Figure 10, at lower frequencies, the reverse Kármán vortex street generated by simple harmonic motion sheds periodically and consistently drives flow rearward. However, at higher flapping frequencies, the flapping flat-plate hydrofoil experiences greater acceleration, and the asymmetry of the instantaneous lift becomes more pronounced, resulting in an upward deflection of the trailing vortices.
In contrast, the pumping efficiency of the quasi-harmonic motion fluctuates significantly across different frequencies. As shown in the Figure 12, it reaches a peak value of 17.8% at a flapping frequency of 0.6 Hz, followed by a sharp decline, and remains low beyond 1 Hz. At the peak pumping efficiency of the quasi-harmonic motion, the simple harmonic motion still demonstrates a 20.2% higher efficiency. Based on Figure 11, at lower frequencies, the trailing vortex structure under quasi-harmonic motion is relatively stable. Due to the quick-return characteristic of the crank-slider mechanism, the downward stroke of the flapping flat-plate hydrofoil is faster than the upward stroke, and stronger vortices form on the upper side, guiding the wake downward.
At flapping frequencies between 0.1 Hz and 0.5 Hz, the trailing vortices are weak, resulting in low energy transfer efficiency in the wake, reduced fluid thrust, and consequently lower pumping efficiency. At 0.6 Hz, a stable wake structure is formed, and the reverse Kármán vortex street exhibits minimal downward deflection. The wake momentum effectively drives the water, and the energy utilization of the trailing vortices reaches its optimum. Between 0.7 Hz and 1 Hz, the downward deflection of the trailing vortices becomes more pronounced, reducing wake stability and increasing momentum loss, which results in lower pumping efficiency. As the flapping frequency increases from 1 Hz to 3 Hz, the flapping velocity of the flat-plate hydrofoil rises, enhancing the asymmetry of vortex shedding. Consequently, the wake is directed more downward rather than rearward, leading to a further decrease in pumping efficiency.
Figure 13 shows the variation of average flow rate and average head with flapping frequency for different motion modes.
It can be observed that at low frequencies, the flow rate of the flapping flat-plate hydrofoil is approximately proportional to the flapping frequency, while the head is roughly proportional to the square of the frequency. At higher frequencies, both simple harmonic and quasi-harmonic motions are affected by vortex deflection, which in turn impacts the flow rate and head.

4.2. Effect of Flow Channel Structure on the Water Body

Figure 14 shows the vorticity contour plots at different time steps for a flapping frequency of 1 Hz. It can be observed that during the periodic motion of the flapping flat-plate hydrofoil, shear layer separation at the upstream end of the flow channel induces localized vortices that gradually strengthen. These vortices interact with the primary vortices generated by the hydrofoil itself, enhancing the wake structure behind the hydrofoil and ultimately forming an alternating reverse Kármán vortex street at the downstream end of the channel.
However, in both flapping modes, tip vortex phenomena are observed near the channel outlet caused by the abrupt truncation of the channel boundaries, where shear layer separation at the exit leads to the formation of counter-rotating vortices opposite to the main flow direction. This phenomenon reveals that the outlet geometry has a direct impact on the evolution of these counter-rotating vortices. If the outlet angle is poorly designed, strong interference between the reverse vortices and main vortices may occur, thereby reducing propulsion efficiency.
To address this issue, this study optimizes the outlet angle of the flow channel to regulate the shedding phase of the terminal vortices, enabling a synergistic interaction with the main vortex street and thereby enhancing the overall hydrodynamic performance.

4.2.1. Effect of Flow Channel Structure on the Flow Field

To investigate the influence of the outlet angle at the end of the flow channel on the hydrodynamic performance of the flapping hydrofoil device, seven sets of numerical simulations were conducted with a flapping frequency of 1 Hz. The channel outlet angle was varied from −30° to 30° in 10° increments. The results are shown in Figure 15.
Variation in the outlet angle of the flow channel does not significantly alter the number of vortices but does affect their spatial distribution. Negative outlet angles enhance flow separation at the channel exit, leading to more concentrated vortex structures near the outlet. In contrast, positive outlet angles cause the fluid to stretch along the outlet direction due to wall shear effects, forming elongated vortex structures and gradually disrupting the regularity of the wake.
When the outlet angle is α = −10°, the wake of the flapping flat-plate hydrofoil maintains a stable alternating shedding pattern. No significant flow separation occurs at the channel outlet, and the flow field remains well organized. At α = −20°, the trailing vortices at the outlet become slightly larger compared to α = −10°, and the shear layer becomes more pronounced. However, at α = −30°, changes in the shear layer at the outlet result in the formation of large vortices near the exit. Vorticity retention appears above the flapping flat-plate hydrofoil, increasing flow field non-uniformity and causing the wake to lose its reverse Kármán symmetry and shift upward as a whole.
Under positive outlet angle conditions, the trailing vortices exhibit relatively regular alternating shedding, and the reverse Kármán vortex street structure remains largely unchanged. However, as the outlet angle increases, shear forces acting on the fluid as it leaves the channel wall cause the flow to stretch. As a result, the flow no longer rolls up into localized vortices but instead extends along the streamwise direction, forming elongated regions of high vorticity that gradually intensify.
In addition, at outlet angles of α = ±20° and α = ±30°, inward-converging vorticity regions can be observed along the upper and lower boundary layers outside the channel outlet. Due to the variation in outlet angle, a pressure difference arises between the upper and lower boundary layers, inducing an inward entrainment of fluid along the boundary layers. This causes the vorticity structures in the upper and lower boundary layers to converge toward the center region. This entrainment effect leads to a more concentrated overall wake structure, although it does not significantly alter the alternating shedding pattern of the wake.
Figure 16 presents the velocity contour maps for different outlet angles. When the outlet angles are α = −20°, −10°, 0°, and 10°, the flow velocity distribution in the wake region is uniform, with high-speed fluid concentrated at the center of the channel outlet, and no significant deflection of the wake is observed.
When the outlet angle is positive (α = 10°, 20°, 30°), a distinct elongated low-velocity region forms near the channel outlet, and as the angle increases, this low-velocity region becomes more pronounced and gradually extends in the flow direction. This is due to the positive outlet angle of the channel, which causes the fluid to experience stronger shear forces as it leaves the channel wall, leading to localized flow separation. This effect gradually intensifies with increasing angle, causing the low-velocity region to extend more noticeably downstream.
In contrast, at a larger negative angle of α = −30°, a distinct localized recirculation region forms above the flapping flat-plate hydrofoil, indicating that the negative tilt of the channel outlet causes severe flow separation and induces localized reverse flow. The presence of this recirculation region significantly disrupts the uniformity of the velocity field and causes a deflection of the wake structure. Furthermore, at this angle, the velocity gradient distribution at the outlet becomes more complex, with an enhanced transition zone between high-speed and low-speed regions, causing a deflection in the wake direction, which further affects the overall wake structure and propulsion performance.
Overall, outlet angles within the range of α = −10° to 10° help maintain wake concentration and the formation of high-speed wake. In contrast, larger negative or positive angles may induce localized recirculation or flow deflection, affecting velocity stability. This result is corroborated by the wake deflection and vortex asymmetry observed in the vorticity contour plots.

4.2.2. Effect of Flow Channel Structure on Water-Pushing Performance

To further analyze the effect of the outlet angle on the pumping performance of the flapping flat-plate hydrofoil, Figure 17 shows the pumping efficiency and propulsion efficiency curves for the device at different outlet angles.
It can be observed from the figure that pumping efficiency and propulsion efficiency show a positive correlation in overall trend, with pumping efficiency slightly lower than propulsion efficiency. As the outlet angle increases, both propulsion and pumping efficiency first increase and then decrease. From the efficiency analysis, both pumping efficiency and propulsion efficiency reach their peak values at an outlet angle of −10°. Compared to an outlet angle of 0°, the −10° angle results in an 8.5% increase in pumping efficiency and a 10.2% increase in propulsion efficiency, indicating that a moderate negative angle can enhance fluid propulsion performance. This finding is consistent with previous analyses of vorticity and velocity contours, where the flow at the channel outlet remains stable within this angle range, with well-organized vortex structures and moderate shear layer separation, favoring the continuity and directional coherence of the wake.
As the outlet angle increases outward, both pumping efficiency and propulsion efficiency exhibit a declining trend, with the decrease in pumping efficiency being more pronounced. Under such conditions, the velocity of fluid near the wall is significantly reduced, and the local flow fails to effectively merge with the main stream, resulting in a distinct flow separation region. This separation does not lead to immediate vortex formation, but rather manifests as an elongated low-velocity region stretched along the outlet direction. The expansion of this region indicates that part of the fluid’s kinetic energy is dissipated by wall friction, causing deflection in the flow direction and non-uniformity in the wake velocity field, which directly reduces both pumping and propulsion efficiency.
However, at α = −30°, both pumping efficiency and propulsion efficiency drop to their lowest values, at 8.1% and 17.6%, respectively. As shown in Figure 16, a distinct recirculation region forms above the flapping flat-plate hydrofoil, and the wake shifts upward, resulting in a significant decrease in both pumping and propulsion efficiencies.

4.3. Experimental Validation

To verify the accuracy of the numerical simulations for different flapping modes of the flat-plate hydrofoil, physical prototypes were fabricated based on the previously defined parameters and tested in the experimental flume at Zhejiang Hengze Ecological Technology Co., Ltd., Hangzhou, Zhejiang Province, China. The physical tests were conducted in a rectangular flume with dimensions of 5 m × 20 m × 2 m. Importantly, the inlet velocity was set to 0 m/s, meaning there was no external forced flow in the system. Instead, the flow was generated entirely by the motion of the flapping hydrofoil, with the system relying on the thrust and lift forces induced by the hydrofoil’s oscillations to drive the flow through the channel. To minimize the influence of the free surface during testing, the flow velocity sensor was positioned at the same depth as the midsection of the hydrofoil. The flapping flat-plate hydrofoil device and the crank-slider mechanism were placed at the inlet, as shown in Figure 18.
The experiment employed a JD-LS6C Doppler velocimeter to measure flow velocity at the outlet of the test flume, with a measurement range of 0.02–5.00 m/s and an accuracy of 2% F.S. Flow velocity was measured at five different points along the outlet cross-section of the test flume, and the average value was used to ensure data accuracy. The flapping hydrofoil device was operated for 80 cycles to allow the flow field to stabilize before data acquisition was initiated.
Figure 19 presents the velocity–frequency curves for the flapping flat-plate hydrofoils of the two devices under different frequencies.
As shown in Figure 19, all four curves exhibit a linear increasing trend with flapping frequency, indicating a positive correlation between frequency and flow velocity enhancement. At the same frequency, both the simulated and experimental flow velocities of the simple harmonic motion are consistently higher than those of the quasi-harmonic motion. The simulation trends show good agreement with the experimental results. This further confirms that simple harmonic motion is more effective in enhancing pumping performance.

5. Conclusions

This study, based on numerical simulation methods, investigates the effects of different flapping modes and channel outlet angles on the water-pushing performance and flow field characteristics of a flapping flat-plate hydrofoil pumping device, providing theoretical support and reference for the engineering design and practical application of bionic water-pumping systems. The main conclusions are as follows:
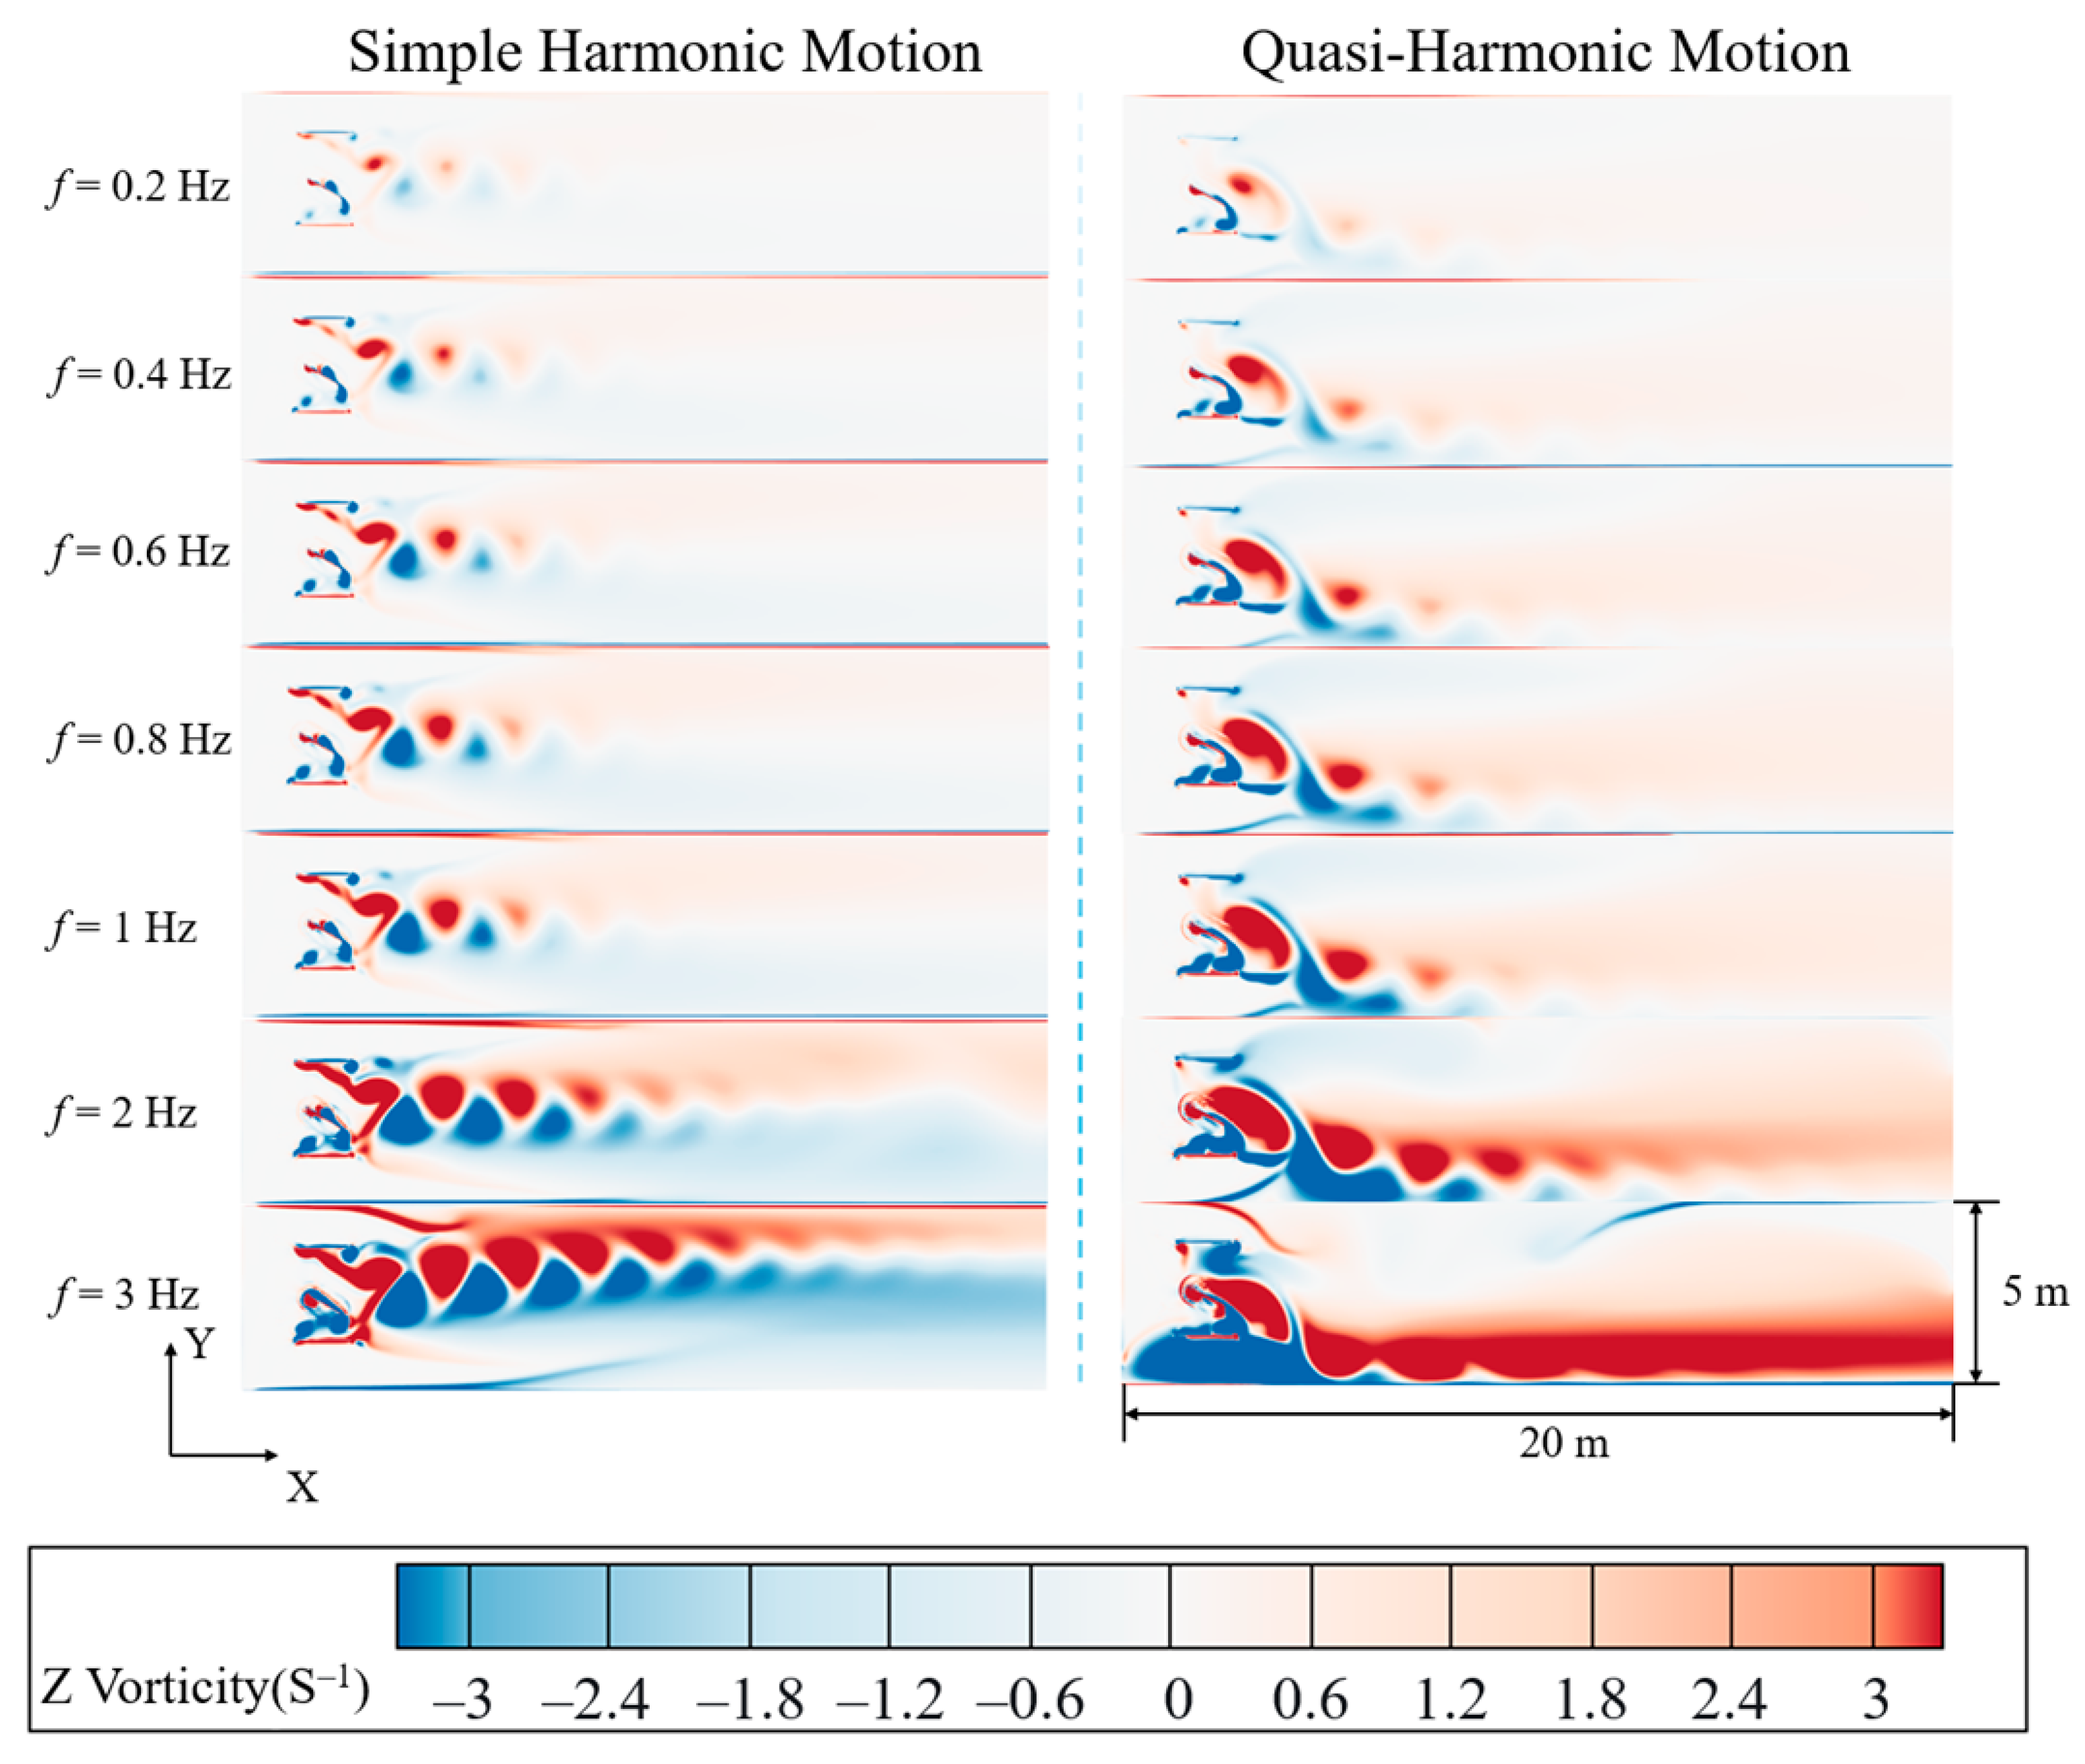
  • Both simple harmonic and quasi-harmonic motions generate reverse Kármán vortex streets, but differences exist in wake structure and thrust characteristics. The wake generated by simple harmonic motion exhibits good symmetry, while the wake in quasi-harmonic motion deflects downward, with the degree of deflection increasing as the flapping frequency rises.
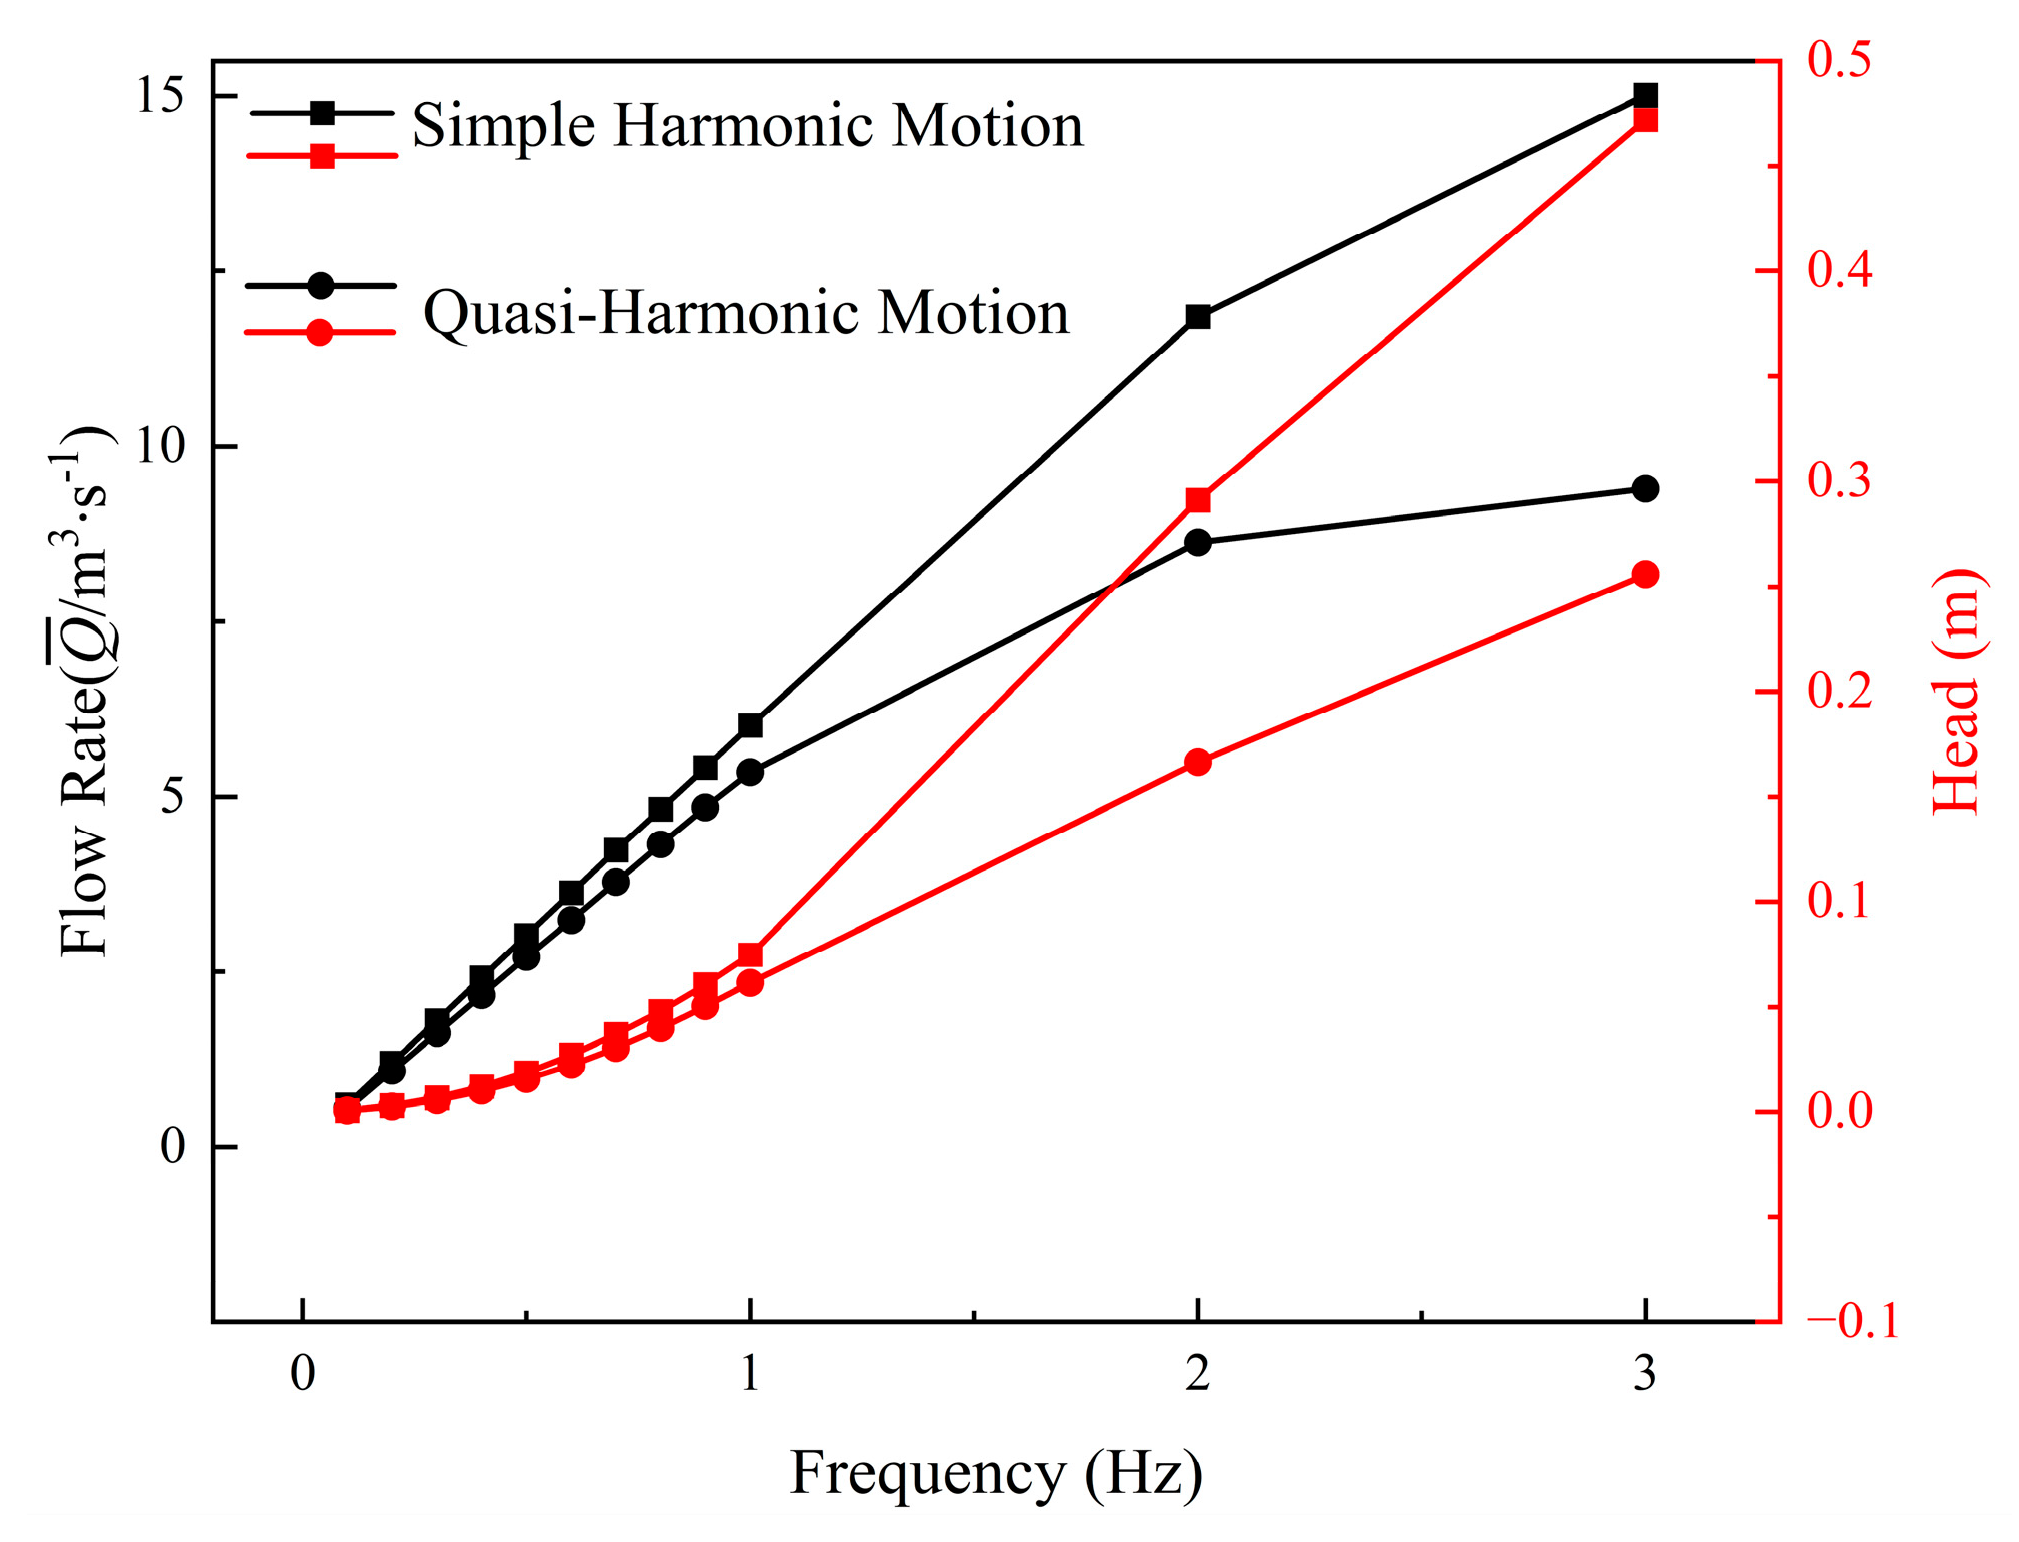
  • Simple harmonic motion maintains a relatively high pumping efficiency overall, reaching a maximum of 21.5% at a flapping frequency of 0.7 Hz. In contrast, the pumping efficiency of quasi-harmonic motion fluctuates more significantly across frequencies, with a peak of 17.8% at 0.6 Hz. At this frequency, the pumping efficiency of simple harmonic motion is still 20.2% higher than the peak value of quasi-harmonic motion.
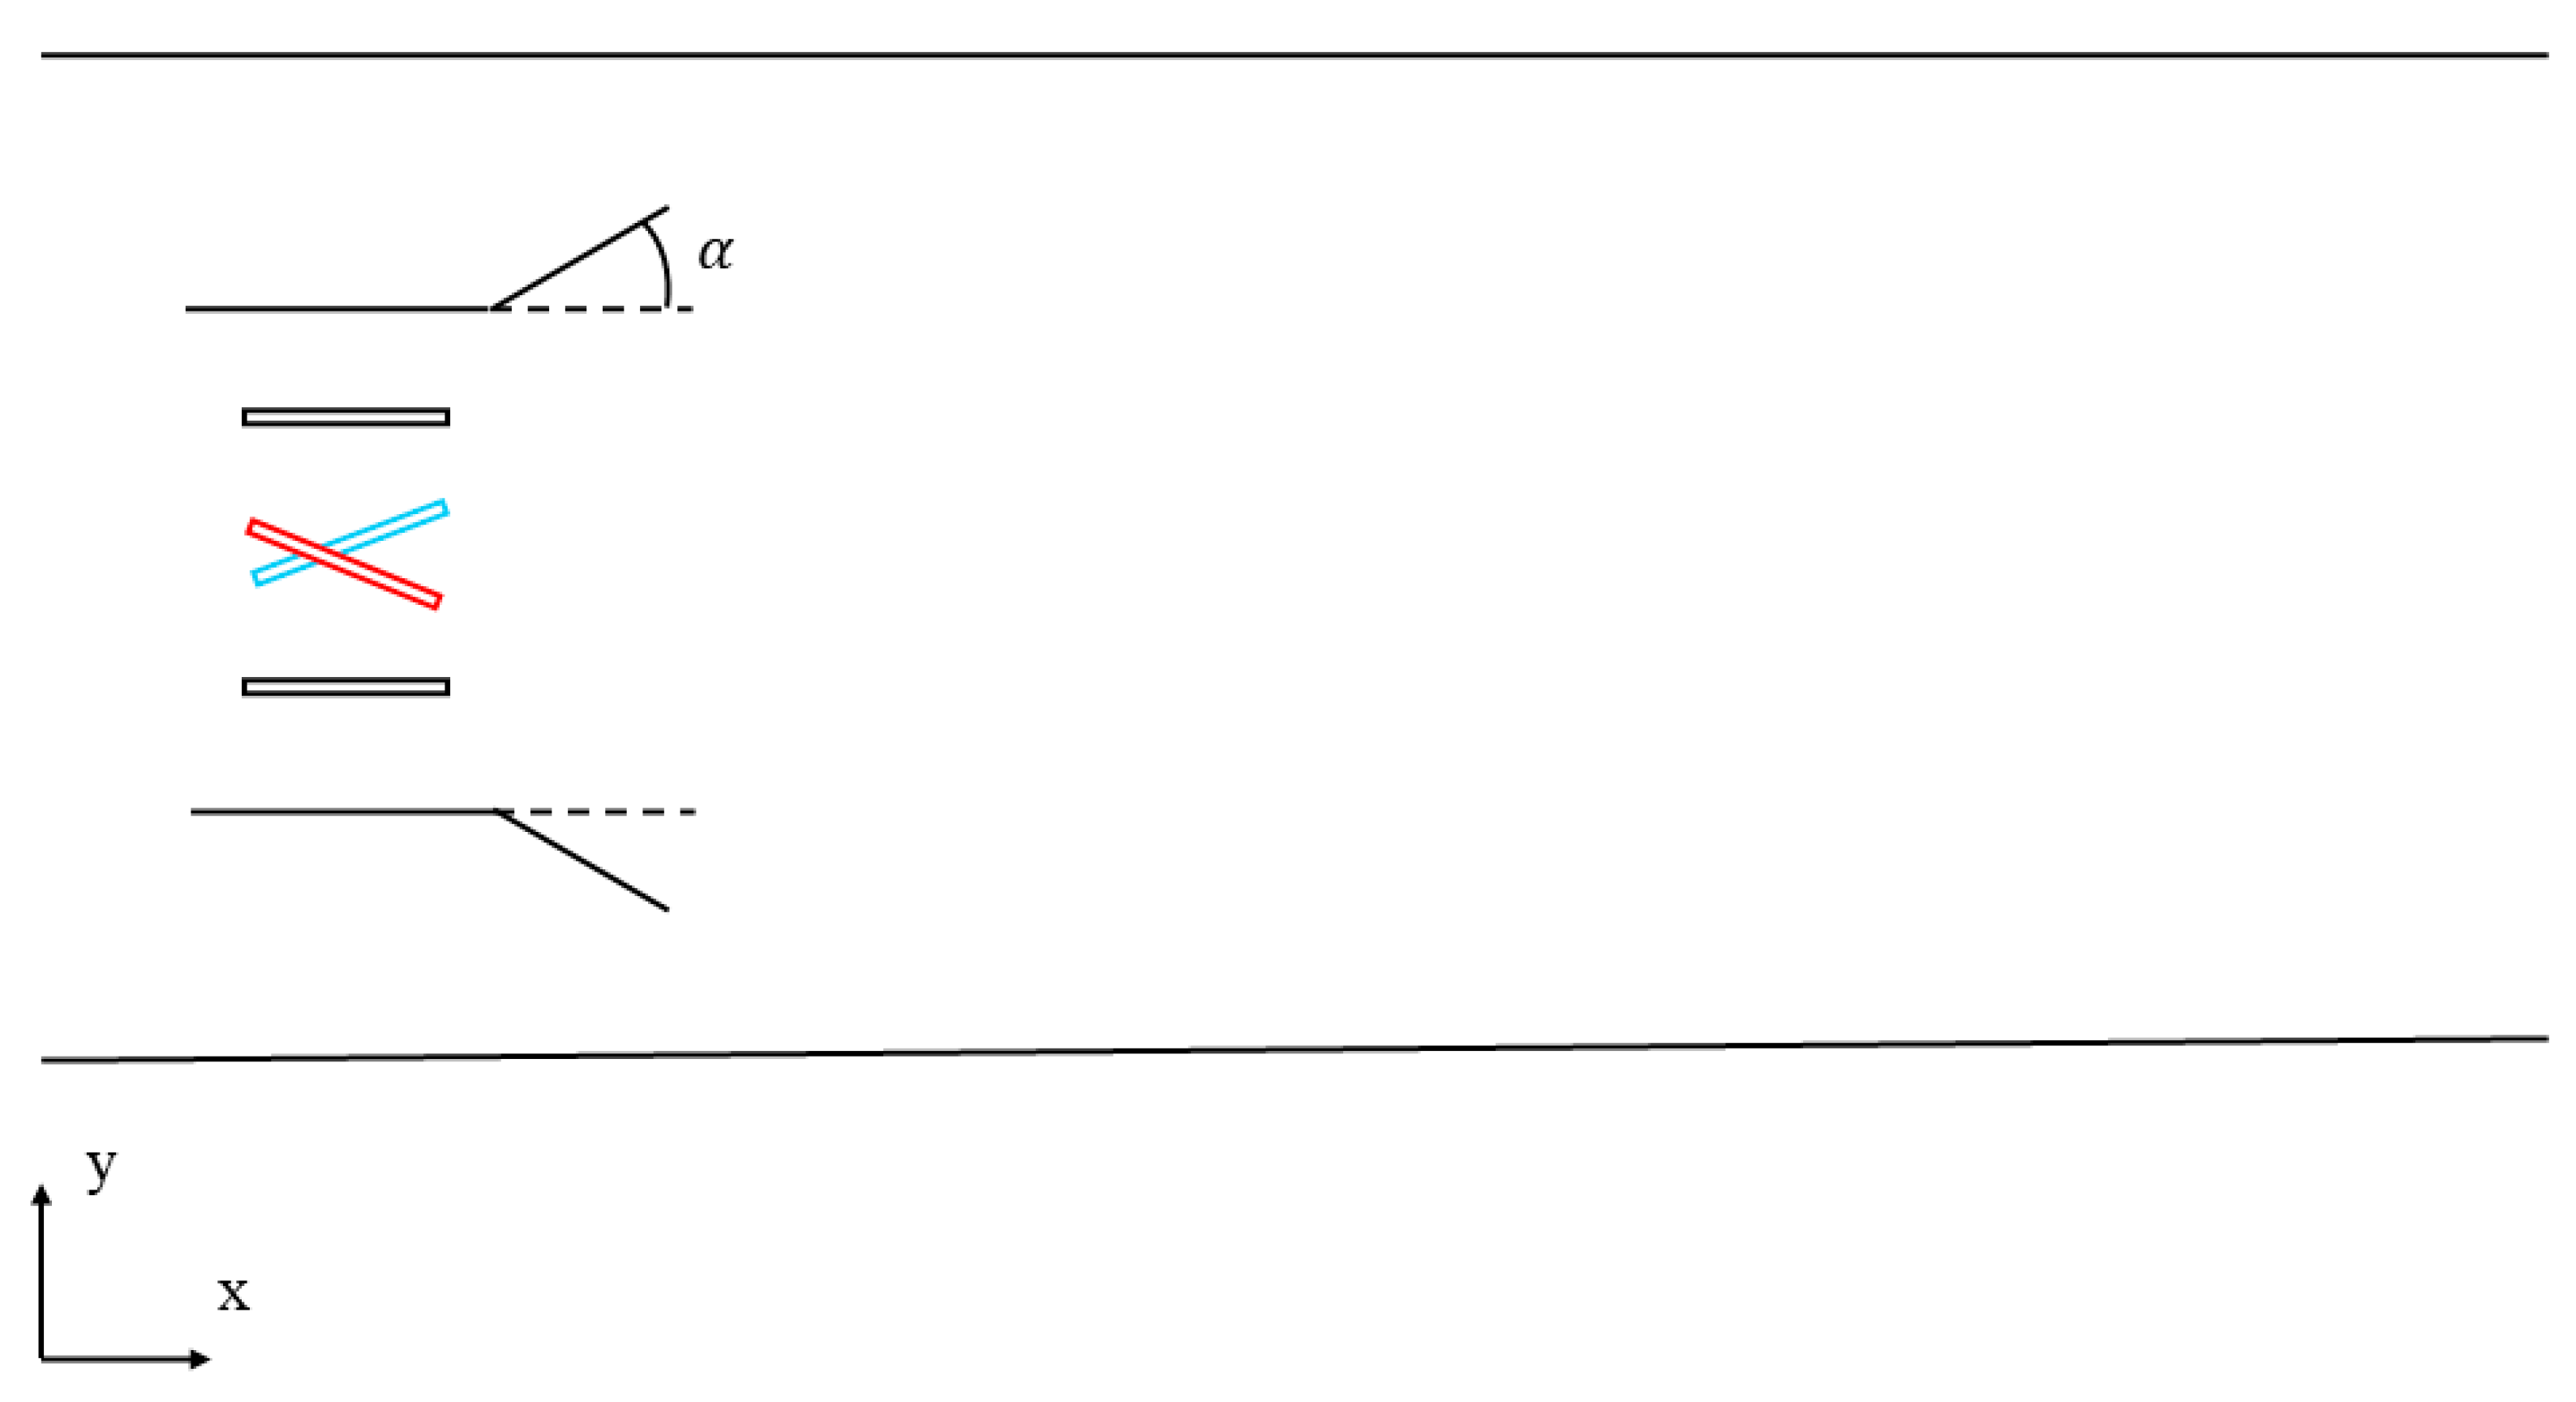
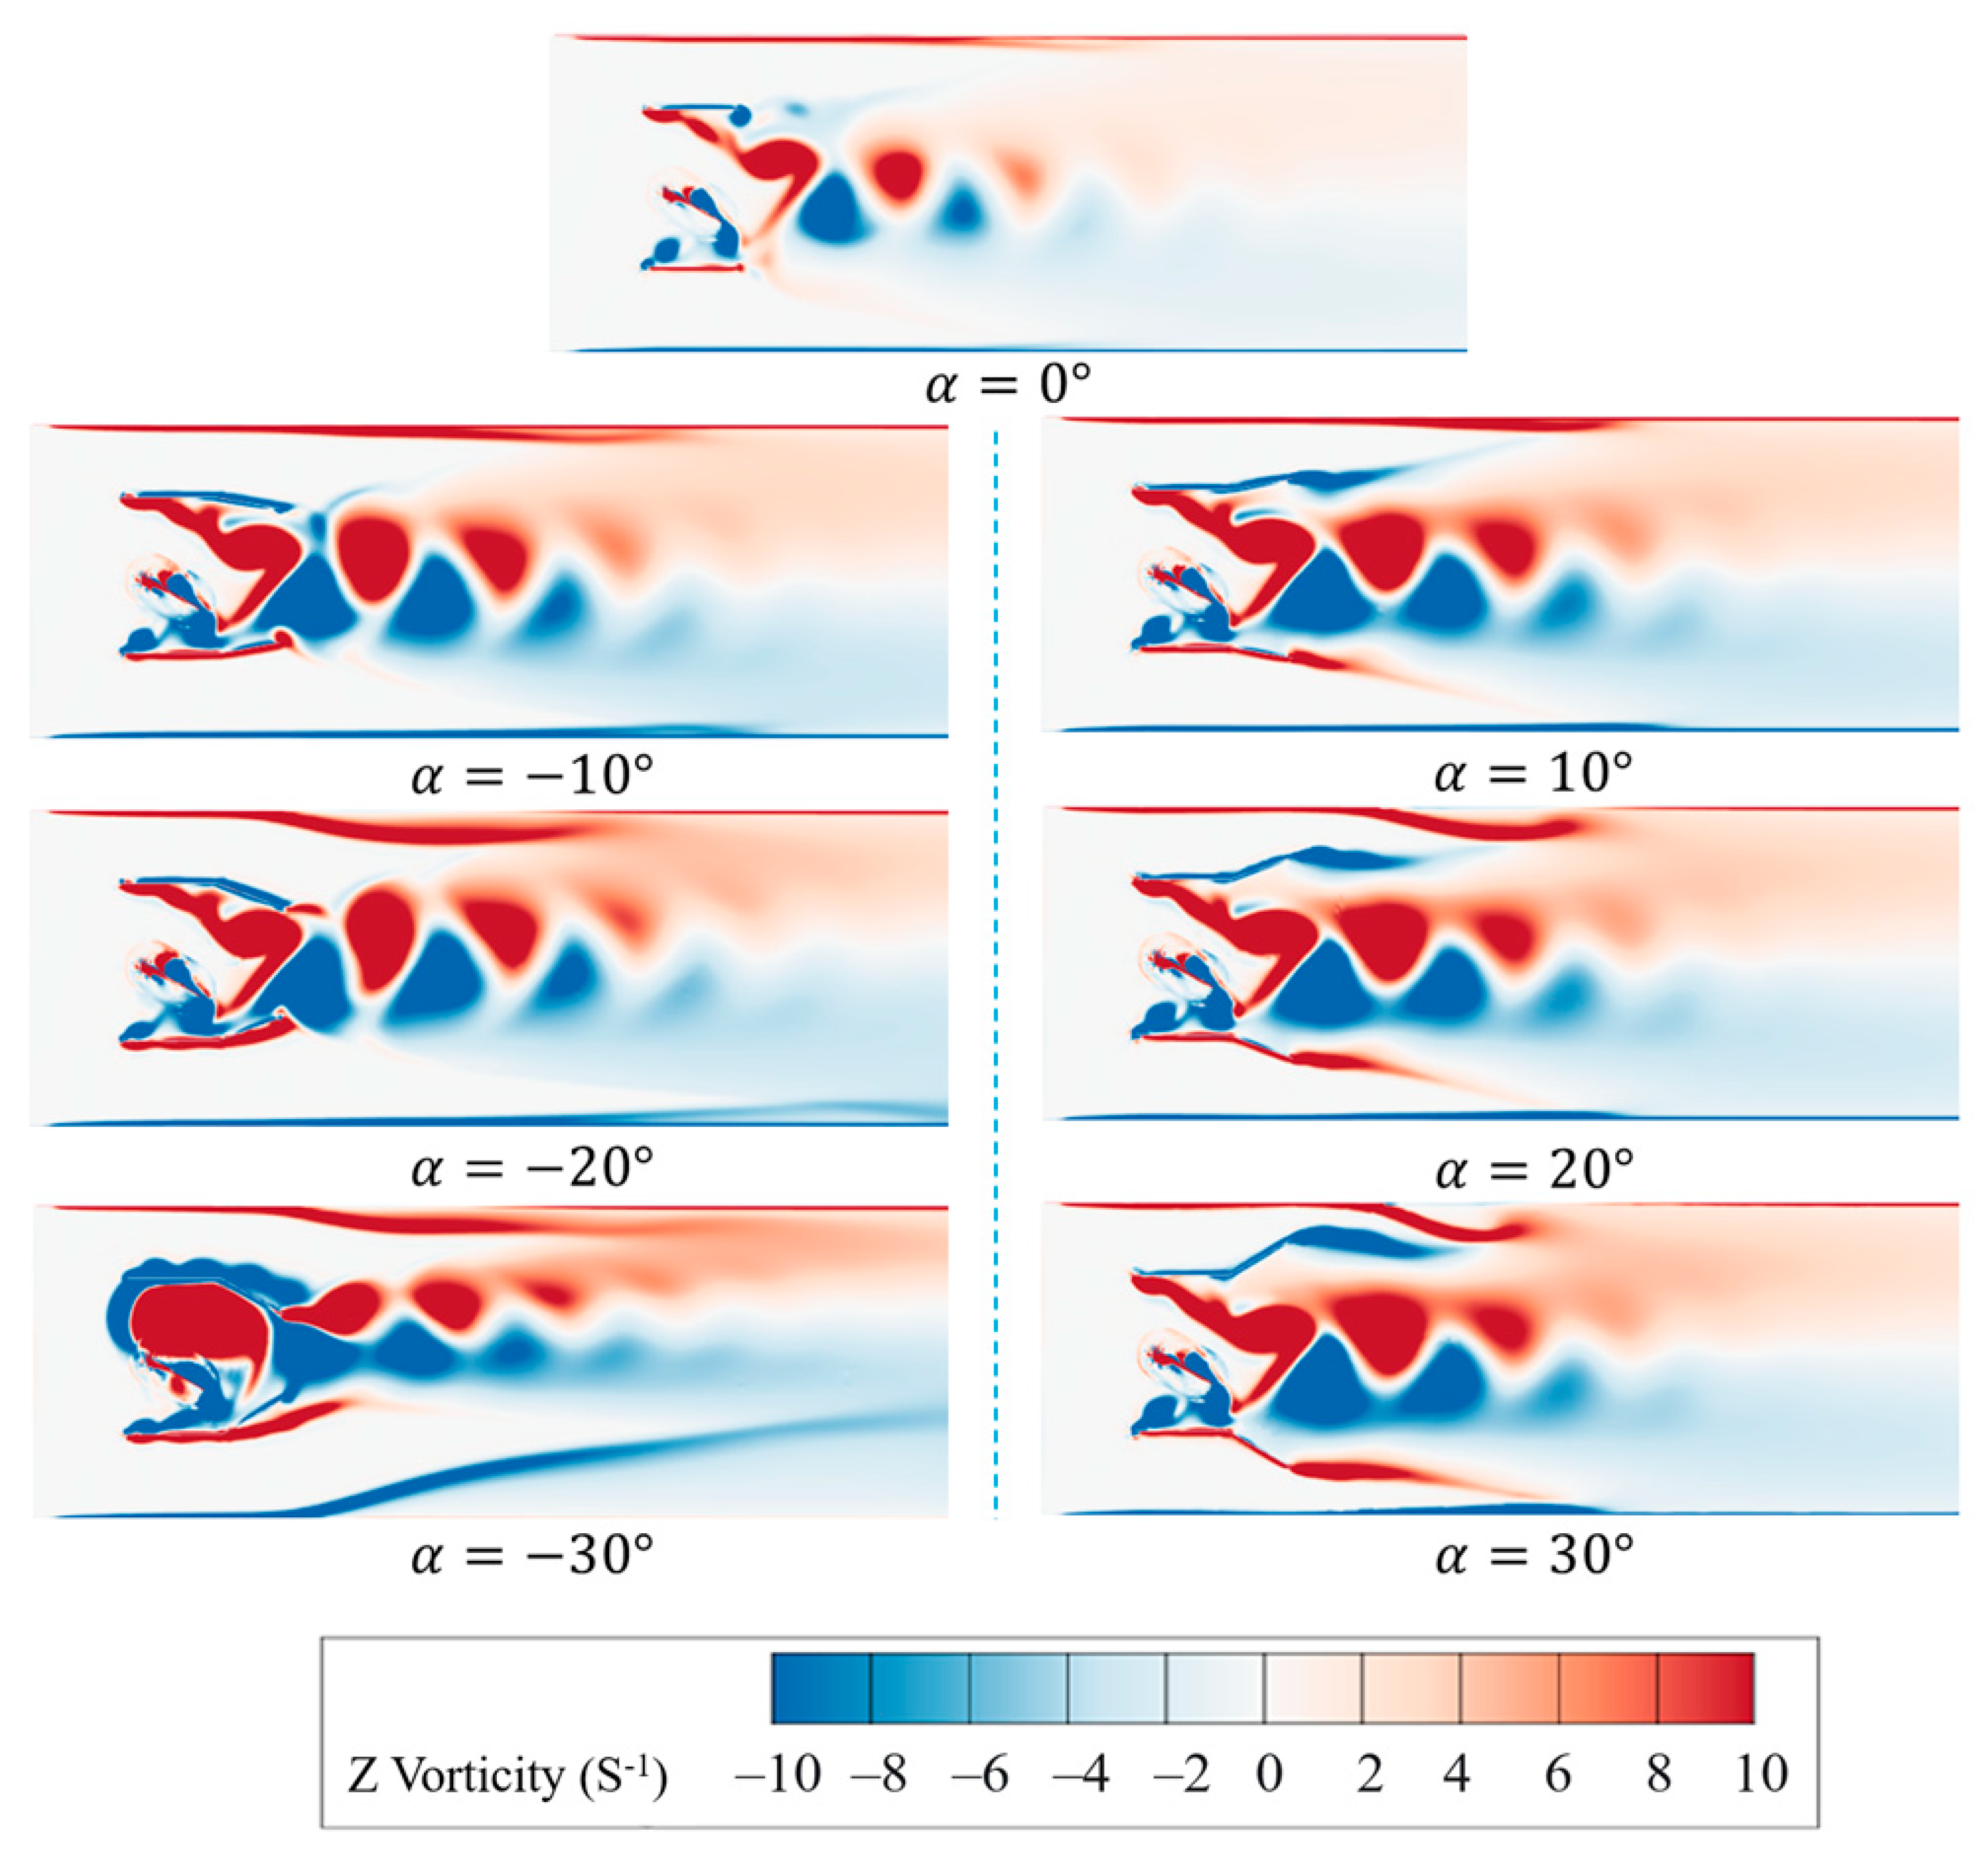
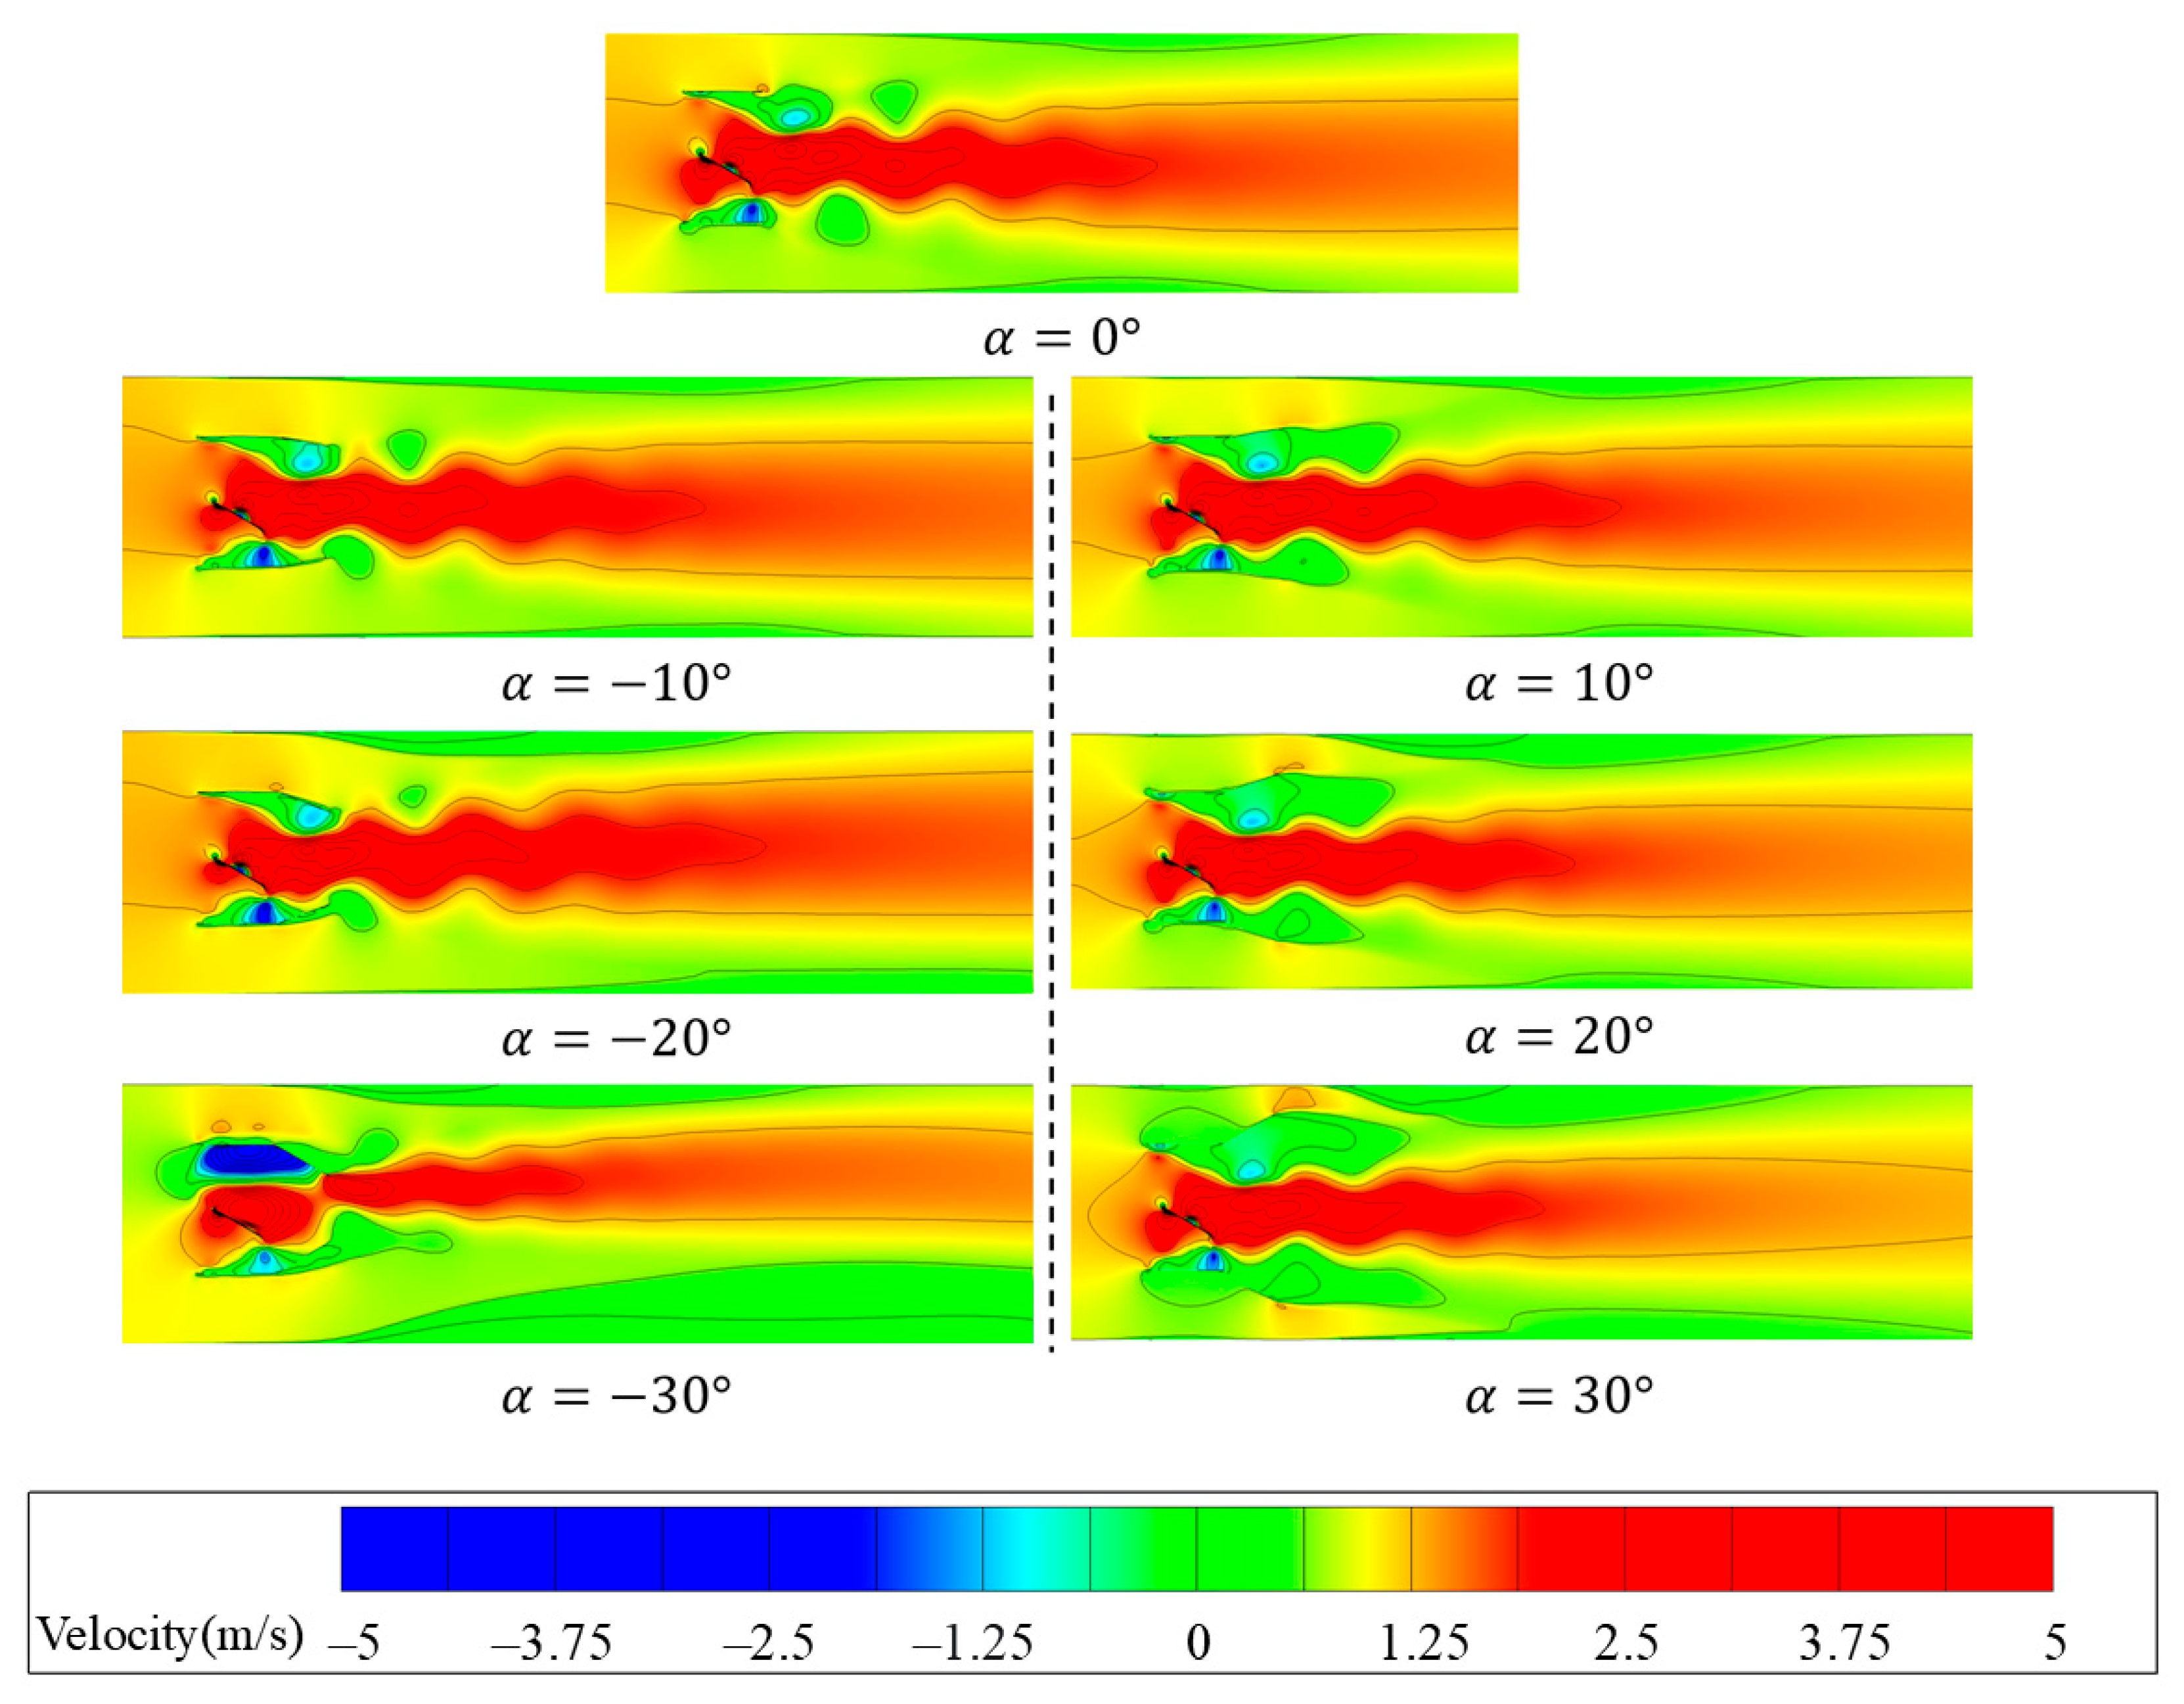
  • Variation in the channel outlet angle does not significantly change the number of vortices but does affect their spatial distribution. Negative outlet angles enhance flow separation at the channel exit, resulting in more concentrated vortices near the outlet. However, at α = −30°, a distinct recirculation region appears above the outlet, causing the wake to deflect upward and compromising the directionality of water propulsion. In contrast, positive outlet angles cause the fluid to stretch along the outlet direction under wall shear effects, forming elongated vortex structures. As the angle increases, the boundary layer entrainment effect becomes more pronounced, altering the wake expansion pattern and leading to reduced water-pushing performance.
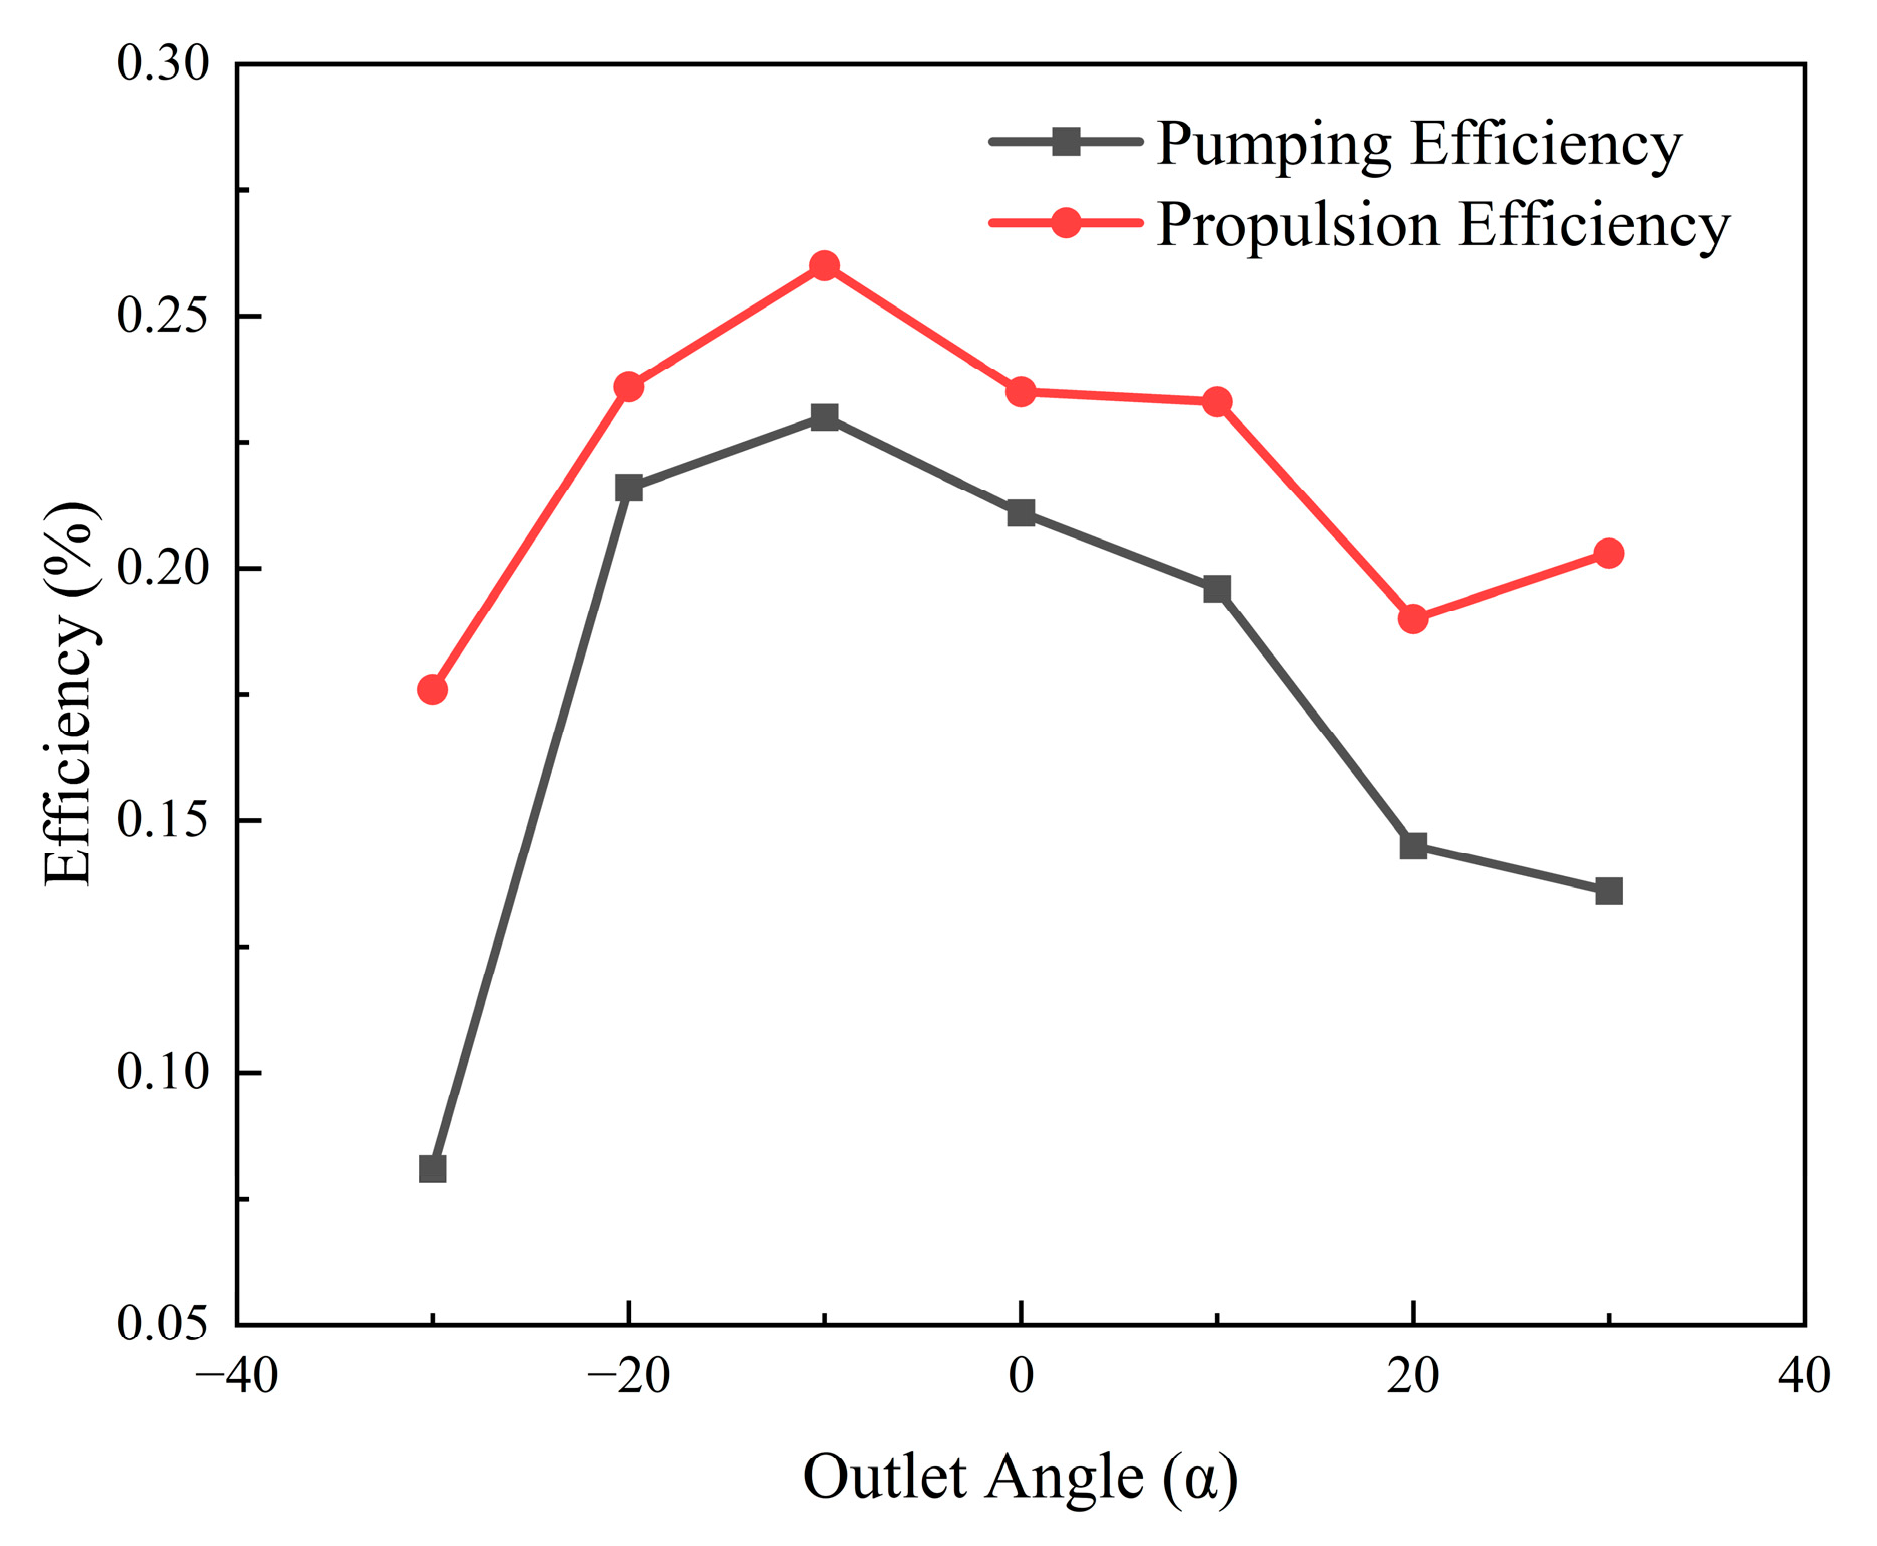
  • With variation in the channel outlet angle, pumping efficiency and propulsion efficiency exhibit a strong positive correlation. Both reach their peak values at α = −10°, with pumping efficiency at 22.9% and propulsion efficiency at 25.9%. Compared to α = 0°, pumping efficiency increases by 8.5% and propulsion efficiency by 10.2%. A moderate negative angle helps enhance fluid propulsion performance.
While the present study includes experimental validation based on outlet flow velocity measurements, further experimental work is planned to enhance the verification of the numerical model. Specifically, future studies will incorporate thrust measurements and flow visualization techniques such as particle image velocimetry (PIV) to capture unsteady flow characteristics and vortex evolution in greater detail. These efforts will provide more comprehensive validation of the CFD model’s predictive capabilities.

Author Contributions

E.H. articulated the main research directions on the Influence of the Flapping Mode of the Device and the Outlet Angle of the Flow Channel on the Hydrodynamic Performance of the Device; Y.L. was involved in the full writing of the manuscript as well as in data processing; S.L. participated in the construction of the model and the design details of the device; X.W. provided the writing ideas. M.X. reviewed the manuscript. All authors have read and agreed to the published version of the manuscript.

Funding

This research was funded by the Zhejiang Provincial Key Research and Development Project (Grant No. 2021C03019).

Institutional Review Board Statement

Not applicable.

Informed Consent Statement

Not applicable.

Data Availability Statement

All data, models, and code generated or used during the study appear in the submitted article.

Acknowledgments

The authors gratefully thank the Zhejiang Provincial Key Research and Development Project for their financial support.

Conflicts of Interest

The authors declare no conflicts of interest.

References

  1. Luo, D.; Lu, P.; Yu, G. Study On The Activity of the Contaminative Water and the Impact on the Water Pollution of Change in Urban River-Net in the East Plain Region of China. Environ. Eng. 2011, 29, 59–62. [Google Scholar]
  2. Ma, C.; Tang, Z.; Xu, K.; He, W.; Zhao, M. Study on Water Replenishment Scheduling Strategies for Water Quality Improvement of Urban River Network in Plain Area: A Case Study of Urban Central River Network in Tianjin. South-to-North Water Transf. Water Sci. Technol. 2017, 15, 81–87. [Google Scholar]
  3. Wang, C.; Wei, Z.; Zhang, L.; Zuo, J. Experimental Study on Improvement of Water Environment by Water Diversion in Plain River Networks. J. Hohai Univ. (Nat. Sci.) 2005, 2, 136–138. [Google Scholar]
  4. Hu, Y. Analysis of Water Analysis of the Effects of Water Diversion Works for Water Environment Improvement in the Hangjiahu District. Master’s Thesis, Zhejiang University, Hangzhou, China, 2010. [Google Scholar]
  5. Chen, L.; Xu, L.; Zhang, X.; Yan, S.; Wang, D. Characteristics of Pressure Fluctuation in Pump System with Low Head. J. Drain. Irrig. Mach. Eng. 2020, 38, 121–126+144. [Google Scholar]
  6. Yu, S.; Li, Y.; Cheng, Y.; Shi, Y.; Cheng, Y.; Huang, Y.; Zhu, Y.; Pan, H.; Yue, Z.; Zheng, K. The Impacts of Water Diversion on Hydrodynamic Regulation of Plain River Network. J. Lake Sci. 2021, 33, 462–473. [Google Scholar]
  7. Jin, Q.; Chen, K.; Yuan, L. Motion Simulation Analysis of Three-Joint Caudal Fin Robotic Fish. Mach. Tool Hydraul. 2023, 51, 45–49. [Google Scholar]
  8. Katzschmann, R.K.; DelPreto, J.; MacCurdy, R.; Rus, D. Exploration of Underwater Life with an Acoustically Controlled Soft Robotic Fish. Sci. Robot. 2018, 3, eaar3449. [Google Scholar] [CrossRef]
  9. Hua, E.; Tang, S.; Chen, W.; Xie, R.; Guo, X. Analysis on Influence of Swinging Modes of Swing Hydrofoil on Water Propulsion. J. Hydroelectr. Eng. 2022, 41, 93–103. [Google Scholar]
  10. Yu, J.; Zhou, Z.; Liu, J. Research Progress and Analysis on Multiple Autonomous Underwater Vehicle Systems. Inf. Control. 2021, 50, 129–140. [Google Scholar]
  11. Xu, J.; Sun, H. Experimental Studies of Passive Oscillating Hydrofoil for Tidal Current Energy Extracting. J. Harbin Eng. Univ. 2016, 37, 248–253. [Google Scholar]
  12. Totpal, D.A.; Siala, F.F.; Liburdy, A.J. Energy Harvesting of an Oscillating Foil at Low Reduced Frequencies with Rigid and Passively Deforming Leading Edge. J. Fluids Struct. 2018, 82, 329–342. [Google Scholar] [CrossRef]
  13. Zhang, K.; Liu, H.; Wang, Q.; Zhang, B. Optimization of Multi-Organism Cooperative Propulsion Efficiency of Bionic Thunniform Fish Robot. J. South China Univ. Technol. (Nat. Sci. Ed.) 2018, 46, 109–115+122. [Google Scholar]
  14. Lin, T.; Xia, W.; Pecora, R.; Wang, K.; Hu, S. Performance Improvement of Flapping Propulsions from Spanwise Bending on a Low-Aspect-Ratio Foil. Ocean. Eng. 2023, 284, 115305. [Google Scholar] [CrossRef]
  15. Hua, E.; Xiang, M.; Sun, Q.; Wang, T.; Song, Y.; Lu, C. Bidirectional Fluid–Structure Interaction Study on Hydrofoil Hardness and Oscillation Mode Optimization. Appl. Sci. 2025, 15, 825. [Google Scholar] [CrossRef]
  16. Ding, H.; Song, B.; Tian, L. Exploring Propulsion Performance Analysis of Bionic Flapping Hydrofoil. J. Northwest. Polytech. Univ. 2013, 31, 150–156. [Google Scholar]
  17. Du, X.; Zhang, Z. Numerical Analysis of Influence of Four Flapping Modes on Propulsion Performance of Underwater Flapping Foils. Eng. Mech. 2018, 35, 249–256. [Google Scholar]
  18. Liu, H.; Su, Y.; Pang, Y. Influence of Non-Sinusoidal Oscillation on the Hydrodynamic Performance of Hydrofoils. J. Huazhong Univ. Sci. Technol. (Nat. Sci. Ed.) 2016, 44, 15–20. [Google Scholar]
  19. Peng, L.; Yu, Z.; Zhang, W.; Wang, N.; Luo, J. Effects of Different Paddling Motion Patterns and Flexibility on Hydrofoil Propulsion Performance. Ocean. Eng. 2023, 288 Pt 1, 116086. [Google Scholar] [CrossRef]
  20. Wu, F.; Dong, X.; Wu, Y.; Ma, D.; Feng, X. Hydraulic Properties of the Flow in a Gradual Shrinking and Sudden Enlarging Channel. J. North China Univ. Water Resour. Electr. Power (Nat. Sci. Ed.) 2017, 38, 61–67. [Google Scholar]
  21. Li, Y.; Wang, J.; Chen, J. Numerical Investigation of Pitching Foil’s Propulsive Performance with Wall Effect. Nav. Archit. Ocean. Eng. 2020, 36, 26–31. [Google Scholar]
  22. Wang, J.; Meng, Z.; Feng, W.; Han, A.; Xie, Y.H.; Xie, D.M. Effect of Shroud on the Energy Extraction Performance of Oscillating Foil. Energy 2022, 239, 122387. [Google Scholar]
  23. Bin, X.; Qiyu, M.; Diangui, H. Research on Energy Harvesting Properties of a Diffuser-Augmented Flapping Wing. Renew. Energy 2021, 180, 271–280. [Google Scholar]
  24. Dahmani, F.; Sohn, C. Effect of Convergent Duct Geometry on the Energy Extraction Performance of Tandem Oscillating Hydrofoils System. J. Fluids Struct. 2020, 95, 102949. [Google Scholar] [CrossRef]
  25. Hadi, S.; Madjid, A.; Masoud, D. Numerical Study to Evaluate the Important Parameters Affecting the Hydrodynamic Performance of Manta Ray’s in Flapping Motion. Appl. Ocean. Res. 2021, 109, 102559. [Google Scholar]
  26. Hua, E.; Luo, H.; Xie, R.; Chen, W.; Tang, S.; Su, Z. Design and Test of Flapping Hydrofoil Bionic Water Pumping Device. Trans. Chin. Soc. Agric. Mach. 2023, 54, 155–162. [Google Scholar]
  27. Brinker, A.; Rösch, R. Factors Determining the Size of Suspended Solids in a Flow-Through Fish Farm. Aquac. Eng. 2005, 33, 1–19. [Google Scholar] [CrossRef]
  28. Zhang, X.; Wang, Z.; Zhang, Z. Hydrodynamic study of bionic propulsion for 2-D flapping foil. Chin. J. Hydrodyn. 2006, 632–639. [Google Scholar]
  29. Zi, D.; Wang, F.; Tao, R.; Hou, Y. Research for Impacts of Boundary Layer Grid Scale on Flow Field Simulation Results in Pumping Station. J. Hydraul. Eng. 2016, 47, 139–149. [Google Scholar]
  30. Hu, F.; Zhao, W.; Huang, Y.; Yu, J. Study on Propulsion Performance of Three-dimensional Passive Swinging Hydrofoil on Wave Glider. J. Mech. Eng. 2020, 56, 243–249. [Google Scholar]
  31. Mountris, K.A.; Pueyo, E. Cardiac Electrophysiology Meshfree Modeling through the Mixed Collocation Method. Appl. Sci. 2023, 13, 11460. [Google Scholar] [CrossRef]
  32. Noorizadegan, A.; Naji, A.; Lee, T.-L.; Cavoretto, R.; Young, D.L. Bending analysis of quasicrystal plates using adaptive radial basis function method. J. Comput. Appl. Math. 2024, 450, 115990. [Google Scholar] [CrossRef]
  33. Read, D.; Hover, F.; Triantafyllou, M. Forces on Oscillating Foils for Propulsion and Maneuvering. J. Fluids Struct. 2003, 17, 163–183. [Google Scholar] [CrossRef]
  34. Chen, Y.; Zhan, J.; Wu, J.; Wu, J. A Fully-Activated Flapping Foil in Wind Gust: Energy Harvesting Performance Investigation. Ocean. Eng. 2017, 138, 112–122. [Google Scholar] [CrossRef]
  35. Duy, Q.N.; Chengwang, L. Hydrodynamic Characteristics of a Confined Circular Cylinder in Cross-Flows. Ocean. Eng. 2021, 221, 108567. [Google Scholar]
  36. Zhang, G. Hydrodynamic Hydrodynamic Analysis and Experimental Study on Swinging Propulsion of Two-Dimensional Rigid Wing. Master’s Thesis, Harbin Institute of Technology, Harbin, China, 2018. [Google Scholar]
Figure 1. Schematic diagram of the crank-slider drive mechanism. (1. Double Crank 2. Coupling 3. Stepper Motor 4. Flapping Flat-Plate Hydrofoil 5. Slider 6. Slide Rail 7. Support Frame).
Applsci 15 07034 g001
Figure 2. Schematic diagram of the synchronous belt drive mechanism. (1. Stepper Motor 2. Slider 3. Connecting Rod 4. Flapping Flat-Plate Hydrofoil 5. Slide Platform 6. Synchronous Belt Module 7. Slide Rail 8. Support Frame).
Applsci 15 07034 g002
Figure 3. (a) Schematic diagram of simple harmonic motion; (b) Schematic diagram of quasi-harmonic motion.
Applsci 15 07034 g003
Figure 4. (a) Actual motion trajectories of simple harmonic motion; (b) Actual motion trajectories of quasi-harmonic motion.
Applsci 15 07034 g004
Figure 5. Schematic diagram of flow channel outlet structure.
Applsci 15 07034 g005
Figure 6. Mesh generation schematic.
Applsci 15 07034 g006
Figure 7. Grid independence verification.
Applsci 15 07034 g007
Figure 8. Comparison of numerical simulation results with literature data.
Applsci 15 07034 g008
Figure 9. Instantaneous thrust coefficient curves for different flapping modes.
Applsci 15 07034 g009
Figure 10. Instantaneous lift coefficient curves for different flapping modes.
Applsci 15 07034 g010
Figure 11. Vorticity contour maps at different flapping frequencies for different flapping modes.
Applsci 15 07034 g011
Figure 12. Pumping efficiency curves for different flapping modes.
Applsci 15 07034 g012
Figure 13. Flow rate and head curves for different flapping modes.
Applsci 15 07034 g013
Figure 14. Vorticity contour maps at the channel outlet over one cycle.
Applsci 15 07034 g014
Figure 15. Vorticity contour maps for different outlet angles.
Applsci 15 07034 g015
Figure 16. Velocity contour maps at different outlet angles.
Applsci 15 07034 g016
Figure 17. Pumping efficiency and propulsion efficiency curves for different outlet angles.
Applsci 15 07034 g017
Figure 18. (a) Crank-slider drive mechanism; (b) Synchronous belt drive mechanism.
Applsci 15 07034 g018
Figure 19. Comparison between simulated and experimental flow velocities.
Applsci 15 07034 g019
Disclaimer/Publisher’s Note: The statements, opinions and data contained in all publications are solely those of the individual author(s) and contributor(s) and not of MDPI and/or the editor(s). MDPI and/or the editor(s) disclaim responsibility for any injury to people or property resulting from any ideas, methods, instructions or products referred to in the content.

