Article

Prediction of Unconfined Compressive Strength in Cement-Treated Soils: A Machine Learning Approach

by
Iancu-Bogdan Teodoru
1,*,
Zakaria Owusu-Yeboah
1,
Mircea Aniculăesi
1,
Andreea Vasilica Dascălu
1,
Florian Hörtkorn
2,
Alessia Amelio
3 and
Irina Lungu
1
1
Faculty of Civil Engineering and Building Services, Technical University Gheorghe Asachi of Iasi, 700050 Iasi, Romania
2
Faculty of Architecture and Civil Engineering, University of Applied Sciences, 76012 Karlsruhe, Germany
3
Department InGeo, University “G. d’Annunzio” Chieti-Pescara, 65127 Pescara, Italy
*
Author to whom correspondence should be addressed.
Appl. Sci. 2025, 15(13), 7022; https://doi.org/10.3390/app15137022
Submission received: 7 May 2025 / Revised: 18 June 2025 / Accepted: 19 June 2025 / Published: 22 June 2025
(This article belongs to the Section Civil Engineering)

Abstract

Featured Application

This work provides a practical, data-driven tool for rapidly predicting the strength of cement-treated soils, supporting efficient design and quality control in geotechnical engineering projects.

Abstract

This study integrates systematic laboratory testing with advanced machine learning techniques to predict the unconfined compressive strength (UCS) of cement-treated clayey silt from northwestern Iași, Romania. Laboratory experiments generated 185 UCS measurements, examining the effects of cement content, curing period, and compaction velocity on strength development. Fourteen regression algorithms were initially screened, with the top three performers subsequently evaluated using nested cross-validation and Bayesian hyperparameter optimization via the Optuna framework. Correlation analysis identified cement content as the primary factor, with curing period as moderately influential and compaction rate having minimal impact when target density was achieved. Random Forest emerged as the optimal algorithm, providing robust and accurate UCS predictions. Beyond standard predictions, a two-stage uncertainty quantification system was implemented, allowing for both central estimates and reliable confidence intervals. SHAP analysis confirmed the dominant roles of cement content and curing period and enabled mechanistic interpretation of parameter contributions. The complete predictive system is available as a public web application, enabling geotechnical engineers to obtain rapid UCS predictions with quantified uncertainty, supporting efficient ground improvement design and risk assessment.

1. Introduction

Contemporary urbanization and industrialization have profoundly impacted the field of geotechnical engineering, introducing new and complex challenges for infrastructure development [1,2,3]. As cities continue to expand, sites with naturally favorable soil conditions are becoming increasingly rare. Engineers are therefore often required to design and build on marginal or weak soils whose engineering properties must be improved to make them suitable for civil engineering applications [4].
This reality has transformed ground improvement techniques from occasional solutions into essential components of contemporary geotechnical practice. Among the various ground improvement technologies available, e.g., mechanical and thermal stabilization, grouting, freezing, drainage, preloading etc., chemical additive-based stabilization has emerged as one of the most versatile and cost-effective approaches for treating fine-grained soils with inadequate engineering properties [5,6,7]. One widely adopted method of chemical stabilization consists in mixing soil with Portland cement and water to produce soil–cement, a composite material whose properties are tailored by adjusting the proportions of its constituents [8,9,10]. The resulting mixture is subsequently compacted to achieve the required density and engineering performance.
Cement stabilization offers distinct advantages that explain its widespread adoption in geotechnical practice. First, it demonstrates remarkable versatility, effectively treating diverse soil types from soft clays to granular materials [6,8,11]. Second, cement-treated soils exhibit rapid strength development, with significant improvements observable within days of treatment, enabling accelerated construction schedules [10,12,13,14]. Third, the long-term durability of cement-stabilized soils has been well documented, with many projects showing sustained performance over decades [5,15,16]. Fourth, compared to alternative ground improvement methods, cement stabilization often provides superior cost-effectiveness, particularly for large-area treatments [8]. These advantages have established cement stabilization as a preferred solution for applications ranging from pavement subgrades to embankment foundations and slope stabilization projects [17,18,19,20,21].
However, despite these well-documented advantages and widespread applications, the field still lacks a universally accepted dosage methodology based on rational criteria. Unlike concrete technology, where the water/cement ratio serves as a fundamental predictor of target strength [22], soil–cement design currently relies on empirical approaches. The soil–cement ratio is typically determined through extensive laboratory testing to identify the minimum cement content required to achieve desired target properties, often unconfined compressive strength (UCS) [9,11,15,17,23]. This empirical, trial-and-error process likely reflects the complex behavior of soil–cement, which is influenced by numerous interacting factors including soil physicochemical properties, mineralogy, organic content, cement type and dosage, as well as porosity and moisture at compaction [14,24].
Given that laboratory testing for cement-stabilized soil design is often time-consuming and resource-intensive, researchers have long sought more efficient alternatives for predicting UCS and other engineering properties. This need for efficiency has become increasingly urgent with growing environmental concerns regarding the substantial carbon footprint of cement production, which accounts for approximately 8% of global CO2 emissions [25], emphasizing the importance of optimized dosage strategies that minimize both material consumption and ecological impact. These efforts have resulted in numerous empirical relationships attempting to correlate UCS with various parameters such as cement content, water-to-cement ratio, curing time, soil plasticity indices, and compaction characteristics. Consoli et al. [22] demonstrated that the void/cement ratio, rather than the traditional water/cement ratio, provides the most appropriate parameter for assessing UCS in unsaturated soil–cement mixtures. Sharma and Singh [26] successfully developed multiple regression models incorporating eight independent parameters, achieving an R2 of 0.96 for UCS prediction. Yao et al. [27] evaluated cement-treated marine clay across a broad range of mix ratios and curing periods, establishing power function correlations for cement and water content effects, and developing a comprehensive strength-prediction model that incorporates clay type through the plasticity index. Miller et al. [28] investigated the time-dependent development of strength properties, establishing practical correlations for predicting UCS and resilient modulus as functions of curing time and basic soil properties. Ghanizadeh et al. [29] employed evolutionary polynomial regression (EPR) to develop predictive models for both the UCS and Young’s modulus of lime and cement stabilized clayey subgrade soil, achieving R2 values of 0.95–0.96 for cement-stabilized specimens. Carey and Howard [30] advanced this work by calibrating numerical relationships to both backcast and forecast mechanical properties of chemically stabilized soils, achieving prediction accuracies within 89–99% of actual UCS values.
While these empirical models provide valuable insights into the fundamental relationships governing strength development, they often exhibit limited predictive capability when applied beyond their development datasets. The inherent complexity of soil–cement interactions, characterized by non-linear relationships and interdependencies among multiple variables, frequently exceeds the modeling capacity of traditional empirical approaches [12,24,31]. This limitation has prompted the geotechnical community to explore more sophisticated computational methods, particularly machine learning (ML) techniques, which offer the potential to capture these complex, multi-dimensional relationships more effectively than conventional empirical models.
The adoption of machine learning approaches in geotechnical engineering has provided powerful new tools for capturing the complex, multi-dimensional relationships in soil behavior that traditional empirical models struggle to represent. While the fundamental mechanisms of soil–cement interaction remain unchanged, ML techniques offer unprecedented accuracy in predicting engineering properties by learning directly from experimental data patterns. Jeremiah et al. [32] presented a comprehensive review of artificial neural networks (ANNs) in predicting the geomechanical properties of stabilized clays, highlighting their robust handling of large, complex datasets and their superior accuracy for non-linear modeling tasks. This foundational work established that ML techniques could consistently outperform traditional regression models by capturing intricate patterns in data without requiring predetermined functional forms.
The successful application of machine learning in geotechnical engineering has encouraged researchers to explore a diverse range of algorithms for UCS prediction. Among neural network applications, Mozumder and Laskar [33] investigated the viability of ANN models for predicting the UCS of geopolymer-stabilized clays, demonstrating improved accuracy over multivariable regression and providing useful sensitivity analysis tools. Gunaydin et al. [34] established that ANNs can consistently outperform traditional regression models for UCS prediction, while Anysz and Narloch [35] and Mustafa et al. [36] each demonstrated that ANN models achieve high predictive accuracy and practical utility for stabilized and rammed earth mixes, facilitating the design of optimized and sustainable soil–cement compositions. Ngo et al. [37] compared Gradient Boosting, ANNs, and support vector machines (SVMs) for UCS prediction in cement-stabilized soils, identifying ANNs as delivering the highest accuracy.
Alternative ML techniques have also shown promising results. Mozumder et al. [38] applied Support Vector Regression (SVR) to model UCS in geopolymer-stabilized clays, showing that SVR can effectively capture non-linear parameter interactions and outperform traditional empirical models. Onyelowe et al. [39] evaluated multiple ensemble ML algorithms, including Gradient Boosting, k-nearest neighbors, SVM, and Random Forest, finding that Gradient Boosting and k-nearest neighbors achieved the highest accuracy for UCS prediction in cement- and lime-stabilized soils. Thapa and Ghani [40] proposed advanced ensemble and hybrid ML models, demonstrating that Extreme Gradient Boosting (XGBoost) can achieve R2 values up to 0.99 for UCS prediction in soft soils, underscoring the importance of selecting relevant input features.
Recent developments have pushed the boundaries further with deep learning and hybrid approaches. Chen et al. [41] explored deep learning methods—including convolutional neural networks (CNNs), long short-term memory networks (LSTM), and backpropagation neural networks (BPNNs)—trained on both real and synthetic data, showing that generative adversarial networks (WGAN) can significantly enhance model generalization for predicting UCS in geopolymer-stabilized soils. Ngo et al. [42] extended previous work by integrating SVR with metaheuristic algorithms, demonstrating that hybrid models (SVR-HGS, SVR-PSO) further improve predictive performance depending on input variables. Additionally, Khan et al. [12] pioneered the use of explainable AI (XAI) to rank the importance of strength-controlling factors in cement-treated soils and generate design charts for mix optimization, bridging the gap between black-box predictions and engineering understanding.
The superiority of ML approaches for this application stems from their ability to capture non-linear interactions between multiple variables simultaneously, learn from data patterns without predetermined functional forms, and adapt to local soil conditions through training on site-specific datasets. Studies by Pham et al. [43] and Kardani et al. [44] have shown that factors such as cement content, fine particle fraction, and dry density are critical for ANN-based UCS predictions in sandy and unsaturated cemented soils, respectively, and that evolutionary hybrid ML models efficiently capture complex non-linearities. These collective findings highlight a growing consensus that ML techniques not only improve the accuracy of UCS prediction for cement-treated soils but also provide valuable insights into the controlling mechanisms of soil strength development across diverse geotechnical applications.
Based on recent advances and ongoing challenges in the literature, this study addresses the effects of compaction energy, cement dosage, and their impact on strength development in stabilized soils. The influence of compaction velocity on UCS development is examined systematically, as this parameter is often overlooked in research, despite being important in practice. The experimental program varies compaction velocities (0.75–1.25 mm/min), cement contents (2.5–10%), and curing times (1–28 days). This approach covers a wide range of scenarios, from lightly stabilized subgrades to highly cemented deep mixing. In addition, we combine laboratory testing with modern machine learning techniques. The result is a predictive model, made publicly available, that allows rapid estimation of UCS without extensive laboratory work.
Unconfined compressive strength was chosen as the principal performance indicator for its practical advantages: ease of testing, reproducibility, cost-effectiveness, and its proven relevance in both geotechnical and concrete engineering. The UCS test is uniquely suited for monitoring the strength evolution of cemented soils, especially at higher cement dosages and extended curing periods, where conventional soil tests may become unreliable or insufficient [23,39,45,46].

2. Materials and Methods

2.1. Characterization of the Materials Used

2.1.1. Soil Samples

Soil samples were collected from a site in the Copou area of Iași, Romania, at depths of 1 to 2 m to capture variations in subsurface soil characteristics. To preserve in situ moisture levels, the samples were carefully retrieved as both monoliths and bagged specimens, promptly sealed in airtight containers to minimize moisture loss, and transported to the laboratory for analysis.
A comprehensive set of geotechnical tests was conducted to characterize the soil’s physical properties. Grain size distribution, determined through hydrometer analysis in compliance with STAS 1913/5-85 [47], revealed a composition dominated by silt (64%), followed by clay (27%) and sand (9%). Atterberg limit testing yielded a liquid limit (LL) of 36%, plastic limit (PL) of 24%, and plasticity index (PI) of 12%.
According to the current European standard EN ISO 14688-2:2018 [48], fine soils or fine fractions within coarse composite soils should be classified primarily based on their plasticity characteristics, using the Casagrande plasticity chart. In this case, the material would fall in the medium plasticity clay (ClM) region, albeit near the boundary with silt. However, the material exhibited characteristic silt behavior, including rapid disintegration in water and low cohesion when dry. These behavioral observations, combined with the predominant silt fraction (64%), led to the identification of the soil as clayey silt (clSi) according to EN ISO 14688-1:2018 [49]. Thus, while the plasticity-based classification places the soil within the clay category, its actual behavior and granulometric composition justify its identification as clayey silt.
Further laboratory assessments quantified the soil’s bulk unit weight ( γ bulk ) as 16.87 kN/m3 and moisture content (w) of 20.24%. The material had a void ratio (e) of 0.87 and a degree of saturation ( S r ) of 0.62, indicating slightly moist conditions. Compaction testing identified an optimum moisture content (OMC) of 14.9% and a maximum dry unit weight ( γ d , max . ) as 15.37 kN/m3, critical for evaluating its engineering behavior under densification.

2.1.2. Portland Cement (PC)

The soil was stabilized using a composite Portland cement (CEM II/B-M(S-LL) 42.5 R), in accordance with EN 197-1 [50], selected for its rapid strength development and proven efficacy in geotechnical applications. The hydration process of this cement forms rigid matrices that bind soil particles and enhance the mechanical properties of treated soils [51]. The cement comprises 65–79% clinker, 6–20% granulated blast furnace slag (S) and 6–20% limestone (LL) by mass [50]. Its chemical composition is characterized by 56.2% CaO, 19.8% SiO 2 , and 7.1% Al 2 O 3 , among other oxides [52]. These ensure that the PC has a minimum compressive strength of 42.5 MPa at 28 days, qualifying it as a high-early-strength cement (denoted by “R”). The inclusion of slag improves sulfate resistance and long-term durability by refining pore structures and mitigating deleterious expansive reactions [53,54], while limestone enhances particle packing and fresh-state workability [55]. In soil stabilization, these attributes contribute to increased load-bearing capacity, reduced plasticity and enhanced resistance to environmental degradation. However, successful application necessitates careful evaluation of site-specific variables, including soil mineralogy, organic content and curing regimes, to ensure compatibility and long-term performance [56]. Table 1 gives the detailed chemical composition of the PC.

2.2. Experimental Program

2.2.1. Sample Preparation

The soil specimens were prepared by oven-drying at a temperature of 105 °C, and subsequently milled and sieved. Using the dry unit weight ( γ d ) of 15.37 kN/m3 and optimum moisture content (OMC) of 14.9%, the samples were mixed thoroughly in airtight plastic bags to prevent moisture loss and to ensure proper hydration and bonding of the cement with the soil particles (Figure 1a).
The soil–cement mixtures were prepared using four different cement dosages (2.5%, 5%, 7.5%, and 10% by dry weight of soil). These mixtures were placed in stainless steel containers and compacted using a static compaction technique to form cylindrical samples (Figure 1c) for UCS testing. A controlled axial load was applied with a triaxial load frame to achieve the target density (Figure 1b). All samples were molded to a standard size of 3.8 cm in diameter and 7.6 cm in height. The cemented samples were compacted at three different velocities (0.75 mm/min, 1.0 mm/min, and 1.25 mm/min), while the non-cemented control samples were compacted at four velocities (0.5 mm/min, 0.75 mm/min, 1.0 mm/min, and 1.25 mm/min). Each molded sample was carefully extruded after compaction.
For cement-treated samples, a minimum of 9 specimens were prepared for each combination of cement content and curing period, with 3 replications for each compaction velocity. This resulted in at least 36 specimens for each cement percentage (across four curing periods), yielding a total of 171 cement-treated samples. Additionally, 14 samples without cement were prepared (at least 3 for each compaction velocity). The soil–cement samples were cured for periods of 1 day, 7 days, 14 days, and 28 days at a constant temperature of approximately 23 °C in a desiccator (Figure 1d). The detailed breakdown of sample configurations is presented in Table 2.

2.2.2. Testing Methodology

Each of the cured soil–cement cylindrical specimens was positioned on the lower plate of the unconfined compression testing apparatus, ensuring proper alignment to prevent eccentric loading. The lower plate was elevated until the specimen established full contact with the upper plate, guaranteeing uniform stress distribution during loading.
Axial load and displacement were recorded automatically via the machine’s integrated data acquisition system (Figure 2a). For specimens which exceeded the maximum axial capacity of 2.5 kN, manual proving ring and dial gauge instrumentation was employed (Figure 2b). Pre-test calibration procedures were performed to zero both the strain dial gauge and proving ring. A monotonic axial load was applied at a constant strain rate of 1.27 mm/min to evaluate the stress–strain response. Continuous monitoring of axial strain and corresponding stress values was conducted at 5 s intervals until test termination. Testing was terminated upon specimen failure (defined by visible macro-cracking or structural disintegration) or attainment of 20% vertical deformation, whichever occurred first (Figure 2c,d). Post-failure analysis included measurement of shear plane inclination relative to the horizontal plane to characterize failure mechanisms.

2.3. Machine Learning Methodology

The complex, non-linear relationship between cement stabilization parameters and unconfined compressive strength (UCS) makes machine learning (ML) ideal for predicting UCS in cement-treated soils [32,57]. Supervised regression algorithms were used to develop predictive models for UCS based on the experimental data collected in this study.
The comprehensive machine learning methodology implemented in this study follows a systematic four-phase approach designed to develop a robust uncertainty quantification (UQ) system for UCS prediction, as illustrated in Figure 3. This workflow begins with initial algorithm screening using a conventional train–test split to identify the most promising approaches, followed by rigorous evaluation through nested cross-validation with Bayesian hyperparameter optimization via Optuna (version 4.3.0). The methodology then transitions to a sophisticated two-stage training architecture where the optimal Random Forest model serves as the primary predictor while a dedicated uncertainty model learns to estimate prediction error magnitudes. This systematic progression from broad algorithm exploration to specialized uncertainty quantification ensures both high predictive accuracy and reliable confidence interval estimation, culminating in a deployed prediction system that provides engineers with both central UCS estimates and calibrated uncertainty bounds for informed decision-making in cement-stabilized soil applications.

2.3.1. Data Preprocessing and Feature Engineering

All available experimental data were used for model development, with no values excluded as outliers. A visual inspection using boxplots and descriptive statistics was performed [58,59], but no data points were identified as experimental errors or aberrant values. This approach was chosen to avoid bias and to ensure that the influence of all investigated parameters—including compaction velocity, even if small—would be represented in the model.
Standard data preprocessing steps were applied as needed for each algorithm, including feature scaling for distance-based and gradient-based methods. The main input features used for modeling were cement content, curing time, and compaction velocity. Other derived or composite features (such as cement/water ratio or porosity/cement ratio) were considered during preliminary testing, but models using the original input variables achieved similar or better predictive performance. As a result, all three primary variables were retained in the final modeling workflow.
Given the wide range of UCS values (157–5055 kPa) and the potential for heteroscedasticity in cement-stabilized soil data, logarithmic transformation of the target variable was investigated as a preprocessing option. Preliminary evaluation using nested cross-validation revealed that log transformation provided inconsistent benefits across algorithms: while Gradient Boosting showed marginal improvement, both Random Forest and XGBoost demonstrated slightly better performance without transformation. Since the primary objective was developing a robust uncertainty quantification system rather than maximizing point prediction accuracy for any single algorithm, the original UCS scale was retained to maintain interpretability and avoid the additional complexity of inverse transformation in the final prediction system.

2.3.2. Algorithm Selection and Initial Screening

A diverse range of regression algorithms was initially evaluated to identify approaches best suited for UCS prediction. This comprehensive selection included traditional linear models, Non-Linear Regression techniques, and ensemble methods:
Linear Methods: Linear Regression, Ridge Regression, Lasso Regression, and Elastic Net were included to establish baseline performance and evaluate whether linear relationships could adequately capture UCS behavior.
Linear Regression models capture relationships between a dependent variable y and one or more independent variables X. A Multiple Linear Regression model takes the form y i = β 0 + β 1 X i 1 + β 2 X i 2 + . . . + β p X i p + ϵ i , i = 1 , . . . , n , where n is the number of instances, β k are coefficients, X i j represents the ith instance of the jth predictor, and ϵ i is the error term [60]. For simple Linear Regression ( p = 1 ), the least squares method typically determines optimal coefficients.
Ridge Regression extends Linear Regression by adding an L2 regularization term to the cost function, penalizing large coefficients to prevent overfitting. This approach is particularly effective with highly correlated independent variables [61]. In contrast, Lasso Regression employs L1 regularization, adding a penalty proportional to the absolute value of coefficients, which can reduce some coefficients to zero, effectively performing feature selection [62]. Elastic Net combines both Ridge and Lasso approaches, balancing feature selection and coefficient shrinkage by incorporating both penalty terms [63].
Tree-Based Methods: Decision Tree, Random Forest, Gradient Boosting, XGBoost, LightGBM, and CatBoost were selected for their ability to model complex non-linear relationships and feature interactions without requiring explicit feature engineering.
Regression Decision Trees create a hierarchical structure by recursively partitioning data based on feature values [64]. Each internal node represents a feature-based decision, each branch an outcome, and each leaf node a predicted value. Training involves (i) selecting features and thresholds that minimize target variable variance, (ii) splitting datasets accordingly, (iii) continuing until stopping criteria are reached such as minimum instances per leaf, and (iv) optionally pruning branches that contribute minimally to predictive power.
Random Forest builds upon Decision Trees by constructing multiple trees through bootstrap aggregation (bagging) and training each on a random subset of data [65]. To enhance diversity, each tree considers only a random subset of features at each split. Predictions from all trees are averaged, reducing overfitting while improving accuracy and resilience compared to a single Decision Tree.
Gradient Boosting creates sequential trees where each tree corrects errors made by previous trees [66]. By optimizing along the gradient descent, it progressively reduces overall error. XGBoost enhances the Gradient Boosting framework with regularization strategies and parallel tree construction for improved speed and performance [67]. LightGBM improves efficiency through leaf-wise tree growth rather than level-wise growth, employing techniques like Exclusive Feature Bundling and Gradient-Based One-Side Sampling for faster training with large datasets [68]. CatBoost optimizes categorical data handling through permutation-driven approaches, reducing extensive preprocessing requirements while supporting GPU training and providing model analysis tools [69].
Other Non-Linear Methods: Support Vector Regression (SVR) with radial basis function (RBF) kernel, k-nearest neighbors (KNN), Gaussian Process Regression, and AdaBoost were included to explore alternative non-linear modeling approaches.
SVR extends Support Vector Machine concepts to predict continuous target values [70]. It aims to find a function that approximates target values within a specified tolerance margin while minimizing model complexity. Kernel functions—including linear, polynomial, and RBF—transform input features into higher-dimensional spaces where linear separation becomes feasible.
KNN is a nonparametric approach that determines the k nearest data instances to a test point using distance metrics, typically Euclidean distance [71]. For regression tasks, it predicts target values by averaging neighbors’ values, making it conceptually simple yet effective for many applications.
Gaussian Process Regression offers a Bayesian, nonparametric technique that produces a distribution over potential functions fitting the data [72]. It defines a prior over functions using a Gaussian process, then updates with observed data to create the posterior distribution. The covariance function (kernel) characterizes relationships between data points, while the mean function is often set to zero.
AdaBoost combines multiple weak classifiers to form a strong classifier [73]. It iteratively focuses on instances misclassified by previous classifiers by adjusting their weights. This adaptive approach emphasizes challenging cases, continuing until reaching a specified number of weak classifiers or achieving an acceptable error rate.
This diverse algorithm portfolio was designed to thoroughly explore the modeling capabilities across fundamentally different mathematical frameworks [74], ensuring that the most appropriate approach for this specific prediction task could be identified. Based on the initial screening results, the three best-performing algorithms were selected for comprehensive hyperparameter optimization and rigorous evaluation through nested cross-validation, as detailed in subsequent sections.

2.3.3. Nested Cross-Validation Framework

Given the relatively small dataset and the considerable dispersion of UCS values, a simple train–test split was deemed insufficient for estimating model performance reliably [75,76,77]. A nested cross-validation (NCV) approach was therefore employed to serve a dual critical purpose: providing unbiased estimates of model generalization performance while simultaneously generating the prediction error data necessary for uncertainty quantification.
The NCV procedure involves two nested loops with fundamentally different objectives that work synergistically to support the uncertainty quantification framework. The outer loop partitions the dataset into distinct training and test sets, ensuring that the evaluation of the final model is conducted on unseen data. Crucially, these outer fold predictions also serve as the foundation for training the uncertainty model, as each data point appears exactly once as a validation sample, providing clean out-of-sample predictions and their corresponding absolute errors.
The inner loop further subdivides the training data to optimize model parameters and select the best-performing model configuration within each outer fold. Hyperparameter optimization is essential for configuring machine learning algorithms, with approaches ranging from simple grid search to advanced techniques like Bayesian optimization or Hyperband [78]. This separation of model tuning and performance evaluation is essential both for avoiding selection bias in performance estimates [79,80,81,82,83] and for ensuring that the prediction errors used for uncertainty quantification are genuinely representative of model behavior on unseen data.
This dual-purpose design ensures that hyperparameter tuning is conducted independently within inner folds, while both performance estimation and uncertainty training data generation are carried out on separate outer folds. This approach prevents data leakage in both the primary prediction task and the uncertainty quantification task, ensuring that the final system can reliably estimate both central predictions and confidence bounds for new soil–cement combinations.
The NCV procedure was implemented with a 5-fold outer cross-validation loop for performance estimation and uncertainty data generation, combined with a 5-fold inner cross-validation loop for hyperparameter tuning. This nested approach allowed for comprehensive evaluation of each model while generating a complete set of 185 out-of-sample predictions and their associated prediction errors, forming the training dataset for the uncertainty quantification model.

2.3.4. Hyperparameter Optimization Strategy

To maximize model performance, an advanced hyperparameter optimization strategy was implemented using the Optuna framework [84] for the top-performing algorithms identified during the initial screening phase. This optimization focuses specifically on maximizing the accuracy of central UCS predictions, which serves as the foundation for the subsequent uncertainty quantification framework. Unlike traditional grid search or random search methods, Optuna employs a Bayesian optimization approach that adaptively explores the hyperparameter space based on previous trial results.
The optimization strategy recognizes the hierarchical nature of the two-stage modeling approach: optimal performance in uncertainty quantification depends fundamentally on achieving the highest possible accuracy in the primary prediction model. Therefore, hyperparameter optimization concentrates exclusively on maximizing central prediction performance, with R2 score serving as the primary optimization objective.
For each algorithm in the refined candidate set, custom search spaces were defined based on their specific hyperparameters and their known influence on model performance for regression tasks. Random Forest optimization focused on the number of estimators, maximum tree depth, and node splitting criteria, as these parameters significantly impact the model’s ability to balance bias and variance in small-to-medium datasets. Gradient Boosting optimization centered around learning rate, maximum tree depth, subsampling rate, and the number of estimators, which govern the model’s capacity to learn from sequential errors without overfitting. XGBoost optimization explored additional parameters including minimum child weight and column sampling rates to optimize feature selection during training.
The optimization process incorporated efficiency-enhancing features including MedianPruner for early termination of unpromising trials, balanced exploration through 50 trials per fold with computational time limits, and systematic tracking of performance across different hyperparameter configurations. This comprehensive approach ensured that the selected primary model achieved optimal accuracy, providing the strongest possible foundation for the uncertainty quantification framework.
Importantly, the uncertainty model employs a separate, simpler hyperparameter configuration optimized specifically for error prediction rather than primary UCS prediction. This separation allows each component of the two-stage system to focus on its specialized task without compromising overall system performance.

2.3.5. Model Evaluation Metrics

Multiple complementary metrics were employed to comprehensively evaluate model performance across different dimensions [85,86,87]:
The coefficient of determination (R2) measures the proportion of variance in UCS values that is predictable from the input variables. R2 values range from 0 to 1, with higher values indicating better model fit. For geotechnical applications, R2 values above 0.9 generally indicate good predictive capability [88]. While R2 provides an intuitive measure of overall fit quality, it can be sensitive to dataset characteristics and may not fully capture prediction accuracy.
Mean squared error (MSE) measures the average squared difference between predicted and actual UCS values. This metric was used as the primary optimization objective during hyperparameter tuning.
Root mean square error (RMSE) quantifies the average magnitude of prediction errors in the same units as the target variable (kPa). By squaring errors before averaging, RMSE gives higher weight to larger errors, making it particularly relevant for engineering applications where larger deviations may have significant consequences.
Mean absolute error (MAE) represents the average absolute difference between predicted and actual UCS values (kPa), providing a more intuitive measure of typical error magnitude that is less sensitive to outliers than RMSE.
Mean absolute percentage error (MAPE) expresses errors as percentages relative to actual values, offering a dimensionless measure of prediction accuracy that facilitates interpretation across different scales.
Explained variance score (EVS) measures how well the model accounts for the variation in the data. Differences between R2 and EVS can indicate the presence of systematic bias in predictions.
Maximum error captures the worst-case prediction scenario, which is particularly relevant for engineering applications where safety margins must account for potential prediction inaccuracies.
Median absolute error (MedAE) measures the median of all absolute differences between predicted and actual values. As a robust statistic, it provides insight into typical prediction error magnitude while being less influenced by outliers than MAE.
Coefficient of variation of RMSE (CV RMSE) normalizes the RMSE by the mean of observed values, expressed as a percentage. This relative error metric facilitates comparison across different scales and enhances interpretability in engineering contexts. Values below 10% generally indicate good performance for engineering applications.
These diverse metrics enable comprehensive evaluation of model performance beyond single-dimensional assessment, facilitating the selection of models that balance different aspects of prediction quality relevant to geotechnical applications.

2.3.6. Uncertainty Quantification Framework

Rather than developing traditional point prediction models, this study implements an advanced uncertainty quantification system that provides both central UCS estimates and calibrated confidence intervals. This methodological evolution recognizes that in geotechnical engineering applications, understanding prediction uncertainty is as critical as the prediction itself for informed decision-making and risk assessment [89,90].
Standard bootstrap aggregating (bagging) was initially investigated to quantify uncertainty via prediction intervals [91]. However, the empirical coverage of bootstrap-based intervals was systematically below the expected confidence levels, likely due to the limited dataset size. Bootstrap methods rely on the assumption that repeated sampling from the observed data adequately represents the underlying population distribution, but this assumption becomes problematic when the available dataset is relatively small compared to the complexity of the underlying physical processes [92]. To address this limitation, a more robust approach was implemented that leverages the systematic error patterns captured during nested cross-validation (NCV).
The uncertainty quantification framework employs a sophisticated two-stage architecture that separates the prediction task from uncertainty estimation, allowing independent optimization of both components. The first stage develops the highest-accuracy model for central UCS predictions using the optimal algorithm and hyperparameters identified through the nested cross-validation process. The second stage constructs a dedicated uncertainty model that learns to predict the magnitude of prediction errors based on both input features and primary model outputs.
This architectural separation offers significant advantages over traditional ensemble approaches such as bagging, which attempt to estimate uncertainty through variance across multiple models [93]. By dedicating a specialized model to uncertainty estimation, the framework can focus specifically on identifying patterns in prediction confidence without compromising central prediction accuracy. The two-stage approach also enables the uncertainty model to learn from the primary model’s behavior patterns, creating a more informed uncertainty estimation process.
The uncertainty model training leverages the comprehensive prediction error dataset generated during nested cross-validation. Since each data point serves as a validation sample exactly once across the outer folds, the NCV process produces a complete set of out-of-sample predictions and their corresponding absolute errors for the entire dataset [94]. These cross-validation errors provide an unbiased representation of model uncertainty across different regions of the input space, forming ideal training data for the uncertainty prediction task.
The uncertainty model learns to predict these error magnitudes using an augmented feature set that combines the original input variables (cement content, curing period, compaction rate) with the primary model’s predictions. This feature augmentation enables the uncertainty model to capture heteroscedastic patterns—the observation that prediction uncertainty often varies with prediction magnitude—commonly encountered in geotechnical datasets where higher strength values may exhibit greater absolute variability.
The uncertainty estimation employs a Random Forest regressor specifically configured for error prediction rather than primary value prediction. Random Forest was selected for uncertainty modeling due to its robust handling of small datasets, natural resistance to overfitting, and ability to capture complex non-linear relationships without extensive hyperparameter tuning. The uncertainty model configuration includes 200 estimators with a maximum depth of 8, parameters chosen to balance prediction accuracy with computational efficiency and stability.
Unlike the primary model which underwent extensive hyperparameter optimization, the uncertainty model uses a simplified but robust parameter set specifically designed for error pattern recognition. This approach reflects the different nature of the uncertainty prediction task, where stability and calibration quality are prioritized over maximizing traditional accuracy metrics.
The final uncertainty quantification system combines both trained models to generate comprehensive predictions for new soil–cement combinations. Central predictions are produced by the optimized primary model, while uncertainty estimates are generated by the specialized uncertainty model. Confidence intervals are constructed assuming a Gaussian distribution around central predictions, with interval widths determined by scaling the predicted uncertainty by appropriate statistical multipliers (e.g., 1.645 for 90% confidence) [58].
The calibration quality of these intervals is rigorously validated using the cross-validation predictions to ensure that predicted confidence levels match observed coverage rates. Well-calibrated intervals demonstrate coverage percentages that closely match theoretical expectations—for instance, 90% confidence intervals should contain approximately 90% of true values.
This comprehensive uncertainty quantification framework enables engineers to make informed decisions based not only on predicted UCS values but also on quantified confidence in those predictions, supporting more robust risk assessment and design optimization in cement-stabilized soil applications.

3. Results and Discussion

3.1. Experimental Test Results

3.1.1. Overview of UCS Measurements

The experimental program generated a comprehensive dataset of 185 unconfined compressive strength (UCS) measurements (171 from cement-treated samples and 14 from control samples without cement). Statistical analysis (Figure 4) of these measurements revealed considerable variation in strength values, with UCS ranging from 157.47 kPa to 5054.61 kPa across all combinations of cement content, curing period, and compaction rate. The mean UCS value was 2169.93 kPa with a standard deviation of 1289.17 kPa, indicating significant dispersion across the experimental conditions. This variability underscores the complex nature of strength development in cement-stabilized soils and highlights the need for sophisticated predictive approaches that can capture these intricate patterns.
The quartile distribution further illustrates this dispersion, with the first quartile (Q1) at 989.44 kPa, the median at 2135.62 kPa, and the third quartile (Q3) at 3138.21 kPa. This relatively symmetrical distribution around the median suggests that the experimental design adequately captured the central tendency of UCS development. The interquartile range (IQR) of 2148.77 kPa demonstrates the substantial variability in strength outcomes, reflecting the complex interplay between cement content and curing period in strength development.
The wide range of UCS values observed in the experimental data (4897.15 kPa from minimum to maximum) reflects the substantial influence of the investigated parameters on strength development. The lowest UCS values were associated with untreated soil samples (0% cement), while the highest values were recorded for specimens with 10% cement content cured for 28 days. This range spans typical strength requirements for various geotechnical applications, from temporary works requiring minimal strength enhancement to permanent structures demanding substantial load-bearing capacity.

3.1.2. Initial Assessment of Key Factors Affecting UCS

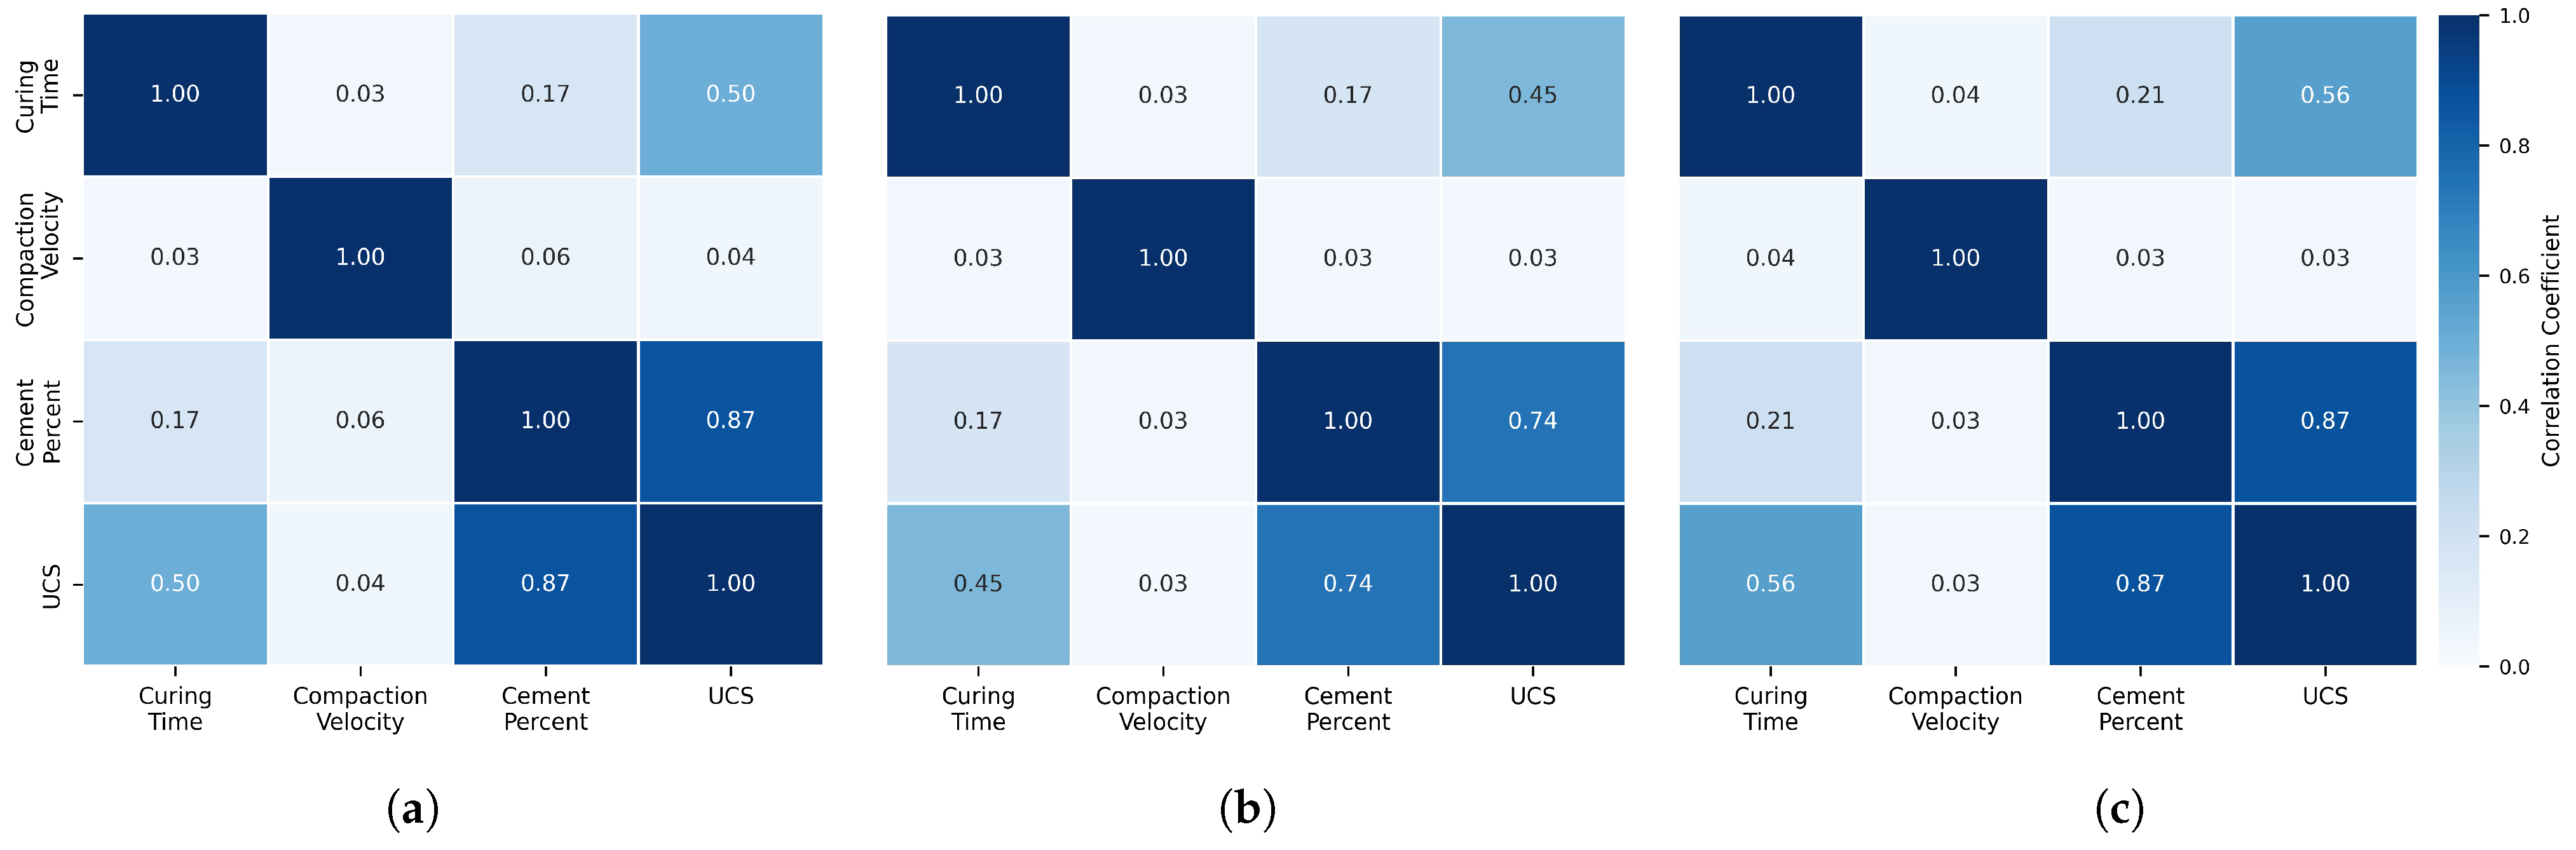
To comprehensively assess the dominant factors governing UCS development, correlation analysis was performed using three complementary methods: Pearson, Kendall, and Spearman coefficients. While Pearson’s coefficient measures linear relationships, Kendall and Spearman capture monotonic but potentially non-linear relationships between variables [95]. Figure 5 presents heat maps of correlation coefficients that quantify the relationships between UCS and the three experimental parameters.
All three correlation methods consistently identified cement content as the primary factor influencing UCS, with strong positive correlations (Pearson: 0.87; Kendall: 0.74; Spearman: 0.87). The slightly lower Kendall coefficient suggests some non-linearity in this relationship, supporting our observation of accelerating strength gains at higher cement percentages. This finding aligns with established geotechnical engineering principles, which recognize cement dosage as the primary design parameter for soil stabilization projects (e.g., [27,96,97,98]).
Curing period demonstrated moderate positive correlations with UCS across all methods (Pearson: 0.50; Kendall: 0.45; Spearman: 0.56), reflecting the time-dependent nature of cement hydration and strength development. The higher Spearman coefficient compared to Pearson suggests that the relationship between curing time and UCS may follow a monotonic but not strictly linear pattern. This correlation confirms that while significant strength gains occur during the initial curing period, continued strength enhancement takes place over extended timeframes as cementation processes progress.
Notably, compaction rate exhibited negligible correlation with UCS across all methods (Pearson: 0.04; Kendall: 0.03; Spearman: 0.03), suggesting that within the range investigated (0.75–1.25 mm/min), variations in compaction velocity have minimal impact on the ultimate strength development of cement-stabilized soil. This finding has important practical implications for field application, indicating that precise control of compaction rate may be less critical than ensuring adequate cement content and sufficient curing time.
The correlation patterns observed provide valuable guidance for both practical applications and predictive modeling. From an engineering perspective, these results suggest that design efforts should primarily focus on optimizing cement content and ensuring sufficient curing duration, rather than implementing stringent controls on compaction procedures. For modeling purposes, the strong correlation between cement content and UCS, coupled with the moderate correlation with curing period, indicates that these two variables should be prioritized in developing predictive algorithms for strength estimation.

3.1.3. Effect of Cement Content on Strength Development

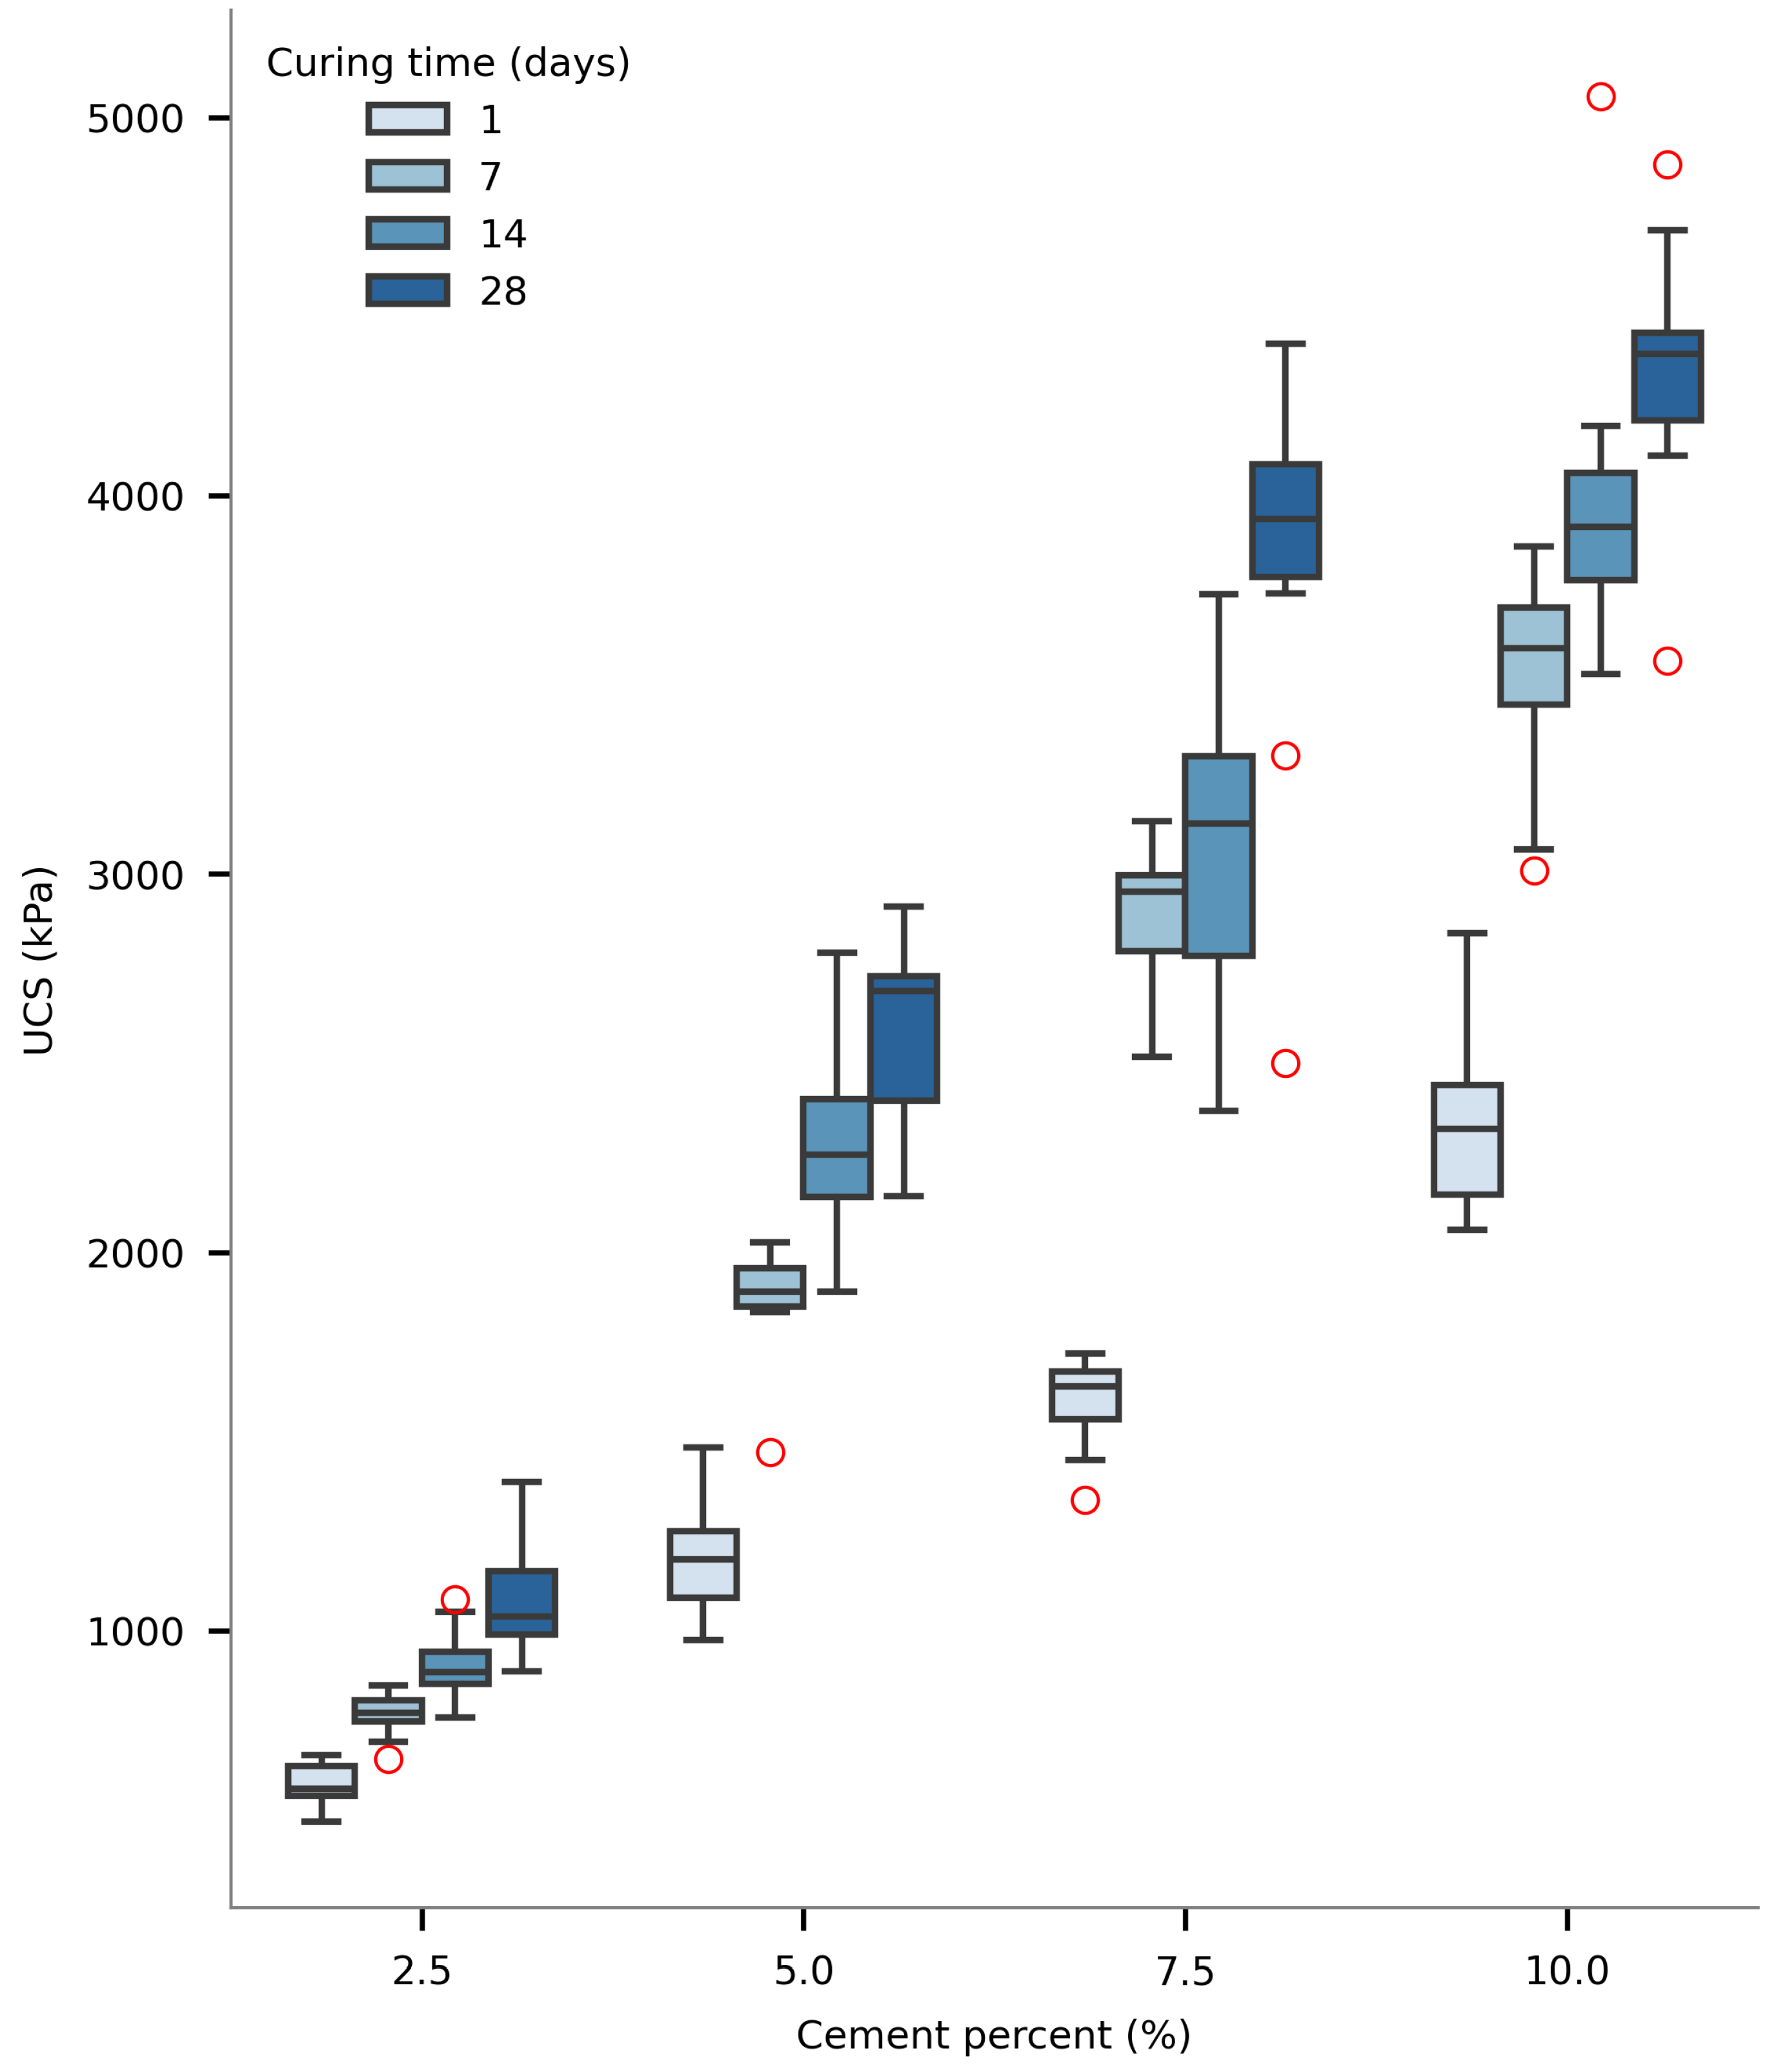
The influence of cement content on UCS was further examined through detailed analysis of strength measurements across different cement percentages. Figure 6 presents a consolidated boxplot analysis of UCS values grouped by cement content and curing period.
The results demonstrate a clear monotonic increase in UCS with increasing cement content across all curing periods. Specimens prepared with 2.5% cement exhibited median UCS values of approximately 1000 kPa after 28 days of curing, while those with 10% cement achieved median strengths of approximately 4500 kPa over the same curing period—more than a fourfold increase. This substantial strength enhancement can be attributed to the increased formation of cementitious hydration products that bind soil particles and create a more rigid soil matrix.
A noteworthy observation is the accelerating rate of strength gain with increasing cement content. The experimental data reveals that the relationship between cement content and UCS is not strictly linear but exhibits a positive second-order component. The incremental strength increase when moving from 2.5% to 5% cement was less pronounced than the increase observed when transitioning from 7.5% to 10% cement. This non-linearity suggests that beyond a certain threshold, additional cement provides disproportionately greater strength benefits, likely due to the formation of a more continuous cementitious network throughout the soil matrix.
The physical mechanism behind this behavior can be understood through the fundamental principles of soil–cement interaction. At low cement contents (2.5%), the cementitious products primarily strengthen individual contact points between soil particles. As cement content increases to intermediate levels (5–7.5%), these localized cementation zones begin to overlap, creating stronger particle clusters. At higher cement contents (10%), a more continuous cementitious matrix forms, dramatically enhancing the soil’s resistance to deformation and failure.
Additionally, the interquartile range (IQR) of UCS values progressively expanded at higher cement percentages, particularly at 7.5% and 10%. This increased variability indicates that at higher cement contents, the stabilized soil becomes more sensitive to other factors such as mixing homogeneity, moisture distribution, and microstructural development during curing. From a practical perspective, this finding suggests that while higher cement contents yield greater strengths, they may also require more stringent quality control measures during mixing and placement to ensure consistent performance.
For geotechnical applications with moderate strength requirements ( UCS 2000 kPa ), cement contents in the range of 5–7.5% appear to offer an optimal balance between strength enhancement and economic considerations. For applications demanding higher strength levels, the 10% cement content consistently delivered UCS values exceeding 3000 kPa after 14 days of curing, making it suitable for more demanding applications. These recommendations are consistent with typical values reported in the literature for geotechnical applications, as well as with international practice [23,39,45,46].

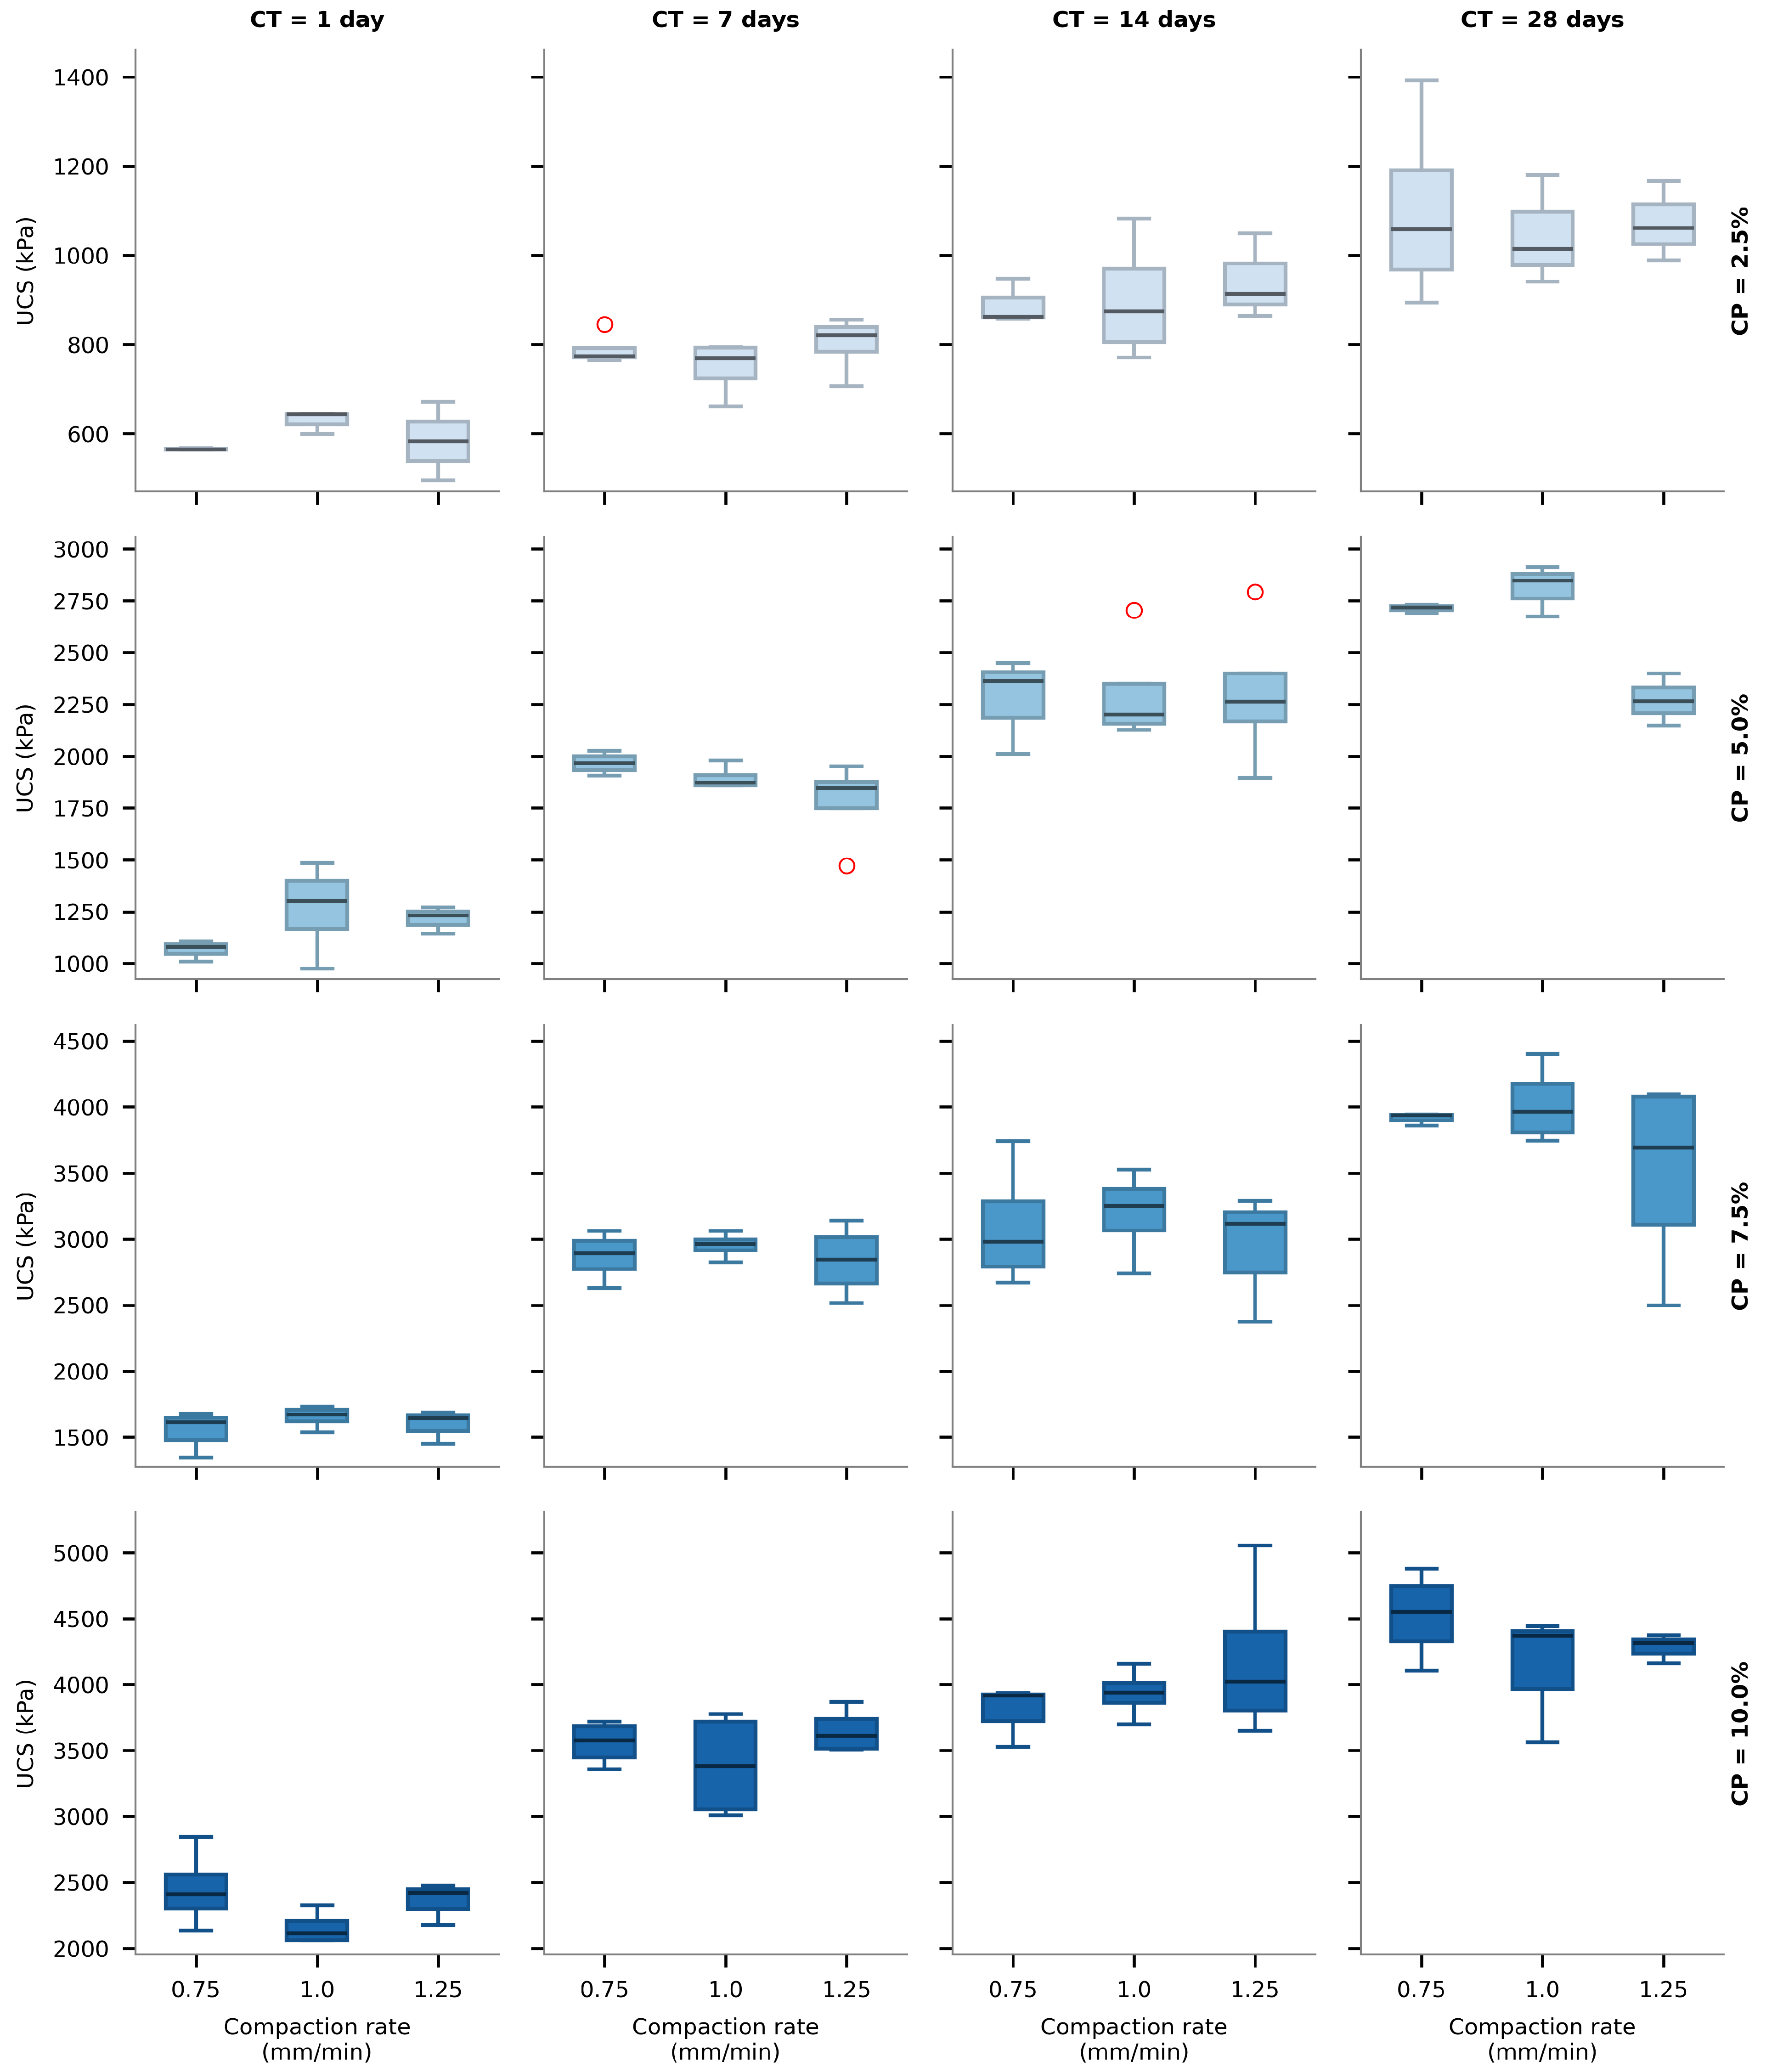
3.1.4. Effect of Compaction Rate

The effect of compaction rate on UCS development was examined by comparing median UCS values across the three different compaction velocities (0.75, 1.0, and 1.25 mm/min) for each combination of cement content and curing period. Figure 7 presents a multi-panel boxplot visualization of these comparisons, with each panel representing a specific combination of cement content and curing time.
The detailed analysis of median UCS values across different compaction rates reveals interesting patterns. While the impact of compaction rate appears less dominant than cement content and curing period, the relative differences between compaction rates were not entirely negligible for certain combinations. For most cement content and curing time combinations, the relative differences between median UCS values at different compaction rates ranged from approximately 1% to 9%. However, several combinations exhibited more substantial variations.
For specimens with 5% cement after 1 day of curing, the relative difference between compaction rates of 0.75 mm/min and 1.0 mm/min reached approximately 20%, with the higher compaction rate producing greater strength. Similarly, for 5% cement specimens cured for 28 days, the difference between compaction rates of 1.0 mm/min and 1.25 mm/min was also around 20%, though in this case, the lower compaction rate yielded higher strength. For 10% cement specimens after 1 day of curing, the difference between compaction rates of 1.0 mm/min and 1.25 mm/min was roughly 15%, with the higher compaction rate producing greater strength.
These more pronounced differences were primarily observed at either very early curing times (1 day) or relatively high cement contents (10%), suggesting that compaction rate may have a more noticeable effect under specific conditions. At early curing times, the soil–cement mixture is still developing its initial structure, and the rate of compaction might influence particle rearrangement and initial cement hydration. For higher cement contents, the greater quantity of cementitious material may make the mixture more sensitive to compaction procedures.
However, it is important to note that no consistent pattern emerged across all combinations. The relationship between compaction rate and UCS did not follow a uniform trend, with some cases showing higher strength at increased compaction rates and others showing the opposite. For many combinations, particularly at intermediate curing periods (7 to 14 days), the differences were relatively modest (typically below 5%).
These observations should be interpreted within the specific context of this experimental program, which utilized a particular soil type and a relatively narrow range of compaction velocities. Furthermore, all specimens were compacted to the same target density regardless of compaction rate, which likely contributed to the generally modest differences in strength outcomes for most combinations.
From a practical perspective, these findings suggest that while compaction rate may not be the dominant factor governing UCS development in cement-stabilized soils, it can still influence strength characteristics under specific conditions, particularly during early curing or at higher cement contents.
For routine applications with intermediate cement contents (5–7.5%) and standard curing periods (7–28 days), the influence of compaction rate variations within the studied range appears generally limited (typically less than 7% difference).
For predictive modeling purposes, these results indicate that while cement content and curing period should remain the primary variables, incorporating compaction rate as a secondary factor might enhance model accuracy for certain specific combinations, particularly those involving high cement contents or early strength assessment.

3.2. Model Performance Comparison

After establishing the experimental relationships between soil stabilization parameters and UCS through laboratory testing, predictive models were developed to estimate strength development without the need for extensive physical testing. This section presents the performance analysis of various machine learning algorithms and the detailed evaluation of the final selected model.
Following the experimental characterization of cement-treated soil behavior, this section presents the development and evaluation of machine learning models for predicting unconfined compressive strength. These predictive models aim to provide reliable UCS estimates based on cement content, curing period, and compaction rate parameters, reducing the need for extensive laboratory testing in future applications. The analysis begins with an initial screening of various algorithms, followed by rigorous validation of the most promising candidates, and concludes with a detailed assessment of the optimal model’s performance.

3.2.1. Initial Model Screening Results

The initial screening phase evaluated 14 regression algorithms using a conventional train–test split. The dataset was divided into 80% training data and 20% testing data, allowing for a straightforward evaluation of model accuracy before implementing more advanced techniques such as cross-validation and hyperparameter tuning. Table 3 presents the performance metrics of each model in terms of mean squared error (MSE), root mean squared error (RMSE), mean absolute error (MAE), and R-squared (R2) score.
The results revealed distinct patterns in model performance. Linear models (Linear Regression, Ridge, Lasso, and Elastic Net) achieved moderate R2 values ranging from 0.76 to 0.84, with RMSE values between 479 and 588 kPa. The relatively limited performance of these models indicates that UCS development in cement-stabilized soils follows non-linear patterns that cannot be adequately captured by linear relationships.
In contrast, tree-based ensemble methods demonstrated superior predictive capability. Gradient Boosting achieved the highest accuracy with an R2 of 0.96 and RMSE of 253 kPa, followed closely by Random Forest (R2 = 0.95; RMSE = 265 kPa) and LightGBM (R2 = 0.95; RMSE = 270 kPa). These algorithms effectively captured the complex, non-linear interactions between cement content, curing period, and UCS. Support Vector Regression (SVR) with an RBF kernel performed notably poorly (R2 = 0.02), suggesting that the chosen kernel configuration was unsuitable for this particular prediction task. Other algorithms, including Decision Tree, XGBoost, CatBoost, KNN, Gaussian Process, and AdaBoost, demonstrated good performance with R2 values around 0.94, but did not match the accuracy of the top-performing ensemble methods.
The substantial performance gap between linear and tree-based models ( Δ R 2 0.1 ) supports the hypothesis that UCS development in cement-treated soils is governed by complex, non-linear processes that cannot be adequately captured by simple parametric relationships. Similar non-linear dependencies have been documented in previous research on various geotechnical properties [99,100,101,102,103].

3.2.2. Nested Cross-Validation Results

Based on the initial screening results, the three top-performing algorithms (Random Forest, Gradient Boosting, and XGBoost) were selected for comprehensive hyperparameter optimization and rigorous evaluation through nested cross-validation with Bayesian hyperparameter optimization [84]. This rigorous evaluation approach ensured unbiased performance estimates while simultaneously generating the prediction error data essential for the subsequent uncertainty quantification framework.
Table 4 presents the cross-validated performance metrics for all three optimized algorithms, revealing the subtle but important differences in their behavior across the complete range of cement stabilization conditions.
The performance metrics reveal that all three ensemble methods achieved excellent predictive capability, with R2 values exceeding 0.94—a threshold generally considered indicative of strong predictive performance in geotechnical engineering applications [88,104]. However, the subtle differences in their error patterns provide important insights into their suitability for different aspects of the modeling framework.
Gradient Boosting achieved the highest mean R2 (0.9488 ± 0.0131) and the lowest RMSE (286.23 ± 43.45 kPa), demonstrating superior central prediction accuracy. This performance advantage reflects the algorithm’s sequential learning approach, which effectively captures complex non-linear relationships by iteratively correcting prediction errors. The RMSE values across all models represent approximately 13% of the mean UCS (2169.93 kPa), indicating strong practical accuracy for engineering applications.
Random Forest demonstrated particularly balanced performance characteristics that proved crucial for the uncertainty quantification framework. While achieving a marginally lower R2 (0.9471 ± 0.0120) than Gradient Boosting, Random Forest exhibited the most stable performance across validation folds, evidenced by the lowest standard deviation in R2 scores. More significantly, Random Forest achieved both the lowest MAE (186.17 ± 19.82 kPa) and the most consistent MAPE (8.67% ± 0.87%), indicating superior average accuracy and minimal relative error variability across the diverse range of UCS values in the dataset.
XGBoost provided intermediate performance with an R2 of 0.9467 ± 0.0171, but showed the highest variability across folds (largest standard deviations across most metrics), suggesting greater sensitivity to specific data characteristics. This variability, while not necessarily detrimental for point predictions, can complicate the development of well-calibrated uncertainty estimates.
The cross-validation results confirmed that all three tree-based ensemble methods could effectively capture the complex relationships governing UCS development in cement-stabilized soil. The consistency across different validation folds suggested that these models would maintain reliable performance when applied to new, unseen data from the same experimental domain.

3.2.3. Bayesian Hyperparameter Optimization Results

During nested cross-validation, all three top-performing algorithms (Random Forest, Gradient Boosting, and XGBoost) underwent comprehensive hyperparameter optimization using Optuna’s Bayesian approach. This systematic optimization across all candidates ensured that final model selection was based on each algorithm’s optimal performance rather than default configurations, thereby providing a fair and rigorous comparison.
The optimization process employed 50 trials per cross-validation fold for each algorithm, systematically exploring hyperparameter spaces tailored to each method’s specific characteristics. Optuna’s Tree-structured Parzen Estimator (TPE) sampler adaptively focused on promising regions of each hyperparameter space, while MedianPruner terminated unpromising trials early to enhance computational efficiency.
The optimization results (Table 5) reveal distinct patterns in how each algorithm adapted to the cement-stabilized soil dataset. Random Forest converged to a substantial ensemble size (261 estimators) with moderate tree depth ( m a x _ d e p t h = 5 ), reflecting a balanced approach between model complexity and generalization. The conservative node splitting criteria ( m i n _ s a m p l e s _ s p l i t = 6 , m i n _ s a m p l e s _ l e a f = 2 ) demonstrate careful adaptation to the dataset size, preventing overfitting while preserving predictive capability.
Gradient Boosting optimization yielded the most conservative learning configuration with the largest ensemble (289 estimators), shallow trees ( m a x _ d e p t h = 4 ), and an exceptionally low learning rate (0.012). This ultra-conservative learning rate indicates that Optuna identified the need for very gradual model building to achieve optimal performance, characteristic of datasets where subtle patterns require careful, incremental learning. The high subsample rate (0.963) provides minimal regularization, allowing most training data to contribute to each boosting iteration.
XGBoost adopted an intermediate approach with a substantial ensemble (277 estimators) and deeper trees ( m a x _ d e p t h = 7 ), balanced by moderate regularization through minimum child weight (3) and feature sampling ( c o l s a m p l e _ b y t r e e = 0.820 ). The significantly higher learning rate (0.173) compared to Gradient Boosting reflects XGBoost’s enhanced regularization capabilities that permit more aggressive learning steps while maintaining stability.
The convergence to relatively large ensemble sizes across all algorithms (261–289 estimators) suggests that the cement-stabilized soil relationship benefits from extensive model averaging to capture the complex interactions between stabilization parameters. The dramatic difference in learning rates between Gradient Boosting (0.012) and XGBoost (0.173) highlights how different boosting implementations require distinct optimization strategies for the same dataset.
The moderate tree depths across algorithms indicate that while the relationships are non-linear, they do not require extremely deep Decision Trees, suggesting that the key interactions can be captured through ensemble diversity rather than individual tree complexity. This finding supports the suitability of tree-based methods for this application while validating the experimental design’s effectiveness in capturing the essential patterns in UCS development.

3.3. Uncertainty Quantification System Performance

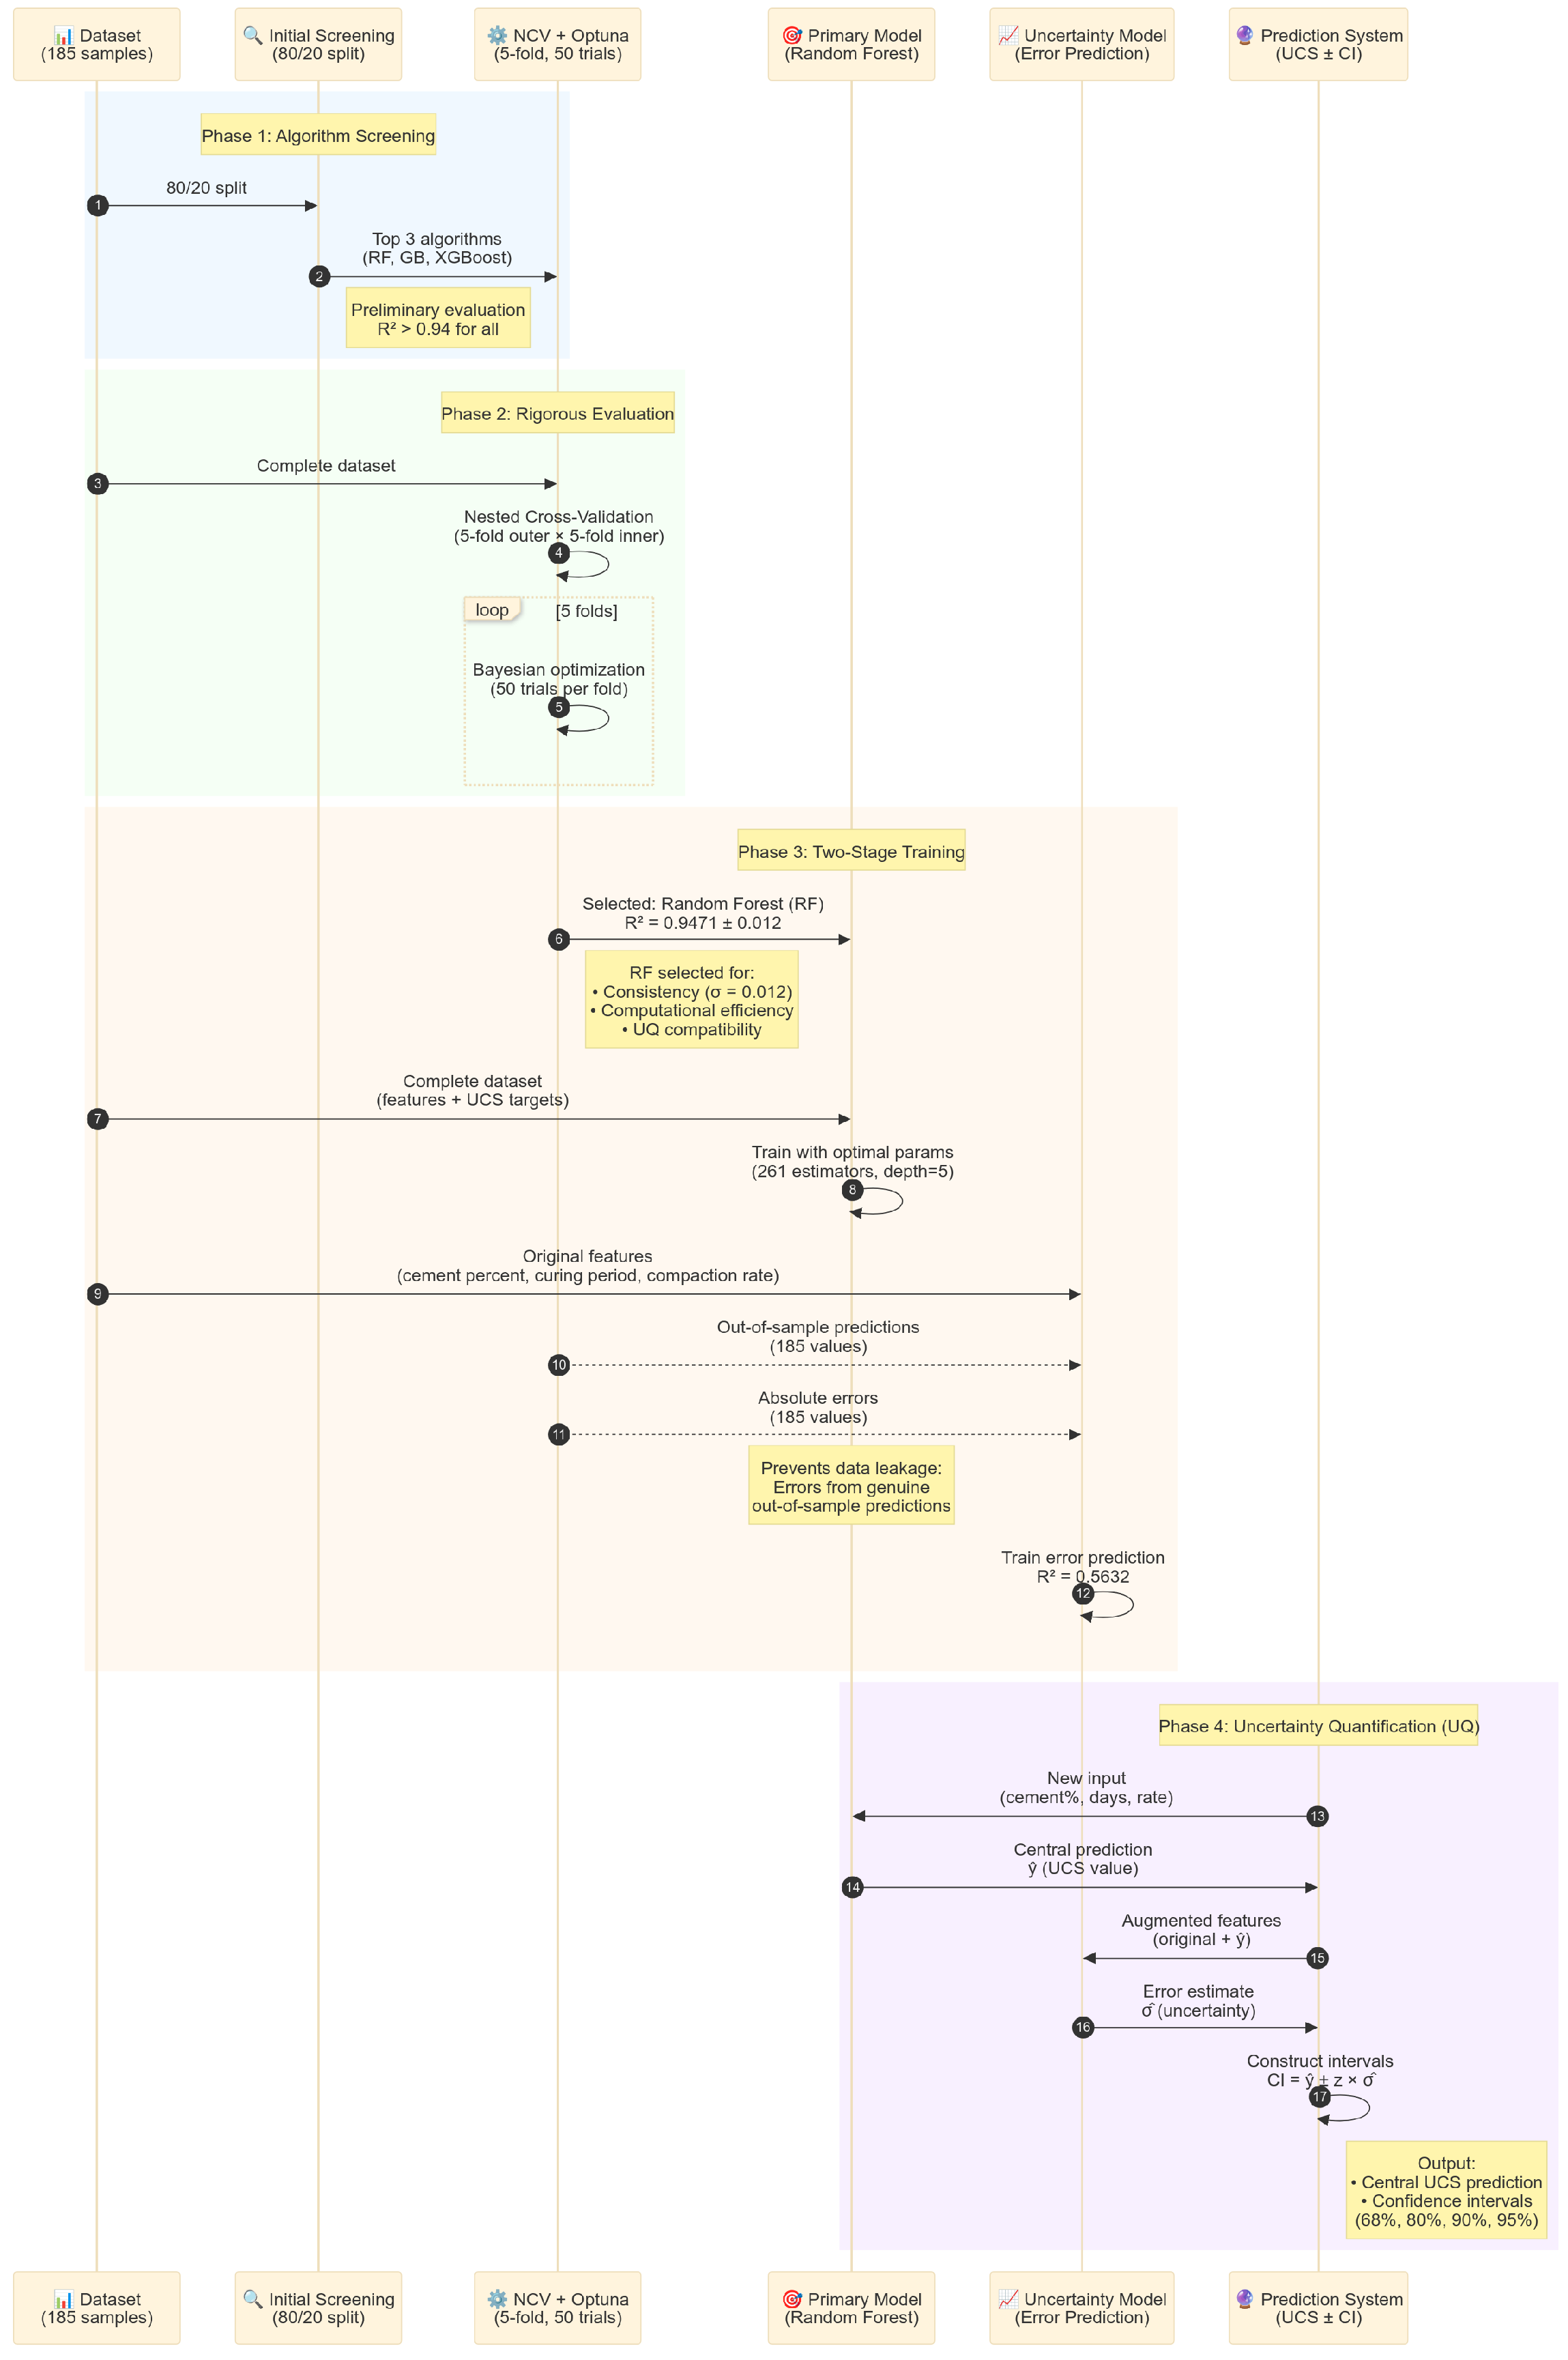
Following the comprehensive evaluation through nested cross-validation, a two-stage uncertainty quantification (UQ) framework was implemented and thoroughly evaluated. The integrated system demonstrated exceptional capability in providing both accurate central predictions and reliable uncertainty estimates, representing a significant advancement over traditional point prediction approaches in geotechnical engineering.
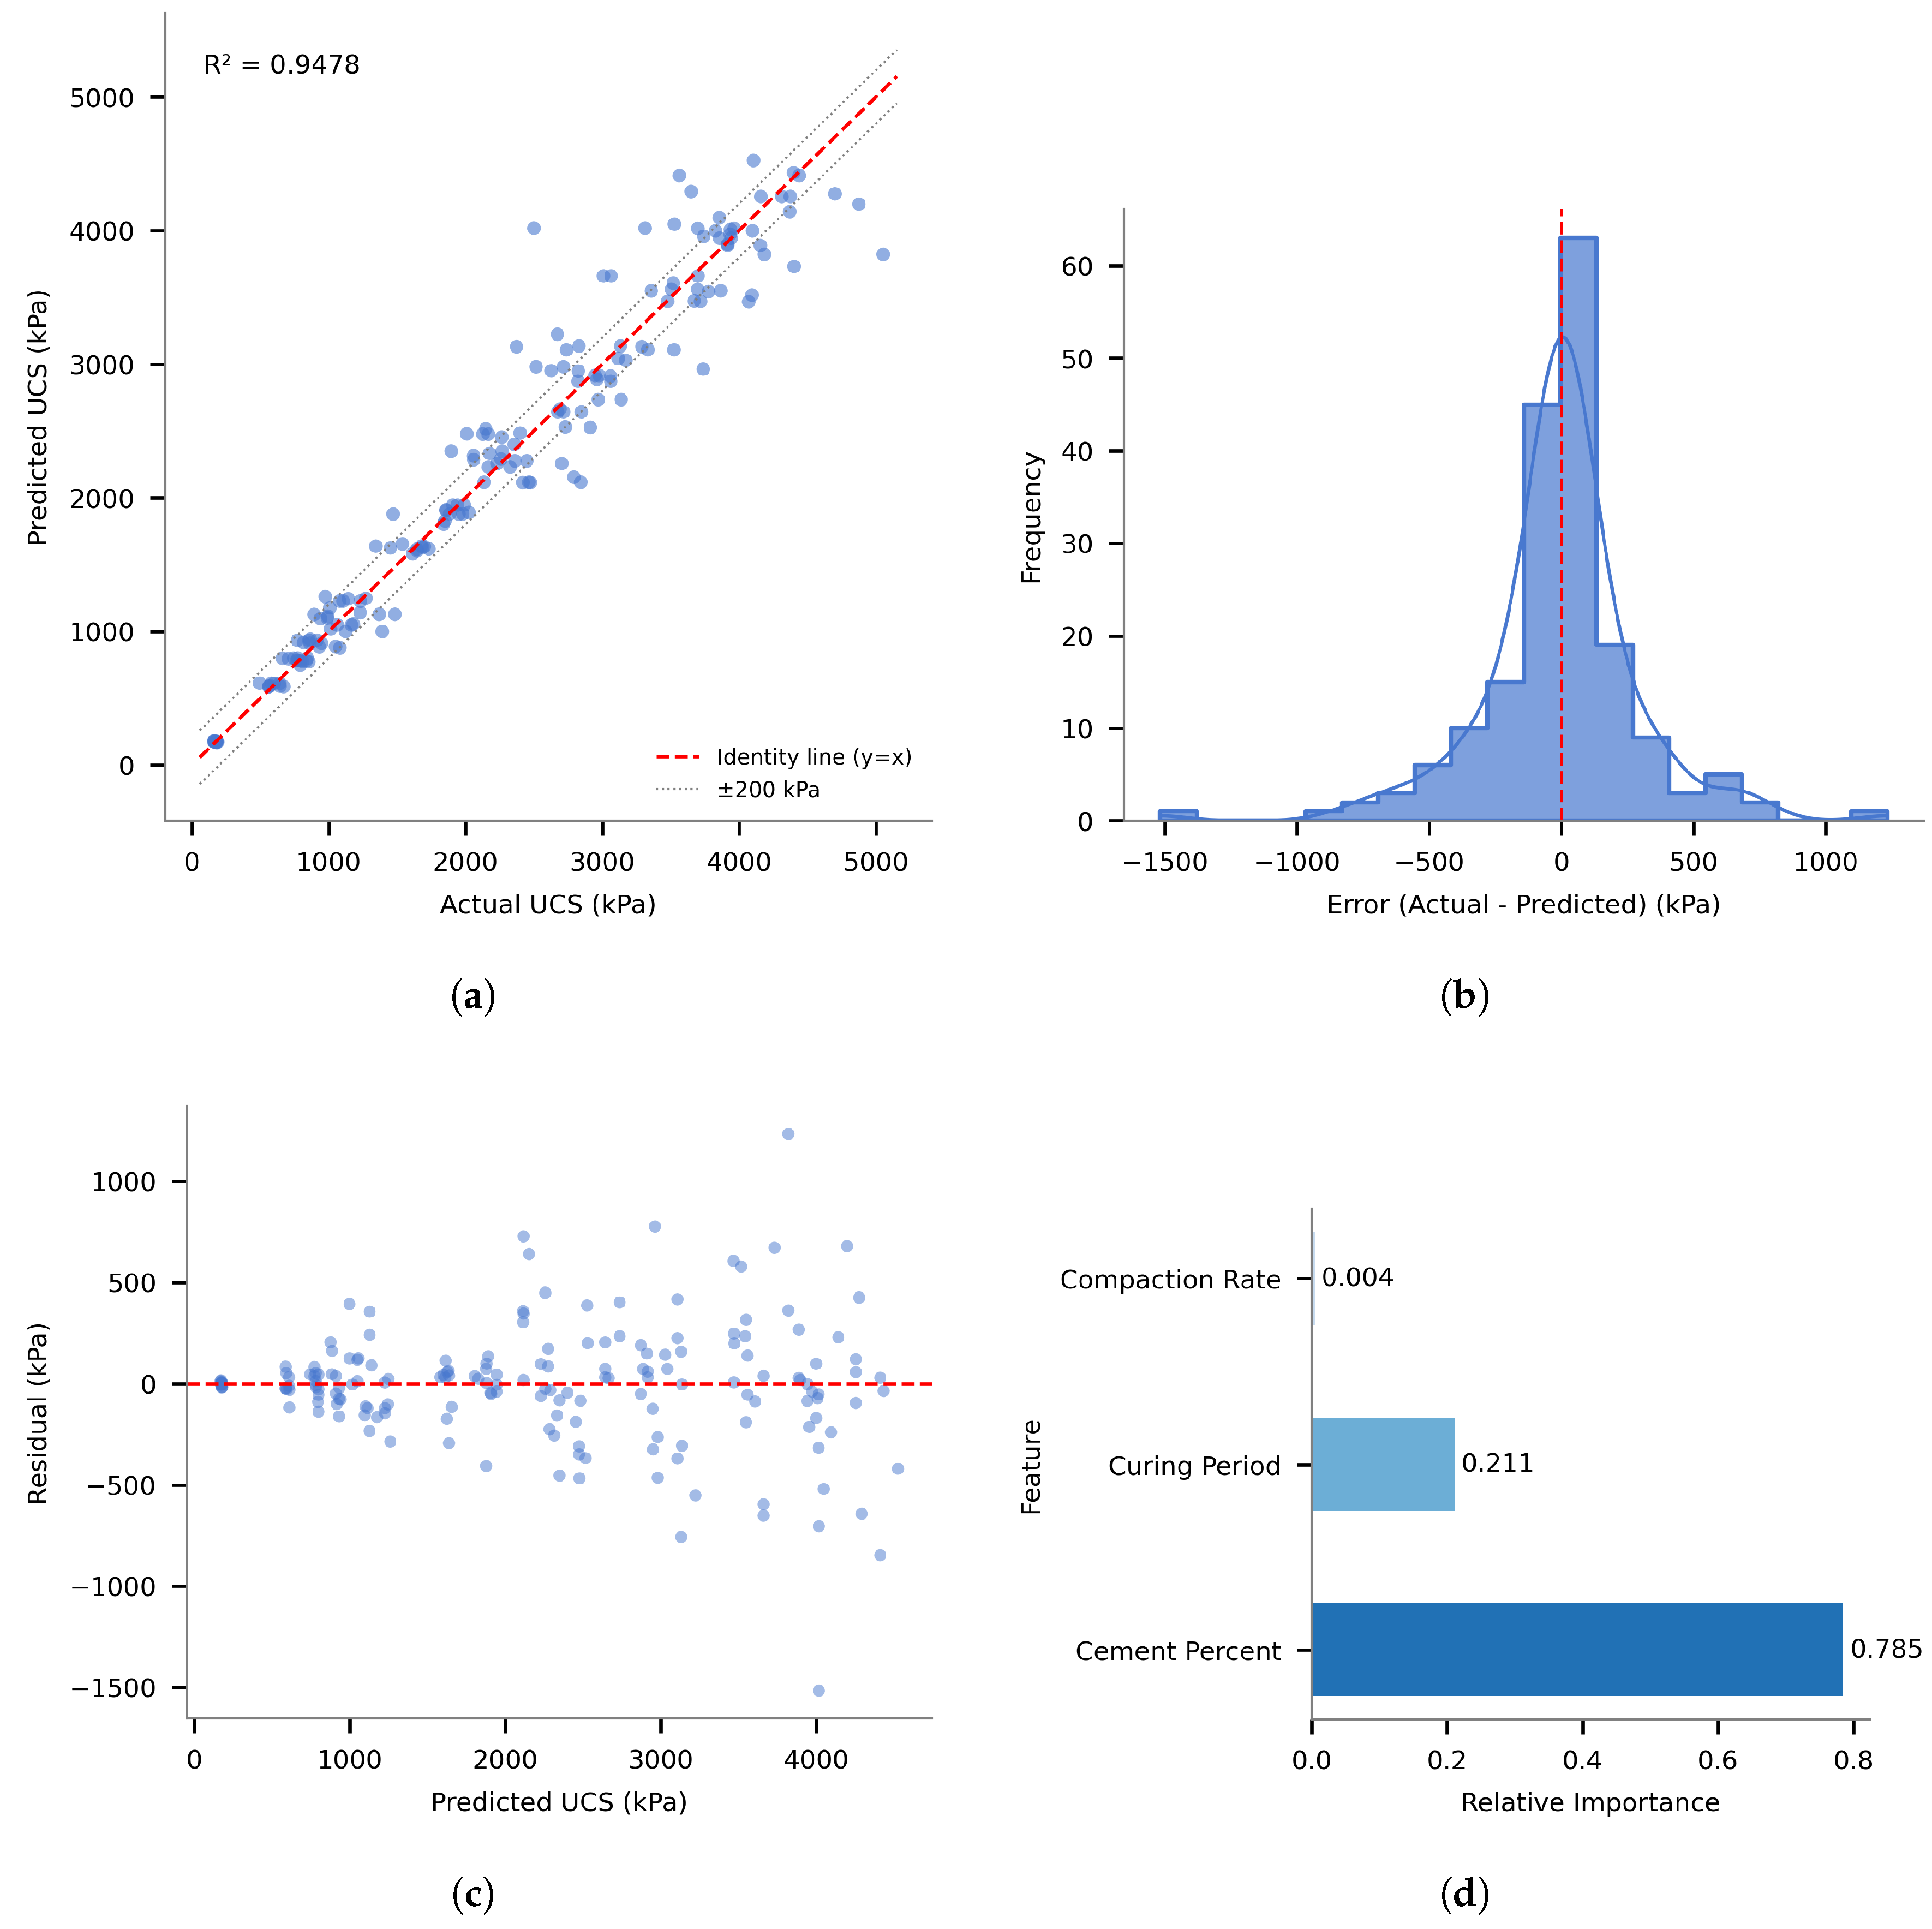
The UQ system operates via the coordinated function of two specialized models: a primary model for central UCS prediction (Figure 8), and a dedicated uncertainty model trained to estimate prediction error magnitudes (Figure 9). This architectural separation allows each model to optimize its specialized task, working synergistically to deliver not only precise predictions, but also informative and trustworthy confidence intervals—critical for robust engineering decision-making.
Despite achieving nearly identical cross-validation performance across the three candidate algorithms, Random Forest was selected as the foundation for the uncertainty quantification framework based on several critical considerations beyond pure predictive accuracy. The algorithm demonstrated the most consistent performance across validation folds with the lowest standard deviation in R2 scores (0.012), indicating superior stability and reliability—essential characteristics for uncertainty quantification where consistent error patterns are crucial for calibration quality.
Additionally, Random Forest’s computational efficiency for real-time inference and its natural resistance to overfitting made it particularly suitable for deployment as a web-accessible tool. The algorithm’s ensemble of independent Decision Trees aligns well with the dual requirements of the uncertainty framework: providing accurate central predictions while maintaining the consistent, interpretable error patterns necessary for reliable uncertainty estimation.
The final Random Forest model was trained on the complete experimental dataset of 185 UCS measurements using the optimal hyperparameters identified through Bayesian optimization: 261 estimators with a maximum depth of 5, minimum samples per split of 6, and minimum samples per leaf of 2. The model achieved R2 = 0.9478 when trained on the complete dataset, compared to the cross-validated estimate of R2 = 0.9471 ± 0.012. This minimal difference (ΔR2 = 0.0007) confirms that the nested cross-validation provided unbiased performance estimates.
The uncertainty model employs a fundamentally different training approach to prevent data leakage and ensure reliable uncertainty estimation. During the 5-fold outer cross-validation, each of the 185 data points serves as a validation sample exactly once across different folds. For each validation instance, the Random Forest model—trained exclusively on the remaining 4 folds—generates a genuine out-of-sample prediction. The absolute error for each prediction is calculated as
error i = | UCS measured , i UCS predicted , i |
These 185 out-of-sample absolute errors form the training targets for the uncertainty model, which learns to predict them using an augmented feature set:
[ cement content , curing period , compaction rate , UCS prediction ] absolute error
The uncertainty model achieved an R2 of 0.5632 in predicting error magnitudes—a substantial accomplishment considering that predicting prediction errors is fundamentally more challenging than predicting the original target values. The uncertainty model must identify subtle patterns in how prediction accuracy varies across different input conditions, and capturing over half of the variance in prediction uncertainty provides substantial information about confidence levels that would otherwise remain unknown.
The system’s ability to generate meaningful uncertainty estimates was validated through analysis of the relationship between predicted uncertainties and actual prediction errors. The uncertainty model demonstrated clear heteroscedastic behavior, correctly identifying that prediction uncertainty varies systematically across the input space, with higher uncertainty estimates corresponding to regions where the primary model exhibited larger prediction errors.

3.3.1. Confidence Interval Construction

The two-stage architecture enables the construction of calibrated confidence intervals through a systematic mathematical framework. For any new input combination, the system first generates a central UCS prediction ( y ^ ) using the primary Random Forest model. Simultaneously, the uncertainty model predicts the expected absolute error magnitude ( σ ^ ) for that specific prediction, utilizing both the original input features and the central prediction itself as inputs.
Confidence intervals are then constructed assuming a Gaussian distribution around the central prediction, with interval bounds calculated as
CI α = y ^ ± z α / 2 × σ ^
where z α / 2 represents the appropriate standard normal quantile for the desired confidence level α (e.g., 1.96 for 95% confidence). This approach enables the system to provide prediction-specific interval widths that reflect the varying uncertainty across different input conditions, rather than applying a constant uncertainty estimate across all predictions.
For example, when predicting UCS for a soil treated with 2.5% cement, compacted at 1.0 mm/min and cured for 28 days, the system generates y ^ = 1066 kPa and σ ^ = 140 kPa, resulting in a 95% confidence interval of [ 1066 ± 1.96 × 140 ] = [ 792 , 1340 ] kPa. This heteroscedastic approach correctly reflects that prediction uncertainty varies systematically with input conditions, a critical capability that distinguishes sophisticated uncertainty quantification from simplified constant-error approaches.

3.3.2. Calibration Quality Assessment

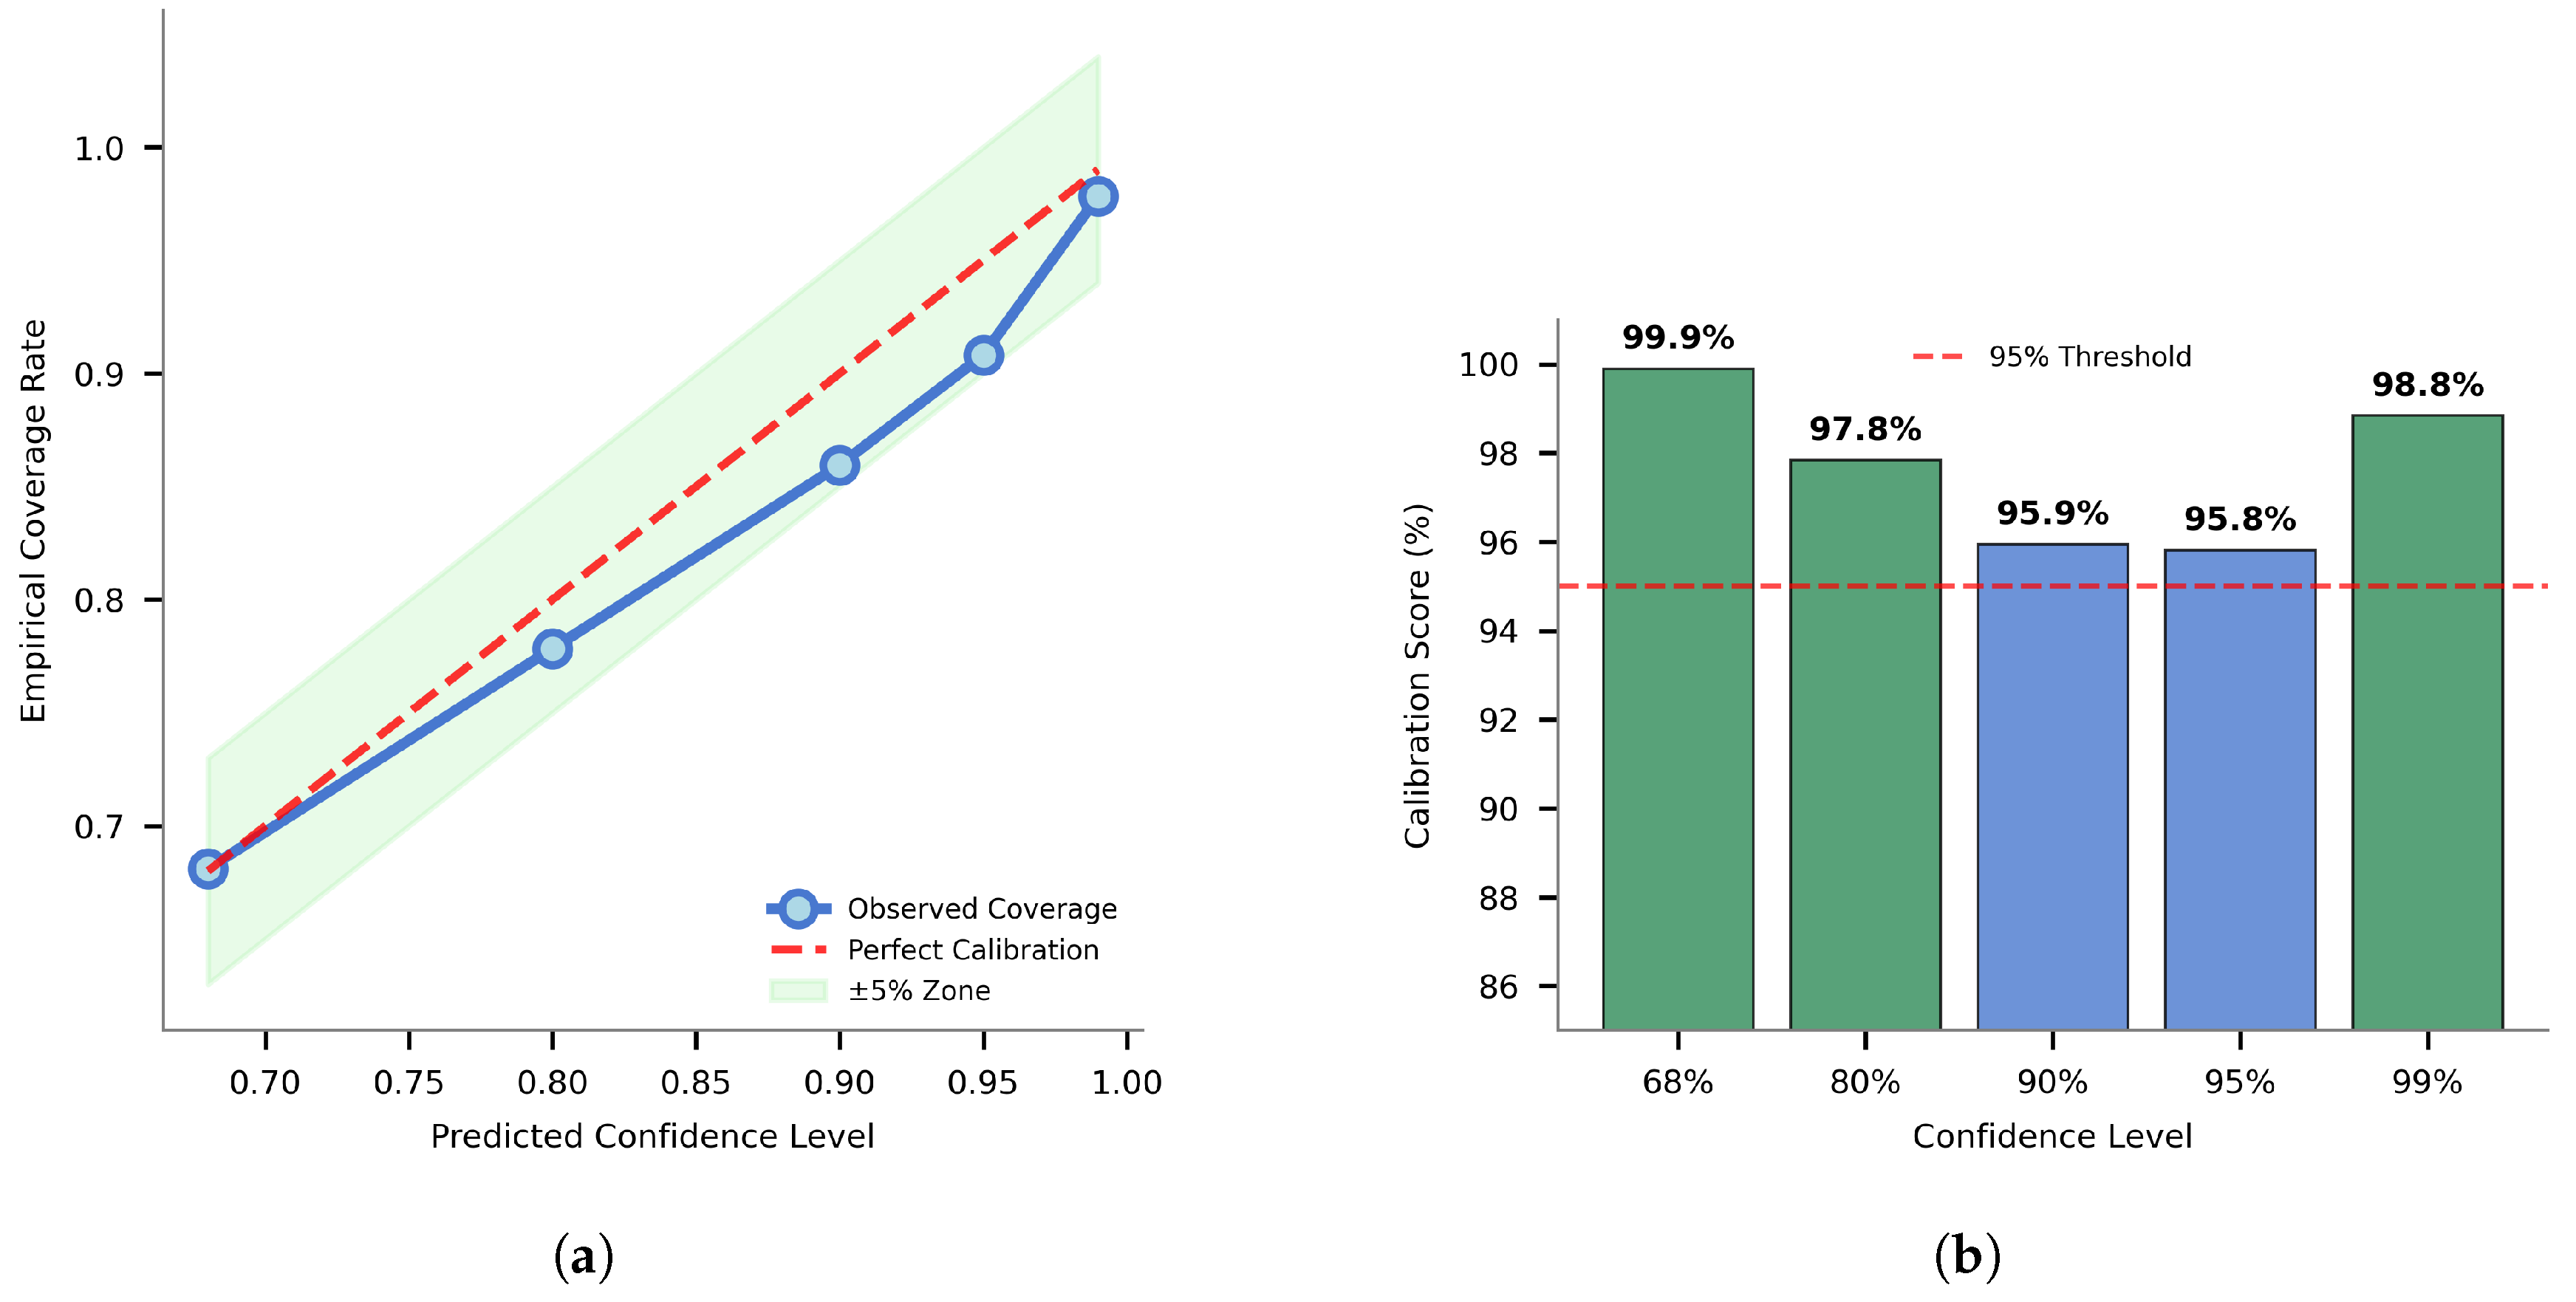
The cornerstone of any uncertainty quantification system lies in the calibration quality of its confidence intervals. Proper calibration ensures that stated confidence levels correspond accurately to empirical coverage rates, making the uncertainty estimates truly useful for practical engineering applications rather than merely statistical artifacts.
The uncertainty quantification system demonstrated exceptional calibration performance across multiple confidence levels, establishing its reliability for real-world geotechnical applications. For 68% confidence intervals, the system achieved 67.6% empirical coverage, representing nearly perfect calibration with a calibration score of 99.6%. This close agreement between theoretical and observed coverage indicates that when the system reports 68% confidence, engineers can trust that approximately two-thirds of true values will indeed fall within the predicted intervals.
For 95% confidence intervals, the system achieved 93.5% empirical coverage with a calibration score of 98.5%, again demonstrating the slight conservative bias that enhances practical utility. This consistency across different confidence levels indicates that the calibration quality is stable and reliable rather than coincidentally good at a single confidence threshold.
The calibration consistency across cross-validation folds further validates the robustness of the uncertainty estimates. Rather than achieving good calibration through fortunate data splits, the system demonstrated stable performance across different data partitions, indicating that the calibration quality will likely generalize to new data from similar experimental conditions (Figure 10). This stability is crucial for deployment in practical applications where data characteristics may vary slightly from the training conditions.

3.3.3. System Interpretability and Feature Analysis

Understanding how both components of the uncertainty quantification system make their decisions provides crucial insights for engineering applications. The feature importance analysis reveals distinct patterns between factors driving central UCS predictions versus those influencing prediction uncertainty, offering valuable guidance for practical implementation.
Primary Model Feature Importance
The primary Random Forest model confirms and quantifies established engineering understanding of cement stabilization mechanisms. Cement content emerges as the dominant factor influencing UCS development, accounting for 78.5% of the model’s predictive importance (Figure 8d). This overwhelming dominance aligns perfectly with established understanding of cement stabilization mechanisms, where the quantity of cementitious binder directly controls the extent of hydration reactions and the resulting strength of the soil–cement matrix.
Curing period demonstrates the second highest importance at 21.1%, reflecting the time-dependent nature of cement hydration and strength development processes. This substantial but secondary importance confirms that while adequate curing time is essential for strength development, its impact is significantly less than cement content. The feature importance analysis reveals that the effects of curing period are not simply linear but involve complex interactions with cement content, where higher cement contents provide more opportunities for continued hydration reactions over extended periods.
Compaction rate demonstrates minimal importance at only 0.4%, confirming the experimental observations that variations in compaction velocity within the investigated range have negligible impact on final strength development. This finding has significant practical implications, suggesting that field construction procedures can accommodate reasonable variations in compaction rates without substantially affecting the engineering properties of stabilized soils, provided that target densities are achieved.
The binned effect analysis in Figure 11 provides deeper insights into the non-linear relationships between input parameters and UCS predictions. The curing period analysis reveals that strength contributions peak around 25.7 days, suggesting that while extended curing continues to benefit strength development, the rate of improvement may begin to plateau beyond this timeframe. The compaction rate analysis confirms its minimal influence, with the peak effect occurring at 0.8 mm/min but within a narrow range that validates the experimental observation of limited practical significance. Most importantly, the cement content analysis demonstrates a strong, nearly monotonic relationship that peaks at 9.2%, very close to the maximum experimental dosage of 10%, indicating that higher cement contents would likely continue to provide strength benefits if practical and economic considerations permit.
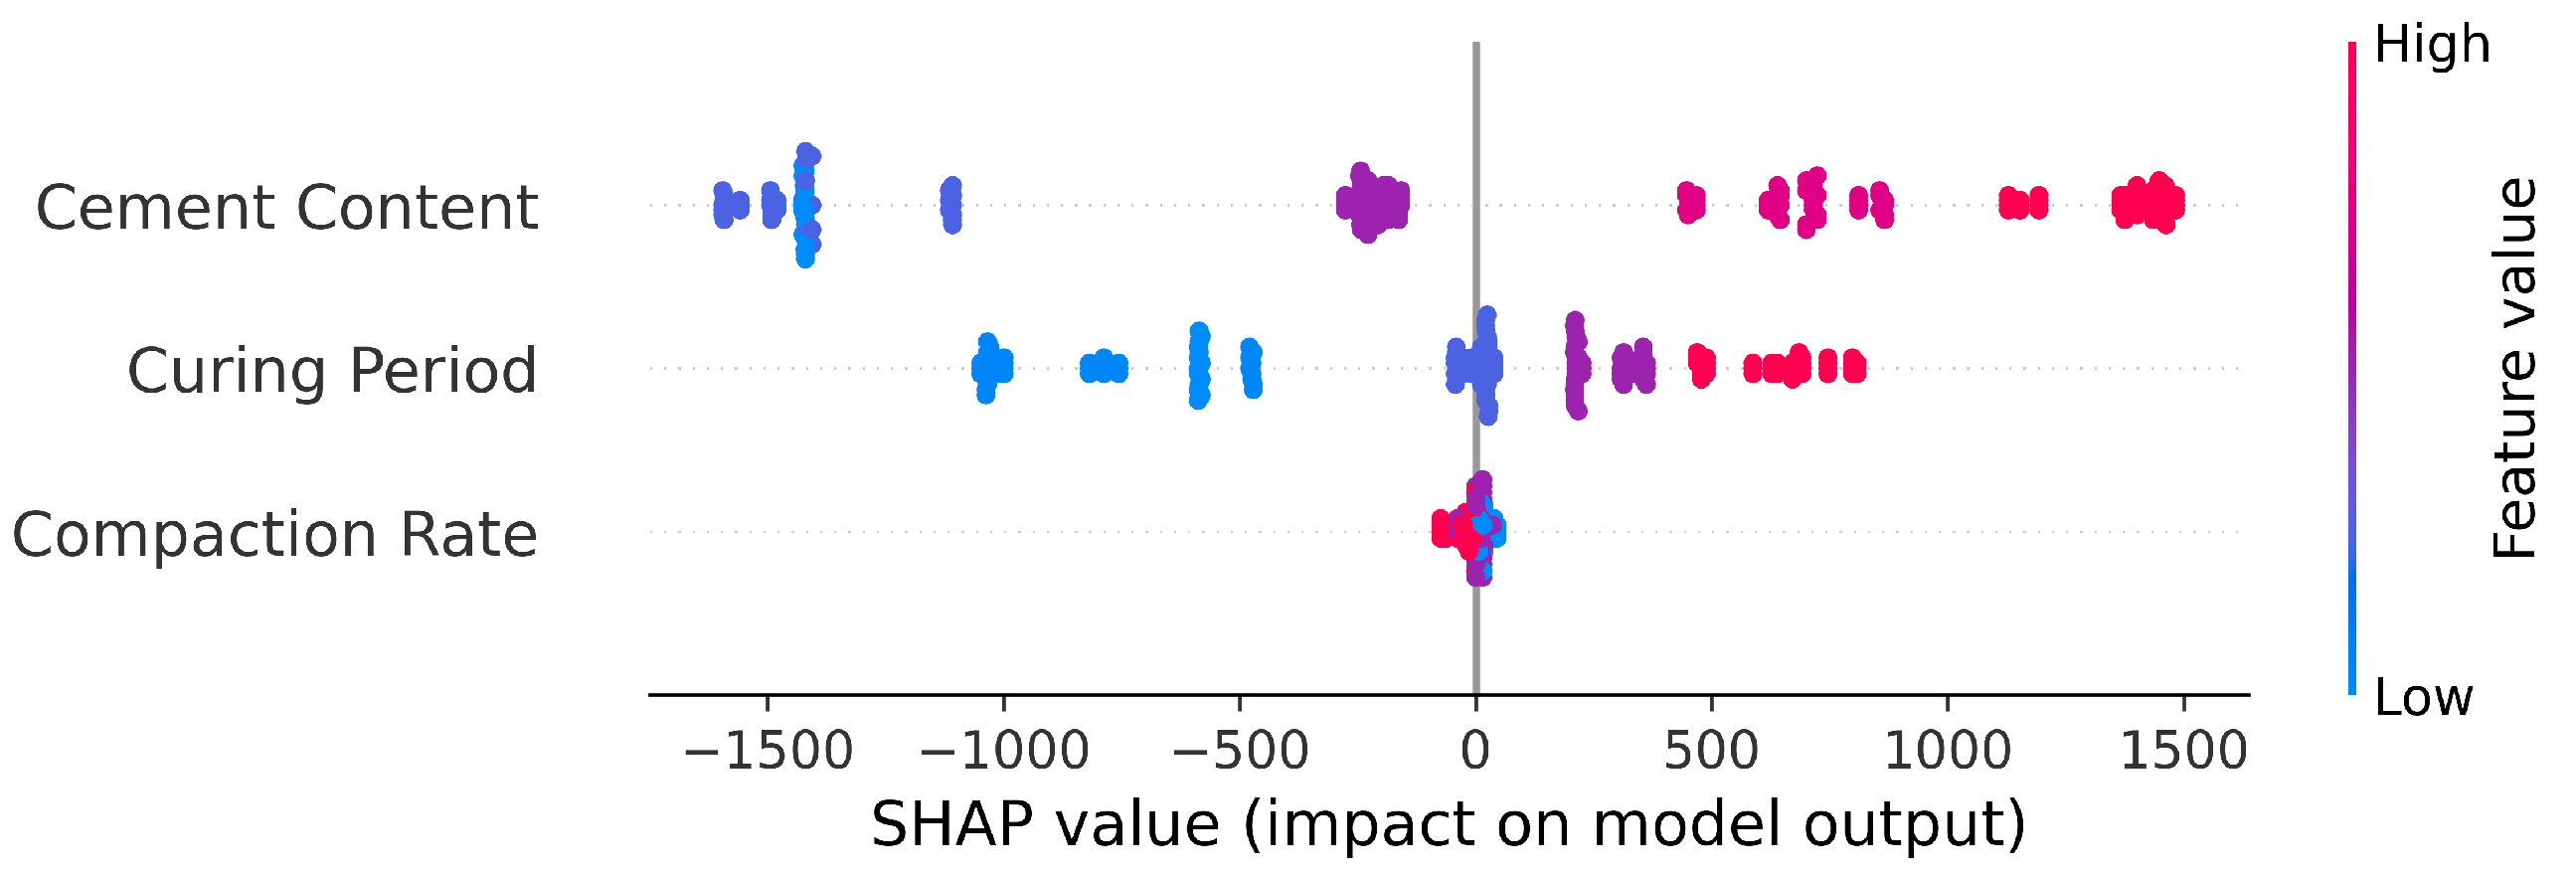
The SHAP summary plot in Figure 12 provides a complementary perspective to the binned effect analysis, clearly illustrating both the magnitude and directional impact of each feature on UCS predictions. The plot confirms that high cement content values (red points) consistently drive positive impacts on predicted UCS, while low cement content values (blue points) result in negative impacts, demonstrating the monotonic relationship identified in the binned analysis. Similarly, the curing period shows a predominantly positive relationship with UCS, though with greater variability compared to cement content. The compaction rate feature clusters tightly around zero impact, visually reinforcing its minimal influence on strength predictions across the entire range of experimental conditions.
This dual visualization approach—combining binned effects with impact direction analysis—provides engineers with a comprehensive understanding of how parameter adjustments will influence predicted outcomes, supporting informed decision-making in mix design and quality control applications.
Uncertainty Model Feature Importance
The uncertainty model reveals fundamentally different patterns compared to the primary model, as shown in Figure 9d. Most notably, the central UCS prediction itself becomes a significant feature for uncertainty estimation, indicating that the magnitude of predicted strength influences the expected prediction error. This relationship suggests that higher predicted UCS values tend to be associated with greater absolute errors, reflecting the increased challenge of precise prediction at higher strength levels where material behavior becomes more complex.
The original input parameters show altered importance rankings in the uncertainty model compared to the primary model. While cement content and curing period dominated central predictions, their direct influence on prediction uncertainty is more limited once their effect is captured through the central prediction feature. This behavior reflects the systematic and predictable nature of their influence through established hydration mechanisms—once their effect is captured in the central prediction, their additional contribution to prediction variability becomes secondary.
Compaction rate demonstrates a different pattern of influence in the uncertainty model, contributing more significantly to prediction variability than to central predictions. This finding suggests that compaction velocity affects microstructural aspects of the soil–cement matrix that influence result consistency without substantially altering average strength development. Such effects might include subtle variations in particle orientation, pore distribution, or cement homogeneity that manifest as variability rather than systematic strength changes.
This differential feature importance between the two models provides valuable practical guidance. For optimizing central strength values, engineers should focus primarily on cement content and curing time. However, for achieving consistent and predictable results, attention to compaction procedures may be more important than their minimal impact on average strength would suggest.

3.3.4. Practical Application Examples

Having established both the technical reliability and interpretability of the system, practical application scenarios demonstrate how uncertainty quantification enhances engineering decision-making in real-world contexts. The following examples utilize actual predictions from the deployed system, showcasing its capability to provide actionable information that supports both preliminary design and construction quality control in real geotechnical projects.
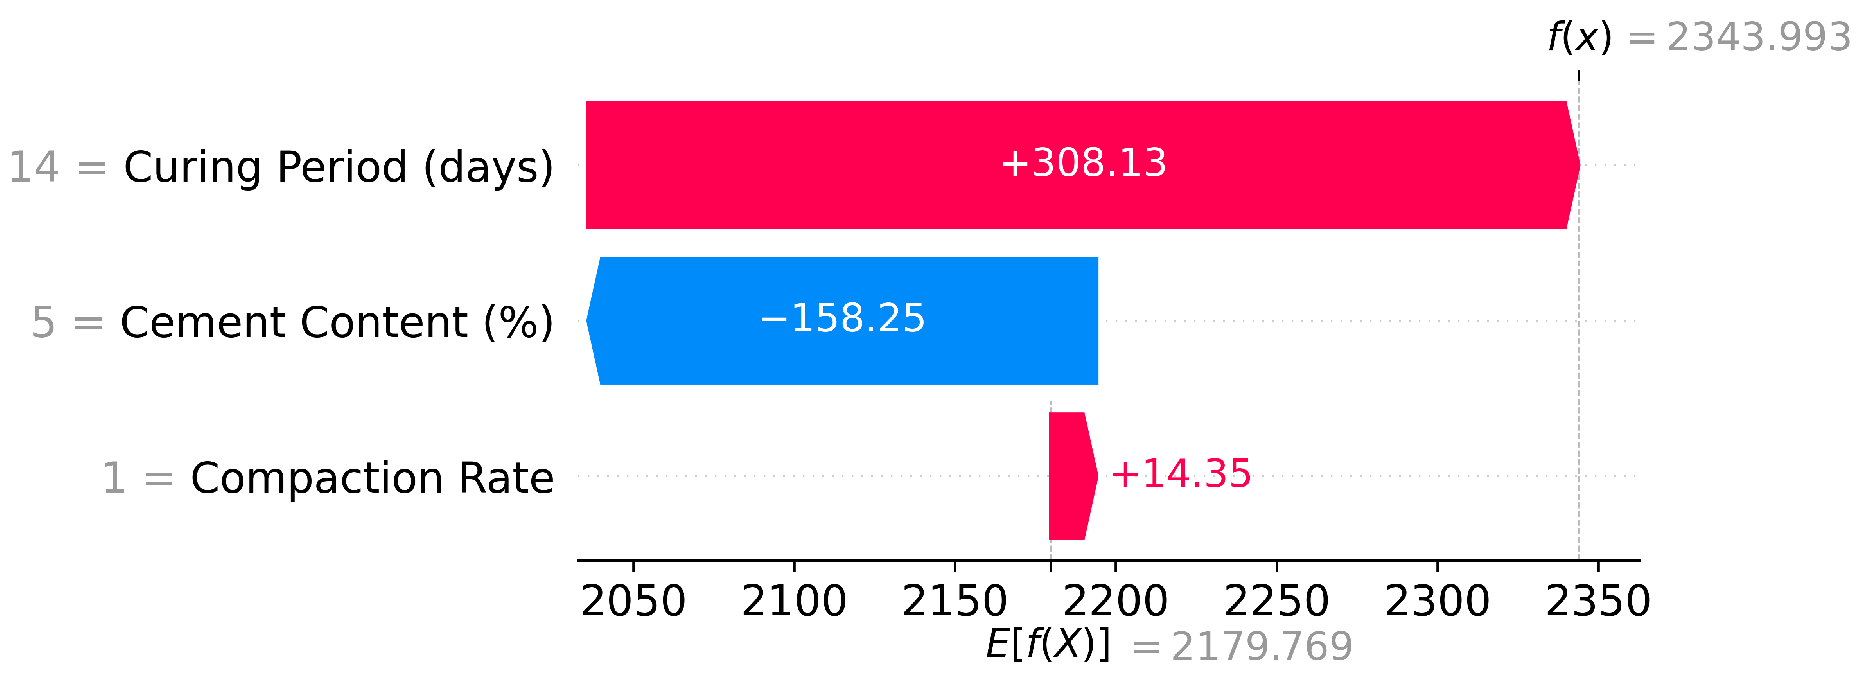
For an application with moderate strength requirements ( UCS 2000 kPa), one may consider a soil treated with 5% cement, compacted at 1.0 mm/min and cured for 14 days. In this scenario, the uncertainty quantification system predicts a central UCS value of 2344 kPa with an uncertainty estimate of 242 kPa, resulting in a 95% confidence interval of [1870 kPa, 2818 kPa]. The interval width of 948 kPa represents a relative uncertainty of ±20.2%, providing the geotechnical engineer with both the expected strength and a quantified range of probable outcomes essential for informed decision-making about safety factors and design margins.
The SHAP waterfall analysis for this scenario (Figure 13) reveals the mechanistic contributions underlying the prediction. Starting from the baseline expectation of 2180 kPa across all experimental conditions, the 14-day curing period contributes the largest positive impact of +308 kPa, reflecting the substantial strength development achieved through cement hydration during the first two weeks. The 5% cement content contributes −158 kPa relative to baseline, indicating that this moderate dosage falls below the experimental average and thus reduces strength expectations accordingly. The compaction rate contributes a minimal +14 kPa, confirming its limited practical significance in strength development. This decomposition enables engineers to understand precisely which parameters drive the predicted outcome and how modifications might affect results.
The practical value of this uncertainty information becomes immediately evident when evaluating design alternatives. If the project requires a minimum UCS of 1800 kPa, the engineer can proceed confidently with the 5% cement design, knowing that even the lower bound of the confidence interval (1870 kPa) exceeds the requirement with a margin. However, if the minimum requirement were 2500 kPa, the uncertainty information reveals that while the central prediction approaches the target, there exists a meaningful probability of falling short, suggesting the need for either increased cement content or extended curing time to ensure reliable performance.
For more demanding applications requiring substantial strength levels, one may consider a soil treated with 10% cement, compacted at 1.0 mm/min and cured for 28 days. In this scenario, the system predicts a central UCS value of 4258 kPa with an uncertainty estimate of 293 kPa, which yields a 95% confidence interval of [3683 kPa, 4833 kPa]. The interval width of 1150 kPa represents a relative uncertainty of ±13.5%, notably lower than the moderate strength scenario despite the larger absolute uncertainty magnitude. This enhanced predictability accompanies higher degrees of stabilization and supports more aggressive design optimization for projects where material costs represent significant considerations.
The SHAP analysis for this high-strength scenario (Figure 14) demonstrates dramatically different contribution patterns compared to the moderate strength case. Starting from the same baseline of 2180 kPa, the 10% cement content delivers a massive positive contribution of +1411 kPa, representing the dominant factor in achieving high strength levels. The extended 28 day curing period adds a substantial +685 kPa, reflecting continued hydration reactions that become increasingly valuable at higher cement contents. The compaction rate again shows minimal influence, confirming its limited practical significance across the entire strength spectrum. This analysis quantifies the engineering principle that high-strength cement-treated soils derive their performance primarily from cement dosage and adequate curing time.
The systematic comparison between these scenarios reveals important practical insights for engineering applications. The high-strength application achieves not only greater absolute strength but also enhanced relative predictability, with uncertainty reducing from ±20.2% to ±13.5%. This pattern suggests that heavily cemented mixtures become more predictable and reliable, supporting aggressive optimization strategies for demanding applications while providing greater confidence in meeting stringent performance requirements.
The uncertainty estimates prove particularly valuable for construction quality control and monitoring protocols. When field testing yields UCS values that fall near the bounds of predicted confidence intervals, engineers can make informed decisions about whether observed performance represents normal variability or indicates potential construction issues requiring investigation. For instance, if field tests on the 5% cement mixture yield values around 1900 kPa, the uncertainty framework confirms this falls within the expected range (1870–2818 kPa), avoiding unnecessary remedial work while maintaining appropriate quality standards.
Furthermore, the uncertainty quantification enables sophisticated risk assessment and project planning capabilities. Engineers can estimate probabilities that specific design requirements will be met, supporting decisions about testing frequency, acceptance criteria, and contingency planning. For the moderate strength scenario, if a project absolutely requires 2200 kPa minimum strength, the system indicates approximately 77% probability of achieving this target based on the predicted distribution. This probabilistic information supports more nuanced and economically efficient project delivery compared to traditional factor-of-safety approaches.
The mechanistic interpretability provided by SHAP analysis enhances these practical applications by enabling targeted optimization strategies. If field performance consistently falls toward the lower bounds of predicted intervals, engineers can identify which parameters offer the most effective pathways for improvement. The waterfall analyses demonstrate that for moderate strength applications, extending curing time may provide more immediate benefits than increasing cement content, while for high-strength applications, cement dosage optimization represents the most direct path to enhanced performance.
This integrated approach of precise uncertainty quantification combined with mechanistic interpretability represents a significant advancement in geotechnical engineering practice, enabling engineers to make informed decisions based on quantified confidence levels rather than relying solely on conservative safety factors and empirical experience.

3.3.5. Contextualization with Previous Research

The comparison of our findings with previous studies reveals both similarities and differences. The strong influence of cement content on UCS development aligns with established literature [96,98], but the minimal impact of compaction rate observed in our study must be interpreted within the specific context of our experimental methodology. All specimens were compacted to the same target density regardless of the compaction velocity used. Therefore, the total compaction energy was effectively adjusted to achieve the same final density. This finding does not contradict studies such as Kraszewski et al. [105], who reported substantial effects of compaction energy on strength development in cement-stabilized soils. In their study, different levels of compaction energy produced variable densities, which then directly influenced the strength of the material.
Our results instead suggest that when the final density is the same, the rate at which compaction is applied has limited effect on the mechanical properties of cement-treated soil. This observation is significant for practical applications in geotechnical engineering, as it indicates that as long as the target density is achieved, the precise rate of compaction application may be a less critical parameter than previously assumed. This aligns with the fundamental understanding that density, rather than the specific process through which this density is obtained, is the primary determining factor for strength development in cement-treated soils.

3.3.6. System Limitations and Responsible Application Guidelines

While the uncertainty quantification system demonstrates exceptional performance within its development scope, responsible deployment requires acknowledging several important limitations that affect the interpretation and application of predictions.
The system was developed using clayey silt from the northwestern Iași region, and its learned relationships reflect the specific physicochemical properties of this experimental soil. Application to soils with substantially different mineralogical compositions, plasticity characteristics, or organic content should be approached with appropriate caution. Engineers working with different soil types should consider using the system as a starting point for estimation while validating predictions through limited laboratory testing to ensure applicability to their specific conditions.
The experimental program explored cement contents ranging from 2.5 to 10 percent and compaction velocities from 0.75 to 1.25 mm per minute. Predictions remain most reliable within these experimental ranges, and extrapolation substantially beyond these bounds may introduce additional uncertainty. The relationship between cement content and UCS appears to accelerate at higher dosages, suggesting that the model may underestimate strength for cement contents beyond ten percent if this non-linear pattern continues. Similarly, substantially different compaction velocities or procedures may introduce effects not captured in the current training data.
All experimental data originated from controlled laboratory conditions with standardized mixing procedures, consistent environmental conditions, and uniform specimen preparation. Field implementation of soil–cement mixing inevitably introduces additional variability sources not captured in the current uncertainty model. These include mixing heterogeneity, moisture variations, and environmental factors such as temperature, humidity, and pH levels that may influence hydration processes and strength development. Additionally, operator-related variability including differences in mixing technique, compaction consistency, and curing practices can further affect performance of cement-treated soils.
The temporal scope of the experimental program examined curing periods up to twenty-eight days, which captures the primary hydration phase but may not fully represent long-term strength development mechanisms such as continued pozzolanic reactions or carbonation effects that can influence strength over months or years. For projects requiring long-term performance assessment, engineers should consider these extended timeframes in their design approach.

3.4. Model Deployment and Accessibility

To maximize the practical utility of this research for geotechnical engineers and researchers, the uncertainty quantification system has been deployed as a publicly accessible web application, fundamentally transforming academic research into an immediately available professional tool. This implementation represents a crucial bridge between advanced machine learning research and day-to-day engineering practice, ensuring that the sophisticated uncertainty quantification capabilities developed in this study directly benefit the professional community rather than remaining confined to academic publications.
The deployment strategy reflects a comprehensive understanding of how engineering professionals work and the barriers they face when attempting to utilize advanced analytical techniques. Traditional machine learning implementations often require specialized programming knowledge, specific software installations, or substantial computational resources that may not be readily available to all practitioners. By creating a web-based solution, we eliminate these barriers entirely, enabling even individual consultants and smaller firms to access state-of-the-art uncertainty quantification capabilities through nothing more than a standard web browser.
The deployment architecture utilizes a modern, robust approach centered on FastAPI, a high-performance web framework specifically chosen for its efficiency in handling prediction requests and its ability to scale with user demand. The trained Random Forest models—both the primary prediction model and the uncertainty estimation model—were serialized and integrated into a comprehensive RESTful API service. This service processes the three input parameters (cement percentage, curing period, and compaction velocity) and returns not only central UCS predictions but complete uncertainty information including confidence intervals at multiple levels, all computed and delivered in real time.
This architectural choice ensures both computational efficiency and scalability for multiple concurrent users while maintaining the full sophistication of the uncertainty quantification framework. The system operates efficiently on standard web servers using CPU-based processing, deliberately avoiding GPU dependencies that might complicate deployment or increase operational costs. Response times are optimized to support real-time decision-making during design sessions and field consultations, making the tool practical for integration into existing engineering workflows without disrupting established practices.
The web interface, accessible at http://www.bi4e-at.tuiasi.ro/ucs-prediction/, provides an intuitive user experience that requires no specialized software or machine learning expertise from practitioners. Engineers simply input the three key stabilization parameters and immediately receive comprehensive predictions including central UCS estimates, uncertainty bounds, and confidence intervals at 68%, 80%, 90%, and 95% levels. The interface incorporates intelligent value range validation based on the experimental bounds, clear input guidance that explains the expected parameter ranges, and immediate visualization of prediction results with uncertainty bands that enhance interpretability and practical utility.

4. Conclusions

This study successfully combined comprehensive experimental testing with advanced machine learning techniques to investigate and predict the unconfined compressive strength (UCS) of cement-treated clayey silt from northwestern Iași, Romania. Based on the analysis of 185 UCS measurements and the development of a sophisticated uncertainty quantification system, the following key conclusions emerge:
  • The experimental program systematically revealed the hierarchical importance of factors governing strength development in cement-stabilized soils. Cement content emerged as the dominant determinant of UCS development, exhibiting a strong positive correlation (0.87) that follows a non-linear pattern with accelerating strength gains at higher dosages. This relationship reflects the transition from localized cementation at low cement contents (2.5%) to the formation of continuous cementitious matrices at higher dosages (7.5–10%), fundamentally altering the soil’s load-bearing mechanisms.
  • Curing period demonstrated a moderate but significant correlation with UCS (0.50), confirming the time-dependent nature of cement hydration and pozzolanic reactions. While substantial strength development occurred within the first seven days, continued strength enhancement persisted through twenty-eight days, particularly pronounced at higher cement contents where extended hydration opportunities exist.
  • Within the investigated range (0.75–1.25 mm/min), compaction rate exhibited minimal influence on UCS development (R2 ≈ 0.04) when specimens achieved identical target densities. This finding has profound practical implications, suggesting that field construction protocols can accommodate reasonable variations in compaction velocity without compromising engineering performance, provided density targets are met. This result clarifies the distinction between compaction energy effects (which influence density) and compaction rate effects (which have minimal impact when density is controlled).
  • The systematic evaluation of fourteen regression algorithms revealed that tree-based ensemble methods significantly outperformed linear approaches, with performance gaps exceeding 10% in R2 scores. This substantial difference confirms that UCS development in cement-treated soils involves complex, non-linear interactions that cannot be adequately captured through traditional empirical relationships.
  • Random Forest emerged as the optimal algorithm through rigorous nested cross-validation with Bayesian hyperparameter optimization, achieving exceptional performance (R2 = 0.9471 ± 0.0120, RMSE = 291.23 ± 39.00 kPa). The algorithm’s balanced performance characteristics—combining high accuracy with exceptional stability across validation folds—proved crucial for supporting the subsequent uncertainty quantification framework.
  • This research advances beyond traditional point prediction models by implementing a sophisticated two-stage uncertainty quantification system that provides both central UCS estimates and calibrated confidence intervals. The uncertainty model achieved R2 = 0.5632 in predicting error magnitudes—a substantial accomplishment considering the inherent difficulty of forecasting prediction uncertainty rather than primary target values. The system demonstrated exceptional calibration quality across multiple confidence levels, achieving 67.6% empirical coverage for 68% confidence intervals (calibration score: 99.6%) and 93.5% coverage for 95% intervals (calibration score: 98.5%). This calibration consistency across different confidence thresholds and validation folds establishes the system’s reliability for practical engineering applications where uncertainty estimates directly impact safety-critical decisions.
The SHAP interpretability analysis provides mechanistic understanding of parameter contributions, enabling targeted optimization strategies. For moderate-strength applications, extending curing time offers immediate benefits, while for high-strength requirements, cement dosage optimization represents the most direct path to enhanced performance. The minimal influence of compaction rate, once density targets are achieved, simplifies field implementation protocols and reduces quality control complexity.
The deployment of the uncertainty quantification system as a publicly accessible web application represents a significant advancement in translating academic research into immediately applicable professional tools. This implementation eliminates traditional barriers to advanced analytical techniques, enabling practitioners across the engineering community to access state-of-the-art uncertainty quantification capabilities without specialized software or programming expertise. The web-based platform provides real-time predictions with comprehensive uncertainty information, supporting informed decision-making during design phases and quality control activities. The integration of SHAP-based interpretability features enables engineers to understand mechanistic contributions underlying predictions, enhancing confidence in model-based decisions while maintaining transparency in the prediction process.
By making both the experimental dataset and trained machine learning models publicly available, this work establishes a foundation for continued research in data-driven geotechnical engineering. The comprehensive methodology—encompassing experimental design, advanced machine learning implementation, and uncertainty quantification—provides a template for similar investigations across diverse soil types and stabilization techniques.
This research demonstrates that the integration of experimental geotechnical testing with advanced data science techniques can significantly enhance our ability to predict and optimize soil stabilization outcomes, potentially leading to more efficient, economical, and sustainable ground improvement practices.

Author Contributions

Conceptualization, I.L. and I.-B.T.; methodology, M.A., I.L., I.-B.T., Z.O.-Y., A.A. and A.V.D.; software, I.-B.T.; validation, I.L. and I.-B.T.; investigation, I.-B.T.; resources, Z.O.-Y., M.A. and A.V.D.; data curation, I.-B.T.; writing—original draft preparation, I.-B.T. and Z.O.-Y.; writing—review and editing, I.-B.T., I.L., F.H. and A.A.; visualization, I.-B.T.; supervision, I.L. All authors have read and agreed to the published version of the manuscript.

Funding

This research was funded by the Romanian National Authority for Scientific Research, UEFISCDI, through project PN-IV-P8-8.1-PRE-HE-ORG-2023-0051.

Institutional Review Board Statement

Not applicable.

Informed Consent Statement

Not applicable.

Data Availability Statement

The original data presented in this study are openly available in FigShare at https://doi.org/10.6084/m9.figshare.28553693.v1, under a CC BY license. Additionally, the trained machine learning model is accessible for predictions through a web-based interface at http://www.bi4e-at.tuiasi.ro/ucs-prediction/.

Acknowledgments

This research paper was supported by the Boosting Ingenium for Excellence (BI4E) project, funded by the European Union’s HORIZON-WIDERA-2021-ACCESS-05-01: European Excellence Initiative, under Grant Agreement No. 101071321.

Conflicts of Interest

The authors declare no conflicts of interest.

References

  1. Al-Arafat, M.; Kabi, M.E.; Morshed, A.; Sunny, M.A.U. Geotechnical Challenges In Urban Expansion: Addressing Soft Soil, Groundwater, And Subsurface Infrastructure Risks In Mega Cities. Innov. Eng. J. 2024, 1, 205–222. [Google Scholar] [CrossRef]
  2. Culligan, P.J.; Whittle, A.J.; Mitchell, J.K. The Role of Geotechnics in Addressing New World Problems. In Geotechnical Fundamentals for Addressing New World Challenges; Lu, N., Mitchell, J.K., Eds.; Springer International Publishing: Cham, Switzerland, 2019; pp. 1–27. [Google Scholar] [CrossRef]
  3. Abija, F.A. Ground Variation, Geotechnical Uncertainties and Reliability of Foundation Design for Sustainable Building Infrastructures with Case Histories. J. Mater. Sci. Eng. Technol. 2023, 1, 1–11. [Google Scholar] [CrossRef]
  4. Firoozi, A.A.; Firoozi, A.A. Geotechnical solutions for urban centers: Bridging engineering innovations with socio-economic development. Sustain. Soc. Dev. 2023, 1, 1–11. [Google Scholar] [CrossRef]
  5. Verma, H.; Ray, A.; Rai, R.; Gupta, T.; Mehta, N. Ground improvement using chemical methods: A review. Heliyon 2021, 7, e07678. [Google Scholar] [CrossRef]
  6. Afrin, H. A Review on Different Types Soil Stabilization Techniques. Int. J. Transp. Eng. Technol. 2017, 3, 19–24. [Google Scholar] [CrossRef]
  7. Puppala, A.J.; Pedarla, A. Innovative ground improvement techniques for expansive soils. Innov. Infrastruct. Solut. 2017, 2, 24. [Google Scholar] [CrossRef]
  8. Firoozi, A.A.; Guney Olgun, C.; Firoozi, A.A.; Baghini, M.S. Fundamentals of soil stabilization. Int. J.-Geo-Eng. 2017, 8, 26. [Google Scholar] [CrossRef]
  9. Shojamoghadam, S.; Rajaee, A.; Abrishami, S. Impact of various additives and their combinations on the consolidation characteristics of clayey soil. Sci. Rep. 2024, 14, 31907. [Google Scholar] [CrossRef] [PubMed]
  10. Solihu, H. Cement Soil Stabilization as an Improvement Technique for Rail Track Subgrade, and Highway Subbase and Base Courses: A Review. J. Civ. Environ. Eng. 2020, 10, 1–6. [Google Scholar] [CrossRef]
  11. Yang, Y.; Li, S.; Li, C.; Wu, L.; Yang, L.; Zhang, P.; Huang, T. Comprehensive Laboratory Evaluations and a Proposed Mix Design Procedure for Cement-Stabilized Cohesive and Granular Soils. Front. Mater. 2020, 7, 239. [Google Scholar] [CrossRef]
  12. Khan, M.H.A.; Abdallah, A.; Cuisinier, O. Insights into the strength development in cement-treated soils: An explainable AI-based approach for optimized mix design. Comput. Geotech. 2025, 180, 107103. [Google Scholar] [CrossRef]
  13. Kitazume, M.; Terashi, M. The Deep Mixing Method; CRC Press: London, UK, 2013. [Google Scholar]
  14. Nakarai, K.; Yoshida, T. Effect of carbonation on strength development of cement-treated Toyoura silica sand. Soils Found. 2015, 55, 857–865. [Google Scholar] [CrossRef]
  15. da Fonseca, A.V.; Cruz, R.C.; Consoli, N.C. Strength Properties of Sandy Soil–Cement Admixtures. Geotech. Geol. Eng. 2009, 27, 681–686. [Google Scholar] [CrossRef]
  16. Aryal, S.; Kolay, P.K.; Puri, V.K.; Kumar, S. Long-term Durability of Ordinary Portland Cement and Polypropylene Fiber Stabilized Clay. In Proceedings of the Indian Geotechnical Conference 2019, Surat, India, 19–21 December 2019; Patel, S., Solanki, C.H., Reddy, K.R., Shukla, S.K., Eds.; Springer: Singapore, 2021; pp. 173–183. [Google Scholar]
  17. Zabielska-Adamska, K.; Wasil, M.; Dobrzycki, P. Resilient Response of Cement-Treated Coarse Post-Glacial Soil to Cyclic Load. Materials 2021, 14, 6495. [Google Scholar] [CrossRef]
  18. Liu, F.; Qin, Y.; Yang, Y. Investigation on Cement-Stabilized Base with Recycled Aggregate and Desert Sand. Materials 2024, 17, 4262. [Google Scholar] [CrossRef]
  19. Jongpradist, P.; Krairan, K.; Jamsawang, P.; Chen, X. Geotechnical Engineering Properties of Cement Fly Ash Gravel Mixtures for Application as Column-Supported Highway and Railway Embankments. Materials 2022, 15, 3972. [Google Scholar] [CrossRef]
  20. Ashiq, H.M.; Sabab, S.R.; Joy, J.A.; Zahid, C.Z.B.; Kabir, M.U. Analysis of cement-stabilized soil on road embankment employing finite element analysis—A case study. Eng. Res. Express 2024, 6, 045101. [Google Scholar] [CrossRef]
  21. Kwiecień, S.; Podgórska, A.; Rybak, J.; Štefánik, M.; Cheben, V. Cement Stabilization of Waste from Contaminated Soils in Terms of Its Installation into Engineered Landfill. Appl. Sci. 2023, 13, 11485. [Google Scholar] [CrossRef]
  22. Consoli, N.C.; Foppa, D.; Festugato, L.; Heineck, K.S. Key Parameters for Strength Control of Artificially Cemented Soils. J. Geotech. Geoenviron. Eng. 2007, 133, 197–205. [Google Scholar] [CrossRef]
  23. Bui Truong, S.; Nguyen Thi, N.; Nguyen Thanh, D. An Experimental Study on Unconfined Compressive Strength of Soft Soil-Cement Mixtures with or without GGBFS in the Coastal Area of Vietnam. Adv. Civ. Eng. 2020, 2020, 7243704. [Google Scholar] [CrossRef]
  24. Abdallah, A.; Russo, G.; Cuisinier, O. Statistical and Predictive Analyses of the Strength Development of a Cement-Treated Clayey Soil. Geotechnics 2023, 3, 465–479. [Google Scholar] [CrossRef]
  25. Cheng, D.; Reiner, D.M.; Yang, F.; Cui, C.; Meng, J.; Shan, Y.; Liu, Y.; Tao, S.; Guan, D. Projecting future carbon emissions from cement production in developing countries. Nat. Commun. 2023, 14, 8213. [Google Scholar] [CrossRef]
  26. Sharma, L.K.; Singh, T.N. Regression-based models for the prediction of unconfined compressive strength of artificially structured soil. Eng. Comput. 2018, 34, 175–186. [Google Scholar] [CrossRef]
  27. Yao, K.; Pan, Y.; Jia, L.; Yi, J.T.; Hu, J.; Wu, C. Strength evaluation of marine clay stabilized by cementitious binder. Mar. Georesources Geotechnol. 2019, 38, 730–743. [Google Scholar] [CrossRef]
  28. Miller, G.A.; Cerato, A.B.; Snethen, D.R.; Holderby, E.; Boodagh, P. Empirical method for predicting time-dependent strength and resilient modulus of chemically treated soil. Transp. Geotech. 2021, 29, 100551. [Google Scholar] [CrossRef]
  29. Ghanizadeh, A.R.; Heidarabadizadeh, N.; Bayat, M.; Khalifeh, V. Modeling of unconfined compressive strength and Young’s modulus of lime and cement stabilized clayey subgrade soil using Evolutionary Polynomial Regression (EPR). Int. J. Min.-Geo-Eng. 2022, 56, 257–269. [Google Scholar] [CrossRef]
  30. Carey, A.S.; Howard, I.L. Backcasting and forecasting stabilized soil mechanical properties for mechanistic-empirical pavement design. Constr. Build. Mater. 2022, 324, 126645. [Google Scholar] [CrossRef]
  31. Kang, G.; Kim, Y.; Kang, J. Predictive strength model of cement-treated fine-grained soils using key parameters: Consideration of the total water/cement and soil/cement ratios. Case Stud. Constr. Mater. 2023, 18, e02069. [Google Scholar] [CrossRef]
  32. Jeremiah, J.; Abbey, S.; Booth, C.; Kashyap, A. Results of Application of Artificial Neural Networks in Predicting Geo-Mechanical Properties of Stabilised Clays—A Review. Geotechnics 2021, 1, 147–171. [Google Scholar] [CrossRef]
  33. Mozumder, R.A.; Laskar, A.I. Prediction of unconfined compressive strength of geopolymer stabilized clayey soil using Artificial Neural Network. Comput. Geotech. 2015, 69, 291–300. [Google Scholar] [CrossRef]
  34. Gunaydin, O.; Gokoglu, A.; Fener, M. Prediction of artificial soil’s unconfined compression strength test using statistical analyses and artificial neural networks. Adv. Eng. Softw. 2010, 41, 1115–1123. [Google Scholar] [CrossRef]
  35. Anysz, H.; Narloch, P. Designing the Composition of Cement Stabilized Rammed Earth Using Artificial Neural Networks. Materials 2019, 12, 1396. [Google Scholar] [CrossRef]
  36. Mustafa, Y.M.H.; Zami, M.S.; Al-Amoudi, O.S.B.; Al-Osta, M.A.; Wudil, Y.S. Analysis of Unconfined Compressive Strength of Rammed Earth Mixes Based on Artificial Neural Network and Statistical Analysis. Materials 2022, 15, 9029. [Google Scholar] [CrossRef] [PubMed]
  37. Ngo, H.T.T.; Pham, T.A.; Vu, H.L.T.; Giap, L.V. Application of Artificial Intelligence to Determined Unconfined Compressive Strength of Cement-Stabilized Soil in Vietnam. Appl. Sci. 2021, 11, 1949. [Google Scholar] [CrossRef]
  38. Mozumder, R.A.; Laskar, A.I.; Hussain, M. Empirical approach for strength prediction of geopolymer stabilized clayey soil using support vector machines. Constr. Build. Mater. 2017, 132, 412–424. [Google Scholar] [CrossRef]
  39. Onyelowe, K.C.; Moghal, A.A.B.; Ebid, A.; Rehman, A.U.; Hanandeh, S.; Priyan, V. Estimating the strength of soil stabilized with cement and lime at optimal compaction using ensemble-based multiple machine learning. Sci. Rep. 2024, 14, 15308. [Google Scholar] [CrossRef] [PubMed]
  40. Thapa, I.; Ghani, S. Advancing earth science in geotechnical engineering: A data-driven soft computing technique for unconfined compressive strength prediction in soft soil. J. Earth Syst. Sci. 2024, 133, 159. [Google Scholar] [CrossRef]
  41. Chen, Q.; Hu, G.; Wu, J. Prediction of the Unconfined Compressive Strength of a One-Part Geopolymer-Stabilized Soil Using Deep Learning Methods with Combined Real and Synthetic Data. Buildings 2024, 14, 2894. [Google Scholar] [CrossRef]
  42. Ngo, T.Q.; Nguyen, L.Q.; Tran, V.Q. Novel hybrid machine learning models including support vector machine with meta-heuristic algorithms in predicting unconfined compressive strength of organic soils stabilised with cement and lime. Int. J. Pavement Eng. 2023, 24, 2136374. [Google Scholar] [CrossRef]
  43. Pham, V.N.; Do, H.D.; Oh, E.; Ong, D.E.L. Prediction of unconfined compressive strength of cement-stabilized sandy soil in Vietnam using artificial neural networks (ANNs) model. Int. J. Geotech. Eng. 2021, 15, 1177–1187. [Google Scholar] [CrossRef]
  44. Kardani, N.; Zhou, A.; Shen, S.L.; Nazem, M. Estimating unconfined compressive strength of unsaturated cemented soils using alternative evolutionary approaches. Transp. Geotech. 2021, 29, 100591. [Google Scholar] [CrossRef]
  45. Amini, Y.; Hamidi, A. Triaxial shear behavior of a cement-treated sand–gravel mixture. J. Rock Mech. Geotech. Eng. 2014, 6, 455–465. [Google Scholar] [CrossRef]
  46. Yilmaz, Y.; Ozaydin, V. Compaction and shear strength characteristics of colemanite ore waste modified active belite cement stabilized high plasticity soils. Eng. Geol. 2013, 155, 45–53. [Google Scholar] [CrossRef]
  47. STAS 1913/5-85; Teren de Fundare. Determinarea Granulozităţii. Institutul Român de Standardizare: Bucureşti, Romanian, 1985.
  48. EN ISO 14688-2:2018; Geotechnical Investigation and Testing—Identification and Classification of Soil—Part 2: Principles for a Classification. European Committee for Standardization: Brussels, Belgium, 2018.
  49. EN ISO 14688-1:2018; Geotechnical Investigation and Testing—Identification and Classification of Soil—Part 1: Identification and Description. European Committee for Standardization: Brussels, Belgium, 2018.
  50. EN 197-1; Cement—Part 1: Composition, Specifications, and Conformity Criteria for Common Cements. European Committee for Standardization: Brussels, Belgium, 2011.
  51. Taylor, H.F.W. Cement Chemistry; Thomas Telford: London, UK, 1997. [Google Scholar]
  52. De Weerdt, K.; Haha, M.B.; Le Saout, G.; Kjellsen, K.O.; Justnes, H.; Lothenbach, B. Hydration mechanisms of ternary Portland cements containing limestone powder and fly ash. Cem. Concr. Res. 2011, 41, 279–291. [Google Scholar] [CrossRef]
  53. Shi, C.; Pavel, K.; Roy, D.M. Alkali-Activated Cements and Concretes; CRC Press: London, UK, 2003. [Google Scholar]
  54. Pol Segura, I.; Ranjbar, N.; Juul Damø, A.; Skaarup Jensen, L.; Canut, M.; Arendt Jensen, P. A review: Alkali-activated cement and concrete production technologies available in the industry. Heliyon 2023, 9, e15718. [Google Scholar] [CrossRef]
  55. Lothenbach, B.; Le Saout, G.; Gallucci, E.; Scrivener, K. Influence of limestone on the hydration of Portland cements. Cem. Concr. Res. 2008, 38, 848–860. [Google Scholar] [CrossRef]
  56. Sherwood, P.T. Soil Stabilization with Cement and Lime; HMSO: London, UK, 1993. [Google Scholar]
  57. Mustafa, Y.M.H.; Wudil, Y.S.; Zami, M.S.; Al-Osta, M.A. Machine Learning Approach for Assessment of Compressive Strength of Soil for Use as Construction Materials. Eng 2025, 6, 84. [Google Scholar] [CrossRef]
  58. Tukey, J.W. Exploratory Data Analysis; Addison-Wesley: Reading, MA, USA, 1977. [Google Scholar]
  59. Aggarwal, C.C. Outlier Analysis; Springer International Publishing AG: Cham, Switzerland, 2017. [Google Scholar]
  60. Maulud, D.; Abdulazeez, A.M. A Review on Linear Regression Comprehensive in Machine Learning. J. Appl. Sci. Technol. Trends 2020, 1, 140–147. [Google Scholar] [CrossRef]
  61. Hoerl, A.E.; Kennard, R.W. Ridge regression: Biased estimation for nonorthogonal problems. Technometrics 1970, 12, 55–67. [Google Scholar] [CrossRef]
  62. Tibshirani, R. Regression shrinkage and selection via the lasso. J. R. Stat. Soc. Ser. B (Methodol.) 1996, 58, 267–288. [Google Scholar] [CrossRef]
  63. Zou, H.; Hastie, T. Regularization and variable selection via the elastic net. J. R. Stat. Soc. Ser. B (Stat. Methodol.) 2005, 67, 301–320. [Google Scholar] [CrossRef]
  64. Breiman, L.; Friedman, J.; Stone, C.J.; Olshen, R.A. Classification and Regression Trees; CRC Press: Boca Raton, FL, USA, 1984. [Google Scholar]
  65. Breiman, L. Random forests. Mach. Learn. 2001, 45, 5–32. [Google Scholar] [CrossRef]
  66. Friedman, J.H. Greedy function approximation: A gradient boosting machine. Ann. Stat. 2001, 29, 1189–1232. [Google Scholar] [CrossRef]
  67. Chen, T.; Guestrin, C. XGBoost: A scalable tree boosting system. In Proceedings of the 22nd ACM SIGKDD International Conference on Knowledge Discovery and Data Mining, San Francisco, CA, USA, 13–17 August 2016; pp. 785–794. [Google Scholar] [CrossRef]
  68. Ke, G.; Meng, Q.; Finley, T.; Wang, T.; Chen, W.; Ma, W.; Ye, Q.; Liu, T.Y. LightGBM: A highly efficient gradient boosting Decision Tree. In Proceedings of the Advances in Neural Information Processing Systems, Long Beach, CA, USA, 4–9 December 2017; Volume 30, pp. 3146–3154. [Google Scholar]
  69. Prokhorenkova, L.; Gusev, G.; Vorobev, A.; Dorogush, A.V.; Gulin, A. CatBoost: Unbiased boosting with categorical features. In Proceedings of the Advances in Neural Information Processing Systems, Montréal, QC, Canada, 3–8 December 2018; Volume 31, pp. 6638–6648. [Google Scholar]
  70. Drucker, H.; Burges, C.J.; Kaufman, L.; Smola, A.J.; Vapnik, V. Support vector regression machines. In Proceedings of the Advances in Neural Information Processing Systems, Denver, CO, USA, 1–6 December 1997; Volume 9, pp. 155–161. [Google Scholar]
  71. Cover, T.; Hart, P. Nearest neighbor pattern classification. IEEE Trans. Inf. Theory 1967, 13, 21–27. [Google Scholar] [CrossRef]
  72. Rasmussen, C.E.; Williams, C.K.I. Gaussian Processes Machine Learning; MIT Press: Cambridge, MA, USA, 2006. [Google Scholar]
  73. Freund, Y.; Schapire, R.E. A decision-theoretic generalization of on-line learning and an application to boosting. J. Comput. Syst. Sci. 1997, 55, 119–139. [Google Scholar] [CrossRef]
  74. Delgado, M.F.; Sirsat, M.S.; Cernadas, E.; Alawadi, S.; Barro, S.; Febrero-Bande, M. An extensive experimental survey of regression methods. Neural Netw. 2019, 111, 11–34. [Google Scholar] [CrossRef]
  75. Vabalas, A.; Gowen, E.; Poliakoff, E.; Casson, A.J. Machine learning algorithm validation with a limited sample size. PLoS ONE 2019, 14, e0224365. [Google Scholar] [CrossRef]
  76. Xu, P.; Ji, X.; Li, M.; Lu, W. Small data machine learning in materials science. npj Comput. Mater. 2023, 9, 42. [Google Scholar] [CrossRef]
  77. Ghasemzadeh, H.; Hillman, R.E.; Mehta, D.D. Toward Generalizable Machine Learning Models in Speech, Language, and Hearing Sciences: Estimating Sample Size and Reducing Overfitting. J. Speech Lang. Hear. Res. 2024, 67, 753–781. [Google Scholar] [CrossRef]
  78. Bischl, B.; Binder, M.; Lang, M.; Pielok, T.; Richter, J.; Coors, S.; Thomas, J.; Ullmann, T.; Becker, M.; Boulesteix, A.; et al. Hyperparameter optimization: Foundations, algorithms, best practices, and open challenges. Wiley Interdiscip. Rev. Data Min. Knowl. Discov. 2023, 13, e1484. [Google Scholar] [CrossRef]
  79. Varma, S.; Simon, R.M. Bias in error estimation when using cross-validation for model selection. BMC Bioinform. 2006, 7, 91. [Google Scholar] [CrossRef]
  80. Cawley, G.C.; Talbot, N.L. On Over-fitting in Model Selection and Subsequent Selection Bias in Performance Evaluation. J. Mach. Learn. Res. 2010, 11, 2079–2107. [Google Scholar]
  81. Tsamardinos, I.; Rakhshani, A.; Lagani, V. Performance-Estimation Properties of Cross-Validation-Based Protocols with Simultaneous Hyper-Parameter Optimization. In Proceedings of the Artificial Intelligence: Methods and Applications, Ioannina, Greece, 15–17 May 2014; Likas, A., Blekas, K., Kalles, D., Eds.; Springer: Cham, Switzerland, 2014; pp. 1–14. [Google Scholar]
  82. Stephen Bates, T.H.; Tibshirani, R. Cross-Validation: What Does It Estimate and How Well Does It Do It? J. Am. Stat. Assoc. 2024, 119, 1434–1445. [Google Scholar] [CrossRef]
  83. Allgaier, J.; Pryss, R. Cross-Validation Visualized: A Narrative Guide to Advanced Methods. Mach. Learn. Knowl. Extr. 2024, 6, 1378–1388. [Google Scholar] [CrossRef]
  84. Akiba, T.; Sano, S.; Yanase, T.; Ohta, T.; Koyama, M. Optuna: A Next-generation Hyperparameter Optimization Framework. In Proceedings of the 25th ACM SIGKDD International Conference on Knowledge Discovery & Data Mining, KDD ’19, Anchorage, AK, USA, 4–8 August 2019; pp. 2623–2631. [Google Scholar] [CrossRef]
  85. Botchkarev, A. A New Typology Design of Performance Metrics to Measure Errors in Machine Learning Regression Algorithms. Interdiscip. J. Inf. Knowl. Manag. 2019, 14, 45–76. [Google Scholar] [CrossRef]
  86. Plevris, V.; Solorzano, G.; Bakas, N.; El, M.; Seghier, A.B. Investigation of performance metrics in regression analysis and machine learning-based prediction models. In Proceedings of the World Congress in Computational Mechanics and ECCOMAS Congress, Yokohama, Japan, 31 July–5 August 2022. [Google Scholar] [CrossRef]
  87. Chicco, D.; Warrens, M.J.; Jurman, G. The coefficient of determination R-squared is more informative than SMAPE, MAE, MAPE, MSE and RMSE in regression analysis evaluation. PeerJ Comput. Sci. 2021, 7, e623. [Google Scholar] [CrossRef]
  88. Moayedi, H.; Rezaei, A. An artificial neural network approach for under-reamed piles subjected to uplift forces in dry sand. Neural Comput. Appl. 2019, 31, 327–336. [Google Scholar] [CrossRef]
  89. Nemani, V.; Biggio, L.; Huan, X.; Hu, Z.; Fink, O.; Tran, A.; Wang, Y.; Zhang, X.; Hu, C. Uncertainty quantification in machine learning for engineering design and health prognostics: A tutorial. Mech. Syst. Signal Process. 2023, 205, 110796. [Google Scholar] [CrossRef]
  90. Abdar, M.; Pourpanah, F.; Hussain, S.; Rezazadegan, D.; Liu, L.; Ghavamzadeh, M.; Fieguth, P.; Cao, X.; Khosravi, A.; Acharya, U.R.; et al. A review of uncertainty quantification in deep learning: Techniques, applications and challenges. Inf. Fusion 2021, 76, 243–297. [Google Scholar] [CrossRef]
  91. Breiman, L. Bagging Predictors. Mach. Learn. 1996, 24, 123–140. [Google Scholar] [CrossRef]
  92. Palmer, G.; Du, S.; Politowicz, A.; Emory, J.P.; Yang, X.; Gautam, A.; Gupta, G.; Li, Z.; Jacobs, R.; Morgan, D. Calibration after bootstrap for accurate uncertainty quantification in regression models. npj Comput. Mater. 2022, 8, 115. [Google Scholar] [CrossRef]
  93. Psaros, A.F.; Meng, X.; Zou, Z.; Guo, L.; Karniadakis, G.E. Uncertainty quantification in scientific machine learning: Methods, metrics, and comparisons. J. Comput. Phys. 2023, 477, 111902. [Google Scholar] [CrossRef]
  94. Fang, K.; Kifer, D.; Lawson, K.; Shen, C. Evaluating the Potential and Challenges of an Uncertainty Quantification Method for Long Short-Term Memory Models for Soil Moisture Predictions. Water Resour. Res. 2020, 56, e2020WR028095. [Google Scholar] [CrossRef]
  95. Akoglu, H. User’s guide to correlation coefficients. Turk. J. Emerg. Med. 2018, 18, 91–93. [Google Scholar] [CrossRef]
  96. Eskisar, T. Influence of Cement Treatment on Unconfined Compressive Strength and Compressibility of Lean Clay with Medium Plasticity. Arab. J. Sci. Eng. 2015, 40, 763–772. [Google Scholar] [CrossRef]
  97. Wu, J.; Liu, L.; Deng, Y.; Zhang, G.; Zhou, A.; Wang, Q. Distinguishing the effects of cementation versus density on the mechanical behavior of cement-based stabilized clays. Constr. Build. Mater. 2020, 271, 121571. [Google Scholar] [CrossRef]
  98. Horpibulsuk, S.; Rachan, R.; Chinkulkijniwat, A.; Raksachon, Y.; Suddeepong, A. Analysis of strength development in cement-stabilized silty clay from microstructural considerations. Constr. Build. Mater. 2010, 24, 2011–2021. [Google Scholar] [CrossRef]
  99. Zhang, W.; Wu, C.; Zhong, H.; Li, Y.; Wang, L. Prediction of undrained shear strength using extreme gradient boosting and random forest based on Bayesian optimization. Geosci. Front. 2021, 12, 469–477. [Google Scholar] [CrossRef]
  100. Zhang, Q.; Wang, L.; Gu, H. Having Deep Investigation on Predicting Unconfined Compressive Strength by Decision Tree in Hybrid and Individual Approaches. Int. J. Adv. Comput. Sci. Appl. 2024, 15, 127–140. [Google Scholar] [CrossRef]
  101. Hoque, M.I.; Hasan, M.; Islam, M.S.; Houda, M.; Abdallah, M.; Sobuz, M.H.R. Machine Learning Methods to Predict and Analyse Unconfined Compressive Strength of Stabilised Soft Soil with Polypropylene Columns. Cogent Eng. 2023, 10, 2220492. [Google Scholar] [CrossRef]
  102. Kim, M.; Senturk, M.A.; Li, L. Compression Index Regression of Fine-Grained Soils with Machine Learning Algorithms. Appl. Sci. 2024, 14, 8695. [Google Scholar] [CrossRef]
  103. Zhou, J.; Li, E.; Wei, H.; Li, C.; Qiao, Q.; Armaghani, D.J. Random Forests and Cubist Algorithms for Predicting Shear Strengths of Rockfill Materials. Appl. Sci. 2019, 9, 1621. [Google Scholar] [CrossRef]
  104. Gao, W. The Application of Machine Learning in Geotechnical Engineering. Appl. Sci. 2024, 14, 4712. [Google Scholar] [CrossRef]
  105. Kraszewski, C.; Rafalski, L.; Gajewska, B. Effect of Compaction Ratio on Mechanical Properties of Low-Strength Hydraulically Bound Mixtures for Road Engineering. Materials 2022, 15, 1561. [Google Scholar] [CrossRef]
Figure 1. Sample preparation: (a) Soil mixture in plastic bags. (b) Triaxial load frame Tritech (model 28-WF4005, Controls S.p.A., Milan, Italy) used to compact the soil. (c) Cylindrical samples. (d) Curing in desiccator.
Applsci 15 07022 g001
Figure 2. Experimental setup and failure patterns of UCS tests: (a) Initial setup for specimens subjected to axial loads below 2.5 kN. (b) Initial setup for specimens subjected to axial loads exceeding 2.5 kN. (c) Failure mode of specimens loaded below 2.5 kN, showing macro-cracking and deformation patterns. (d) Failure mode of specimens loaded above 2.5 kN, illustrating shear plane inclination and structural disintegration.
Applsci 15 07022 g002
Figure 3. Sequence diagram illustrating the ML methodology.
Applsci 15 07022 g003
Figure 4. Boxplot of UCS values showing the statistical distribution of measurements. The central box represents the interquartile range (Q1 to Q3), with the horizontal line indicating the median value. Vertical lines (whiskers) extend to show the range of data within 1.5 times the interquartile range. Individual blue dots represent all measured data points, providing visualization of data density and distribution patterns.
Applsci 15 07022 g004
Figure 5. Heat maps of correlation coefficients using three different methods: (a) Pearson. (b) Kendall. (c) Spearman.
Applsci 15 07022 g005
Figure 6. Consolidated UCS analysis: effect of cement content and curing time. The red circles indicate statistical outliers, defined as values falling outside 1.5 times the interquartile range from the box edges.
Applsci 15 07022 g006
Figure 7. Effect of compaction rate on UCS values for cement-treated soil across cement contents (increasing top-to-bottom) and curing times (increasing left-to-right). The red circles indicate statistical outliers, defined as values falling outside 1.5 times the interquartile range from the box edges.
Applsci 15 07022 g007
Figure 8. Performance analysis of primary Random Forest model for central UCS prediction: (a) UCS predicted vs. measured values. (b) Distribution of prediction errors (actual minus predicted UCS values) showing model accuracy. The red dashed vertical line indicates zero error (perfect prediction), while the blue curve represents the fitted normal distribution overlaid on the histogram. The near-zero-centered distribution demonstrates minimal systematic bias in the model predictions. (c) Residual plot showing the relationship between predicted UCS values and prediction residuals. Blue dots represent individual data points, and the red dashed horizontal line indicates zero residual. The random scatter around zero with no apparent patterns confirms that the model adequately captures the underlying relationships without systematic prediction bias across the range of UCS values. (d) Relative importance of input variables.
Applsci 15 07022 g008
Figure 9. Performance analysis of uncertainty Random Forest model for error magnitudes prediction: (a) Actual vs. predicted absolute error. (b) Distribution of prediction errors (actual absolute error minus predicted absolute error). The red dashed vertical line indicates zero error (perfect uncertainty prediction), while the orange solid curve represents the fitted probability distribution overlaid on the histogram. The near-zero-centered distribution confirms that the uncertainty model provides unbiased estimates of prediction reliability. (c) Residual plot showing the relationship between predicted absolute errors and residuals (actual minus predicted absolute error). Orange dots represent individual data points, and the red dashed horizontal line indicates zero residual. The random distribution around zero demonstrates that the uncertainty model accurately captures the magnitude of prediction errors without systematic bias. (d) Relative importance of input variables.
Applsci 15 07022 g009
Figure 10. Calibration assessment of uncertainty quantification system performance: (a) Empirical vs. predicted coverage reliability. (b) Quantitative calibration quality scores.
Applsci 15 07022 g010
Figure 11. Enhanced SHAP dependence analysis showing binned effects of individual parameters on UCS predictions: (a) Curing period. (b) Compaction rate. (c) Cement content.
Applsci 15 07022 g011
Figure 12. SHAP feature importance and impact direction analysis for the primary Random Forest model. Each point represents a prediction instance, with colors indicating feature values (red = high; blue = low) and horizontal position showing the impact magnitude and direction on UCS predictions. The vertical ordering reflects overall feature importance.
Applsci 15 07022 g012
Figure 13. SHAP waterfall analysis demonstrating parameter contributions to moderate strength predictions.
Applsci 15 07022 g013
Figure 14. SHAP waterfall analysis demonstrating parameter contributions to high strength predictions.
Applsci 15 07022 g014
Table 1. Chemical composition (%) of Portland cement type CEM II/B-M(S-LL) 42.5 R.
CaO SiO 2 Al 2 O 3 Fe 2 O 3 MgO Na 2 O K 2 O SO 3
56.219.87.13.61.20.380.692.9
Table 2. Cement–soil mix samples prepared by static compaction for experimentation.
Sample
Preparations
Compaction
Velocities (mm/min)
Cement Percentages (%)
2.557.510
For 24 h1.253433
1.03344
0.753334
For 7 days1.254444
1.04444
0.754444
For 14 days1.253434
1.04444
0.753343
For 28 days1.253343
1.03343
0.754334
Overall Samples Used for Tests41424444
171
Table 3. Model performance grouped by algorithm type.
ModelMSERMSEMAER2
Linear Methods
Linear Regression229,558.94479.12405.850.8390
Ridge229,731.25479.3406.750.8388
Lasso229,581.38479.15406.160.8389
ElasticNet345,532.78587.82516.760.7576
Tree-Based Methods
Decision Tree83,397.33288.79201.920.9415
Random Forest70,209.46264.97178.980.9507
Gradient Boosting64,004.83252.99171.50.9551
XGBoost83,396.61288.78201.920.9415
LightGBM72,716.76269.66181.410.9490
CatBoost81,478.5285.44200.550.9428
Ada Boost84,803.66291.21193.610.9405
Other Non-Linear Methods
SVR1,403,743.361184.81018.60.0152
KNN83,397.33288.79201.920.9415
Gaussian Process83,397.3288.79201.920.9415
Table 4. Cross-validated performance metrics of optimized models.
ModelR2 (Mean ± Std)RMSE (kPa)MAE (kPa)MAPE (%)
Random Forest0.9471 ± 0.0120291.23 ± 39.00186.17 ± 19.828.67 ± 0.87
Gradient Boosting0.9488 ± 0.0131286.23 ± 43.45191.08 ± 21.1611.57 ± 1.86
XGBoost0.9467 ± 0.0171289.89 ± 48.21195.04 ± 29.489.73 ± 1.45
Table 5. Optimal hyperparameter configurations for machine learning models used in UCS prediction.
HyperparameterRandom ForestGradient BoostingXGBoost
n_estimators261289277
max_depth547
min_samples_split6--
min_samples_leaf2--
learning_rate-0.0120.173
min_child_weight--3
subsample-0.9630.866
colsample_bytree--0.820
random_state424242
Disclaimer/Publisher’s Note: The statements, opinions and data contained in all publications are solely those of the individual author(s) and contributor(s) and not of MDPI and/or the editor(s). MDPI and/or the editor(s) disclaim responsibility for any injury to people or property resulting from any ideas, methods, instructions or products referred to in the content.

