Article

Research on Control Technology of Large-Section Water-Bearing Broken Surrounding Rock Roadway

School of Resource Environment and Safety Engineering, Hunan University of Science and Technology, Xiangtan 411201, China
*
Author to whom correspondence should be addressed.
Appl. Sci. 2025, 15(13), 7011; https://doi.org/10.3390/app15137011 (registering DOI)
Submission received: 15 May 2025 / Revised: 11 June 2025 / Accepted: 20 June 2025 / Published: 21 June 2025
(This article belongs to the Special Issue Advances and Challenges in Rock Mechanics and Rock Engineering)

Abstract

:
With the increasing depth of mining operations, the geological conditions of deep roadways have become increasingly complex. Among these complexities, the issues of fractured zones and groundwater are particularly critical, significantly contributing to the reduced stability of the surrounding rock. This study focuses on the challenging support problem associated with water-bearing fractured surrounding rock in the Y1# belt conveyor roadway of the Wengfu phosphate mine. Through theoretical calculation, laboratory testing, numerical simulation, and field monitoring, the range and displacement of the broken zone in the broken surrounding rock roadway are studied and analyzed. The results show that the physical and mechanical properties of the broken surrounding rock mass are weakened by water, and the range and deformation of the broken zone of the surrounding rock of the water-bearing roadway increase. In response to the failure characteristics of the water-bearing fractured surrounding rock in the Y1# belt conveyor roadway, an optimized support scheme was developed. A combined support system of steel arch frames and localized grouting was proposed to enhance the control of the surrounding rock. Field monitoring data confirmed that the optimized support scheme achieved satisfactory control effectiveness, effectively addressing the stability challenges posed by water-bearing fractured rock masses.

1. Introduction

As global mineral resource exploitation increasingly extends into deeper underground spaces, large-section deep roadway engineering faces significant challenges posed by complex geomechanical environments characterized by high ground stress, elevated seepage pressure, and fractured surrounding rock masses. In particular, within water-bearing fractured strata, physicochemical interactions between water and rock can lead to argillization and deterioration, strength softening, and the destabilization of seepage in surrounding rocks. Traditional rigid support systems often struggle to adapt to these dynamic damage evolution processes, frequently resulting in substantial structural deformation, localized cavity collapse, and even global instability, which severely limits safe deep resource extraction.
As one of the most active agents in the geological environment, the interaction between water and rock profoundly influences the physical and mechanical properties, as well as the engineering stability, of rock masses. Water directly weakens the shear and compressive strength of rocks by increasing pore pressure (thereby reducing effective stress) and lubricating mineral particles (which diminishes cohesion) [1,2,3]. Consequently, when addressing roadways with complex geological conditions, such as those involving water-bearing, fractured surrounding rock, traditional passive support methods—such as bolting, shotcrete support, and steel arch support—often encounter technical challenges. These challenges include uneven stress distribution in the support structure, insufficient activation of the surrounding rock’s self-bearing capacity, and difficulties in ensuring long-term stability. In recent years, advancements in the New Austrian Tunneling Method (NATM) and the use of high-strength support materials have led to the innovative concept of a cooperative bearing mechanism between surrounding rock and support systems, as well as a yield pressure-controllable support system. This development offers a new research direction for managing fractured surrounding rock. Liu Weitao et al. carried out the nonlinear seepage experiment of fractured rock mass and then established the criterion of water inrush risk based on nonlinear critical pressure gradient and obtained a quantitative method of water inrush risk by coupling the internal structure parameters of fractured rock mass and the flow state parameters of groundwater [4]. Based on the Drucker–Prager yield criterion, Liu et al. applied the theory of elastoplastic mechanics to explore the influence of different intermediate principal stresses on the surrounding rock of circular roadway under seepage. It was found that the critical water pressure calculation result of the Drucker–Prager yield criterion, considering intermediate principal stress, can better reflect the multi-axial mechanical properties of rock [5]. Aiming to address the challenge that existing rock brittleness indices—which are based on stress–strain curves—face in accurately characterizing the brittleness attenuation behavior of hydrous granite, Cao Yangbing et al. propose a new index, Bd. By integrating the characteristic parameters of the entire stress–strain curve, specifically peak strain, post-peak stress drop rate, and strain growth rate, this new index comprehensively characterizes both pre-peak and post-peak brittleness characteristics, providing distinct advantages over other brittleness indices [6]. Zhang Erfeng et al. investigated the damage and deterioration behavior of argillaceous siltstone at varying water contents through triaxial compression tests. By employing the Weibull distribution alongside the test results, they developed a statistical damage-constitutive model to analyze the effects of water on rock under high-stress conditions [7]. Hashiba conducted uniaxial tensile tests on granite and tuff under both dry and saturated conditions. The test results indicated that the slope and strength of the stress–strain curve for the rock specimens in the saturated state were lower than those of the dry rock specimens during the initial stage [8]. Through the tensile test of rocks with different water contents in Turkey, Karakul found that the strength of rocks decreased with the increase in water content [9]. Through experimental research, Song Haoran et al. showed that the evolution of acoustic emission parameters (b value and S value) of argillaceous siltstone in different water-bearing states had differences in failure stages. When the water content exceeded 1.0458%, the deterioration was significant. The mutation characteristics can be used as a precursor of instability, and the constitutive model based on continuous damage theory is highly consistent with the experimental curve [10]. Based on the two-parameter Weibull distribution, Zhang Zhainan et al. established the coupled damage evolution equation of sandstone under water content and load through uniaxial cyclic loading and unloading, as well as XRD and SEM tests, and obtained the deformation characteristics and damage evolution law of sandstone with different water contents under different cycles [11]. Bai Zhaoyang et al. revealed the stability evolution law of water-bearing mine rock mass under stress–seepage coupling through cyclic loading and unloading tests: the increase in osmotic pressure significantly shortens the rock failure cycle and aggravates the damage degree. The coupling damage model based on the cumulative D-P criterion can effectively characterize the seepage–stress synergistic degradation mechanism, which provides theoretical support for the stability evaluation and support optimization of mine rock mass [12]. Liu Gang obtained the damage and failure mechanism of meso-scale mine roadway under the combined influence of stress heterogeneity and hydraulic weakening through similar simulation experiments. The evolution of internal stress field and the spatial distribution of the plastic zone in saturated sandstone with pore defects were analyzed by numerical simulation, which provided valuable guidance for the surrounding rock control of water seepage roadway under non-uniform loading conditions [13]. Zhu Yinge established a numerical model of seepage through laboratory experiments and theoretical derivation and discussed that the complexity of pore structure in porous media leads to uneven distribution of flow velocity and pressure in the medium. At the same time, with the change in physical properties, the flow characteristics of the fluid have also changed significantly, which provides effective guidance for pore water plugging [14]. Yuan Chao used the combination of theory, numerical simulation analysis, and field analysis to analyze the distribution characteristics of the plastic zone of the roadway-surrounding rock and studied the influence of the lateral pressure coefficient, cohesion, and the internal friction angle on the plastic zone [15]. Based on the Mohr–Coulomb criterion and elastoplastic constitutive model, Zareifard et al. derived the displacement and stress of roadway-surrounding rock under hydrostatic pressure and obtained the relationship between the softening parameters of the rock mass and the plastic zone of the roadway-surrounding rock under example analysis [16]. Peng Wenqing et al., based on the theory of Castner and Kirs, constructed a mechanical model of circular roadway-surrounding rock partition considering the effect of support resistance under non-hydrostatic pressure. Through theoretical derivation, the stress field distribution characteristics of the broken zone and plastic zone of the surrounding rock and the closed analytical solution of its spatial influence range were obtained [17]. Under the combined effects of mining and water spraying, Xie Panshi et al. investigated the failure of the anchoring agent in the surrounding rock of the roadway and the weakening of the anchoring force of the anchor cable. Through similar testing, numerical simulations, and field surveys, they analyzed the instability characteristics of the surrounding rock. Based on their findings, they proposed an optimization scheme for support that involves increasing the length of the anchor cable to achieve improved support effectiveness [18]. Kunpeng Yu et al. conducted an analysis of the non-uniform deformation mechanisms affecting the surrounding rock of weak roadways through field tests, numerical simulations, and orthogonal tests. Based on the results obtained from the numerical simulations, they proposed a combined support method aimed at enhancing the stability of the surrounding rock in soft rock roadways [19]. Through the theories of Kastner and others, Wang Weijun and his colleagues analyzed the relationship between support resistance and the deformation of surrounding rock in roadways under high ground stress. They addressed the issue of significant deformation in the surrounding rock of deep roadways and proposed a step-by-step combined support scheme that effectively enhanced the stability of the surrounding rock in these roadways [20]. Some scholars have proposed an improved support optimization scheme for roadway support in water-bearing weak surrounding rock, based on comprehensive analysis and research [21,22].
The aforementioned research has made significant progress in understanding the deformation and failure modes, as well as the support technologies for the water-bearing, fractured surrounding rock in underground engineering. Numerous effective support schemes have been proposed and successfully implemented in engineering practice. However, there remains a lack of theoretical frameworks concerning the construction of a surrounding rock control theory system and the coupling mechanisms of pore water pressure and surrounding rock in water-bearing strata. Consequently, this paper focuses on the Y1 belt conveyor roadway of the 830 working face Y1 in the underground mining area of the Yingping deep phosphate mine at the Wengfu phosphate mine as the engineering context. It investigates issues related to surrounding rock deformation, side collapse, and the stability of supporting structures during the construction of roadways in water-bearing layers. There is an urgent need to systematically explore the coupling mechanisms of the surrounding rock–support synergy. By developing a dynamic constraint model for discontinuous deformation rock masses and supporting structures, this study aims to enhance the spatial locking effect of the support system on the extended boundaries of the fractured zone. This approach seeks to achieve precise control over the extent of the surrounding rock damage and to ensure long-term stability maintenance.

2. Engineering Summary and Analysis of Surrounding Rock Failure Characteristics

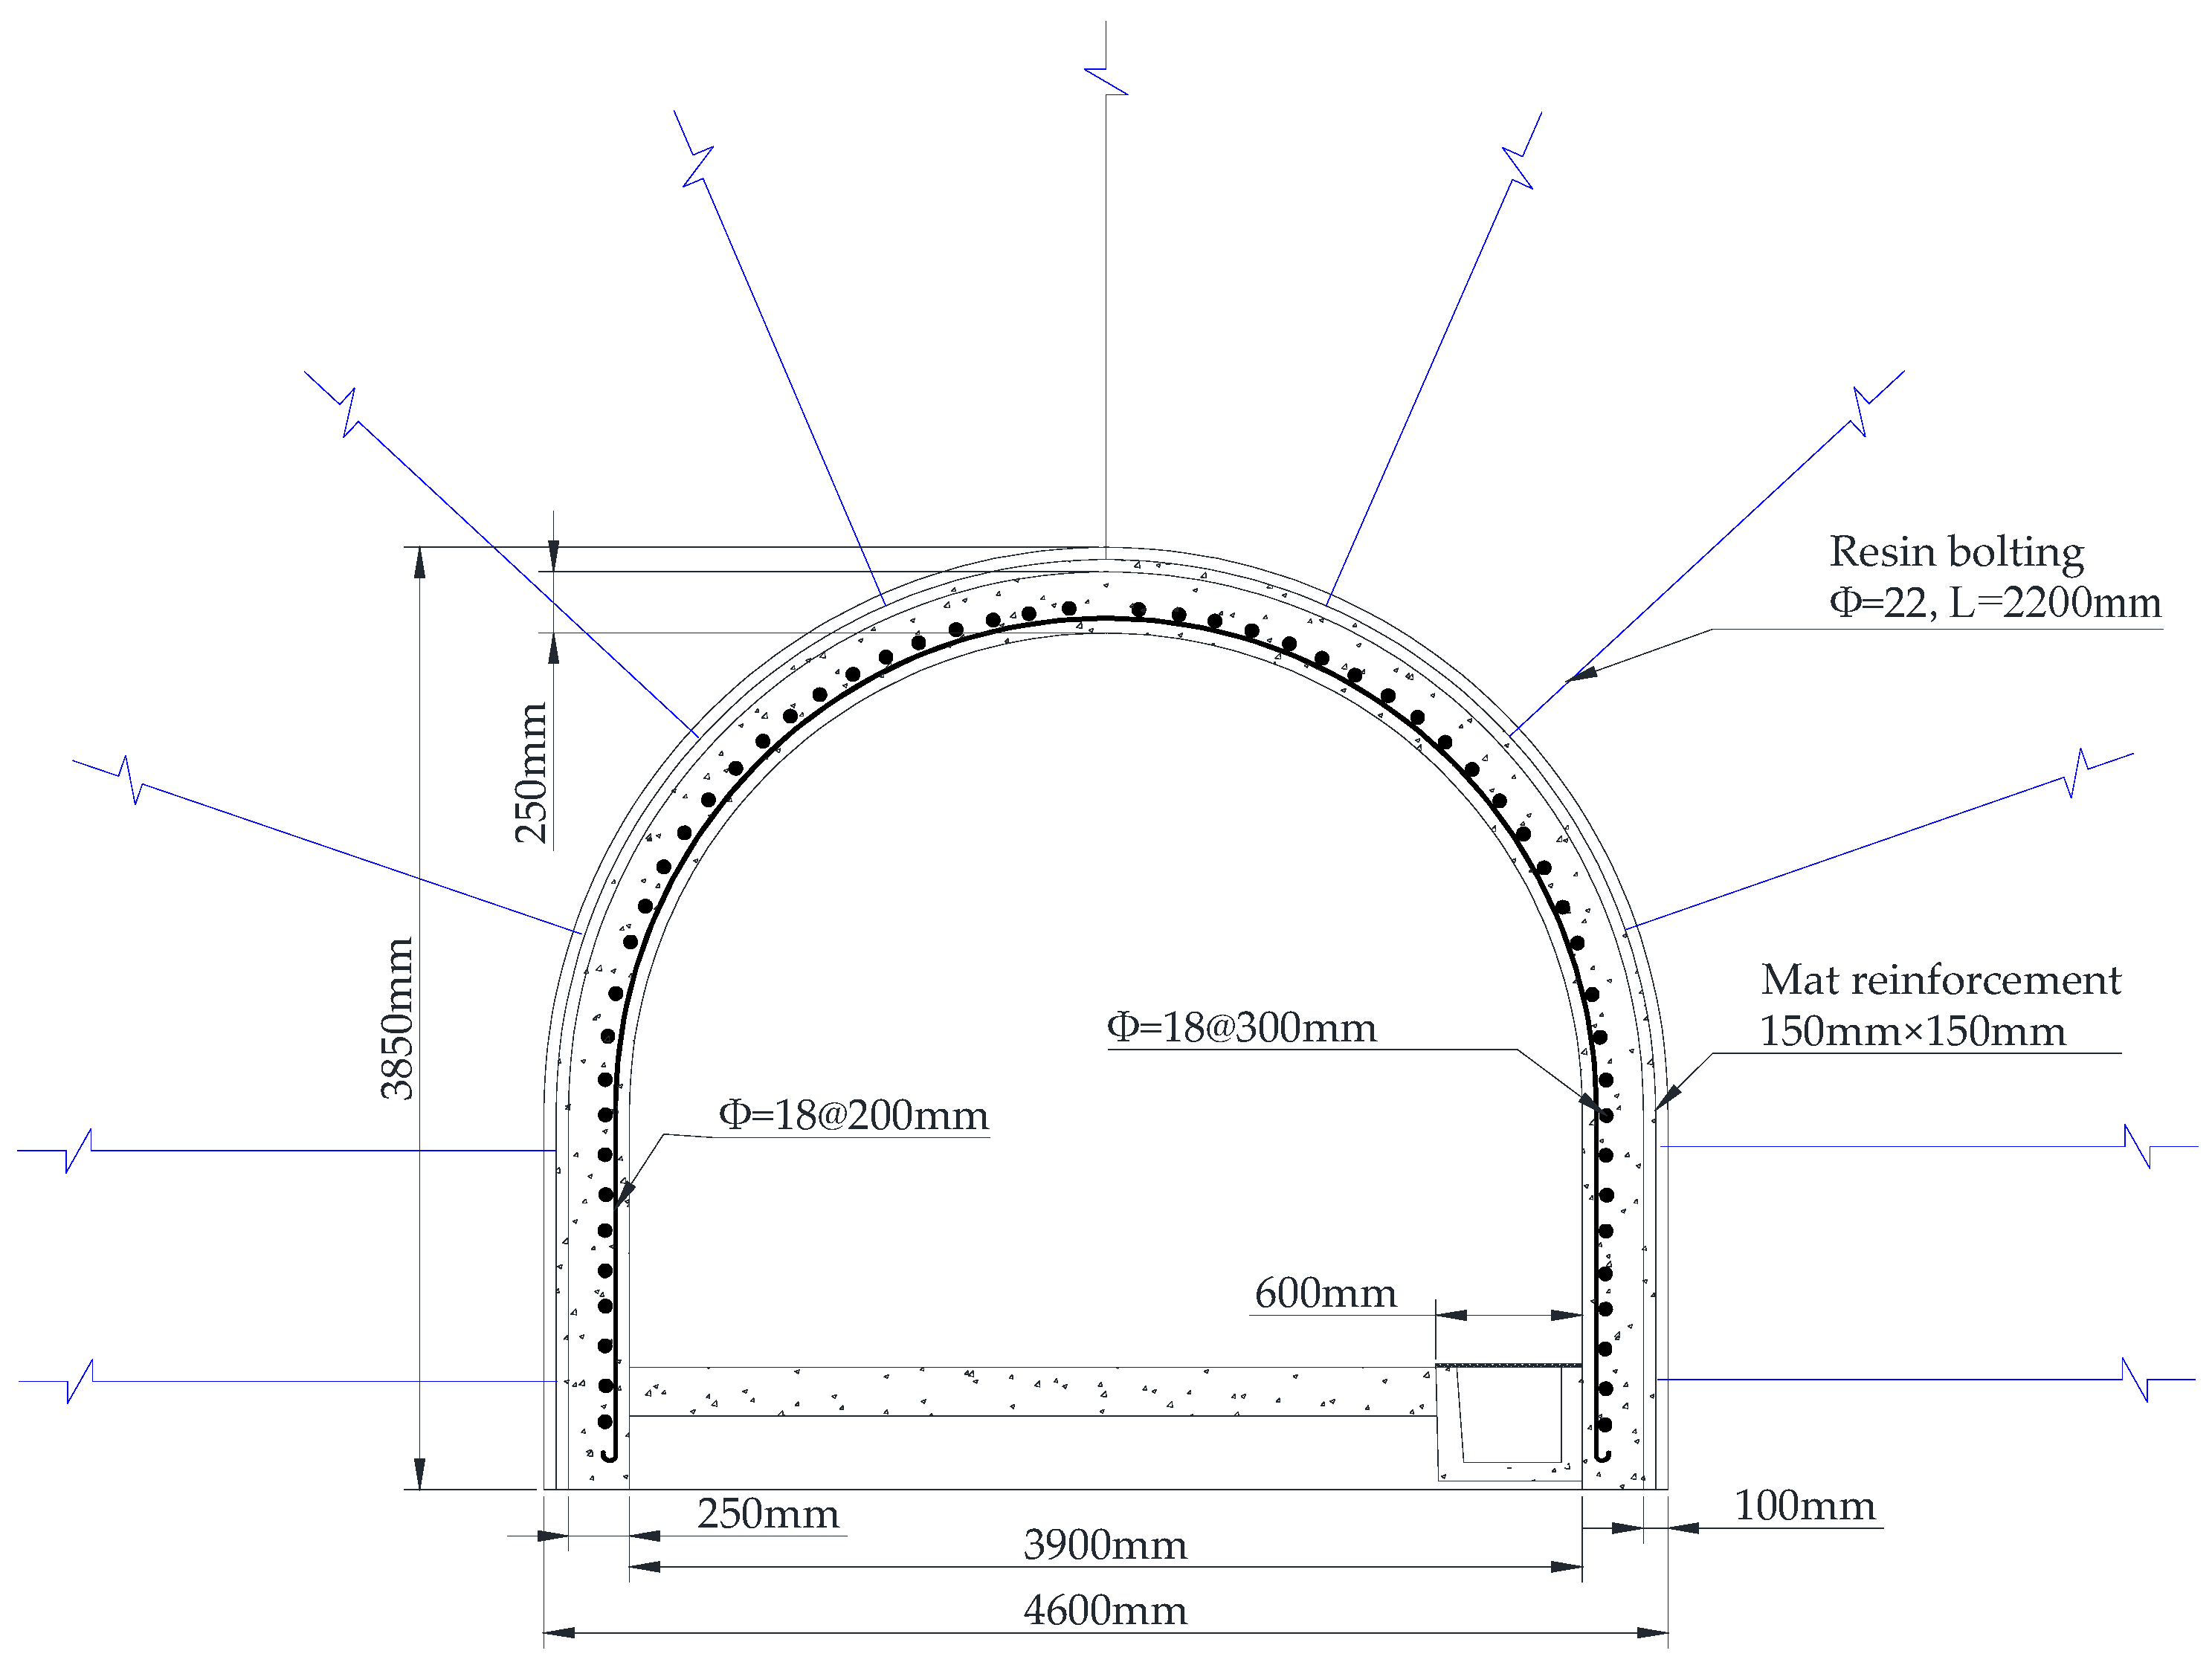
2.1. Engineering Summary

The focus of this research paper is the Y1# belt conveyor roadway located at the 830 working face of the deep underground mining area of the Yingping mining site, which is part of the Gaoping mining area within the Wengfu phosphate mine. The stratum in which the Y1# belt transport roadway is situated belongs to the Sinian Qingshuijiang formation, characterized by gray-black slate with an argillaceous structure. The layers are thin to medium-thick, and the core predominantly exhibits long columnar and columnar forms. The rock is mechanically fragmented along existing cracks, and the joints are well developed. This formation contains bedrock fissure water and acts as a relative aquiclude, with exposure ranging from 266.06 to 381.89 m. The average core recovery rate for the entire section is 98.32%, while the average rock quality designation (RQD) is 65%. The Y1# roadway features numerous folds, small faults, and weak interlayers, resulting in an unstable rock structure. The total length of the Y1# belt conveyor roadway is 1200 m, with the research segment of this paper covering 853 m. The burial depth is 385 m, the excavation cross-sectional area is 15.45 m2, and the net section measures 10.63 m2. The shape of the roadway cross-section is a straight wall arch, with excavation dimensions of 4.6 × 3.85 m. The surrounding rock is primarily classified as grade IV, and the excavation method employed is artificial drilling and blasting.

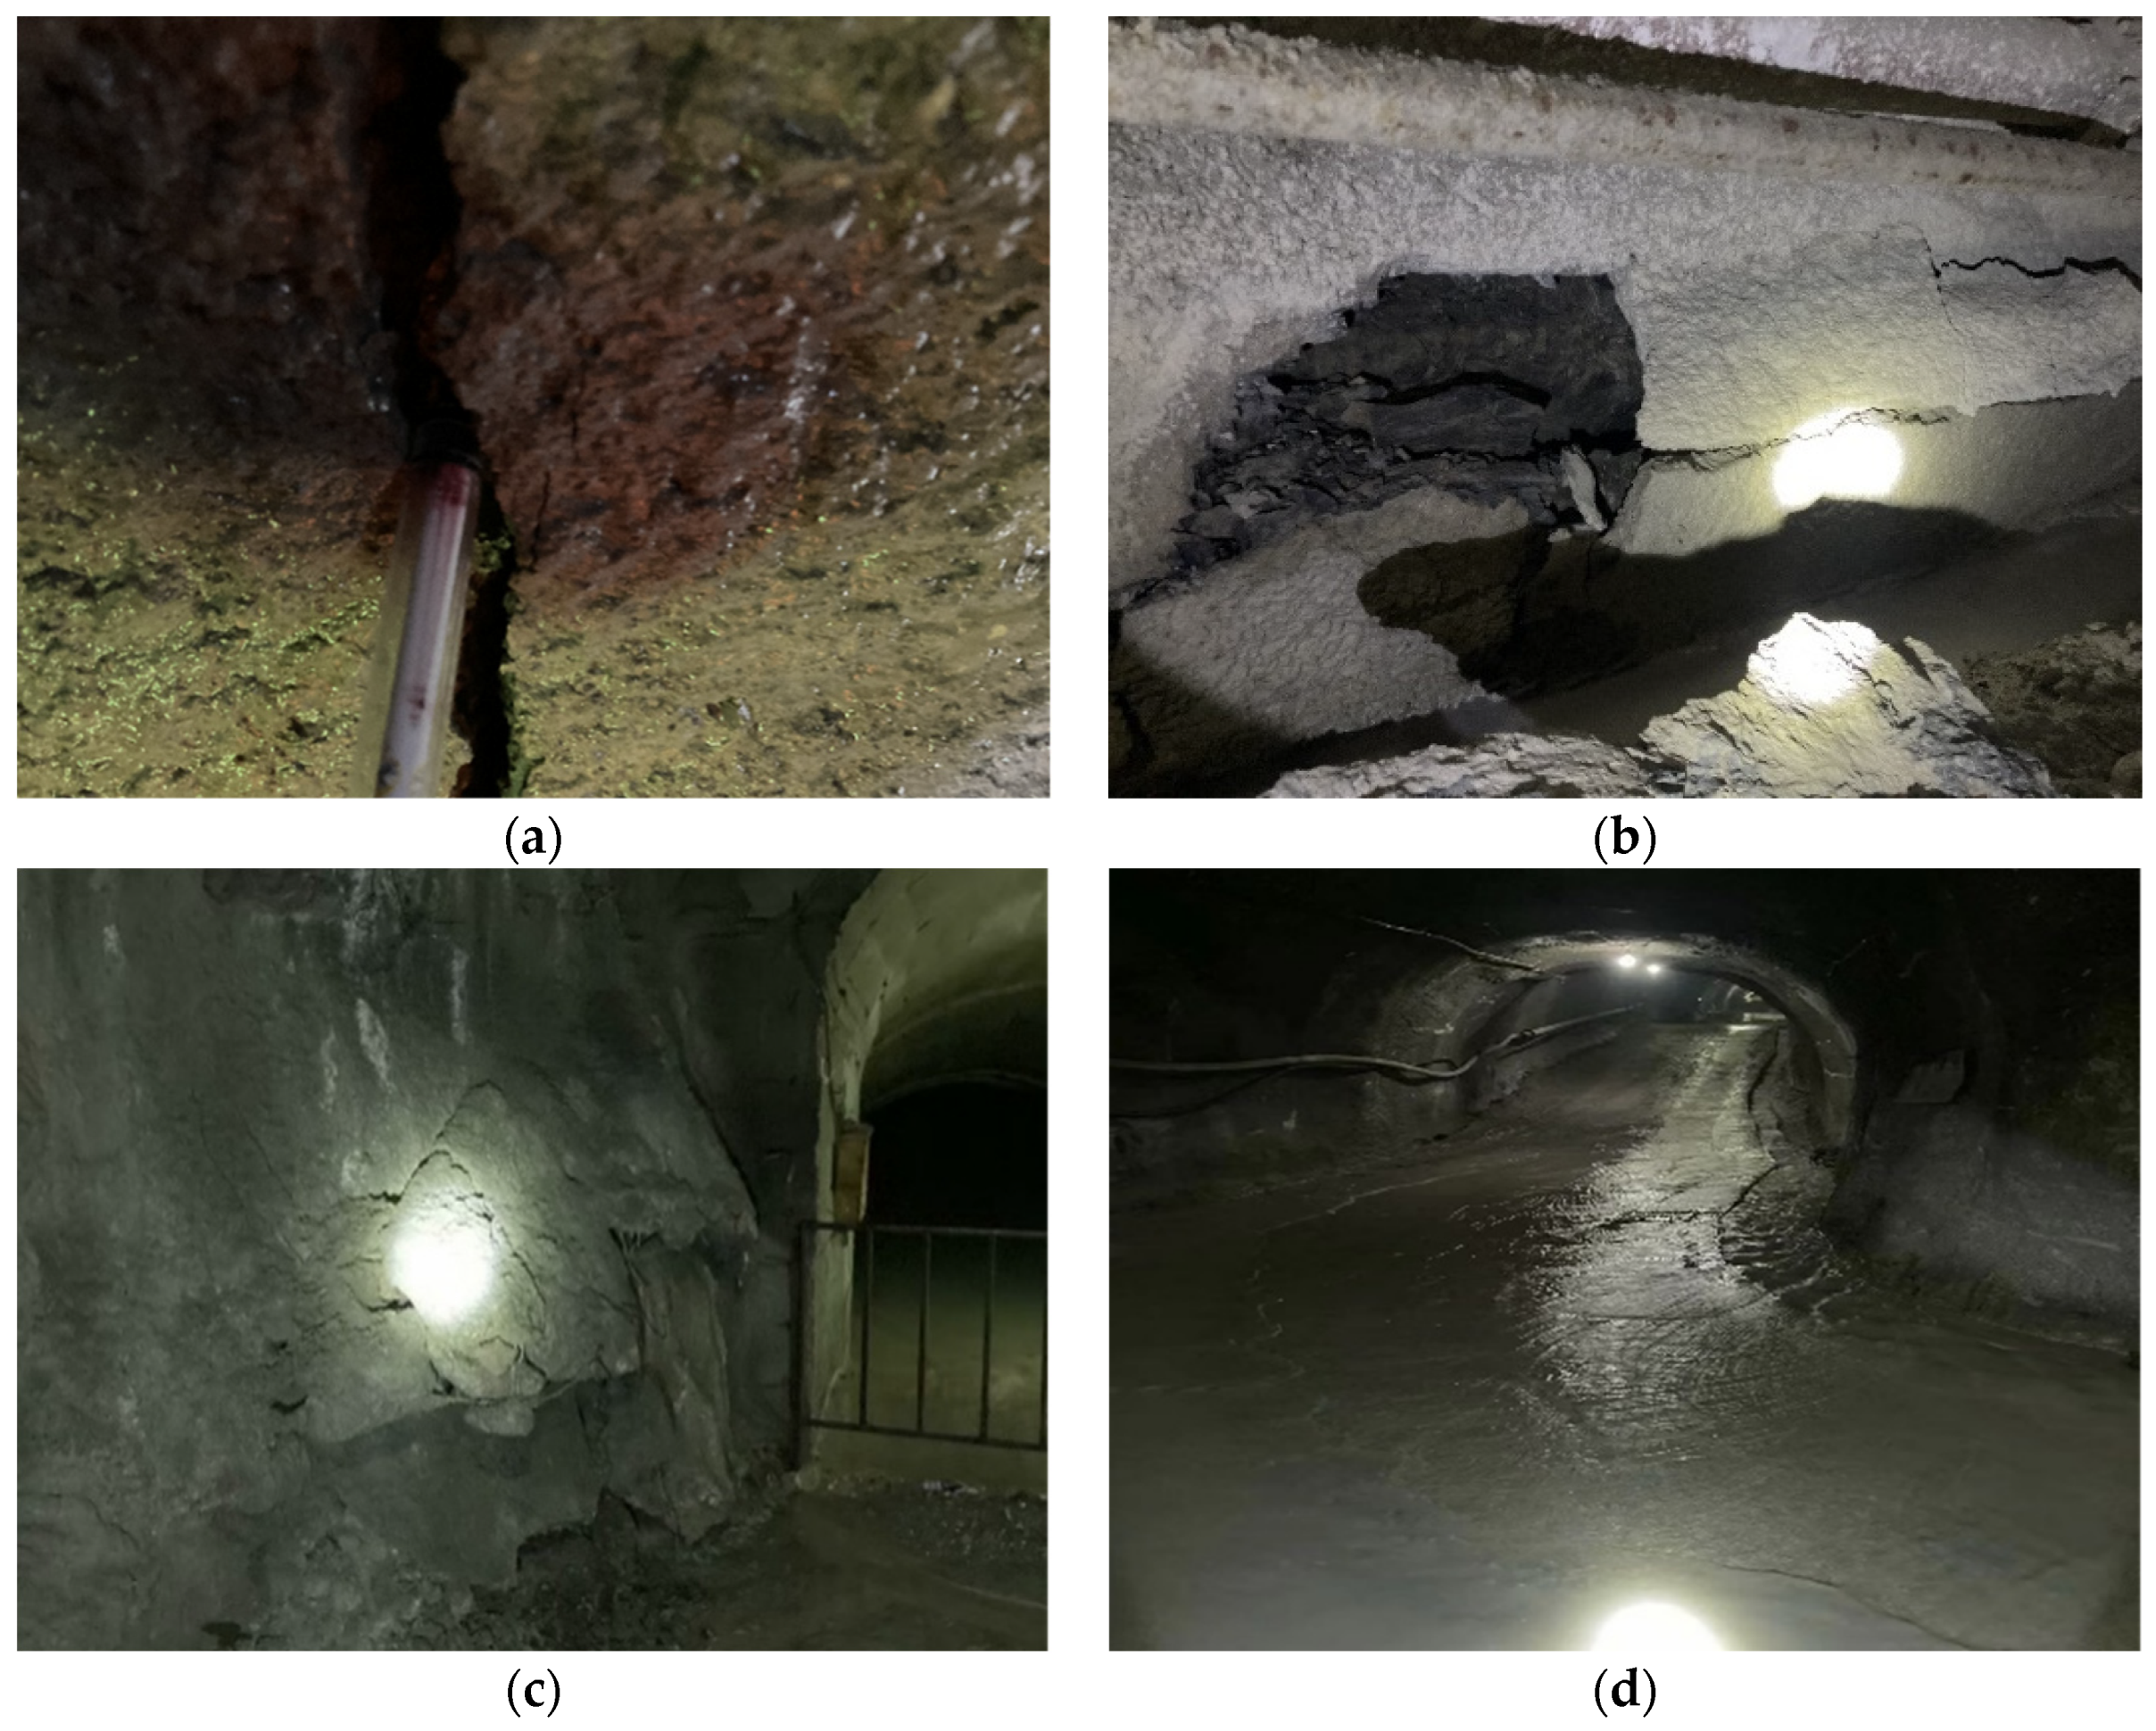
2.2. Analysis of Failure Characteristics of Surrounding Rock of Roadway

The original support scheme for the roadway is illustrated in Figure 1. This scheme employs a combination of resin bolts, steel mesh, and shotcrete for support. Specifically, the resin bolts have a diameter of 22 mm and a length of 2200 mm, constructed from HRB400 threaded steel bars. The borehole diameter is 42 mm, with a row spacing of 1000 mm by 1000 mm, arranged in a plum blossom pattern. The anchor bolt tray is fabricated from a Q235 steel plate, with a thickness of 10 mm and dimensions of 150 mm by 150 mm. The anchoring section of the anchor bolt features full-length anchoring. The shotcrete used has a strength classification of C20, with an initial application thickness of 50 mm, followed by an additional 50 mm for re-spraying. The allowable range for over-excavation is +150 mm.
During the field investigation, it was discovered that the section of the Y1# belt transportation roadway from K0 + 300 to K0 + 331 is located near a fault zone. The surrounding rock features argillaceous interlayers and exhibits numerous small folds, resulting in a poorly formed roadway. The geological structure and faulting have led to the development of multiple cracks and collapses in the surrounding rock lining of the roadway, posing a significant risk of roof falls. Notably, there are several instances of lining cracks and water seepage at the vault and both sides of the roadway. Prolonged water seepage can lead to the release of pore water pressure, which severely compromises the stability of the surrounding rock in the roadway, as illustrated in Figure 2.
The support provided by the anchor net spray has highlighted the instability of the surrounding rock in the roadway, which has been further exacerbated by groundwater erosion. Therefore, it is essential to analyze and understand the mineral composition and lithological characteristics of the rock mass structure, considering both the surrounding rock environment and its inherent strength. This analysis will facilitate the development of a more rational and effective support scheme, ultimately aiming to prevent roadway accidents.

3. Analysis of Influence Range and Displacement of Roadway Surrounding Rock Fracture Zone Under Pore Water Pressure

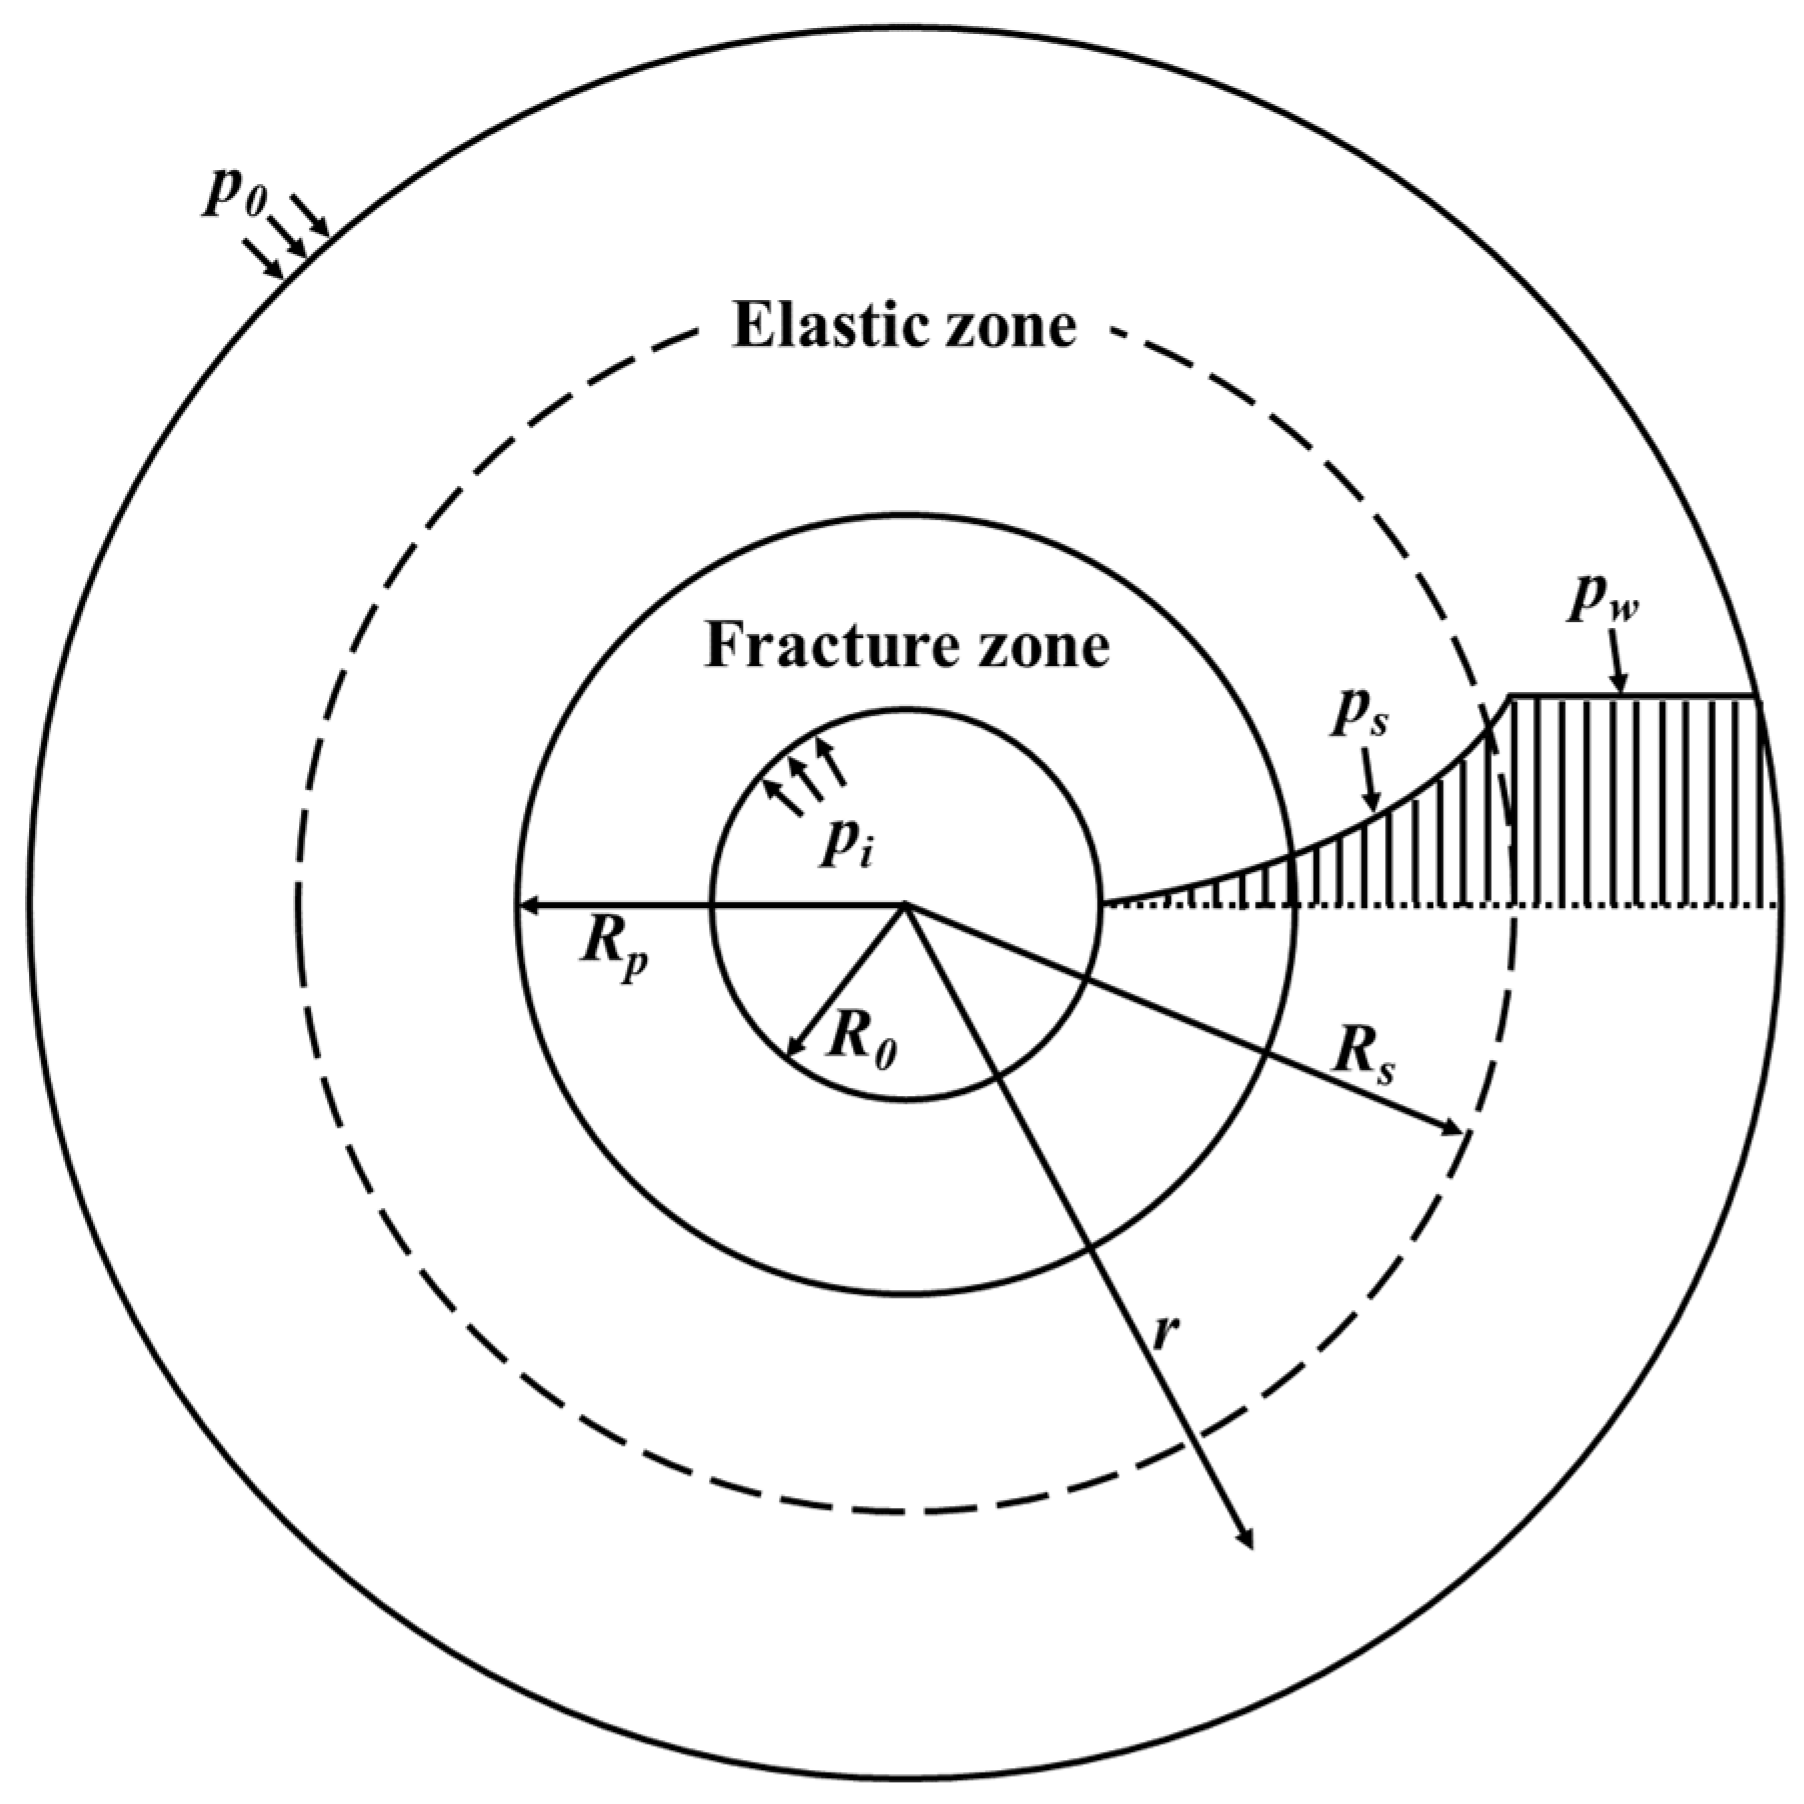
3.1. Theoretical Model Establishment and Analysis of Roadway

Before analyzing the elastic–plastic distribution of the surrounding rock in a roadway influenced by pore water pressure, the following assumptions must be established: (1) the roadway excavation creates both a broken zone and an elastic zone; (2) the roadway is located at a depth greater than 20 times its radius; (3) the surrounding rock is considered an isotropic, homogeneous medium, with the original rock stress being equal in all directions; (4) the roadway cross-section is circular, its length is infinite, the properties of the surrounding rock are uniform, and the problem can be treated as a plane strain scenario; (5) groundwater flow adheres to Darcy’s law; (6) the seepage volume force in the mechanical model is represented by pore water pressure.
The theoretical model is established under the assumption that the radius of the deeply buried circular roadway is R0, the radius of the broken zone is Rp, the radius of the pore water pressure is Rs, and r is the radial distance of any point in the surrounding rock. When rRs, the pore water pressure is pw, and the pore water pressure within Rs is represented as Ps, which varies with r. Additionally, p0 represents the original rock stress. The theoretical geometric model is illustrated in Figure 3. This scenario is classified as an axisymmetric seepage problem, and the equation for the seepage pore water pressure field is derived from seepage theory, as follows:
p s = p w r R s p w ln r / R s ln R s / R 0 R 0 r < R s
In the roadway model, it is not only affected by the stress of the original rock but also by the seepage volume force. The known seepage differential equation and its boundary conditions are as follows:
2 H r 2 + 1 r H r = 0 H r = h 0 , r = R 0 H r = h w , r = δ R 0
From the above equation, the water pressure can be expressed as follows:
H r = h 0 ln ω R 0 / r + h w ln r / R 0 ln ω
The water pressure is converted into a seepage volume force acting inside the model, and its expression can be changed into the following:
F r = η h 0 h w r ln ω ξ w
Therefore, the equilibrium differential equation under the action of osmotic body force is as follows:
d σ r d r + σ r σ θ r + F r = 0
In the equation, h0 is the surface water head of roadway-surrounding rock, hw is the water head of the distant water surface, ξw is the weight of water, and ω is the multiple of the equivalent radius of the roadway.
In the early stage of roadway excavation, the water head h0 on the inner surface of roadway-surrounding rock is set to be 0. At this time, the water head potential energy difference is generated between the inner surface of surrounding rock and the complete rock mass, and the original balance of seepage volume force is broken. Then, the groundwater produces a certain pore water pressure acting on the outer surface of roadway-surrounding rock. Here, the water-bearing surrounding rock is regarded as a two-phase medium, and Equation (5) can be transformed into the following:
d σ r d r + σ r σ θ r η d p s d r = 0
In the formula, η is the effective pore pressure coefficient, and η = 1 when fully permeable and η = 0 when impervious; that is, the value range of the coefficient is 0 ≤ η ≤ 1.
The rock mass obeys the Mohr–Coulomb criterion, and the two-phase medium satisfies the Mohr–Coulomb equation:
σ θ = 1 + sin φ 1 sin φ σ r + 2 sin φ 1 sin φ C cot φ η p w
The simultaneous Equations (1), (6), and (7) are formulated as follows:
r d σ r d r = 2 σ r sin φ + 2 C cos φ 1 sin φ η p w ln R s / R 0 + 2 η p s sin φ 1 sin φ ln R s / R 0 ln R 0 R s
After the roadway is supported, the boundary of the roadway is subjected to uniform pressure of the rock mass. At this time, r = R0 and σr = pi are taken as the definite solutions to solve the differential Equation (8).
σ r = C cot φ + 1 sin φ 2 sin φ α r R 0 β 1 + p i + 1 η p w r R 0 β
In this equation, α = η p w ln R s / R 0 and β = 2 sin φ 1 sin φ .
Substituting Equation (9) into Equation (7), we can obtain the following:
σ θ = C cot φ + 1 sin φ 2 sin φ α 1 + sin φ 1 sin φ r R 0 β 1 + p i + 1 η p w r R 0 β β
The radial stress at r = Rp is σp. According to Lamy’s theorem and Equation (1), the stress expression in the elastic zone can be obtained as follows:
σ r = p 0 1 R p 2 r 2 + σ p R p 2 r 2 + η p w σ θ = p 0 1 + R p 2 r 2 σ p R p 2 r 2 + η p w
After the excavation of the roadway, the surrounding rock of the roadway produces a broken zone and an elastic zone, as shown in Figure 3. With the gradual increase in r, the radial stress also increases. According to the strength characteristics of rock mass under three-dimensional stress, the strength of the rock mass will increase with the increase in confining pressure such that the stress in the rock mass gradually transitions to an elastic stress state. Therefore, the stress at a certain point in the surrounding rock will be the junction point of the stress in the broken zone and the elastic zone; that is, the stress of the surrounding rock at r = Rp satisfies the stress equation of the broken zone and the stress equation of the elastic zone. From the simultaneous Equations (9)–(11), the radius of the broken zone Rp can be obtained.
R p = R 0 1 sin φ p 0 + C cot φ α / sin φ p i + C cot φ 2 α / β 1 β
According to the Equation (12), the radius of the fracture zone is not only related to the strength and properties of the rock mass but is also affected by the initial ground stress p0, the radius of the roadway R0, the support force pi, and the pore water pressure pw.
By substituting the Equation (12) into the Equations (9) and (10), respectively, the surrounding rock stress at r = Rp is obtained as follows:
σ r = p 0 + C cot φ + 1 2 η p w 1 sin φ C cos φ σ θ = p 0 + C cot φ + 1 2 η p w 1 + sin φ + C cos φ
The displacement up of the fracture zone is as follows:
u p = 1 + μ R p 2 E r p 0 + 1 2 η p w sin φ + 2 C cos φ
In the equation,
  • C—Cohesion;
  • E—Elastic modulus;
  • φ—Angle of internal friction;
  • μ—Poisson’s ratio.

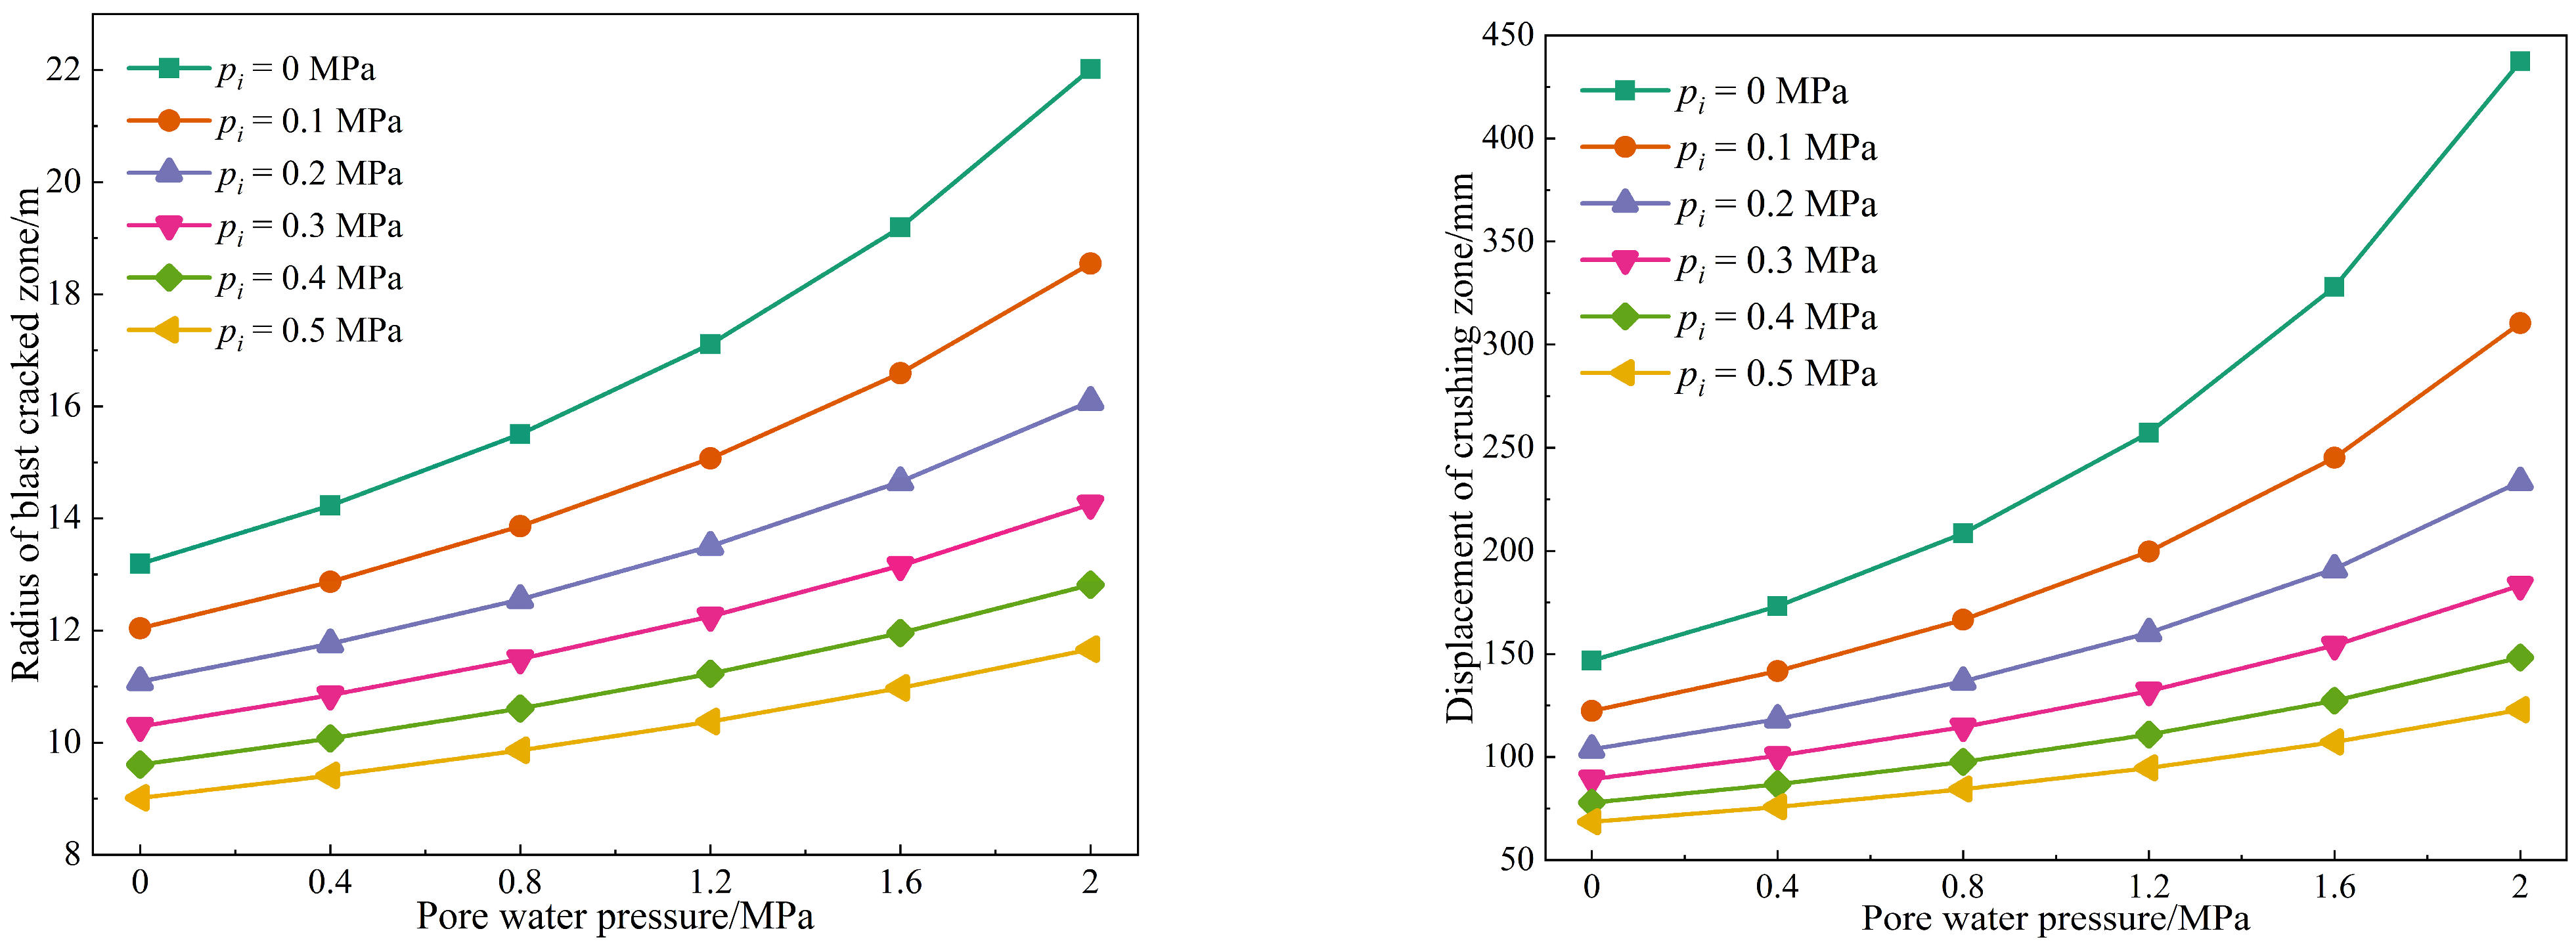
3.2. Analysis of the Influence of Pore Water Pressure on the Radius and Displacement of the Fracture Zone

In the water-bearing broken surrounding rock roadway, the factors influencing the surrounding rock are varied. This section mainly analyzes the influence of pore water pressure on the radius and displacement of the fracture zone. Notably, the displacement of the surrounding rock is greatest when r = R0, and this displacement is inversely proportional to the elastic modulus (E). Consequently, the displacement law of the broken zone studied in the following sections is based on the condition where r = R0. Furthermore, the influence of the elastic modulus (E) and radius (r) will not be considered in this analysis.
The buried depth of the Y1# belt transportation roadway at the 830 working face is 385 m. The lithology of the stratum consists of slate. The cross-section shape of the roadway is a three-center circular arch measuring 4.6 m by 3.85 m. Calculations indicate that the roadway is similar to a circle with a radius of 2.5 m; therefore, the excavation radius of the roadway is set to R0 = 2.5 m. Considering that the radius of influence of external water is 10 times the radius of the roadway excavation, so let Rs = 25 m.
Through the calculation and analysis of MATLAB’s Equations (12) and (14), the relationship between pore water pressure and the range and displacement of surrounding rock fracture zone under different supporting forces is calculated with pore water pressure as the influencing factor. Given that the surrounding rock of the roadway is relatively broken and contains a weak interlayer, the cohesion (C) is set at 0.85 MPa. Parameters not included in this discussion are assigned fixed values, as shown in Table 1.

Analysis of the Influence of Pore Water Pressure on the Range and Displacement of the Fracture Zone

In order to find out the degree of influence of pore water pressure on the fracture zone of the surrounding rock under different supporting conditions, pore water pressures of 0 MPa, 0.4 MPa, 0.8 MPa, 1.2 MPa, 1.6 MPa, and 2 MPa were applied. The resulting influence curves depicting the influence of different water pressures and the radius and displacement of the fracture zone in the surrounding rock under different supporting conditions are drawn (Figure 4). It can be observed from the figure that as water pressure increases, both the radius and displacement of the crushing zone gradually expand. The main reason for this phenomenon is that following the excavation and unloading of the surrounding rock, the seepage water within the pores and fissures of the rock mass dissipates significantly to the free surface. At this point, the reduction in water pressure diminishes the degree of cementation between the rock mass structures. Concurrently, the two-way effective stress acting on the surrounding rock mass gradually increases, thereby accelerating the failure process of the rock mass structure. As the rate of water pressure dissipation increases, this effect becomes even more pronounced. Consequently, the surrounding rock mass becomes more susceptible to yield failure, ultimately resulting in the observation that higher water pressure correlates with a larger radius and displacement of the fracture zone following excavation and unloading. For example, when the supporting force pi = 0.3 MPa, the radius of the surrounding rock fracture zone with a pore water pressure of 0 MPa is 10.29 m, and the displacement of the fracture zone is 89.32 mm. In contrast, the radius of the surrounding rock fracture zone with a pore water pressure of 2 MPa is 14.25 m, and the displacement of the fracture zone is 183.26 mm. The radius and displacement of the broken zone are increased by 1.38 times and 2.05 times, respectively, compared to the previous measurements. This demonstrates that pore water pressure significantly influences both the radius and displacement of the broken zone.

4. Physical and Mechanical Research and Analysis of Water-Bearing Broken Surrounding Rock

In order to reveal the influence of groundwater on the strength of the surrounding rock, this section obtains the strength characteristics of rock specimens under different water contents by testing rock specimens with different water contents. Through field investigation, rock sampling was carried out in the surrounding rock section of the Y1# roadway in the Yingping section of the Wengfu phosphate mine (as shown in Figure 5) so as to carry out indoor tests.
After the preparation of the rock sample is completed, it is dried and then the specimen is immersed in water. As shown in Table 2, the soaking schemes of the specimens with different water contents are shown.
After the specimen is immersed in water, the uniaxial compression tests with different water contents are carried out, as shown in Figure 6. Figure 6a indicates that the peak strength of the rock specimens is negatively correlated with water content. The fitting curve for peak strength demonstrates a trend of slow decline, linear decline, and then slow decline; that is, as water content increases, the peak strength of the rock specimens approaches a fixed value. Specifically, the peak strength of rock specimens with water contents of 0.11%, 0.22%, 0.29%, and 0.41% is reduced by 5.56%, 30.86%, 46.06%, and 55.3%, respectively, compared to the peak strength of the specimens under dry conditions. Therefore, as water content increases, the compressive strength of the rock specimens decreases.
It can be observed from Figure 6b that as the water content increases, the elastic modulus (E) decreases during the elastic deformation stage of the stress–strain curve. The elastic modulus of the rock specimens exhibits a negative correlation with water content, following a negative exponential function. When the moisture content is 0.11%, the elastic modulus decreases by 20.43% compared to the modulus measured during drying. At a moisture content of 0.22%, the elastic modulus decreases by 38.75% relative to the drying condition. When the moisture content reaches 0.29%, the elastic modulus decreases by 51.18% compared to the drying state. At a moisture content of 0.41%, the elastic modulus decreases by 59.31% compared to the modulus during drying. This indicates that as water content increases, the softening of the rock specimens becomes more pronounced, resulting in a shorter elastic deformation stage. Additionally, it can be concluded that the Poisson’s ratio of the rock specimens increases exponentially with rising water content. Compared to the dry state, the Poisson’s ratio increases by 7.51%, 19.72%, 30.99%, and 42.25% at moisture contents of 0.11%, 0.22%, 0.29%, and 0.41%, respectively.
In Figure 6b, the fitting formulas of water content and elastic modulus E and Poisson’s ratio μ are obtained, respectively:
E δ = 16.61 e - δ 0.465 0.364
μ δ = 0.10 8 - δ 0.621 0.105
Equations (15) and (16) are substituted into Equation (14), and the parallel standing Equation (12) can obtain the relationship between different water content and the displacement of the crushing zone:
u p = 0.108 e δ 0.621 1.105 R p 2 16.61 e δ 0.465 0.364 r p 0 + 1 2 η p w sin φ + 2 C cos φ
In the above equation, except for the moisture content of the independent variable, the remaining variables take the fixed value.
Using MATLAB (MATLAB 2014a) to analyze Equation (17), the relationship curve between different water content and the displacement of the crushing zone can be obtained, as shown in Figure 7. It is not difficult to see from the figure that with the increase in water content, the displacement of the broken zone shows an increasing trend. That is to say, the higher the water content, the greater the displacement increment of the broken zone. Therefore, groundwater is highly destructive to the surrounding rock of the roadway, which also verifies the deterioration of water to the surrounding rock.

5. Numerical Simulation Analysis

5.1. Numerical Modeling

According to the test results of the physical and mechanical properties obtained from the formation conditions and on-site sampling detailed in the geological survey report, the relevant parameters of the solid units, including the simulated rock strata and the supporting structure, have been selected. Ultimately, the physical and mechanical parameters utilized in the model are presented in Table 3.
According to the geological summary and engineering situation described above, and because the target area of the simulated roadway is the water-bearing section, it is assumed that the rock mass of the whole model is water-saturated before the simulated excavation of the roadway. According to the elevation data of the groundwater level in the area provided by the field technicians, the pore water pressure at the roadway section is about 1.2 MPa, and then the hydrostatic pressure value is assigned to the numerical simulation grid unit instead of the pore water pressure. The corresponding numerical model is established by using FLAC3D simulation software (FLAC3D 6.0), as shown in Figure 8a. The model size is 50 m long, 50 m wide, and 20 m deep. It is divided into 222,207 grid units and 155,734 grid nodes.
Before excavating the numerical model roadway, the mechanical and physical parameters of the surrounding rock, as presented in Table 3, are substituted into Equations (3) and (4). The resulting radius of the plastic zone is 6.29 m, and the displacement of the broken zone is 86.78 mm. These findings provide verification and serve as a reference for subsequent numerical simulation analyses.
According to the previous field investigation and the analysis of surrounding rock characteristics, the deformation characteristics and instability mechanism of surrounding rock mass have been basically understood. On this basis, the roadway support is optimized and analyzed, and the optimized support scheme is put forward. Through numerical simulation, the optimized support effect is analyzed and studied. The optimized support scheme adopts the combined support mode of steel arch, local grouting, and mesh shotcrete. Among them, the steel arch adopts a 12 # mining I-steel arch, one every 1 m; the grouting hole is drilled in the weak interlayer of the two sides of the roadway. The slurry is mainly P.O42.5 cement, the pressure of the grouting hole is 3 MPa, and the grouting depth is 6 m. The strength of net shotcrete is C20, and the thickness of shotcrete is 100 mm. The structural diagram of the optimized support scheme is shown in Figure 8b.

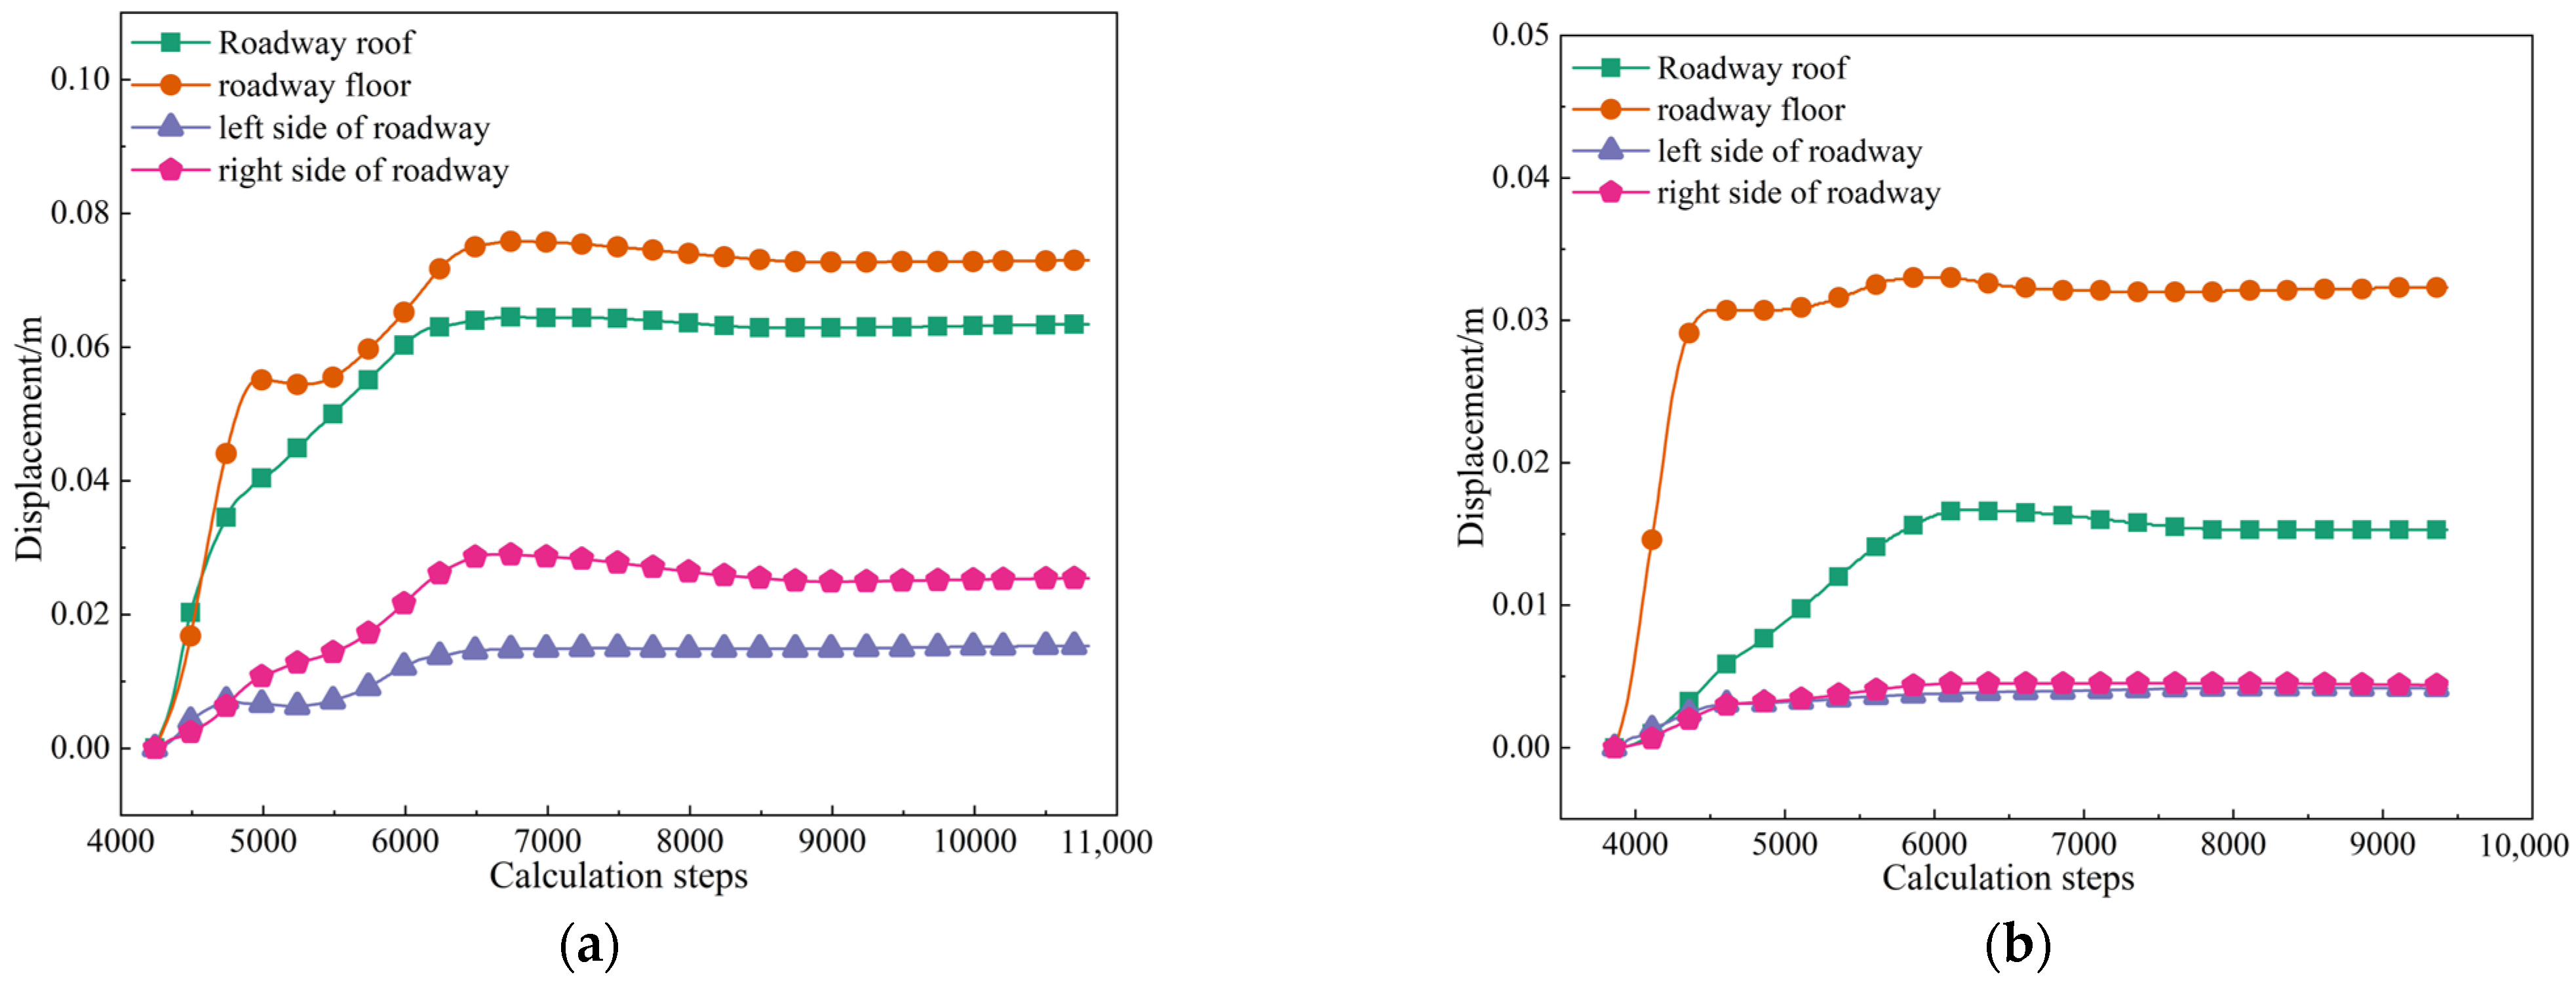
5.2. Comparative Analysis of Numerical Simulation Results

The distribution of the plastic zone caused by roadway excavation is shown in Figure 9. From the perspective of the range of the plastic zone, compared with the plastic zone of the old support scheme, the optimized support scheme has a great convergence effect on the roof and the two sides, and the bottom range is also reduced. The radius of the whole plastic zone is reduced to 4.28 m, and the volume is reduced to 1153 m3. Compared with the old support, the radius of the plastic zone is reduced by 28.9% and the volume is reduced by 49.36%. It can be clearly seen that the plastic range is well controlled after the grouting of the weak interlayer. Through the above comparison and calculation, it shows that the optimization scheme has effectively improved the stability of the surrounding rock and can control the long-term stability of the broken surrounding rock roadway.
According to the displacement cloud map (Figure 10), the horizontal displacement of the left side of the roadway is reduced to 36.6 mm, the horizontal displacement of the right side is reduced to 41.8 mm, the vertical displacement of the roof is reduced to 24.81 mm, and the vertical displacement of the floor is reduced to 40.92 mm.
At the same time, by comparing the displacement monitoring curves before and after the optimization of roadway support (Figure 11), it is found that the displacement around the surrounding rock decreases obviously, which indicates that the optimized support scheme improves the integrity of the surrounding rock such that the broken surrounding rock can make full use of its own residual bearing capacity to maintain the stability of the surrounding rock.

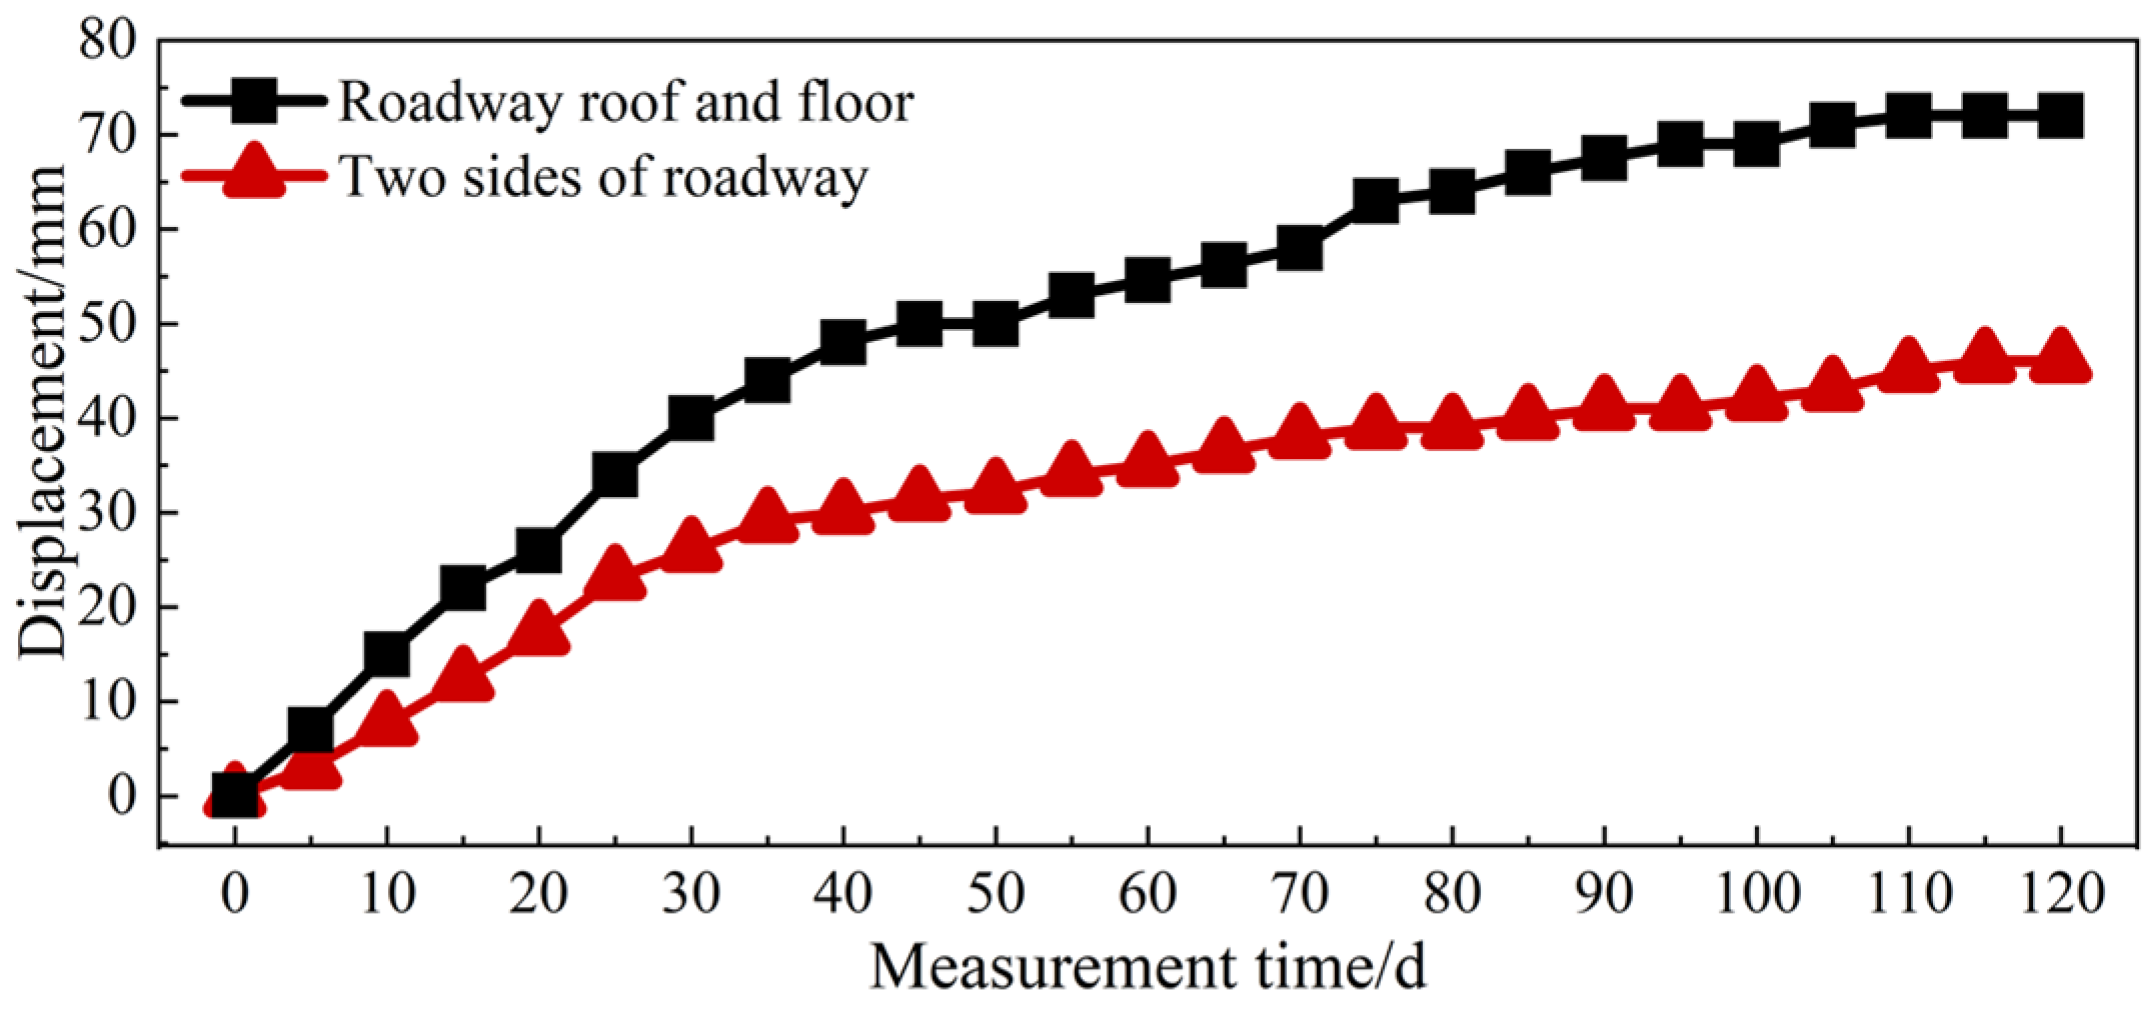
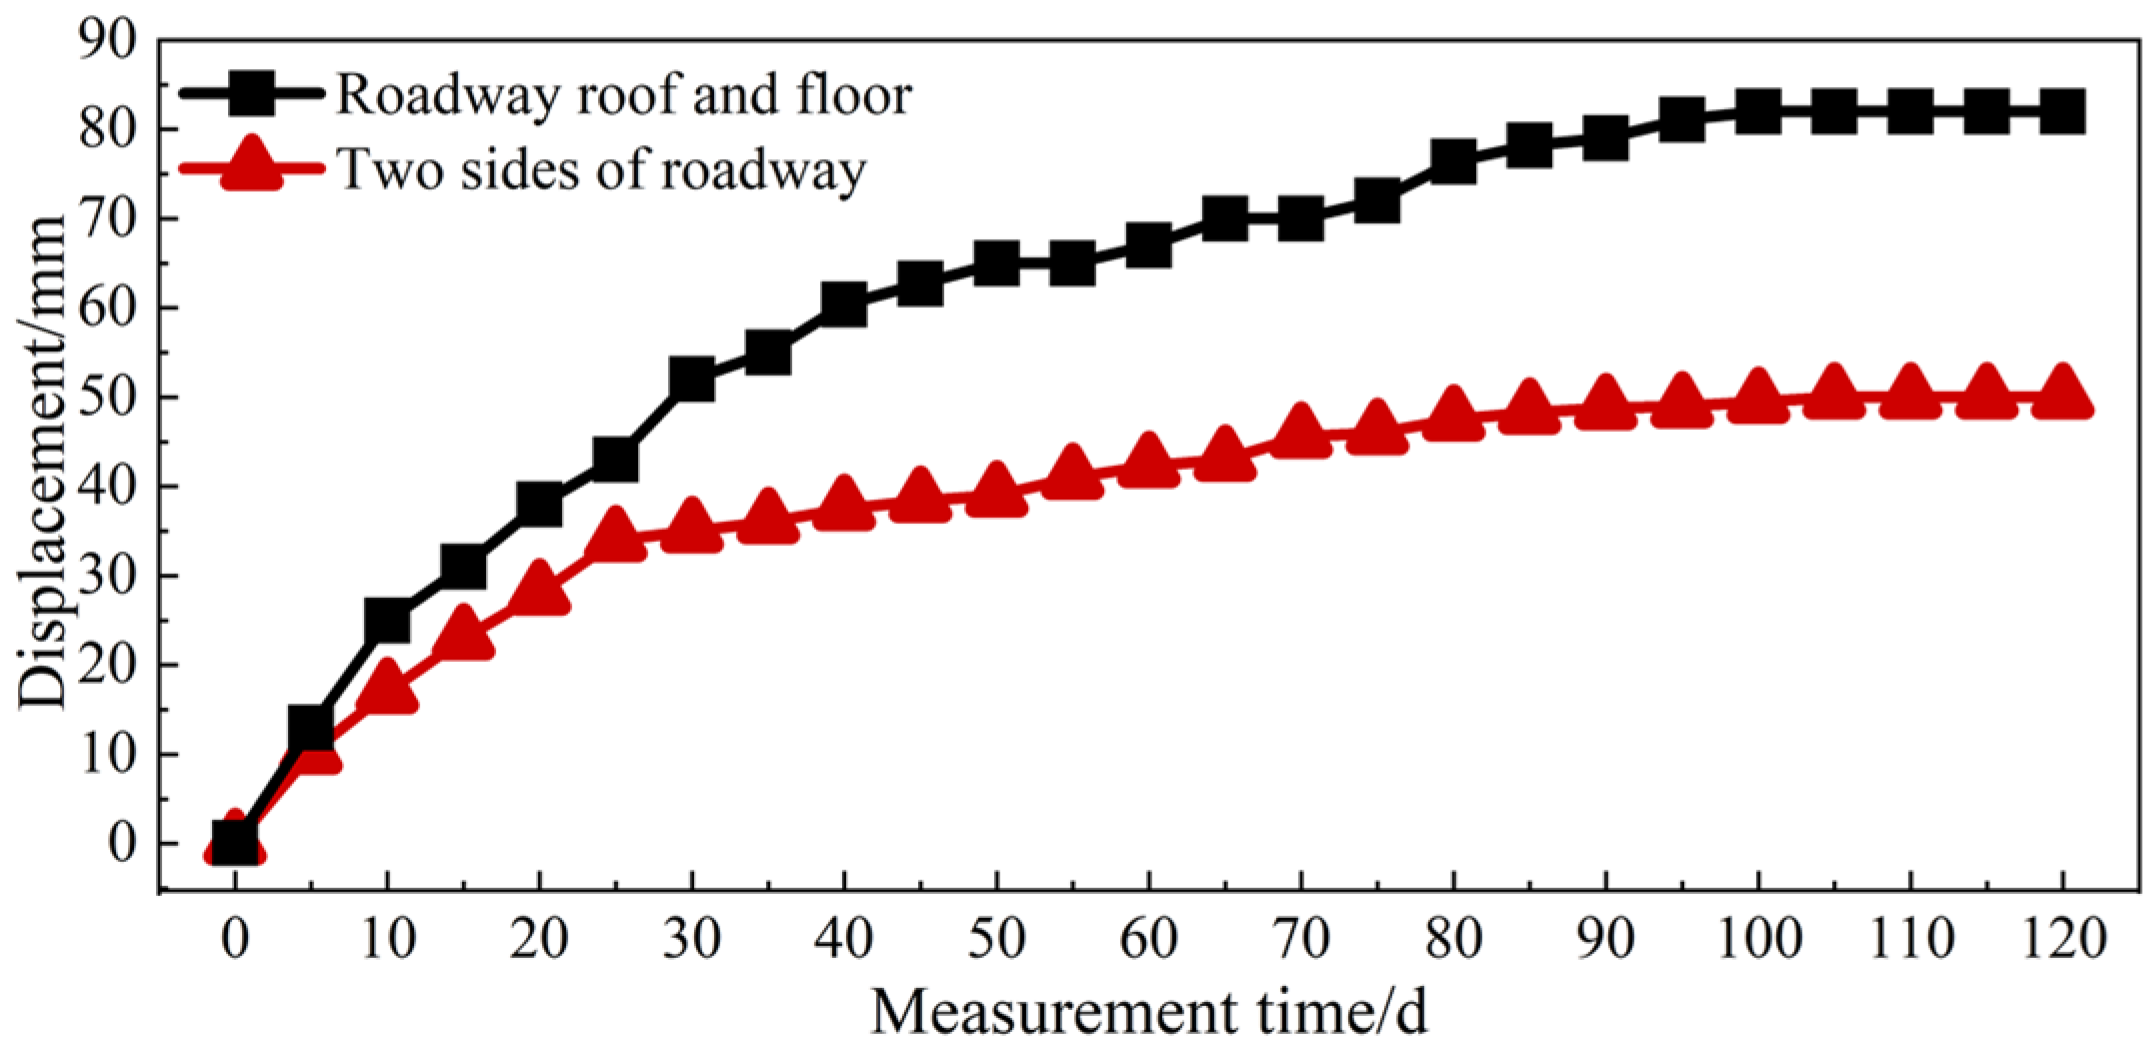
5.3. Analysis of On-Site Monitoring Effect

In order to verify the effectiveness of the optimized support scheme on the stability of the surrounding rock, a reliability analysis was conducted by monitoring the displacement of the surrounding rock in the Y1 belt conveyor roadway on-site. This study also accumulates essential data and references for future support schemes in the mine. The displacement monitoring primarily focuses on the two sides, as well as the roof and floor of the roadway. The monitoring method utilizes a cross-point distribution approach. Three monitoring sections were established, designated as Monitoring Section NO. 1, Monitoring Section NO. 2, and Monitoring Section NO. 3. Each section is spaced 20 m apart and contains four monitoring points. The monitoring period lasts for 120 days, with measurements taken approximately every five days.
The displacement monitoring curve for Monitoring Section NO. 1 is shown in Figure 12. The diagram indicates that the rate of displacement change for the roof, floor, and both sides is relatively high during the initial 25 days. Following this period, the rate of displacement change gradually decreases from 25 days to 90 days, ultimately stabilizing after 90 days. Notably, the displacement of the roof and floor exceeds that of the two sides, with the maximum displacement of the roof and floor reaching approximately 75 mm, while the maximum displacement of the two sides is around 40 mm. This clearly demonstrates that the optimized support scheme is effective and can ensure the long-term stability of the roadway.
Figure 13 presents the monitoring data for Section NO. 2. The diagram indicates that the displacement of the surrounding rock experiences significant changes during the first 35 days. Following this period, the displacement gradually stabilizes from day 35 to day 90, after which it remains relatively constant. This pattern closely resembles the overall trend observed in the data from Monitoring Section NO. 1.
Figure 14 presents the monitoring data for Section NO. 3. The diagram indicates that the displacement of the roof and floor experienced significant changes for approximately 35 days. This displacement gradually decreased from 35 days to 80 days and stabilized thereafter. Additionally, the displacement on both sides showed considerable variation for about 25 days, after which it gradually stabilized, ultimately reaching a state of relative stability by 75 days.
Overall, the data from the three monitoring points show that the deformation of the tunnel perimeter rock is basically stable after 90 days and within the controllable range. It shows that the optimized support scheme has been effectively verified.

6. Conclusions

Through field investigations, it has been determined that the K0 + 300–K0 + 331 section of the Y1# belt conveyor roadway, located in the 830 working face of the deep underground mining area of the Yingping mining area in the Gaoping mining area of the Wengfu phosphate mine, is located near a fault zone. This area exhibits numerous small folds and has resulted in poor roadway formation. Under the existing support scheme, there are significant cracks and shedding of the surrounding rock lining within the roadway, posing a risk of roof collapse. Furthermore, the release of pore water pressure due to prolonged seepage further compromises the stability of the surrounding rock in the roadway.
Using elastic–plastic theory and rock mechanics knowledge, the mechanical model of the roadway under the coupling of stress and seepage is established, and the expression of the radius and displacement of the surrounding rock fracture zone is calculated. By using MATLAB to analyze the formula, it is concluded that the increase in pore water pressure in the roadway makes the radius and displacement of the fracture zone increase. However, under the influence of pore water pressure, with the increase in supporting force, the radius and displacement of the fracture zone are obviously improved.
Through the indoor testing of rock specimens with different water contents, it is concluded that with the increase in water content, the compressive strength and elastic modulus of the rock specimens gradually decrease, and the Poisson’s ratio increases. After combining the test results with the theoretical derivation, it is concluded that the water content of the rock is inversely proportional to the strength of the rock. At the same time, the elastic modulus of the rock decreases and the Poisson’s ratio increases, resulting in an increase in the displacement of the surrounding rock, which verifies the deterioration of the surrounding rock by water.
Aiming at the K0 + 300-K0 + 331 section of the Y1# belt conveyor roadway as the subject of numerical simulation, an optimized steel arch support scheme was developed, comparing both the unsupported scenario and the previous support scheme. The volume of the plastic zone was reduced to 1153 m3, representing a decrease of 62.26% compared to the unsupported scenario and of 49.36% compared to the previous support scheme. On-site monitoring indicated that the displacement of the surrounding rock after the optimization of the support scheme exceeded that observed before the 35-day mark, gradually stabilizing thereafter. By the 80-day mark, the displacement had essentially stabilized. The maximum recorded displacements for the roof and floor were 80 mm, while the displacements on the left and right sides measured 45 mm. The deformation of the surrounding rock remained within acceptable limits, thereby confirming the feasibility of the support scheme and enhancing the integrity and stability of the water-bearing broken surrounding rock.

Author Contributions

Conceptualization, W.P. and S.F.; methodology, W.P. and S.F.; software, W.P. and S.F.; validation, W.P. and S.F.; formal analysis, W.P. and S.F.; investigation, W.P. and S.F.; resources, W.P.; data curation, W.P. and S.F.; writing—original draft preparation, W.P. and S.F.; writing—review and editing, S.F. All authors have read and agreed to the published version of the manuscript.

Funding

This research was supported by the Key Project of Hunan Provincial Education Department (22A0337) and by the Hunan Provincial Natural Science Found of China (2023JJ50232).

Institutional Review Board Statement

Not applicable.

Informed Consent Statement

Not applicable.

Data Availability Statement

The data used to support the findings of this study are available from the corresponding author upon request.

Conflicts of Interest

The authors declare no conflict of interest.

References

  1. Hua, Z.; Fan, G.; Shi, J.; Chen, X.; Xu, J.; Zheng, Y.; Ren, S. Failure mechanism and control of underground wall rock under the effect of water pressure stress. Coal Eng. 2024, 56, 126–134. [Google Scholar]
  2. Yang, K.; Zhang, Z.; Chi, X.; Lü, X.; Wei, Z.; Liu, W. Experimental study on crack evolution and damage characteristics of water bearing sandstone under cyclic loading. Rock Soil Mech. 2022, 43, 1791–1802. [Google Scholar] [CrossRef]
  3. Chen, G.; Zhang, J.; Li, T.; Chen, S.; Zhang, G.; Lü, P.; Teng, P. Timeliness of damage and deterioration of mechanical properties of coal-rock combined body under water-rock interaction. J. China Coal Socirty 2021, 46 (Suppl. S2), 701–712. [Google Scholar] [CrossRef]
  4. Liu, W.; Zhao, J.; Kong, D.; Gu, Y.; Du, G.; Wang, J. A quantitative method for water inrush risk from fractured rocks based on nonlinear seepage theory. J. China Coal Soc. 2024, 49, 4520–4541. [Google Scholar] [CrossRef]
  5. Liu, Y.; Rong, C.; Wang, B.; Wang, S.; Niu, B.; Yang, M.; Li, M. Theoretical Solution of Roadway Stability Considering Intermediate Principal Stress and Seepage. Sci. Technol. Eng. 2023, 23, 14525–14531. [Google Scholar]
  6. Cao, Y.; Chen, Y.; Huang, Z.; Liu, C.; Qiu, D. STUDY on EVALUATION INDEX of BRITTLENESS CHARACTERISTICS of GRANITE UNDER DIFFERENT WATER CONTENT CONDITIONS. J. Eng. Geol. 2020, 28, 29–38. [Google Scholar] [CrossRef]
  7. Zhang, E.; Yang, G.; Tang, L.; Yang, Q.; Xie, Z. Study on influence of water content to damage and degradation laws of argillaceous siltstone. Coal Sci. Technol. 2019, 47, 14–20. [Google Scholar] [CrossRef]
  8. Hashiba, K.; Fukui, K. Effect of Water on the Deformation and Failure of Rock in Uniaxial Tension. Rock Mech. Rock Eng. 2015, 48, 1751–1761. [Google Scholar] [CrossRef]
  9. Karakul, H.; Ulusay, R. Empirical correlations for predicting strength properties of rocks from P-wave velocity under different degrees of saturation. Rock Mech. Rock Eng. 2013, 46, 98–99. [Google Scholar] [CrossRef]
  10. Song, H.; Li, S.; Zhang, Q.; Guo, Y.; Xu, G. The Acoustic Emission Stage Characteristics and Damage Evolution of Argillaceous Siltstone. Chin. J. Undergr. Space Eng. 2024, 20, 72–81. [Google Scholar]
  11. Zhang, Z.; Chi, X.L.; Yang, K.; Lyu, X.; Wang, Y. Studies on the Deformation and Macro-Micro-Damage Characteristics of Water-Bearing Sandstone under Cyclic Loading and Unloading Tests. ACS Omega 2023, 8, 19843–19852. [Google Scholar] [CrossRef] [PubMed]
  12. Bai, Z.; Shi, T.; Wang, J.; Zhang, C. Damage characteristics and model of rock triaxial cyclic stress and relaxation under stress-seepage coupling. Heliyon 2024, 11, e41568. [Google Scholar] [CrossRef] [PubMed]
  13. Liu, G.; Zan, Y.; Wang, D.; Wang, S.; Yang, Z.; Zeng, Y.; Wei, G.; Shi, X. Numerical Simulation of Fracture Failure Propagation in Water-Saturated Sandstone with Pore Defects Under Non-Uniform Loading Effects. Water 2025, 17, 1725. [Google Scholar] [CrossRef]
  14. Zhu, Y.; Wu, Y.; Zhang, L.; Zhang, S. Experimental and Numerical Simulations of Pore Structures and Seepage Characteristics of Deep Sandstones. Processes 2023, 11, 3411. [Google Scholar] [CrossRef]
  15. Yuan, C.; Zhang, J.G.; Wang, W.J.; Lyu, Y.C.; Guo, J.W.; Cao, Q.J.; Li, W.C. Controlling principles of surrounding rock in soft and broken roadway based on the distribution pattern of plastic zone. J. Min. Saf. Eng. 2020, 37, 451–460. [Google Scholar] [CrossRef]
  16. Zareifard, M.R.; Fahimifar, A. Analytical solutions for the stresses and deformations of deep tunnels in an elastic-brittle-plastic rock mass considering the damaged zone. Tunn. Undergr. Space Technol. 2016, 58, 186–196. [Google Scholar] [CrossRef]
  17. Peng, W.; Zhu, H.; Wang, Q. Stress distribution law of surrounding rock bearing structure of broken surrounding rock roadway. J. Cent. South Univ. (Sci. Technol.) 2023, 54, 2447–2458. [Google Scholar]
  18. Xie, P.; Fang, J.; Hu, B.; Zhang, B.; Zhang, X.; Duan, S. Deformation and failure characteristics of soft rock tunnel surrounding rock under mining and water immersion conditions. J. Mine Autom. 2024, 50, 27–35+92. [Google Scholar] [CrossRef]
  19. Yu, K.; Ren, F.; Puscasu, R.; Lin, P.; Meng, Q. Optimization of combined support in soft-rock roadway. Tunn. Undergr. Space Technol. Inc. Trenchless Technol. Res. 2020, 103, 103502. [Google Scholar] [CrossRef]
  20. Wang, W.; Yuan, C.; Yu, W.; Wu, H.; Peng, W.; Peng, G.; Liu, X.; Dong, E. Stability control method of surrounding rock in deep roadway with large deformation. J. China Coal Soc. 2016, 41, 2921–2931. [Google Scholar] [CrossRef]
  21. Song, G. Roadway surrounding rock control technology of weakly cemented soft rock with rich alkaline water. Coal Eng. 2023, 55, 58–62. [Google Scholar]
  22. Qu, J.; Liu, Q.; Ma, H. Support Deformation Induced Clearance Invasion and Treatment for a Pelitic Soft-Rock Tunnel Passing through a Water-Rich Fault Zone. Mod. Tunn. Technol. 2017, 54, 181–189. [Google Scholar] [CrossRef]
Figure 1. Old support scheme.
Applsci 15 07011 g001
Figure 2. Field survey map: (a) crack and water leakage; (b) completely detached; (c) outer drum of two sides of roadway; (d) tunnel water.
Applsci 15 07011 g002
Figure 3. Roadway mechanics model.
Applsci 15 07011 g003
Figure 4. Pore water pressure and broken zone range and displacement relationship curve.
Applsci 15 07011 g004
Figure 5. Specimen sampling points and rock specimens.
Applsci 15 07011 g005
Figure 6. Strength characteristics of rock specimens under different water content: (a) peak strength; (b) elastic modulus and Poisson’s ratio.
Applsci 15 07011 g006
Figure 7. The displacement of the crushing zone under different water content.
Applsci 15 07011 g007
Figure 8. Numerical model and supporting structure diagram after optimization: (a) numerical model; (b) steel arch spray mixing.
Applsci 15 07011 g008
Figure 9. Distribution diagram of plastic zone: (a) old support; (b) after support optimization.
Applsci 15 07011 g009
Figure 10. Displacement cloud diagram of surrounding rock: (a) horizontal displacement in old support; (b) vertical displacement during old support; (c) horizontal displacement after support optimization; (d) vertical displacement after support optimization.
Applsci 15 07011 g010
Figure 11. Displacement monitoring curve diagram: (a) old support displacement monitoring curve; (b) optimized support displacement monitoring curve.
Applsci 15 07011 g011
Figure 12. Monitoring Section NO. 1.
Applsci 15 07011 g012
Figure 13. Monitoring Section NO. 2.
Applsci 15 07011 g013
Figure 14. Monitoring Section NO. 3.
Applsci 15 07011 g014
Table 1. Petrophysical parameters.
p0/MPap0/MPaηφE/GPaμ
10.360.80.322120.5
Table 2. The soaking schemes of the specimens with different water contents.
Specimen NumberImmersion TimeInitial MassQuality After SoakingWater ContentMean Value of Moisture Content
(h)(g)(g)(%)(%)
W0053053000
W1-15537.1537.680.110.11
W1-2536.98537.510.1
W1-3537.21537.850.12
W2-113536.7537.820.210.22
W2-2534.96536.120.22
W2-3539.49540.670.22
W3-124521.91523.460.30.29
W3-2519.08520.520.28
W3-3533.54535.080.29
W4-1192532.2534.420.420.41
W4-2529.29531.410.4
W4-3525.6527.750.41
Table 3. Mechanical and physical parameters of surrounding rock.
Lithologic CharactersBulk ModulusShear ModulusCohesionAngle of Internal FrictionVolumetric WeightPorosity
(GPa)(GPa)(MPa)(°)(kg/m3)(%)
Dolomite108.653827500.2
Slate5.122.312.322826900.5
Soft rock strata1.50.40.522027500.1
Disclaimer/Publisher’s Note: The statements, opinions and data contained in all publications are solely those of the individual author(s) and contributor(s) and not of MDPI and/or the editor(s). MDPI and/or the editor(s) disclaim responsibility for any injury to people or property resulting from any ideas, methods, instructions or products referred to in the content.

