
Acute Heterogeneous Changes in Muscle and Tendon Viscoelastic Properties Following a VO₂max Treadmill Test in High-Level Male Soccer Players

 , ,
, ,  , , ,
, , ,  and
and 
Abstract
1. Introduction
2. Materials and Methods
2.1. Study Design
2.2. Participants
2.3. Testing Protocol
2.4. Progressive Exercise on the Treadmill
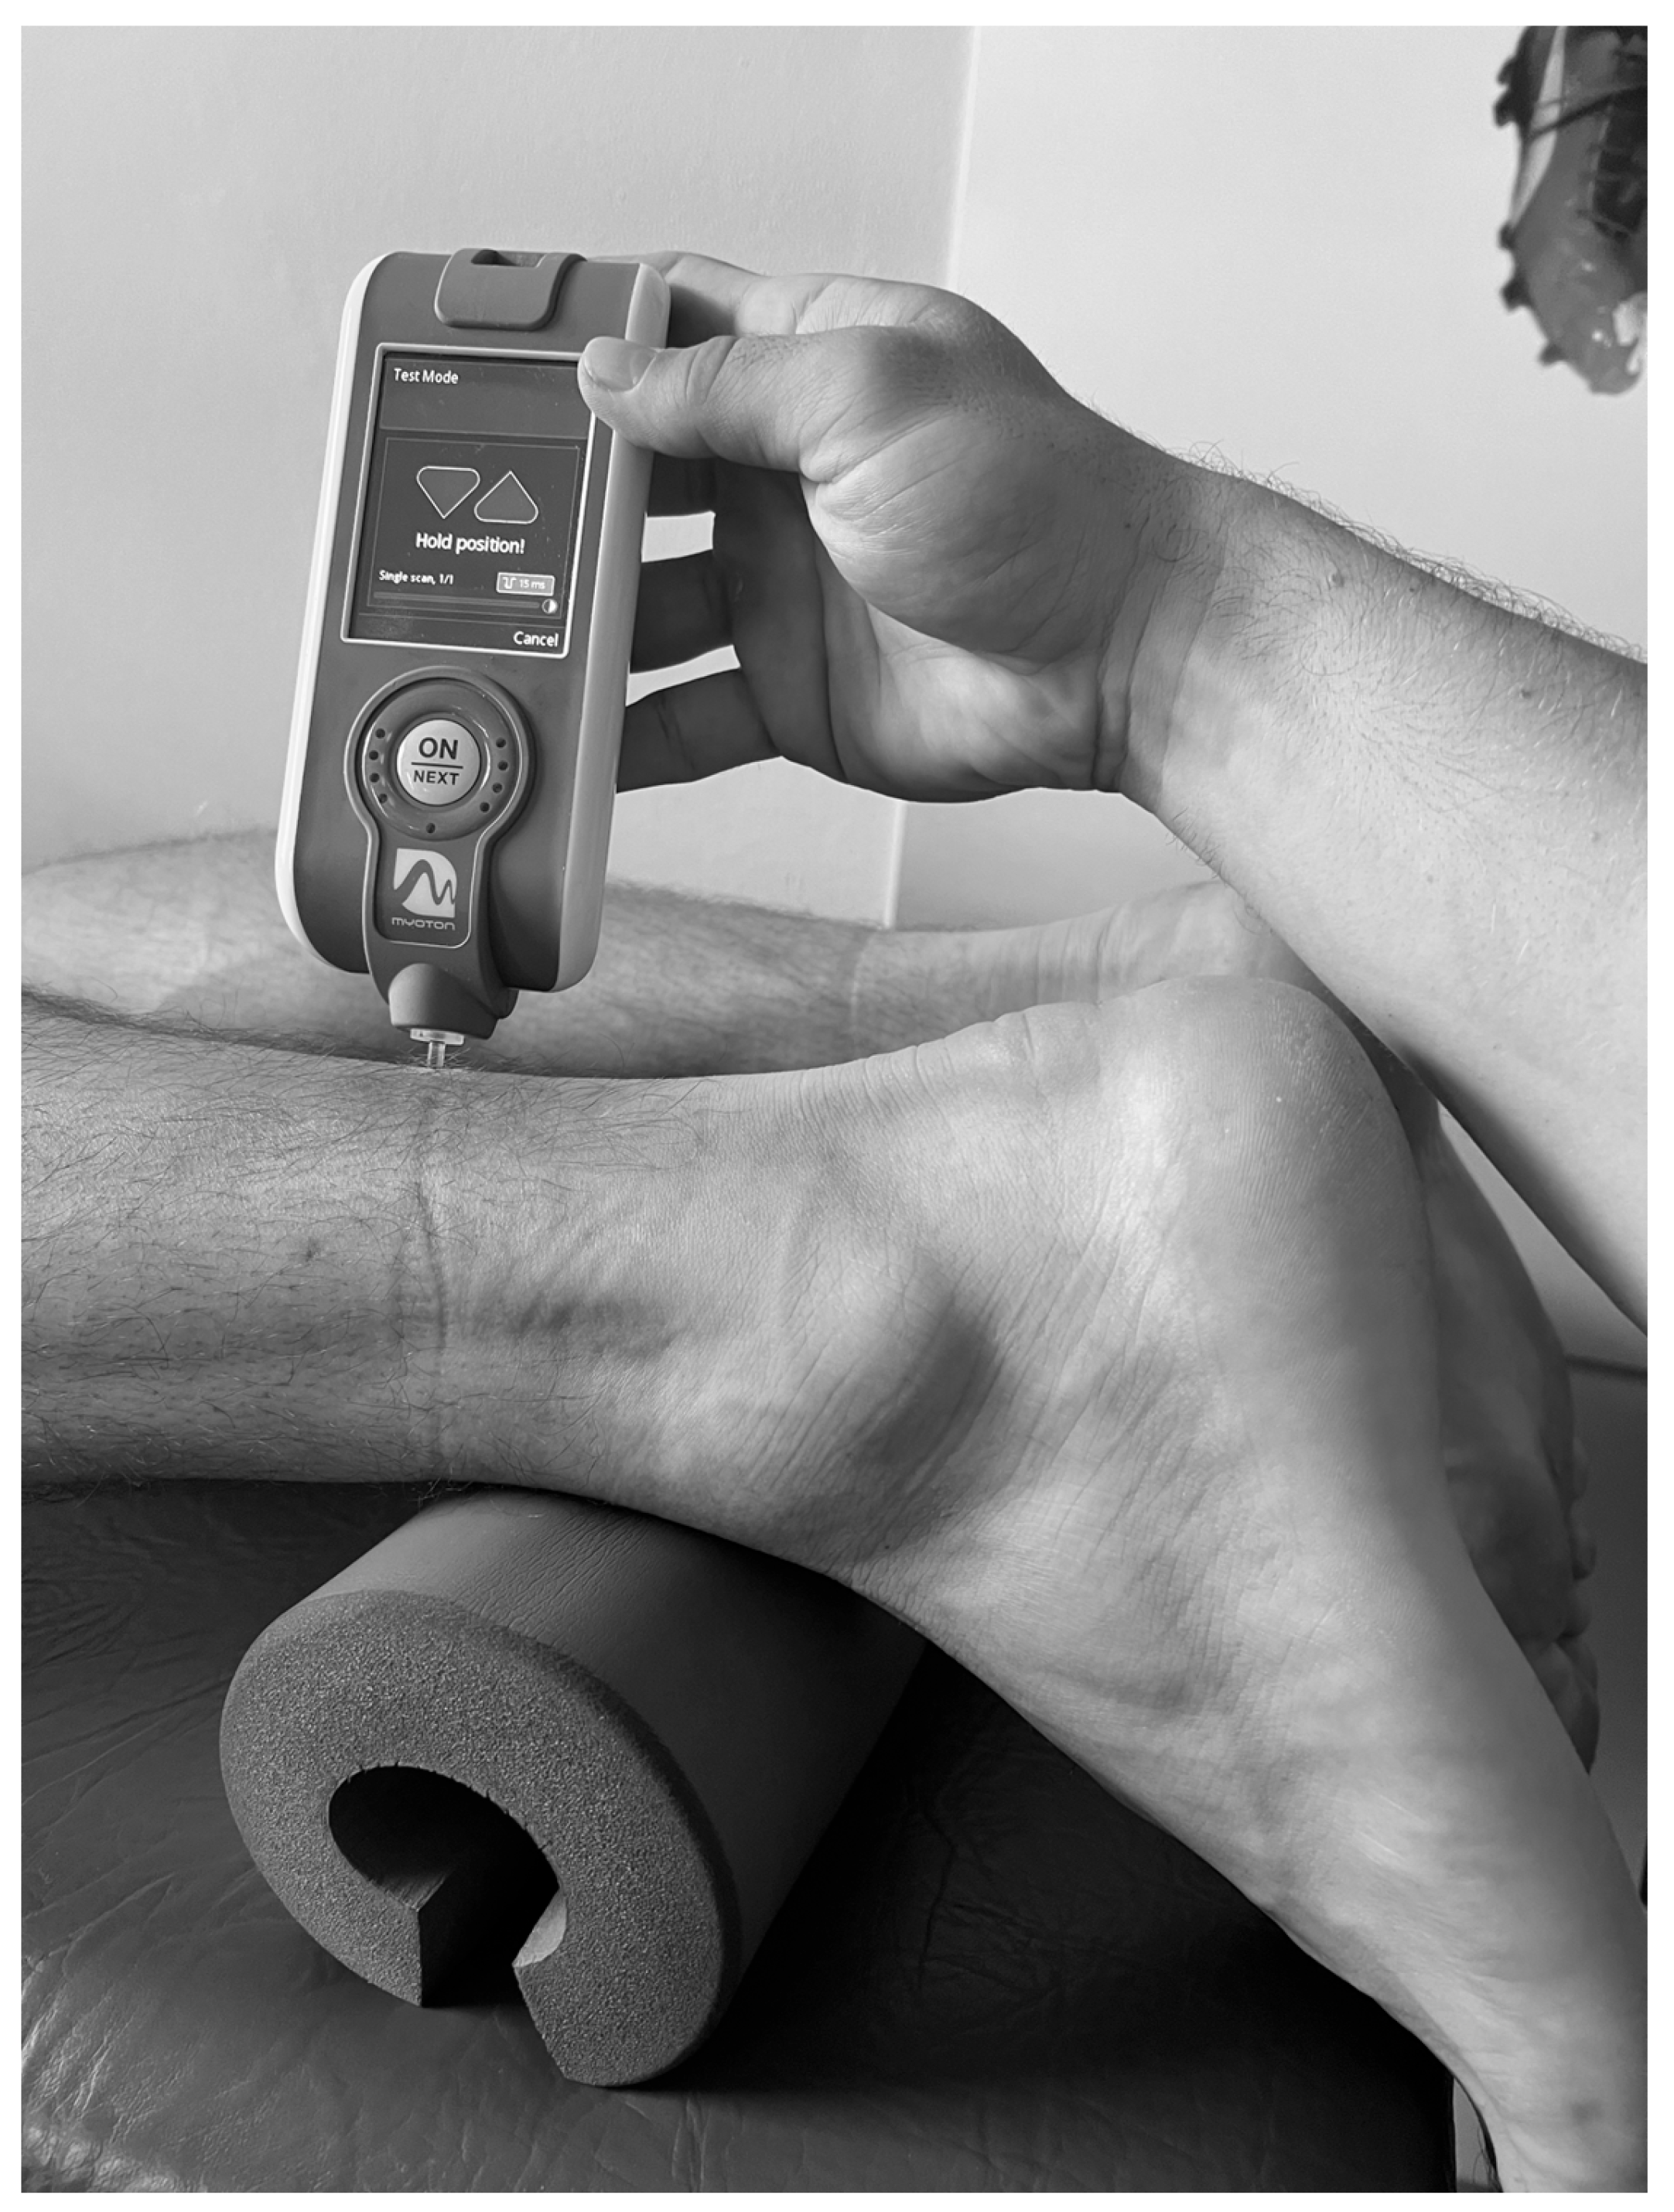
2.5. Measurement of Muscle Viscoelastic Properties
2.6. Statistical Analysis
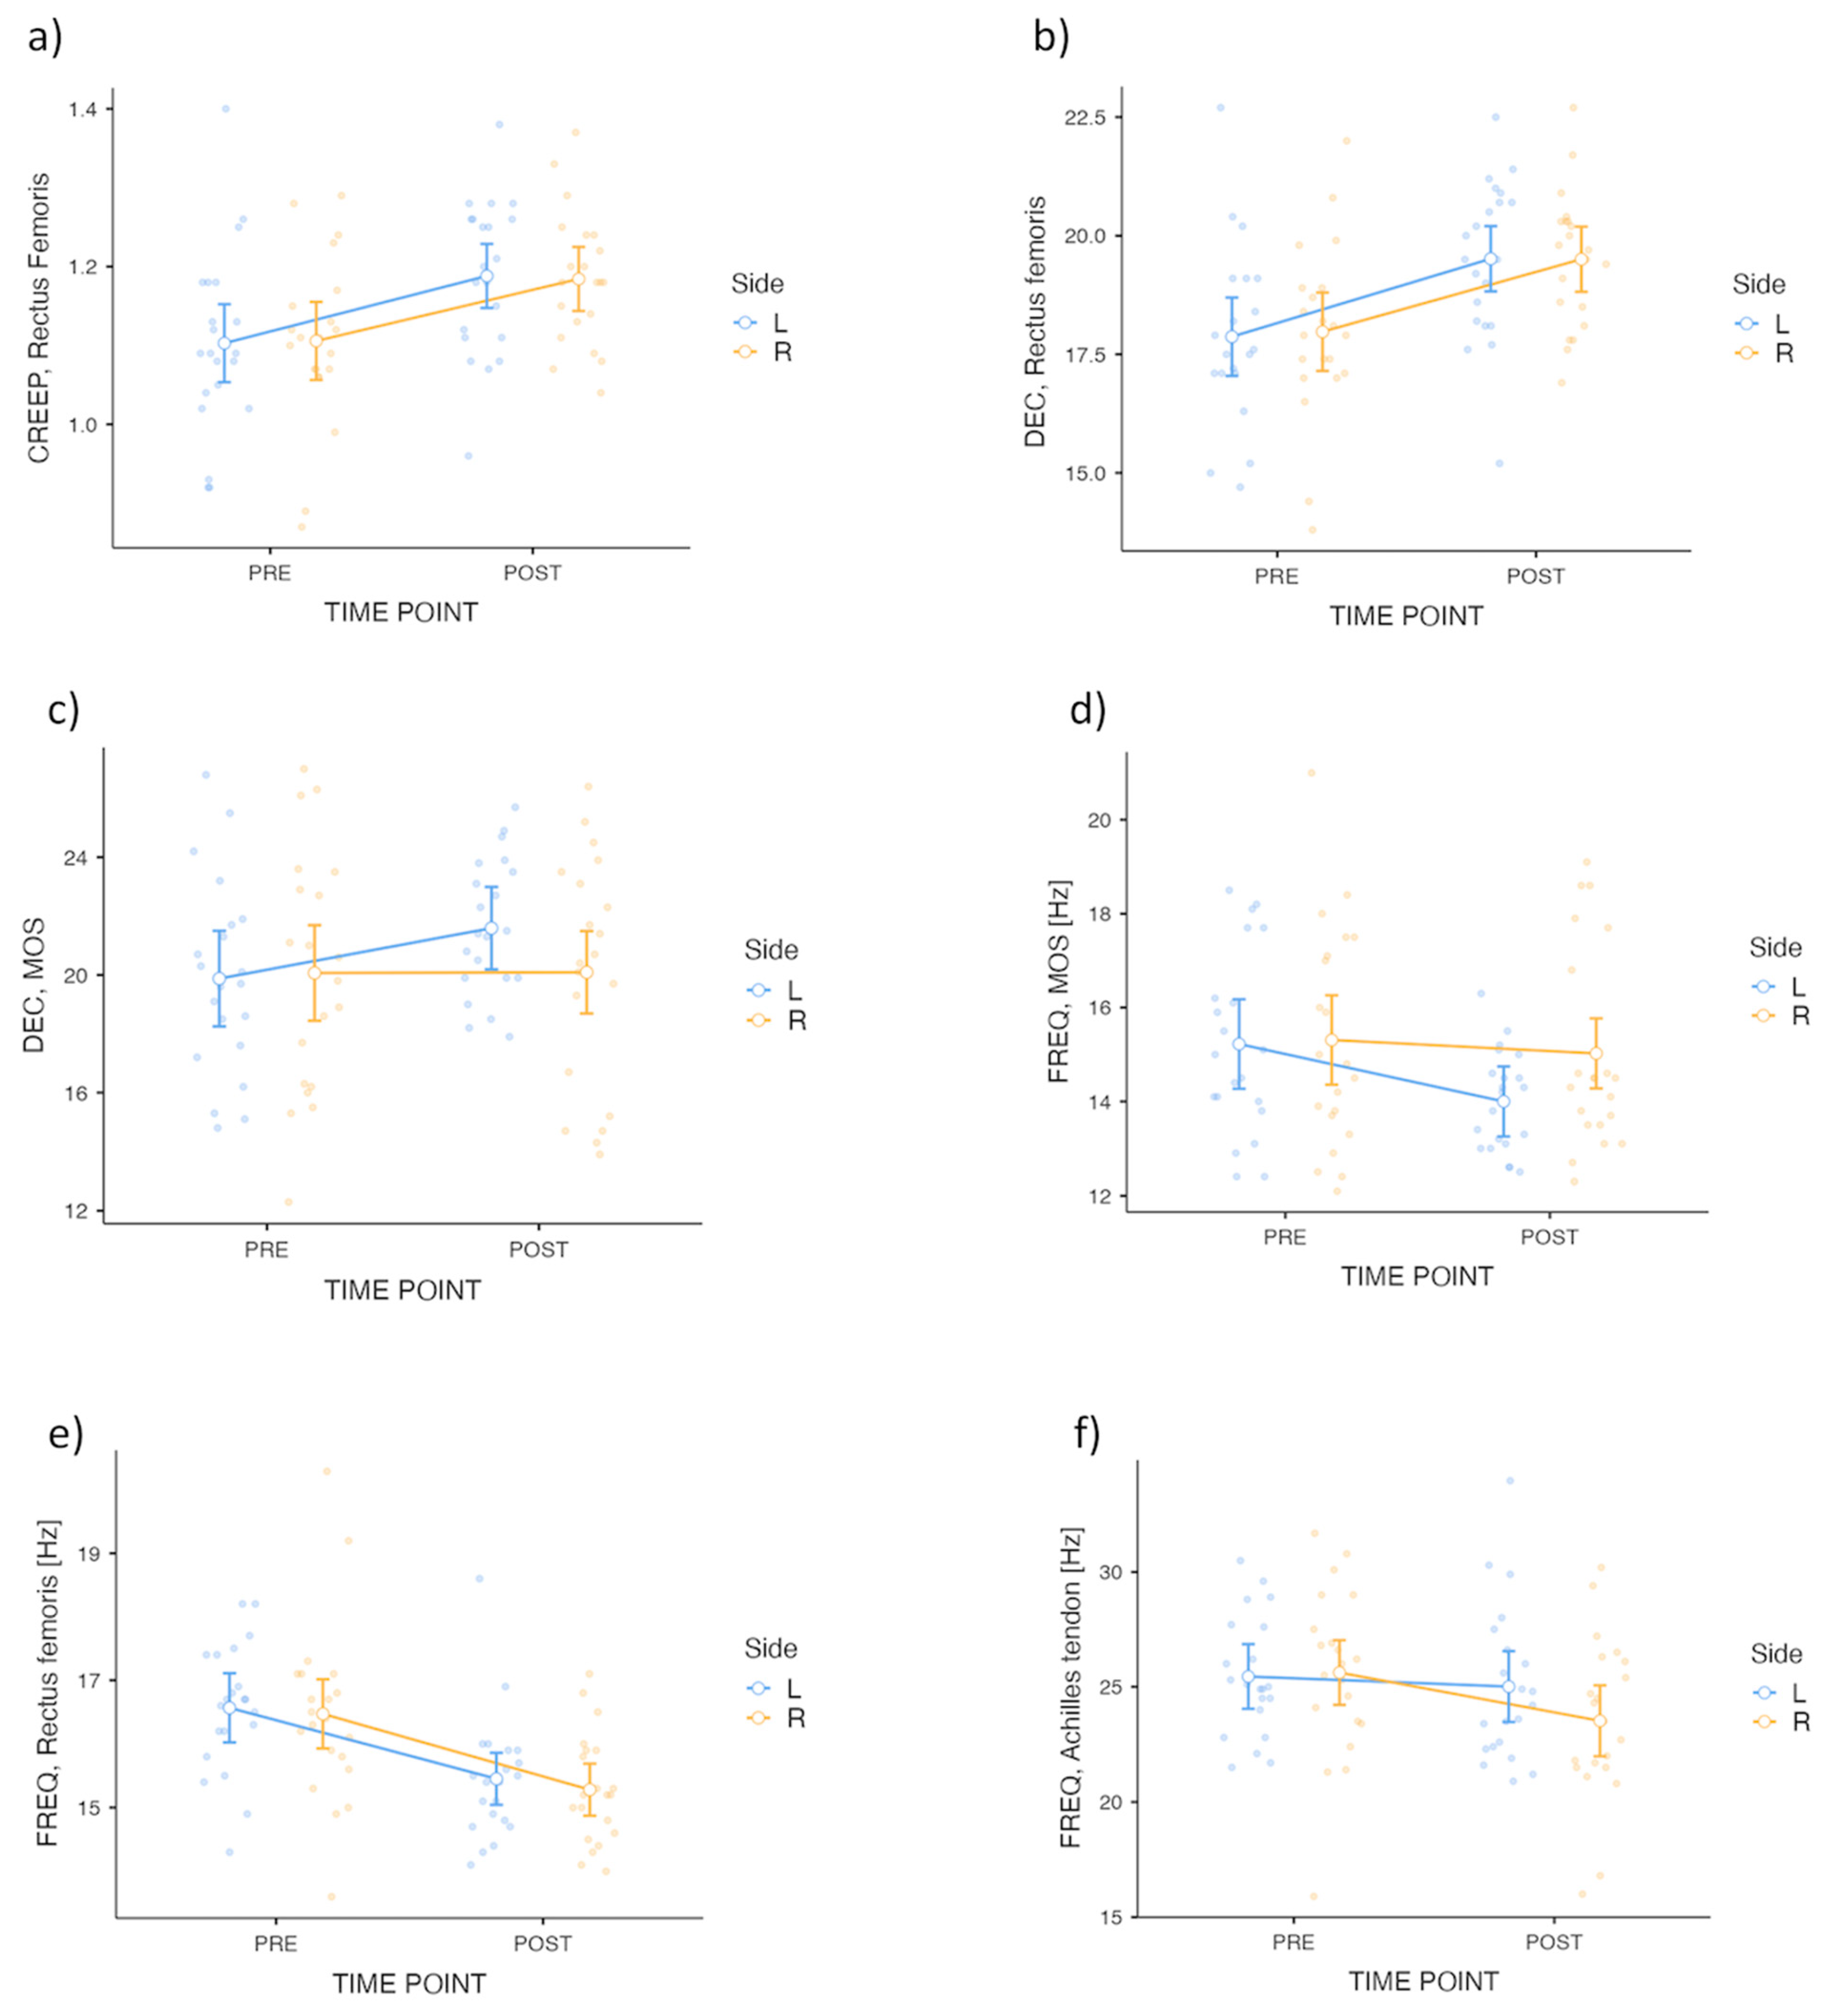
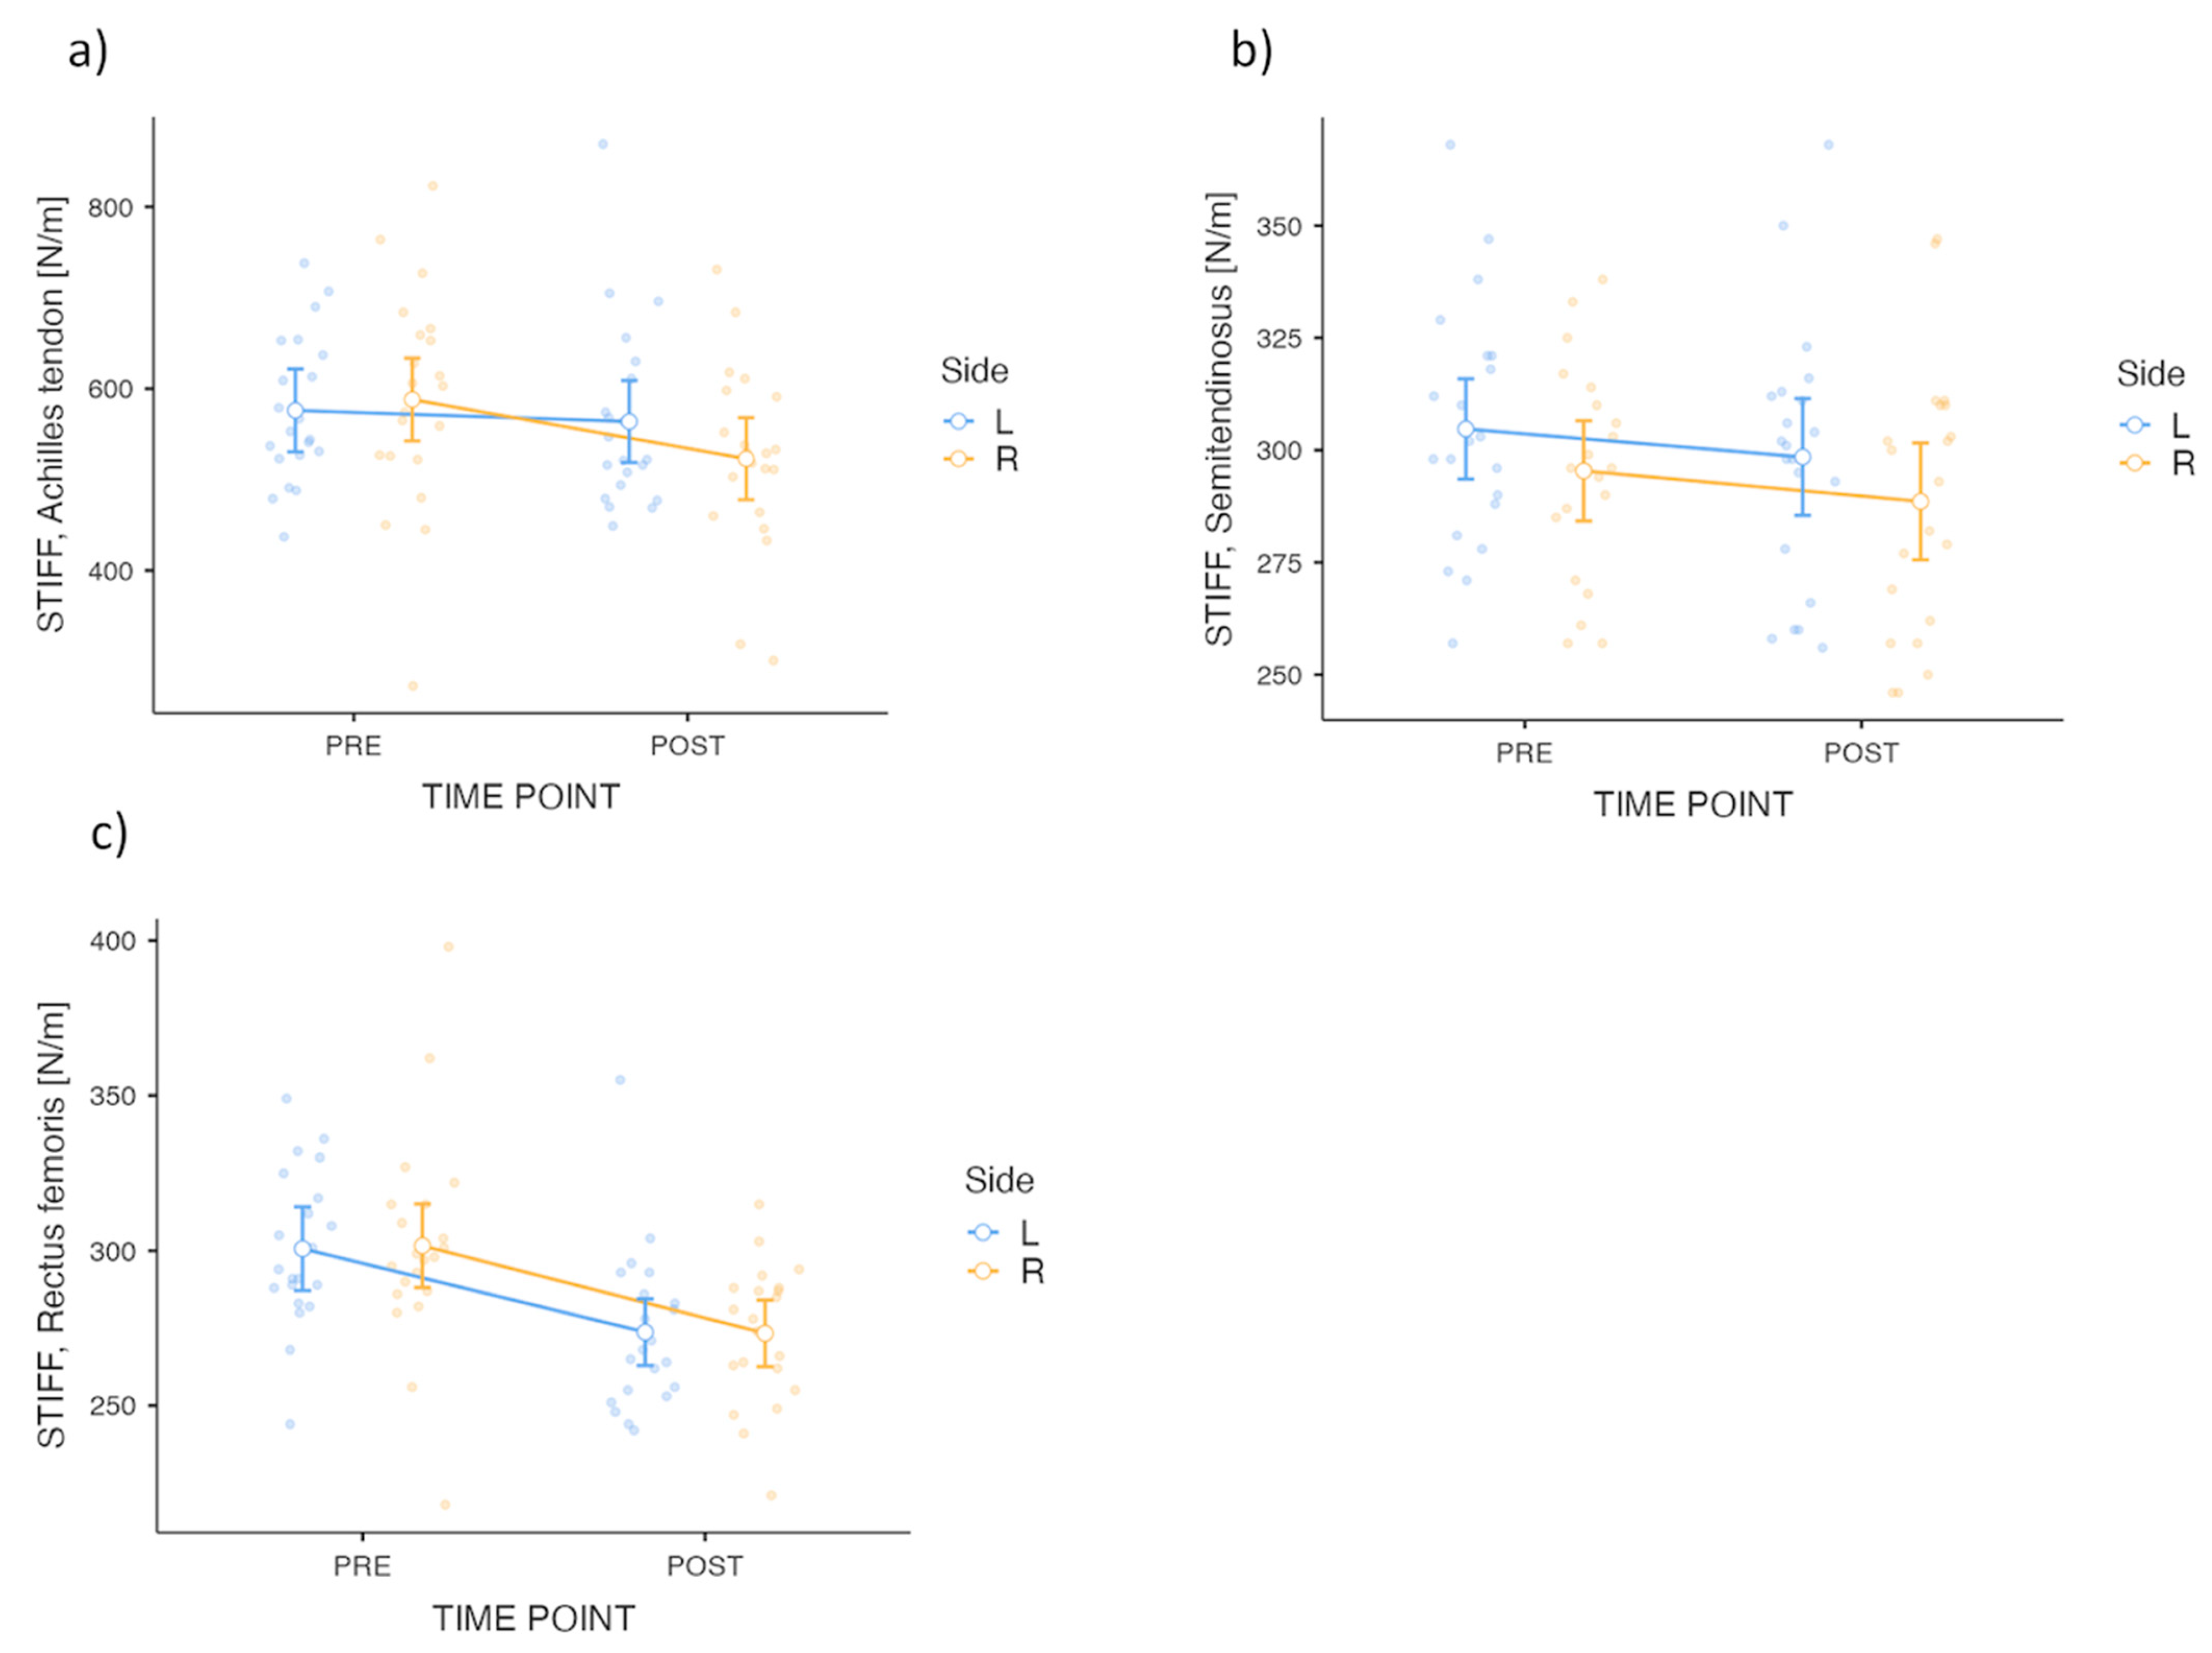
3. Results
4. Discussion
4.1. Heterogenity of Acute Alterations of Viscoelastic Properties
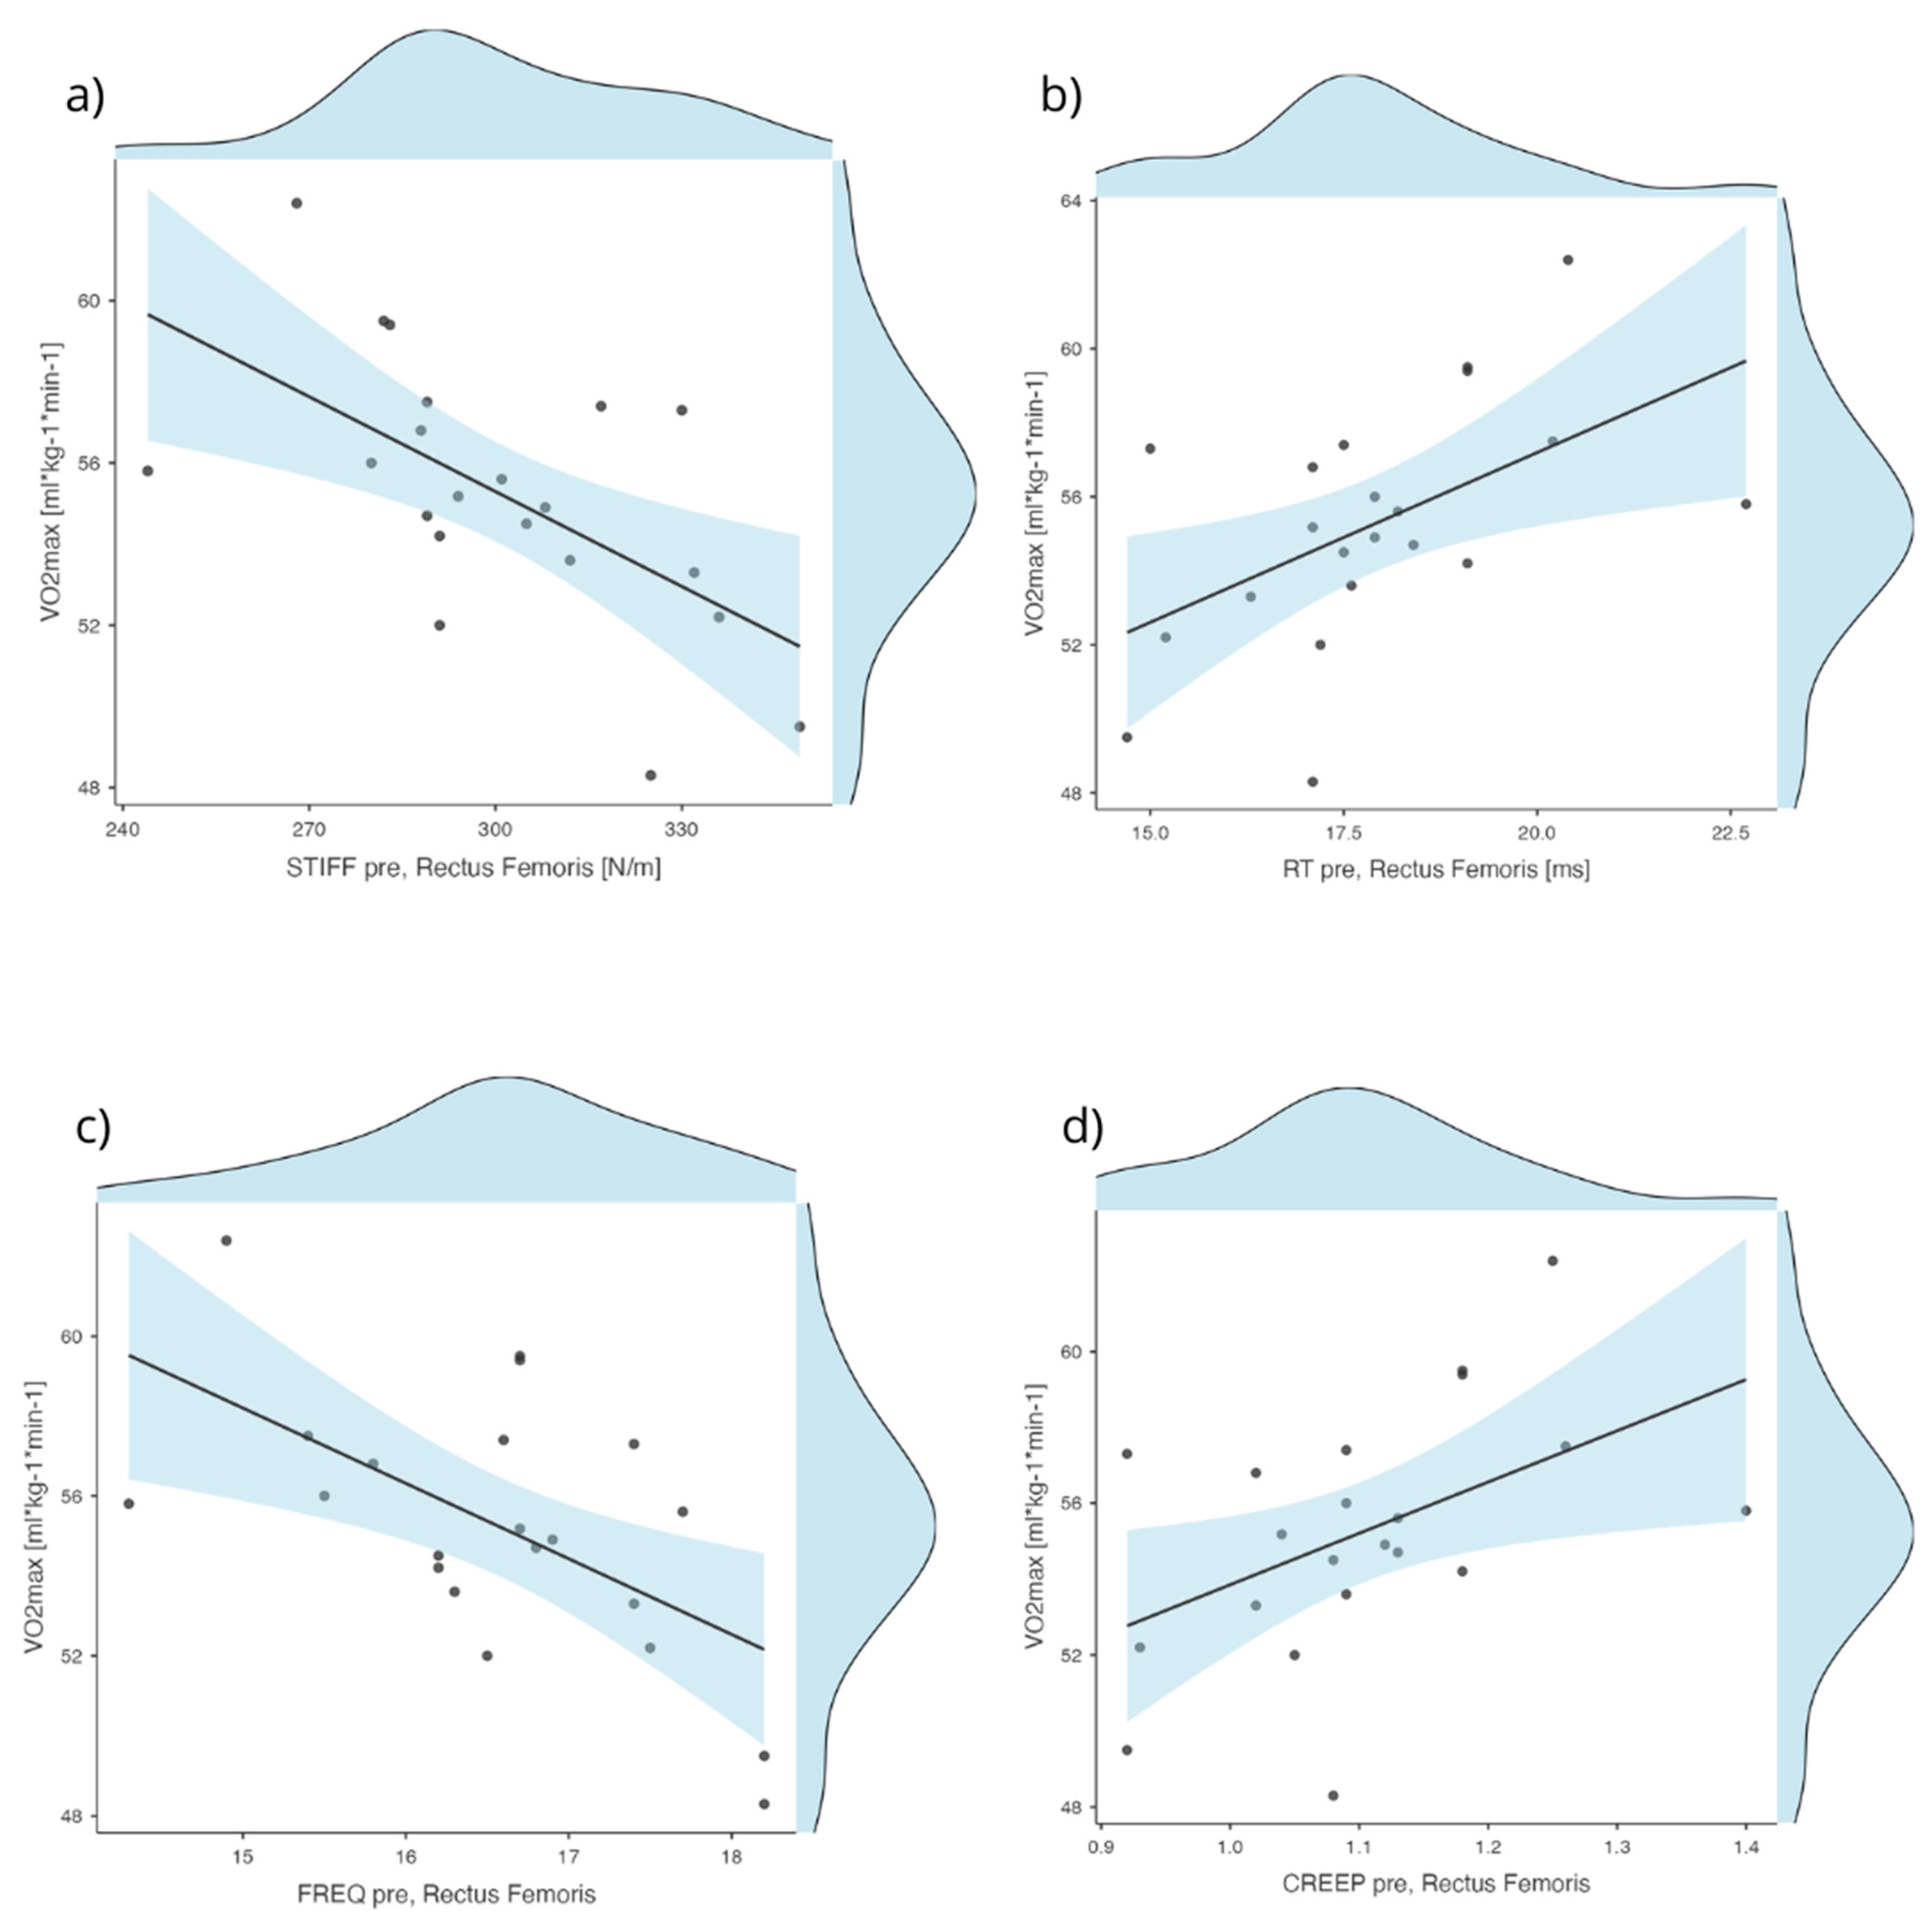
4.2. Viscoelastic Properties of the Rectus Femoris as an Indicator of Readiness for Exhaustive Exercise Testing
4.3. Limitations
4.4. Practical Implications
5. Conclusions
Author Contributions
Funding
Institutional Review Board Statement
Informed Consent Statement
Data Availability Statement
Conflicts of Interest
Abbreviations
| AT | Achilles Tendon |
| BF | Biceps Femoris |
| CI | Confidence Interval |
| DEC | Logarithmic Decrement (measure of elasticity) |
| FREQ | Natural Oscillation Frequency (Hz), characterizing muscle tone |
| HR | Heart rate |
| ICC | Intraclass Correlation Coefficient |
| LA | Lactate |
| MOS | Sternocleidomastoid |
| PAPE | Post-Activation Performance Enhancement |
| PRE/POST | Pre-exercise/Post-exercise |
| RF | Rectus Femoris |
| R/L | Right/Left |
| RL | Relaxation Time (ms) |
| S | Semitendinosus |
| SD | Standard Deviation |
| VO2 | Oxygen consumption |
| VO2max | Maximal Oxygen Uptake |
| VE | Minute Ventilation |
References
- Serpell, B.G.; Ball, N.B.; Scarvell, J.M.; Smith, P.N. A review of models of vertical, leg, and knee stiffness in adults for running, jumping or hopping tasks. J. Sports Sci. 2012, 30, 1347–1363. [Google Scholar] [CrossRef] [PubMed]
- Jarosz, J.; Gaweł, D.; Krzysztofik, M.; Zając, A.; Tsoukos, A.; Bogdanis, G.C.; Wilk, M. Effects of blood flow restriction on viscoelastic properties of the rectus femoris muscle at rest. Front. Physiol. 2023, 14, 1244376. [Google Scholar] [CrossRef] [PubMed]
- Bret, C.; Rahmani, A.; Dufour, A.B.; Messonnier, L.; Lacour, J.R. Leg strength and stiffness as ability factors in 100 m sprint running. J. Sports Med. Phys. Fitness 2002, 42, 274–281. [Google Scholar]
- Hobara, H.; Kimura, K.; Omuro, K.; Gomi, K.; Muraoka, T.; Iso, S.; Kanosue, K. Determinants of difference in leg stiffness between endurance- and power-trained athletes. J. Biomech. 2008, 41, 506–514. [Google Scholar] [CrossRef] [PubMed]
- Austin, G.P.; Garrett, G.E.; Tiberio, D. Effect of added mass on human unipedal hopping. Percept. Mot. Ski. 2002, 94, 834–840. [Google Scholar] [CrossRef]
- Butler, R.J.; Crowell, H.P.; Davis, I.M. Lower extremity stiffness: Implications for performance and injury. Clin. Biomech. 2003, 18, 511–517. [Google Scholar] [CrossRef]
- Akagi, R.; Takahashi, H. Acute effect of static stretching on hardness of the gastrocnemius muscle. Med. Sci. Sports Exerc. 2013, 45, 1348–1354. [Google Scholar] [CrossRef]
- Borges, P.R.; Santos, T.R.; Procópio, P.R.; Chelidonopoulos, J.H.; Zambelli, R.; Ocarino, J.M. Passive stiffness of the ankle and plantar flexor muscle performance after Achilles’ tendon repair: A cross-sectional study. Braz. J. Phys. Ther. 2017, 21, 51–57. [Google Scholar] [CrossRef]
- Yanagisawa, O.; Niitsu, M.; Kurihara, T.; Fukubayashi, T. Evaluation of human muscle hardness after dynamic exercise with ultrasound real-time tissue elastography: A feasibility study. Clin. Radiol. 2011, 66, 815–819. [Google Scholar] [CrossRef]
- Andonian, P.; Viallon, M.; Le Goff, C.; de Bourguignon, C.; Tourel, C.; Morel, J.; Giardini, G.; Gergele, L.; Millet, G.P.; Croisille, P. Shear-Wave Elastography Assessments of Quadriceps Stiffness Changes prior to, during and after Prolonged Exercise: A Longitudinal Study during an Extreme Mountain Ultra-Marathon. PLoS ONE 2016, 11, e0161855. [Google Scholar]
- Kalkhoven, J.T.; Watsford, M.L. The relationship between viscoelastic stiffness and athletic performance markers in sub-elite footballers. J. Sports Sci. 2018, 36, 1022–1029. [Google Scholar] [CrossRef] [PubMed]
- Krzysztofik, M.; Wilk, M.; Pisz, A.; Kolinger, D.; Tsoukos, A.; Zając, A.; Bogdanis, G.C. Acute effects of varied back squat activation protocols on muscle-tendon stiffness and jumping performance. J. Strength Cond. Res. 2023, 37, 1419–1427. [Google Scholar] [CrossRef]
- Jones, D.A.; Newham, D.J.; Clarkson, P.M. Skeletal muscle stiffness and pain following eccentric exercise of the elbow flexors. Pain 1987, 30, 233–242. [Google Scholar] [CrossRef] [PubMed]
- Balci, B.P. Spasticity Measurement. Noro Psikiyatr Ars 2018, 55, S49–S53. [Google Scholar]
- Brandenburg, J.E.; Eby, S.F.; Song, P.; Zhao, H.; Brault, J.S.; Chen, S.; An, K.N. Ultrasound elastography: The new frontier in direct measurement of muscle stiffness. Arch. Phys. Med. Rehabil. 2014, 95, 2207–2219. [Google Scholar] [CrossRef] [PubMed]
- Fröhlich-Zwahlen, A.K.; Casartelli, N.C.; Item-Glatthorn, J.F.; Maffiuletti, N.A. Validity of resting myotonometric assessment of lower extremity muscles in chronic stroke patients with limited hypertonia: A preliminary study. J. Electromyogr. Kinesiol. 2014, 24, 762–769. [Google Scholar] [CrossRef]
- Pożarowszczyk, B.; Pawlaczyk, W.; Smoter, M.; Zarzycki, A.; Mroczek, D.; Kumorek, M.; Witkowski, K.; Adam, K. Effects of Karate Fights on Achilles Tendon Stiffness Measured by Myotonometry. J. Hum. Kinet. 2017, 56, 93–97. [Google Scholar] [CrossRef]
- Orner, S.; Kratzer, W.; Schmidberger, J.; Grüner, B. Quantitative tissue parameters of Achilles tendon and plantar fascia in healthy subjects using a handheld myotonometer. J. Bodyw. Mov. Ther. 2018, 22, 105–111. [Google Scholar] [CrossRef]
- Bizzini, M.; Mannion, A.F. Reliability of a new, hand-held device for assessing skeletal muscle stiffness. Clin. Biomech. 2003, 18, 459–461. [Google Scholar] [CrossRef]
- McKay, A.K.A.; Stellingwerff, T.; Smith, E.S.; Martin, D.T.; Mujika, I.; Goosey-Tolfrey, V.L.; Sheppard, J.; Burke, L.M. Defining Training and Performance Caliber: A Participant Classification Framework. Int. J. Sports Physiol. Perform. 2022, 17, 317–331. [Google Scholar] [CrossRef]
- Thron, M.; Woll, A.; Klos, L.; Härtel, S.; Ruf, L.; Kloss, C.; Altmann, S. Overestimation of maximal aerobic speed by the Université de Montréal track test and a 1500-m-time trial in soccer. Front. Physiol. 2022, 13, 1023257. [Google Scholar] [CrossRef] [PubMed]
- Salagas, A.; Tsoukos, A.; Terzis, G.; Paschalis, V.; Katsikas, C.; Krzysztofik, M.; Wilk, M.; Zajac, A.; Bogdanis, G.C. Effectiveness of either short-duration ischemic pre-conditioning, single-set high-resistance exercise, or their combination in potentiating bench press exercise performance. Front. Physiol. 2022, 13, 1030109. [Google Scholar] [CrossRef] [PubMed]
- Farris, D.J.; Trewartha, G.; McGuigan, M.P. The effects of a 30-min run on the mechanics of the human Achilles tendon. Eur. J. Appl. Physiol. 2012, 112, 653–660. [Google Scholar] [CrossRef] [PubMed]
- De Zee, M.; Bojsen-Moller, F.; Voigt, M. Dynamic viscoelastic behavior of lower extremity tendons during simulated running. J. Appl. Physiol. 2000, 89, 1352–1359. [Google Scholar] [CrossRef]
- Joo, J.M. Use of the Logarithmic decrement to assess the damping in oscillations. Rev. Investig. Fis. 2016, 19, 161901551. [Google Scholar]
- Morgan, G.E.; Martin, R.; Williams, L.; Pearce, O.; Morris, K. Objective assessment of stiffness in Achilles tendinopathy: A novel approach using the MyotonPRO. BMJ Open Sport Exerc. Med. 2018, 4, e000446. [Google Scholar] [CrossRef]
- Fitts, R.H. Cellular mechanisms of muscle fatigue. Physiol. Rev. 1994, 74, 49–94. [Google Scholar] [CrossRef]
- Enoka, R.M.; Duchateau, J. Muscle fatigue: What, why and how it influences muscle function. J. Physiol. 2008, 586, 11–23. [Google Scholar] [CrossRef]

| Characteristic | M ± SD |
|---|---|
| Age [years] | 24 ± 5 |
| Body mass [kg] | 75 ± 7 |
| Body fat [%] | 12.1 ± 2.7 |
| Body height [cm] | 180 ± 6 |
| Resistance training experience [years] | 7.9 ± 2.2 |
| VO2max [mL·kg−1·min−1] | 54.9 ± 3.7 |
| Measure | Side | PRE | POST | ANOVA Effects | ||||
|---|---|---|---|---|---|---|---|---|
| M ± SD (95% CI) | Shapiro–Wilk (p) | M ± SD (95% CI) | Shapiro–Wilk (p) | Time | Side | Time × Side | ||
| AT | R | 0.61 ± 0.16 (0.53, 0.68) | 0.79 (<0.001) | 0.67 ± 0.16 (0.60, 0.75) | 0.82 (0.001) | p > 0.05 | ||
| L | 0.59 ± 0.08 (0.55, 0.63) | 0.96 (0.61) | 0.61 ± 0.09 (0.56, 0.65) | 0.96 (0.49) | ||||
| BF | R | 1.09 ± 0.10 (1.05, 1.13) | 0.94 (0.20) | 1.09 ± 0.09 (1.05, 1.13) | 0.93 (0.16) | p > 0.05 | ||
| L | 1.11 ± 0.10 (1.06, 1.15) | 0.94 (0.21) | 1.10 ± 0.07 (1.07, 1.14) | 0.98 (0.97) | ||||
| S | R | 1.10 ± 0.09 (1.07, 1.14) | 0.95 (0.38) | 1.11 ± 0.10 (1.07, 1.16) | 0.96 (0.49) | p > 0.05 | ||
| L | 1.08 ± 0.08 (1.04, 1.12) | 0.97 (0.80) | 1.09 ± 0.09 (1.05, 1.13) | 0.99 (0.98) | ||||
| RF | R | 1.11 ± 0.11 (1.06, 1.15) | 0.94 (0.18) | 1.18 ± 0.09 (1.15, 1.22) | 0.98 (0.88) | p < 0.001 | p > 0.05 | p > 0.05 |
| L | 1.10 ± 0.12 (1.05, 1.16) | 0.95 (0.37) | 1.19 ± 0.10 (1.14, 1.23) | 0.96 (0.46) | ||||
| MOS | R | 1.17 ± 0.21 (1.07, 1.27) | 0.98 (0.94) | 1.17 ± 0.20 (1.08, 1.26) | 0.92 (0.09) | p > 0.05 | ||
| L | 1.16 ± 0.17 (1.08, 1.23) | 0.95 (0.39) | 1.24 ± 0.13 (1.18, 1.30) | 0.98 (0.97) | ||||
| Measure | Side | PRE | POST | ANOVA Effects | ||||
|---|---|---|---|---|---|---|---|---|
| M ± SD (95% CI) | Shapiro–Wilk (p) | M ± SD (95% CI) | Shapiro–Wilk (p) | Time | Side | Time × Side | ||
| AT | R | 9.41 ± 2.85 (8.11, 10.71) | 0.77 (<0.001) | 10.53 ± 2.70 (9.30, 11.76) | 0.81 (<0.001) | p > 0.05 | ||
| L | 9.18 ± 1.38 (8.55, 9.81) | 0.97 (0.74) | 9.43 ± 1.53 (8.73, 10.13) | 0.96 (0.46) | ||||
| BF | R | 17.64 ± 1.71 (16.86, 18.42) | 0.95 (0.40) | 17.77 ± 1.57 (17.05, 18.49) | 0.93 (0.11) | p > 0.05 | ||
| L | 18.08 ± 1.76 (17.27, 18.88) | 0.94 (0.22) | 18.18 ± 1.50 (17.50, 18.86) | 0.94 (0.22) | ||||
| S | R | 18.03 ± 1.48 (17.35, 18.70) | 0.96 (0.52) | 18.34 ± 1.77 (17.54, 19.15) | 0.97 (0.69) | p > 0.05 | ||
| L | 17.53 ± 1.41 (16.88, 18.17) | 0.98 (0.88) | 17.80 ± 1.55 (17.09, 18.50) | 0.99 (0.99) | ||||
| RF | R | 17.98 ± 1.87 (17.13, 18.83) | 0.96 (0.48) | 19.50 ± 1.43 (18.86, 20.15) | 0.97 (0.81) | p > 0.05 | ||
| L | 17.87 ± 1.88 (17.02, 18.73) | 0.95 (0.39) | 19.51 ± 1.68 (18.75, 20.28) | 0.96 (0.56) | ||||
| MOS | R | 20.07 ± 4.02 (18.24, 21.90) | 0.97 (0.77) | 20.09 ± 3.85 (18.34, 21.84) | 0.94 (0.17) | p > 0.05 | ||
| L | 19.88 ± 3.31 (18.37, 21.38) | 0.97 (0.77) | 21.59 ± 2.32 (20.54, 22.64) | 0.97 (0.63) | ||||
| Measure | Side | PRE | POST | ANOVA Effects | ||||
|---|---|---|---|---|---|---|---|---|
| M ± SD (95% CI) | Shapiro–Wilk (p) | M ± SD (95% CI) | Shapiro–Wilk (p) | Time | Side | Time × Side | ||
| AT | R | 0.98 ± 0.16 (0.91, 1.05) | 0.94 (0.21) | 0.99 ± 0.18 (0.91, 1.07) | 0.91 (0.05) | p > 0.05 | ||
| L | 1.07 ± 0.21 (0.97, 1.17) | 0.95 (0.28) | 1.13 ± 0.21 (1.03, 1.22) | 0.95 (0.31) | ||||
| BF | R | 1.44 ± 0.23 (1.34, 1.54) | 0.96 (0.53) | 1.42 ± 0.14 (1.35, 1.48) | 0.92 (0.07) | p > 0.05 | ||
| L | 1.29 ± 0.19 (1.20, 1.37) | 0.94 (0.20) | 1.31 ± 0.20 (1.22, 1.40) | 0.91 (0.05) | ||||
| S | R | 1.45 ± 0.16 (1.38, 1.53) | 0.96 (0.44) | 1.39 ± 0.15 (1.33, 1.46) | 0.96 (0.46) | p > 0.05 | ||
| L | 1.53 ± 0.16 (1.46, 1.60) | 0.90 (0.04) | 1.49 ± 0.14 (1.43, 1.56) | 0.94 (0.17) | ||||
| RF | R | 1.30 ± 0.18 (1.22, 1.38) | 0.96 (0.46) | 1.24 ± 0.23 (1.14, 1.35) | 0.95 (0.37) | p > 0.05 | p = 0.031 | p > 0.05 |
| L | 1.43 ± 0.24 (1.32, 1.54) | 0.93 (0.16) | 1.38 ± 0.22 (1.29, 1.48) | 0.98 (0.88) | ||||
| MOS | R | 1.02 ± 0.15 (0.96, 1.09) | 0.96 (0.52) | 1.04 ± 0.16 (0.96, 1.11) | 0.97 (0.76) | p = 0.014 | p > 0.05 | p = 0.051 |
| L | 0.95 ± 0.13 (0.89, 1.01) | 0.92 (0.08) | 1.06 ± 0.17 (0.98, 1.13) | 0.96 (0.55) | ||||
| Measure | Side | PRE | POST | ANOVA Effects | ||||
|---|---|---|---|---|---|---|---|---|
| M ± SD (95% CI) | Shapiro–Wilk (p) | M ± SD (95% CI) | Shapiro–Wilk (p) | Time | Side | Time × Side | ||
| AT | R | 25.60 ± 3.67 (23.90, 27.30) | 0.97 (0.61) | 23.50 ± 3.57 (21.90, 25.10) | 0.97 (0.66) | p = 0.017 | p > 0.05 | p > 0.05 |
| L | 25.40 ± 2.61 (24.30, 26.60) | 0.95 (0.41) | 25.00 ± 3.41 (23.50, 26.60) | 0.91 (0.06) | ||||
| BF | R | 16.30 ± 1.33 (15.70, 16.90) | 0.96 (0.55) | 16.50 ± 1.20 (15.90, 17.00) | 0.94 (0.25) | p > 0.05 | ||
| L | 16.10 ± 1.53 (15.40, 16.80) | 0.90 (0.03) | 15.90 ± 1.25 (15.30, 16.50) | 0.96 (0.58) | ||||
| S | R | 17.00 ± 1.24 (16.40, 17.50) | 0.95 (0.33) | 16.60 ± 1.38 (15.90, 17.20) | 0.95 (0.31) | p > 0.05 | ||
| L | 17.10 ± 1.51 (16.50, 17.80) | 0.95 (0.30) | 17.00 ± 1.26 (16.50, 17.60) | 0.86 (0.01) | ||||
| RF | R | 16.50 ± 1.42 (15.80, 17.10) | 0.92 (0.09) | 15.30 ± 0.86 (14.90, 15.70) | 0.96 (0.46) | p < 0.001 | p > 0.05 | p > 0.05 |
| L | 16.60 ± 1.01 (16.10, 17.00) | 0.97 (0.74) | 15.50 ± 0.99 (15.00, 15.90) | 0.87 (0.01) | ||||
| MOS | R | 15.30 ± 2.36 (14.20, 16.40) | 0.95 (0.28) | 15.00 ± 2.14 (14.10, 16.00) | 0.86 (0.01) | p = 0.010 | p > 0.05 | p > 0.05 |
| L | 15.20 ± 1.94 (14.30, 16.10) | 0.94 (0.18) | 14.00 ± 1.07 (13.50, 14.50) | 0.95 (0.37) | ||||
| Measure | Side | PRE | POST | ANOVA Effects | ||||
|---|---|---|---|---|---|---|---|---|
| M ± SD (95% CI) | Shapiro–Wilk (p) | M ± SD (95% CI) | Shapiro–Wilk (p) | Time | Side | Time × Side | ||
| AT | R | 25.60 ± 3.67 (23.90, 27.30) | 0.97 (0.61) | 23.50 ± 3.57 (21.90, 25.10) | 0.97 (0.66) | p = 0.015 | p > 0.05 | p > 0.05 |
| L | 25.40 ± 2.61 (24.30, 26.60) | 0.95 (0.41) | 25.00 ± 3.41 (23.50, 26.60) | 0.91 (0.06) | ||||
| BF | R | 16.30 ± 1.33 (15.70, 16.90) | 0.96 (0.55) | 16.50 ± 1.20 (15.90, 17.00) | 0.94 (0.25) | p > 0.05 | ||
| L | 16.10 ± 1.53 (15.40, 16.80) | 0.90 (0.03) | 15.90 ± 1.25 (15.30, 16.50) | 0.96 (0.58) | ||||
| S | R | 17.00 ± 1.24 (16.40, 17.50) | 0.95 (0.33) | 16.60 ± 1.38 (15.90, 17.20) | 0.95 (0.31) | p = 0.029 | p > 0.05 | p > 0.05 |
| L | 17.10 ± 1.51 (16.50, 17.80) | 0.95 (0.30) | 17.00 ± 1.26 (16.50, 17.60) | 0.86 (0.01) | ||||
| RF | R | 16.50 ± 1.42 (15.80, 17.10) | 0.92 (0.09) | 15.30 ± 0.86 (14.90, 15.70) | 0.96 (0.46) | p < 0.001 | p > 0.05 | p > 0.05 |
| L | 16.60 ± 1.01 (16.10, 17.00) | 0.97 (0.74) | 15.50 ± 0.99 (15.00, 15.90) | 0.87 (0.01) | ||||
| MOS | R | 15.30 ± 2.36 (14.20, 16.40) | 0.95 (0.28) | 15.00 ± 2.14 (14.10, 16.00) | 0.86 (0.01) | p > 0.05 | ||
| L | 15.20 ± 1.94 (14.30, 16.10) | 0.94 (0.18) | 14.00 ± 1.07 (13.50, 14.50) | 0.95 (0.37) | ||||
Disclaimer/Publisher’s Note: The statements, opinions and data contained in all publications are solely those of the individual author(s) and contributor(s) and not of MDPI and/or the editor(s). MDPI and/or the editor(s) disclaim responsibility for any injury to people or property resulting from any ideas, methods, instructions or products referred to in the content. |
© 2025 by the authors. Licensee MDPI, Basel, Switzerland. This article is an open access article distributed under the terms and conditions of the Creative Commons Attribution (CC BY) license (https://creativecommons.org/licenses/by/4.0/).
Share and Cite
Skotniczny, K.; Terbalyan, A.; Krzysztofik, M.; Roczniok, R.; Drozd, M.; Radzimiński, Ł.; Jarosz, J. Acute Heterogeneous Changes in Muscle and Tendon Viscoelastic Properties Following a VO₂max Treadmill Test in High-Level Male Soccer Players. Appl. Sci. 2025, 15, 6986. https://doi.org/10.3390/app15136986
Skotniczny K, Terbalyan A, Krzysztofik M, Roczniok R, Drozd M, Radzimiński Ł, Jarosz J. Acute Heterogeneous Changes in Muscle and Tendon Viscoelastic Properties Following a VO₂max Treadmill Test in High-Level Male Soccer Players. Applied Sciences. 2025; 15(13):6986. https://doi.org/10.3390/app15136986
Chicago/Turabian StyleSkotniczny, Karol, Artur Terbalyan, Michał Krzysztofik, Robert Roczniok, Miłosz Drozd, Łukasz Radzimiński, and Jakub Jarosz. 2025. "Acute Heterogeneous Changes in Muscle and Tendon Viscoelastic Properties Following a VO₂max Treadmill Test in High-Level Male Soccer Players" Applied Sciences 15, no. 13: 6986. https://doi.org/10.3390/app15136986
APA StyleSkotniczny, K., Terbalyan, A., Krzysztofik, M., Roczniok, R., Drozd, M., Radzimiński, Ł., & Jarosz, J. (2025). Acute Heterogeneous Changes in Muscle and Tendon Viscoelastic Properties Following a VO₂max Treadmill Test in High-Level Male Soccer Players. Applied Sciences, 15(13), 6986. https://doi.org/10.3390/app15136986