Article

Effects of Eight-Week Single-Set Resistance Training on Muscle Health, Metabolic Profile and Oxidative Stress in Individuals with Cognitive Impairment

1
RISE-Health, Department of Medical Sciences, Faculty of Health Sciences, University of Beira Interior, 6201-001 Covilhã, Portugal
2
Faculty of Health Sciences, University of Beira Interior, 6201-001 Covilhã, Portugal
3
Department of Sport Sciences, University of Beira Interior, 6201-001 Covilhã, Portugal
4
Research Centre in Sport Sciences, Health Sciences and Human Development (CIDESD), 6201-001 Covilhã, Portugal
5
Department of Mathematics and Center of Mathematics and Applications, University of Beira Interior, Avenida Marquês D’Ávila e Bolama, 6200, 6201-001 Covilhã, Portugal
6
Navarrabiomed, Hospital Universitario de Navarra (HUN), Instituto de Investigación Sanitaria de Navarra (IdiSNA), Universidad Pública de Navarra (UPNA), 31000 Pamplona, Spain
7
CIBER of Frailty and Healthy Aging (CIBERFES), Instituto de Salud Carlos III, 28029 Madrid, Spain
*
Author to whom correspondence should be addressed.
Appl. Sci. 2025, 15(13), 7091; https://doi.org/10.3390/app15137091
Submission received: 23 May 2025 / Revised: 20 June 2025 / Accepted: 21 June 2025 / Published: 24 June 2025
(This article belongs to the Special Issue Advances in Sport Physiology, Nutrition, and Metabolism)

Abstract

Resistance training (RT) has emerged as an effective strategy to counteract the deleterious effects of aging, improving metabolic health, and preserving functional capacity. However, the impact of low-volume RT on older adults, particularly those with cognitive impairment, remains underexplored. This study investigated the effects of an eight-week low-volume RT program on muscle health, liver function, lipid profile, glycemic control, and oxidative stress markers in individuals with cognitive decline. Twenty-eight participants were assigned to a low-volume RT group (81.0 ± 9.66) and a control group (90.0 ± 10.39 years). The low-volume RT group performed an 8-week RT program (two sessions per week) comprised of one set of 6–12 repetitions at 40–70% 1RM. The control group did not receive the intervention. Before and after the 8 weeks, the biomarkers of muscle health, metabolic profile, and oxidative stress were assessed. The results showed no significant differences between the groups in any biomarker at the baseline or post-test. The intervention group showed a significant increase in serum lactate dehydrogenase, aspartate aminotransferase (AST), and alanine aminotransferase (ALT) activities, all of which remained within normal ranges. No changes were observed in serum creatine kinase activity or the AST/ALT ratio in the intervention group, suggesting that acute-phase responses were occurring rather than tissue damage. Additionally, the intervention group showed a significant increase in high-density lipoprotein cholesterol levels, accompanied by a reduction in the atherogenic index, indicating potential cardiovascular benefits. No significant alterations were detected in the glycemic control and lipid peroxidation markers. These results suggest that low-volume RT can elicit modest, yet clinically meaningful metabolic improvements in individuals with cognitive impairment. Future studies should focus on identifying the minimal effective RT dose needed to optimize the health benefits in this vulnerable population, facilitating long-term adherence to exercise interventions.

1. Introduction

Aging is a natural and ubiquitous process that leads to the progressive impairment of multiple functions. Imbalance in antioxidant defenses [1]; metabolic dysfunction, including insulin resistance and changes in lipid profile [2]; cognitive impairment and decline in physical function due to the loss of muscle mass and function (sarcopenia); reduced mobility; and an increased risk of frailty [3] are some of the changes that occur with aging [4].
According to the World Health Organization, population aging is a growing global trend, and by 2050, 22% of the world’s population is expected to be over 60 years old [5]. As life expectancy increases, so does the prevalence of chronic diseases, with 80% of older people suffering from at least one disease, and 77% facing two or more diseases [5], putting a strain on healthcare systems and public finances.
Resistance training (RT) is an effective non-pharmacological intervention for delaying and reducing the detrimental effects of aging, thereby improving people’s quality of life, while preserving physical and cognitive health [6,7,8,9]. RT can have a significant impact on maintaining or improving muscle strength, mobility, muscle recovery, and functional independence [7,10], which are crucial aspects for preserving autonomy and preventing frailty associated with aging [11]. In addition, RT has shown beneficial effects on lipid control [12], oxidative stress [13], and cognitive function [14]. However, in frail, older adults, especially those with cognitive impairment, higher-volume training may reduce adherence and increase fatigue or the risk of injury [15]. For this reason, low-volume protocols, such as single-set resistance training, have been proposed as a safe and more feasible alternative [16]. In individuals with type 2 diabetes, Wan and Su (2024) [17] reported pronounced reductions in glycated hemoglobin (HbA1c) levels following a training regimen consisting of three sets of resistance exercises, showing the clinical relevance of RT for metabolic health. Improvements in selective attention, working memory, and verbal fluency have also been reported [18]. These benefits are mediated by mechanisms such as neuroplasticity, cardiometabolic modulation, glycemic regulation, and reduced inflammation, factors that mitigate the impacts of brain aging [19,20]. In this sense, the beneficial effects of RT on cognitive and brain health have been proposed to be comparable to those of an aerobic training regimen, reinforcing its role not only in strengthening the body, but also in preserving brain health and general well-being [21,22].
Although the RT benefits have been described, there is a paucity of research regarding the impact of low-volume exercise protocols (e.g., a single set or one set per exercise), especially in individuals with cognitive impairment. Most RT programs focus on high-volume training, and the evidence on the effects of low-volume RT is limited, which makes it difficult to understand the physiological adaptations in older populations [23,24,25]. Several factors, such as physical limitations, fear of injury, and lack of motivation, often prevent older adults from participating in more demanding training programs [26]. Furthermore, the lack of time is also frequently reported as a barrier to engaging in physical exercise programs [16,27]. Considering the reported barriers to physical exercise engagement, a low-volume RT dose can be a practical alternative to overcome these issues, as it has been indicated to be an effective strategy to improve strength- and health-related components [28]. In this context, a low-volume RT protocol offers a time-efficient, low-burden, and highly feasible option for institutionalized individuals, particularly those with cognitive or functional limitations, where adherence is a critical challenge [29]. Despite its practicality, the physiological effects of such RT approaches remain understudied in vulnerable, older populations. The evidence is scarce regarding the effectiveness of low-volume RT exercise on the biomarkers of muscle health, metabolic profile, and oxidative stress in cognitively impaired individuals.
Therefore, considering the existing research gaps, the current study aimed to investigate the impact of an 8-week low-volume RT regimen on several serum biochemical markers in individuals with cognitive impairment. Specifically, this study evaluated muscle damage upon exercise using markers such as creatine kinase (CK) and lactate dehydrogenase (LDH). Furthermore, we investigated the activity of liver transaminases to monitor liver function [30,31], a crucial aspect given the frailty of the target population of this study [32]. Finally, we investigated the impact of a low-volume RT regimen on their lipid profile (low-density lipoprotein (LDL) and high-density lipoprotein (HDL) cholesterol, total cholesterol, atherogenic index, and triglycerides), glycemic control parameters (glycated hemoglobin and estimated average glucose), and oxidative stress. We hypothesized that an 8-week low-volume RT intervention would lead to improvements in metabolic and oxidative stress biomarkers in the institutionalized individuals with cognitive impairment. Specifically, we expected increases in the amount of HDL cholesterol, reductions in the total and LDL cholesterol amounts, and a decrease in the atherogenic index, with no significant changes in the markers of liver function (AST and ALT), muscle damage (CK and LDH), and oxidative stress (MDA). If confirmed, our findings would support the safety and efficacy of low-volume RT in this vulnerable population.

2. Materials and Methods

2.1. Experimental Design

This research was part of the TRAIN4BRAIN project, which is registered on ClinicalTrials.gov under ID: NCT06185010 (registered in December 2023, version 2). This study followed an 8-week quasi-experimental design. The participants who could attend the RT sessions at the Sports Sciences Department’s gym at the University of Beira Interior were assigned to the low-volume RT group (1SET). Those unable to attend the RT sessions were placed in the control group (CON). Due to institutional constraints and the participants’ differing availabilities to travel to the university facilities, group allocation was based on practical feasibility rather than randomization. This approach, although potentially introducing selection bias, was necessary to ensure recruitment and compliance within the logistical limitations of this vulnerable population.
Before the intervention, all the participants completed the Dementia Rating Scale (DRS-2) and Short-Physical-Performance Battery (SPPB) test, and blood samples were collected. Following the baseline procedures, the 1SET group participated in an 8-week RT program with two sessions per week, while the CON group continued their usual daily activities without any RT. At the end of the 8 weeks, all the groups underwent the same blood sample collection. Due to the nature of this study, neither the participants nor the exercise coaches were blinded to the procedures conducted in the intervention. The study’s procedures were approved by the Ethics Committee of the University of Beira Interior (approval number: CE-UBI-Pj-2022-065) and were conducted in accordance with the Declaration of Helsinki.

2.2. Subjects’ Recruitment and Eligibility Criteria

Between October and November 2023, the participants were recruited from seven residential care facilities located in the Cova da Beira subregion of Portugal. The second author worked closely with the technical directors and the clinical teams of each institution to identify potential participants. The eligibility requirements included men and women aged 50 or older living in the facility with mild, moderate, or severe cognitive impairment as assessed by the Portuguese version of the DRS-2 [33] and a score of 3 or higher on the SPPB [6]. Individuals were excluded if they had severe physical disabilities (such as being hospitalized, in a wheelchair, or bedridden), advanced dementia (indicating an inability to communicate with the research team and requiring constant care), sustained fractures within the last three months, or were diagnosed with a terminal illness. All the participants gave their informed consent to participate in the study. Figure 1 shows a CONSORT flow diagram. From the one hundred and forty-six institutionalized individuals screened for study eligibility, a total of twenty-eight participants (thirteen in the CON group and fifteen in the 1SET group) were included.

2.3. Resistance Training Program

Over an eight-week period, the participants completed two training sessions per week, separated by a 72 h rest period. Each session began with a 10 min warm-up walking on a treadmill at velocities ranging from 1 to 3 km/h. The participants then performed the following sequence of exercises: (1) a leg press, (2) a chest press, (3) chair squats, and (4) medicine ball throws. For the leg and chest press exercises, the participants performed a specific warm-up of one set of five repetitions at 80% of the training weight. The loads for the leg press gradually increased from 50% to 70% of one-repetition maximum (1RM), while for the chest press, the loads increased from 40% to 60% of 1RM during the intervention, as these intensities are associated with optimizing the ability to generate force rapidly in older adults [34,35]. The number of repetitions was 12 in weeks 1 and 2, 10 in weeks 3 and 4, 8 in weeks 5 and 6, and 6 in weeks 7 and 8. In total, 1SET completed 612 repetitions during the RT program. The participants were encouraged to complete all concentric repetitions as quickly as possible and to control the movement during the eccentric phase (2–3 s). The participants rested for 1 min between exercises. The sessions concluded with a 5 min cool-down period of walking at 40% of maximum walking speed, followed by stretching. Table 1 details the characteristics of the RT program. The sessions were supervised by the second author with the assistance of two undergraduate Sports Sciences students. During all the sessions, the supervisors encouraged the participants to give their maximum effort and closely monitored each session, maintaining a ratio of 1 supervisor to each participant to ensure the correct performance of exercises and maintain safety.

2.4. Blood Sample Collection and Processing

The participants fasted for at least 8 h prior to sample collection. Two tubes were drawn from each participant: one containing a clot activator for serum analysis and another containing an anticoagulant for whole blood analysis. The samples were then transported to the laboratory under refrigeration. The tubes for whole blood analysis were immediately stored at 4 °C until analysis. The tubes containing the clot activator were kept at room temperature for approximately 30 min to allow for clot retraction, and then centrifuged at 3500 rpm for 15 min at room temperature. The resulting supernatant (serum) was carefully collected and stored at 4 °C or −80 °C until analysis.

2.5. Blood Biochemical Analyses

The following blood biochemical parameters were determined: (1) muscle damage and liver function—CK, LDH, aspartate aminotransferase (AST), and alanine aminotransferase (ALT) enzymatic activities; (2) lipid profile—total cholesterol, HDL cholesterol, LDL cholesterol, total cholesterol, atherogenic index, and triglycerides levels; (3) glycemic control—HbA1c levels and mean average glucose; and (4) lipid peroxidation as an indicator of oxidative stress—malondialdehyde (MDA) levels.
All biochemical parameters, except MDA and HbA1c levels, were measured using an Atellica® CH analyzer (Siemens Healthineers, Erlangen, Germany) following standardized procedures as described below. MDA levels were measured using a microplate fluorescence reader SpectraMax® Gemini™ EM Microplate Spectrofluorometer (Molecular Devices, San Jose, CA, USA). HbA1c levels were measured using an Horiba ABX system.

2.5.1. CK Activity Assay

The quantitative determination of serum CK activity was performed using the commercial Atellica® CH Creatine Kinase (CK_L) assay kit (Ref. 11097640, Siemens Healthineers, Erlangen, Germany) according to the manufacturer’s instructions. Briefly, the serum samples were mixed with a reaction buffer containing creatine phosphate and adenosine diphosphate at 37 °C, resulting in the formation of adenosine triphosphate (ATP). Then, ATP was coupled to hexokinase/glucose-6-phosphate dehydrogenase, leading to the production of reduced nicotinamide adenine dinucleotide phosphate (NADPH). The concentration of NADPH was quantified by the increase in absorbance at 340/596 nm, which reflects CK enzyme activity.

2.5.2. LDH Activity Assay

The quantitative determination of serum LDH activity was performed using the commercial Atellica® CH Lactate Dehydrogenase L-P (LDLP) assay kit (Ref. 11097594, Siemens Healthineers) according to the manufacturer’s instructions. Briefly, the serum samples were mixed with a reaction buffer containing L-lactate and nicotinamide adenine dinucleotide (NAD) at 37 °C. In the presence of LDH and NAD, L-lactate is converted to pyruvate and NADH (reduced form of NAD). The amount of NADH produced, which is proportional to the enzymatic activity of LDH, was determined by measuring the increase in absorbance at 340/410 nm.

2.5.3. AST Activity Assay

Serum AST enzyme activity was measured using the commercial Atellica® CH Aspartate Aminotransferase (AST) assay kit (Ref. 11097607, Siemens Healthineers) following the manufacturer’s instructions. Briefly, the serum samples were incubated at 37 °C with a reaction buffer containing L-aspartate and α-ketoglutarate. In the presence of AST, these substrates are converted to L-glutamate and oxaloacetate. In a coupled reaction catalyzed by malate dehydrogenase, oxaloacetate is reduced to malate with the simultaneous oxidation of NADH to NAD+. The decrease in NADH concentration was measured by a reduction in absorbance at 340/410 nm, being proportional to the activity of AST in the samples.

2.5.4. ALT Activity Assay

Serum ALT enzyme activity was measured using the commercial Atellica® CH Alanine Aminotransferase (ALT) assay kit (Ref. 11097605, Siemens Healthineers) following the manufacturer’s instructions. Briefly, the serum samples were incubated at 37 °C with a reaction buffer containing L-Alanine and α-ketoglutarate. ALT catalyzes the formation of L-glutamate and pyruvate, which is subsequently converted to lactate in a coupled reaction catalyzed by lactate dehydrogenase, accompanied by the oxidation of NADH to NAD+. The rate of absorbance decreases at 340/410 nm, reflecting the reduction in NADH concentration, which is proportional to ALT enzymatic activity in the samples.

2.5.5. Total Cholesterol

Serum total cholesterol was quantified using the commercial Atellica® CH Cholesterol_2 (Chol_2) assay kit (Ref. 11097609, Siemens Healthineers) following the manufacturer’s instructions. Briefly, the serum samples were incubated at 37 °C with a reaction buffer in which cholesterol esters were hydrolyzed by cholesterol esterase to release fatty acids and cholesterol. In the presence of oxygen, cholesterol oxidase catalyzes the conversion of cholesterol to cholest-4-en-3-one, producing hydrogen peroxide. Under the catalytic influence of peroxidase, phenol, and 4-aminoantipyrine, a colored complex is formed. The absorbance of this complex at 505/694 nm was measured, which is proportional to the cholesterol concentration in the samples.

2.5.6. HDL Cholesterol

Serum HDL cholesterol was quantified using the commercial Atellica® CH HDL Cholesterol (HDLC) assay kit (Ref. 11537213, Siemens Healthineers), according to the manufacturer’s instructions. This assay employs a two-reagent format and relies on the Accelerator Selective Detergent methodology, which is based on accelerating the reaction of cholesterol oxidase with non-HDL unesterified cholesterol and selectively dissolving HDL using a specific detergent at 37 °C. A colorimetric reaction was subsequently triggered, and color development was measured at 545/694 nm using an endpoint colorimetric technique. The color produced is directly proportional to the amount of HDL cholesterol present in the sample.

2.5.7. Triglycerides

Serum triglycerides were quantified using the commercial Atellica® CH Triglycerides_2 (Trig_2) assay kit (Ref. 11537222, Siemens Healthineers) following the manufacturer’s instructions. Briefly, the serum samples were mixed with a reaction buffer at 37 °C, which initiates sequential enzymatic reactions catalyzed by lipoprotein lipase, glycerol kinase, glycerol-3-phosphate oxidase, and peroxidase. The formation of the end-product quinoneimine is directly proportional to the amount of triglycerides in the sample and was measured at 505/694 nm using an endpoint colorimetric technique.

2.5.8. LDL Cholesterol

Serum LDL cholesterol was calculated from the quantified serum concentrations of total cholesterol, HDL cholesterol, and triglycerides using the Friedewald equation [36]:
LDL-cholesterol = total cholesterol − HDL-cholesterol − (triglycerides/5)

2.5.9. Atherogenic Index

The atherogenic index was calculated using the measured the serum levels of total cholesterol and HDL cholesterol [37] according to the following equation:
Atherogenic index = total cholesterol/HDL-cholesterol

2.5.10. Glycated Hemoglobin

HbA1c concentration was determined in the whole blood samples using a commercially available HbA1c reagent set (Ref. H7546, Horiba Medical, Montpellier, France) and high-performance liquid chromatography with the Horiba ABX system. All the procedures were performed in accordance with the manufacturer’s instructions. The method is based on an antigen–antibody interaction to directly quantify HbA1c in whole blood. Briefly, total hemoglobin and HbA1c were adsorbed onto latex particles, to which an anti-human HbA1c monoclonal antibody was added, forming a complex with latex-HbA1c. A polyclonal IgG antibody was then able to bind to the monoclonal antibody, inducing agglutination. The extent of agglutination, which is proportional to the amount of HbA1c adsorbed onto the surface of latex particles, was measured by absorbance at 660 nm. HbA1c concentration was then determined using a calibration curve.

2.5.11. Estimated Average Glucose

Estimated average glucose was calculated from the measured HbA1c concentrations as described above using the formula established by the A1c-Derived Average Glucose (ADAG) study [38]:
Estimated average glucose (mg/dL) = 28.7 × HbA1c (%) − 46.7

2.5.12. Malondialdehyde

Serum MDA, a by-product of lipid peroxidation, was quantified using the commercial TBARS (TCA Method) assay kit (Ref. 700870, Cayman Chemical, Ann Arbor, MI, USA) following the manufacturer’s instructions. Briefly, the samples were mixed with a reaction buffer containing thiobarbituric acid (TBA) and trichloroacetic acid (TCA) and incubated at 90–100 °C for 1 h to allow for the formation of MDA-TBA adducts. After a 10 min cooling period to stop the reaction, the mixture was centrifuged at 1600× g for 10 min at 4 °C. The resulting supernatant was carefully transferred to an opaque multiwell plate, and fluorescence was measured at an excitation wavelength of 530 nm and an emission wavelength of 550 nm. MDA concentrations were calculated based on a standard curve.

2.6. Statistical Analysis

All statistical analyses were performed using IBM SPSS Statistics Version 29.0.1.0. We assessed data normality using the Shapiro–Wilk test. We performed a Mann–Whitney test to assess the baseline differences between the groups in age, height, and body mass. For the normally distributed variables, we conducted ANCOVA with age as a covariate to analyze the differences between the groups at pre- and post-intervention in terms of the biomarkers of muscle health, metabolic profile, and oxidative stress. We selected age as a covariate to adjust for its potential confounding effect. The non-parametric equivalent test (Quade ANCOVA) was used for the data that were not normally distributed. We used a paired-sample t-test (for normally distributed variables) and the Wilcoxon test (for non-normally distributed variables) to analyze the differences within the groups over time in terms of the biomarkers of muscle health, metabolic profile, and oxidative stress. We report the results as the mean ± standard deviation (SD) for the normally distributed data and the median with interquartile range (Q1 and Q3) for the non-normally distributed data. We calculated the Hedge’s g effect size for the normally distributed variables to assess the magnitude of the differences, and it was interpreted as small (g < 0.30), medium (g: 0.30–0.69), or large (g: ≥0.70). We conducted post-hoc power analysis using G*Power software (v3.1.9.2, Dusseldorf, Germany) for the normally distributed variables using the statistical test “ANCOVA: Fixed effects, main effects and interactions”. Power analysis included the effect size (f), an alpha level of 0.05, a sample size of 28, a numerator of 1, two groups, and one covariate. The graphs were created using GraphPad Prism version 8.0.1.

3. Results

This study included twenty-eight institutionalized individuals aged between 57 and 95 years. Of these, thirteen participants were allocated to CON, and fifteen to 1SET. The participants in the 1SET group completed the intervention with an attendance rate of 88%. No adverse events (e.g., injuries, nausea, and dizziness) were reported during the intervention. Table 2 presents the demographic and anthropometric characteristics of the participants in both the CON and 1SET groups. The data include age, sex distribution, height, body mass, and the level of cognitive impairment. No statistically significant differences were observed between the CON and 1SET groups for age (p = 0.061), height (p = 0.286), or body mass (p = 0.901).

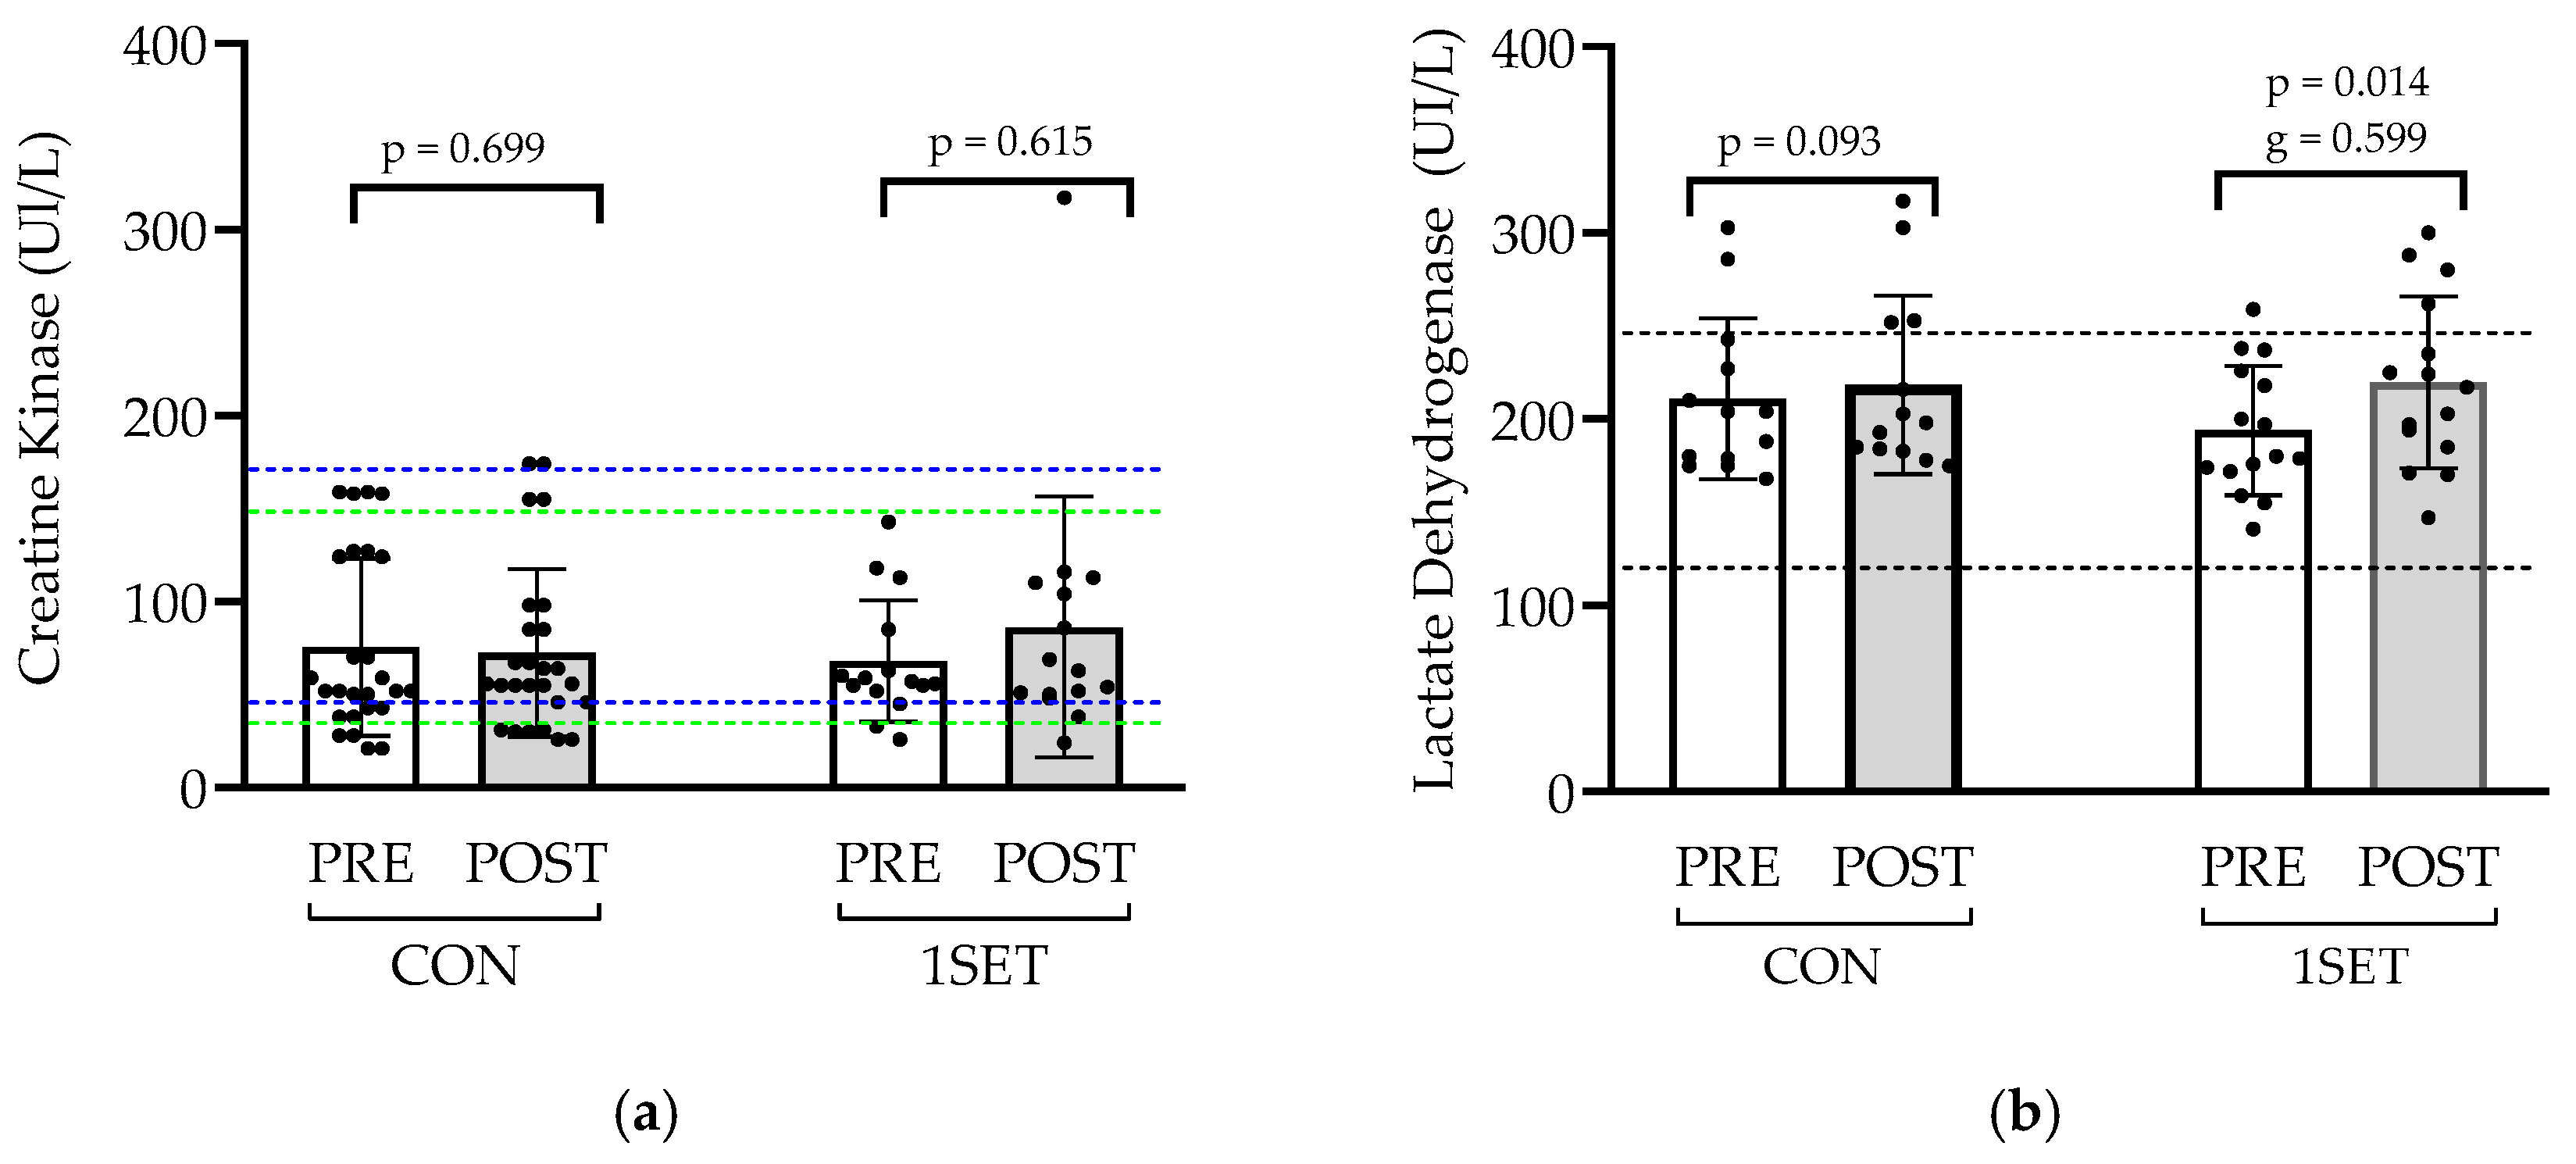
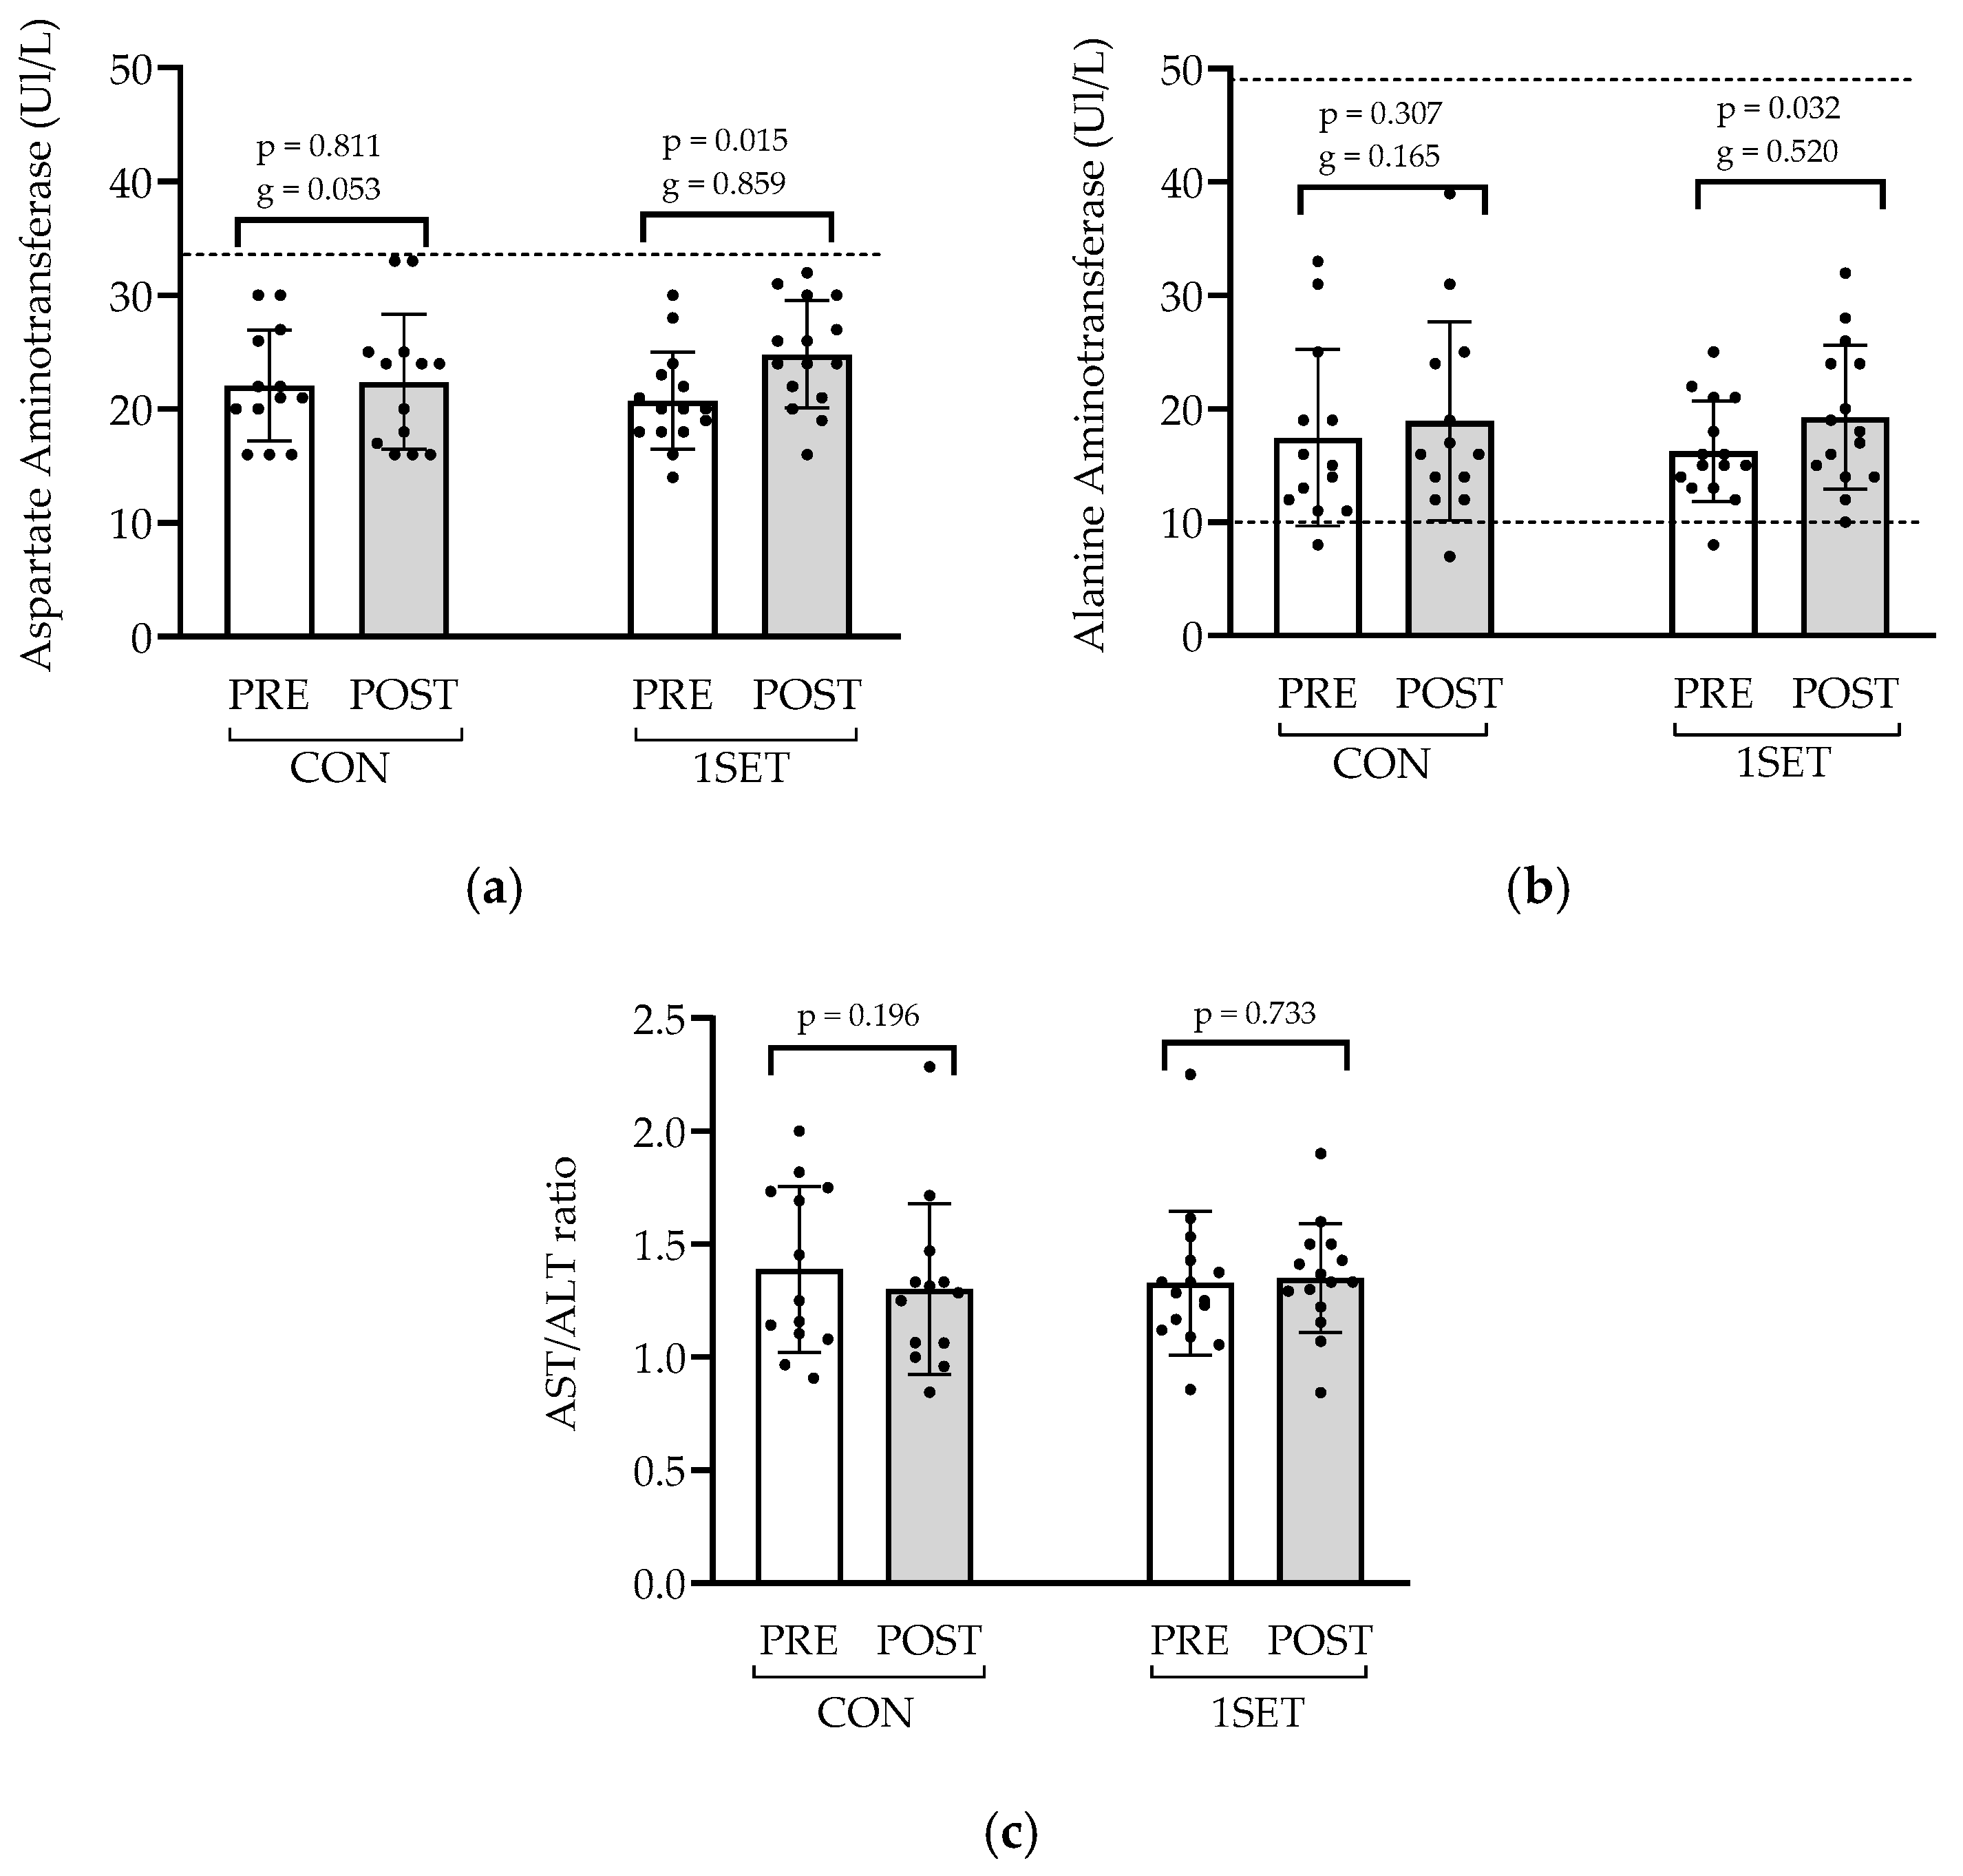
3.1. Effect of 8-Week Low-Volume RT Intervention on Muscle Health and Liver Function

No significant differences were observed between the groups in CK and LDH activities at the baseline (CK: p = 0.682; LDH: p = 0.548) or post-test (CK: p = 0.782; LDH: p = 0.776). Figure 2 shows no significant changes over time in CK activity in either group. In contrast, SET1 showed a moderate increase in LDH activity, from 194.07 ± 34.68 U/L to 219.87 ± 46.00 U/L, although the values remained within the normal reference range (120–246 U/L). No significant changes were observed in the CON group (from 204.0 (177.0, 235.0) U/L to 198.0 (183.5, 252.5) U/L) in LDH.
No significant differences were observed between the groups in AST and ALT activity at the baseline (AST: p = 0.728, g = 0.287; ALT: p = 0.692, g = 0.187) or post-test (AST: p = 0.363, g = 0.441; ALT: p = 0.975, g = 0.044). Figure 3 shows a significant increase in AST activity in the 1SET group, from 20.73 ± 4.23 U/L to 24.80 ± 4.71 U/L, and in ALT activity, from 16.27 ± 4.43 U/L to 19.27 ± 6.32 U/L. These changes occurred within the clinical reference range. No significant changes were observed in the CON group for either enzyme (AST: from 22.08 ± 4.89 U/L to 22.38 ± 5.94 U/L; ALT: from 17.46 ± 7.80 U/L to 18.92 ± 8.75 U/L). There were no significant changes in the AST/ALT ratio in either group. In the 1SET group, the ratio increased from 1.29 (1.12, 1.43) to 1.33 (1.22, 1.50), while in the control group, it changed from 1.25 (1.10, 1.74) to 1.29 (1.03, 1.40). All the values remained above one and within normal physiological limits, with no significant between-group differences (baseline: p = 0.803; post-test: p = 0.308). The post-hoc power analysis of AST (effect size f = 0.225) and ALT (effect size f = 0.022) revealed statistical powers of 0.21 and 0.05, respectively.

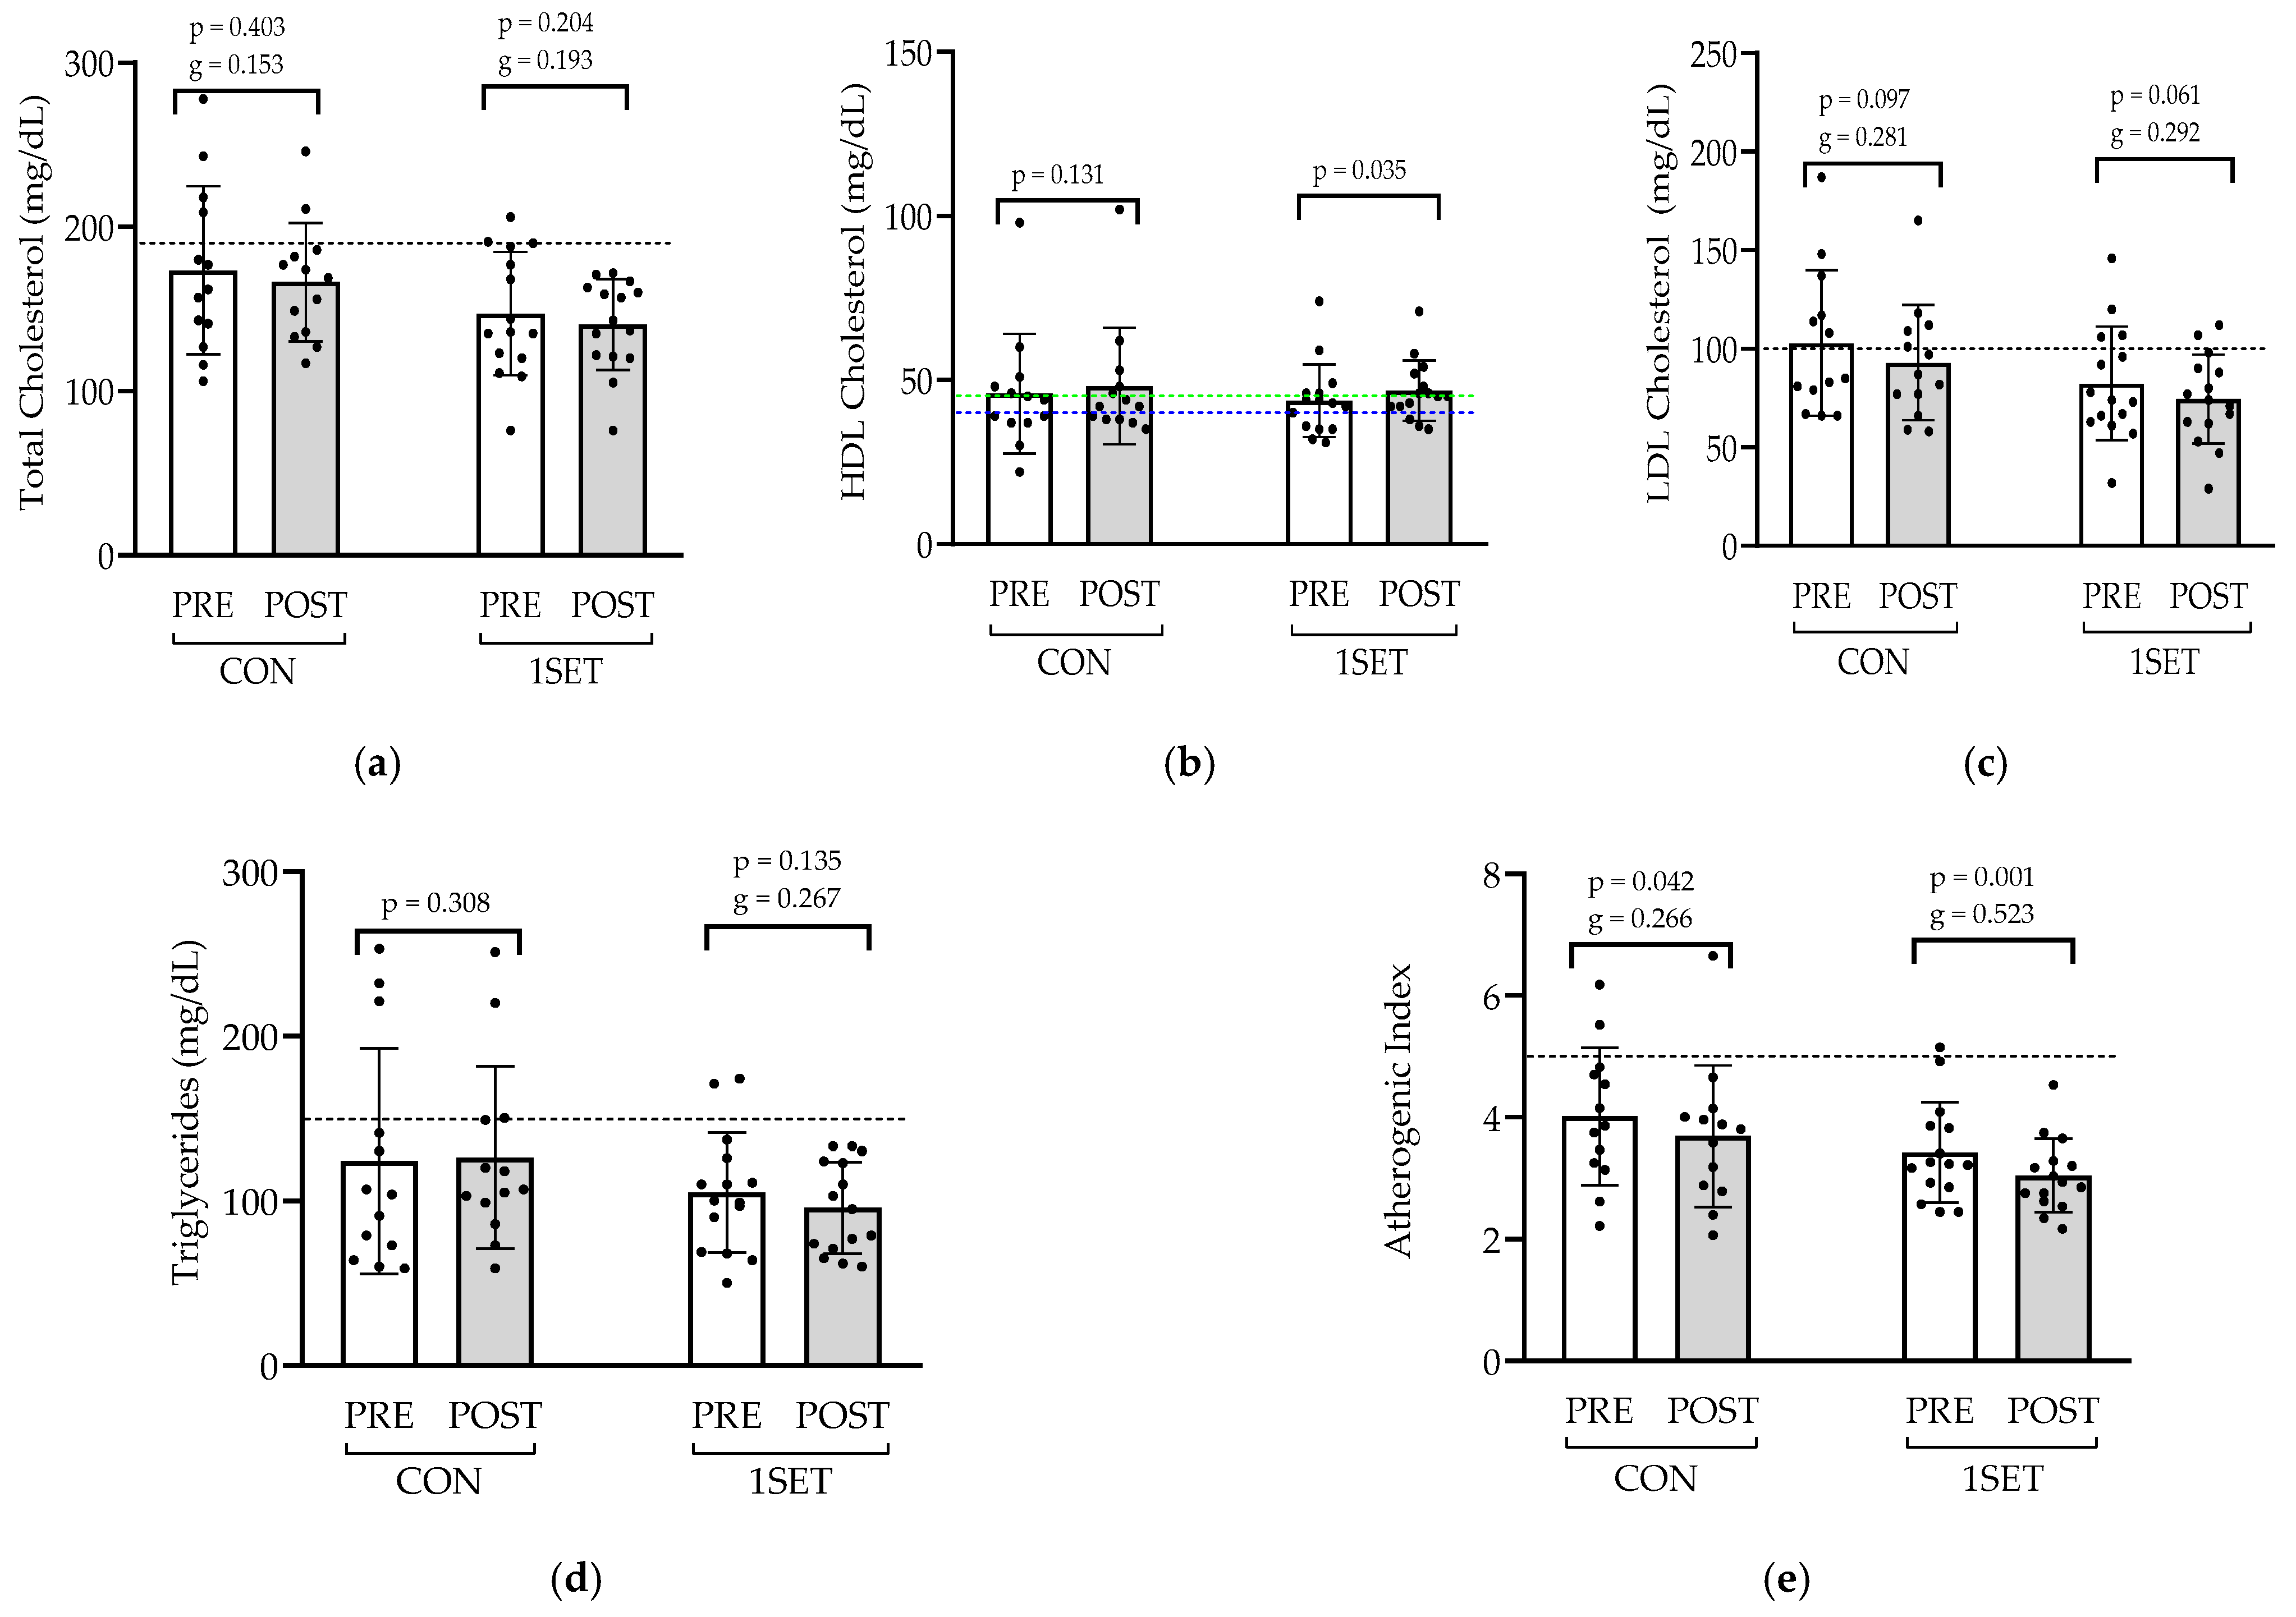
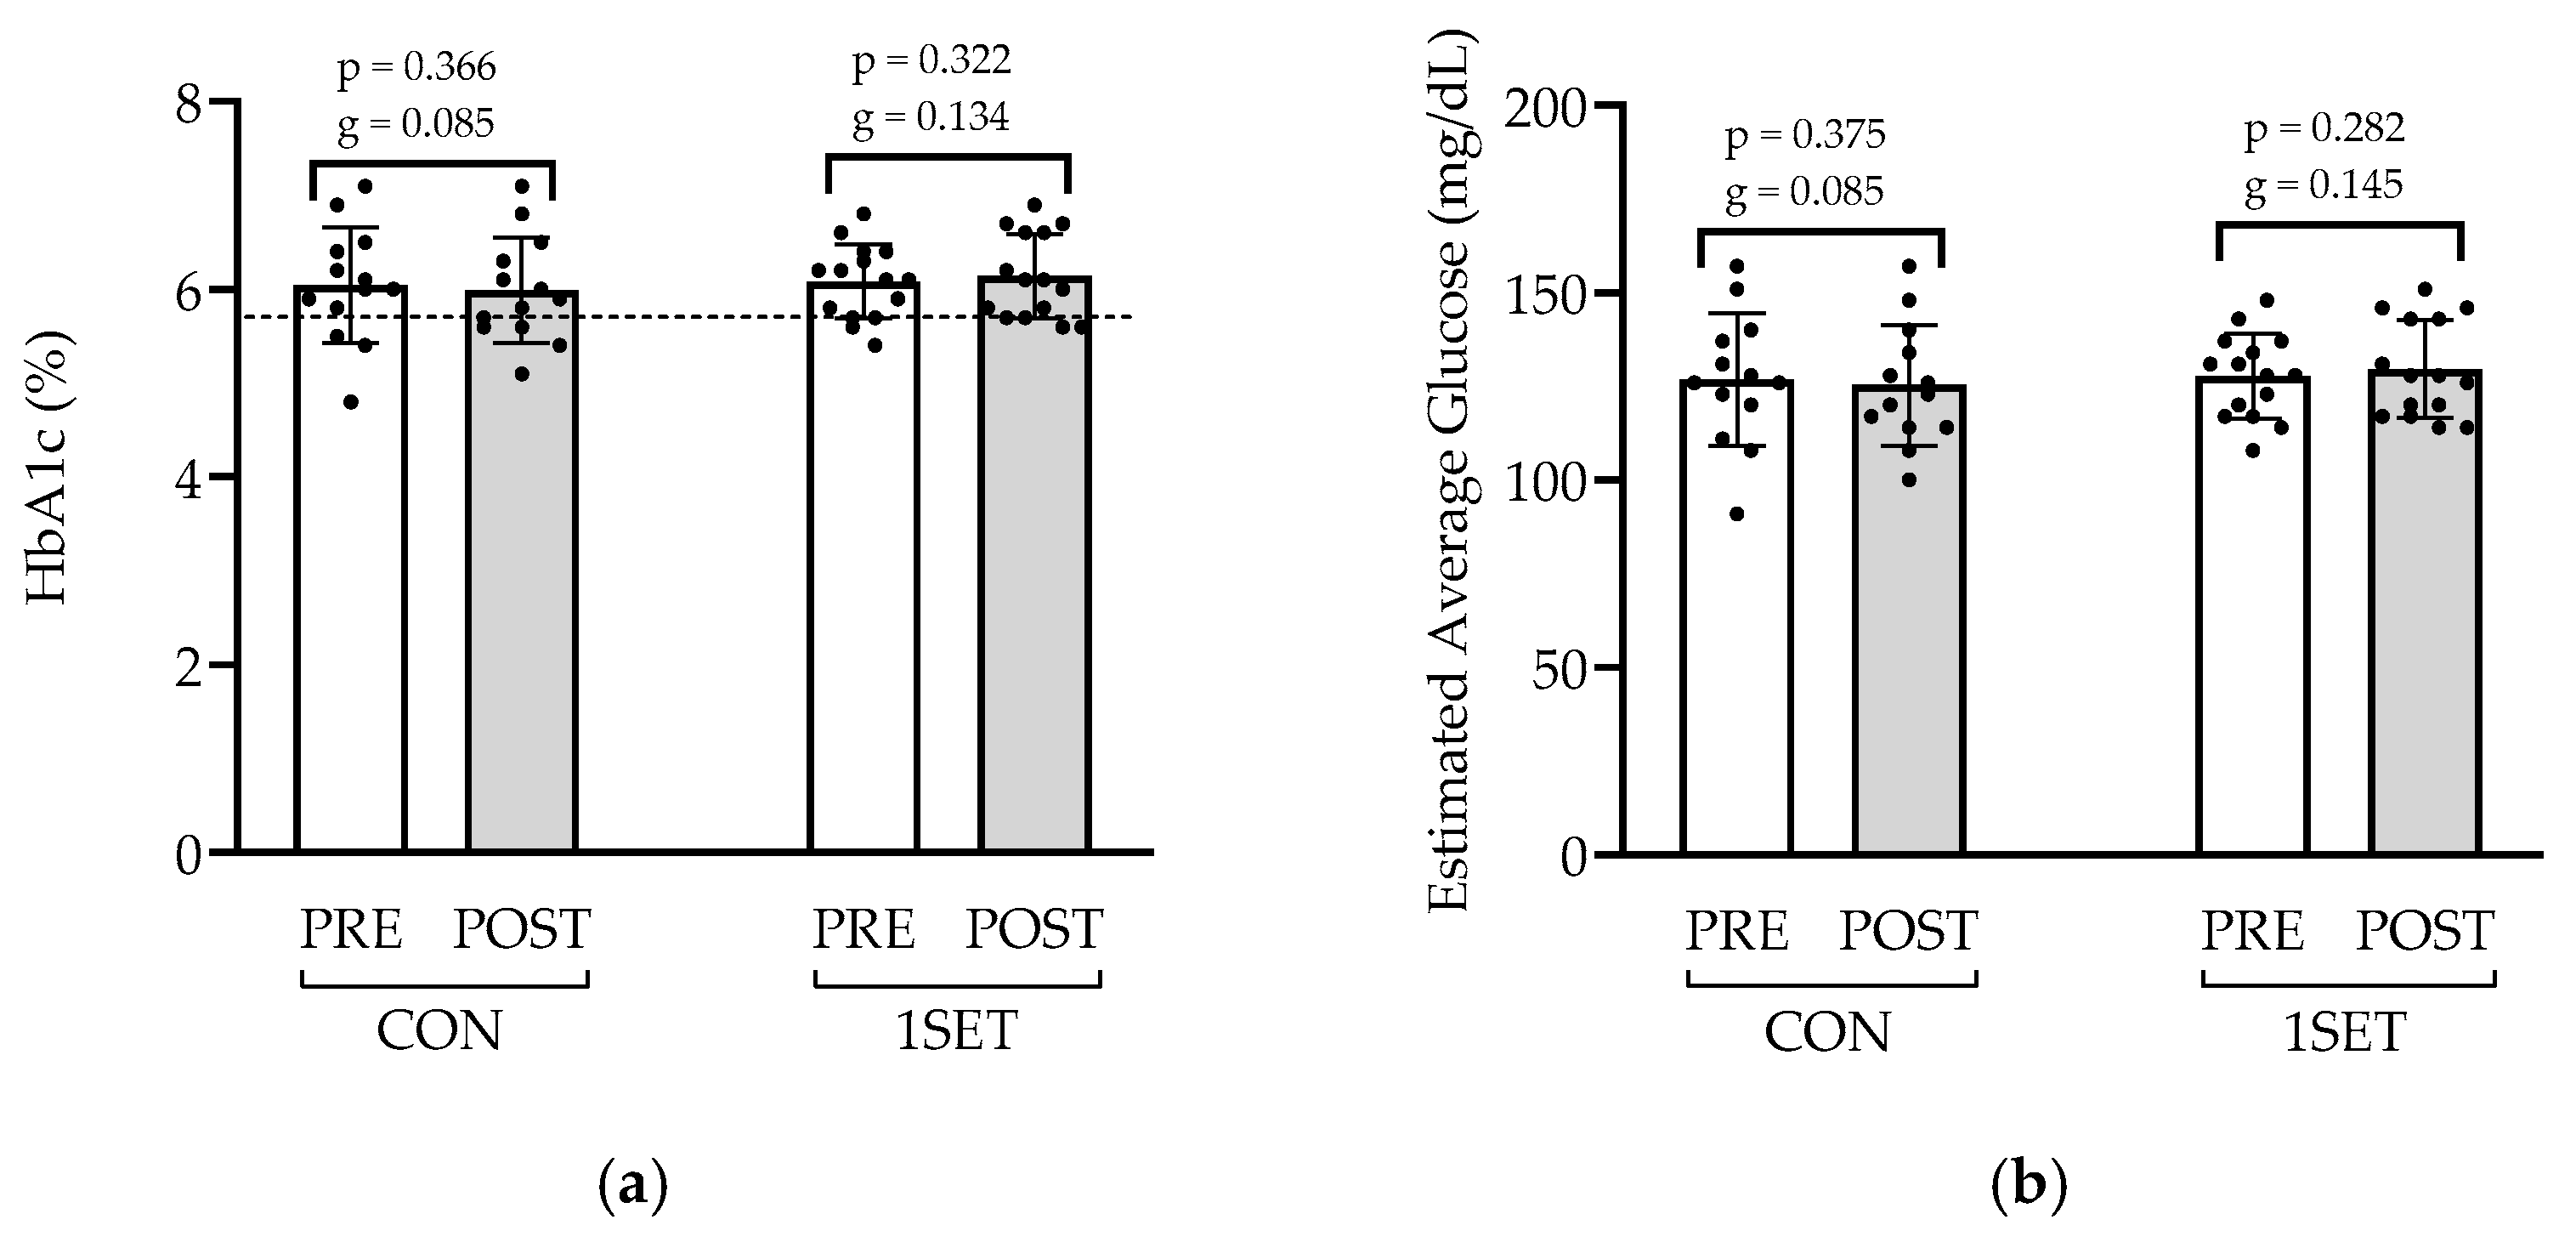
3.2. Effect of 8-Week Low-Volume RT Intervention on Lipid Profile and Glycemic Control

No significant differences were observed between the groups for total cholesterol, HDL cholesterol, LDL cholesterol, triglycerides, or atherogenic index at the baseline (total cholesterol: p = 0.221, g = 0.576; HDL: p = 0.596; LDL: p = 0.195, g = 0.603; triglycerides: p = 0.994; atherogenic index: p = 0.258, g = 0.578) or post-test (total cholesterol: p = 0.077, g = 0.789; HDL: p = 0.845; LDL: p = 0.120, g = 0.690; triglycerides: p = 0.282; atherogenic index: p = 0.126, g = 0.698). Figure 4 shows a significant and moderate increase in the HDL cholesterol levels in the 1SET group, from 43.0 (35.0, 46.0) mg/dL to 45.0 (42.0, 52.0) mg/dL, reaching values within the normal reference range. Additionally, a significant and moderate reduction in the atherogenic index was observed in the 1SET group (from 3.44 ± 0.81 to 3.05 ± 0.59), as well as a significant and small reduction in the CON group (from 4.02 ± 1.13 to 3.69 ± 1.16). No significant changes were detected in the total cholesterol, LDL cholesterol, and triglyceride levels in either group after the intervention. The post-hoc power analysis of total cholesterol (effect size f = 0.395), the atherogenic index (effect size f = 0.349), and LDL cholesterol (effect size f = 0.345) revealed statistical powers of 0.52, 0.43, and 0.42, respectively.
No significant differences were observed between the groups in HbA1c or the estimated average glucose levels at the baseline (HbA1c: p = 0.732, g = 0.065; estimated glucose: p = 0.742; g = 0.059) or post-test (HbA1c: p = 0.508, g = 0.283; estimated glucose: p = 0.499, g = 0.287). Figure 5 shows that the intervention did not result in significant changes in HbA1c and the estimated glucose levels in the 1SET (HbA1c: from 6.08 ± 0.39% to 6.14 ± 0.45%; estimated average glucose: from 127.73 ± 11.23 mg/dL to 129.60 ± 12.99 mg/dL) and CON groups (HbA1c: from 6.05 ± 0.62% to 5.99 ± 0.56%; estimated average glucose: from 126.85 ± 17.66 mg/dL to 125.31 ± 16.12 mg/dL). The HbA1c values were within the normal reference range (<6.5%) in both the groups. The estimated average glucose levels, derived from HbA1c, reflected the same pattern. The post-hoc power analysis of HbA1c (effect size f = 0.141) and estimated average glucose (effect size f = 0.143) revealed a statistical power of 0.11 for both the outcome measures.

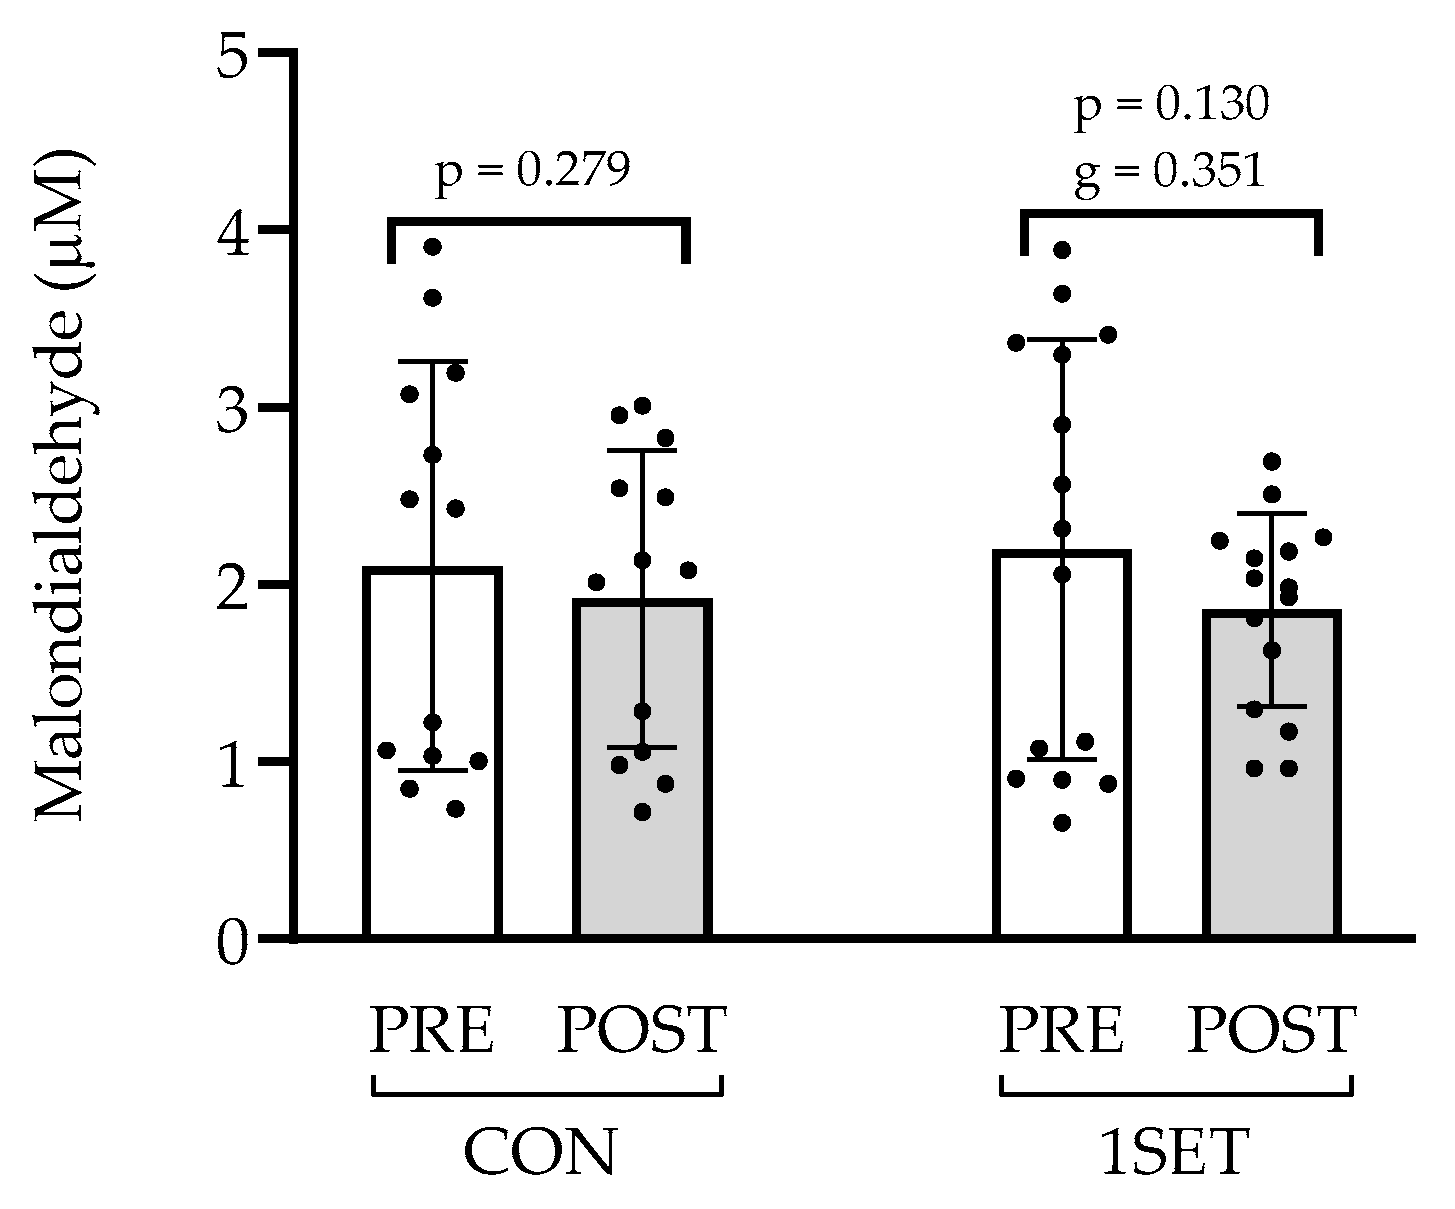
3.3. Effect of 8-Week Low-Volume RT Intervention on Oxidative Stress

No significant differences were observed between the groups in the MDA levels at the baseline (p = 0.845) or post-test (p = 0.681). Figure 6 shows no significant changes in the MDA levels after the intervention in the 1SET (from 2.20 ± 1.18 µM to 1.86 ± 0.54 µM) and CON (from 2.43 (1.03, 3.07) µM to 2.08 (1.06, 2.54) µM) groups. The mean baseline MDA levels were within the normal reference range for human plasma (from 0.26 to 3.94 μM).

4. Discussion

RT is increasingly recognized as an effective non-pharmacological approach that promotes several health benefits and may contribute to improving people’s quality of life, especially in older and more vulnerable populations [7]. The present study aimed to investigate the safety and potential metabolic and antioxidant benefits of a single-set low-volume RT exercise in institutionalized individuals with cognitive impairment. Our results demonstrated that a low-volume RT protocol applied twice a week for 8 weeks was sufficient to elicit significant improvements in specific biochemical health indicators without causing liver dysfunction or muscle damage.

4.1. Muscle Damage and Liver Function Markers

One of the primary concerns regarding the RT protocol used in the present study was ensuring its safety for muscle health and liver function, particularly given the highly vulnerable and functionally limited population enrolled in this study. Although we observed increases in the activities of LDH, AST, and ALT, all the values remained within the normal range. These enzymatic changes likely reflect acute, exercise-induced responses rather than tissue injury or liver dysfunction. The transient elevations in the liver function markers suggest acute physiological adaptations to exercise rather than pathological processes, as further supported by the stable levels of CK activity, a more specific marker of muscle damage [39,40]. Other studies in the literature have shown that exercise may induce transient elevations in liver transaminase levels [41,42,43]. Therefore, we evaluated the impact of low-volume RT intervention on liver function parameters, including AST and ALT enzyme activities, as well as the AST/ALT ratio (Figure 3). This ratio is an indicator of liver function, but it can also be affected by muscle damage, as AST is found in both liver and muscle tissues, while ALT is primarily liver-specific. Given that AST is expressed in skeletal muscle, the AST/ALT ratio serves as a useful tool for distinguishing between the liver and muscular sources of enzyme fluctuations [30,31]. Notably, the AST/ALT ratio remained unchanged pre- and post-intervention and between the 1SET and CON groups post-intervention, reinforcing the interpretation that the observed increases are physiological adaptations rather than indicators of tissue injury or liver dysfunction. Furthermore, the previous studies have shown that RT can induce transient increases in muscle enzymes, which reflect acute metabolic responses and muscle adaptation [44]. Further investigation into the underlying mechanisms is needed to better understand the clinical relevance of these enzyme fluctuations.

4.2. Lipid Profile and Atherogenic Index

Although ANCOVA revealed no significant differences in the total cholesterol levels between the groups after the intervention, a trend towards a reduction was observed in both the groups. This trend suggests that low-volume RT intervention may have a potentially beneficial effect on the total cholesterol levels, which could be confirmed in studies with larger samples or longer duration. There was a significant increase in the serum HDL cholesterol levels and a reduction in the atherogenic index after the 8-week training period relative to the pre-intervention values. These findings suggest that even low-volume RT interventions can induce beneficial effects on lipid metabolism. These changes are clinically relevant since HDL is known to protect the cardiovascular system by facilitating reverse cholesterol transport and modulating inflammatory activity in the vascular endothelium [45]. These effects are especially important in the older population, where preserving cardiovascular health and mitigating inflammatory processes are the key to reducing the atherosclerotic risk and promoting healthy aging [46]. Our findings align with those of other studies published in the literature, which have also reported improvements in lipid parameters following RT interventions, even with low-volume protocols [12,47]. For instance, a randomized controlled trial demonstrated that RT improved the lipid profiles in obese older women following a 12-week intervention [48]. Similarly, the meta-analysis of various exercise modalities demonstrated significant improvements in lipid profiles among older populations following RT exercise (8 and 10 weeks) [49]. Furthermore, another study found that even a low-volume RT protocol effectively reduced cardiovascular risk factors in untrained older women, emphasizing the potential benefits of RT interventions, even with low-volume approaches, over a 6-month period [50].
Surprisingly, a reduction in the atherogenic index was also observed in the CON group, raising important questions about the specificity of the intervention’s effects. This finding raises a significant concern regarding the potential influence of confounding variables in the present study. Although the CON group did not participate in structured training, spontaneous alterations in daily routines, such as modest increases in informal physical activity (e.g., walking within the facility), unmonitored dietary modifications (including changes in nutrient and caloric intake or meal timing), and adjustments in medication regimens (e.g., the initiation or dosage adjustments of lipid-lowering drugs), may have contributed to the unexpected reduction in the atherogenic index, thereby limiting the interpretation and generalization of the results. Moreover, the small sample size may amplify the effects of individual variability, potentially magnifying the impact of isolated changes within the group. Informal reports from staff indicated that at least one participant underwent medication adjustments during the study period. Future studies should incorporate systematic and objective monitoring methods, such as detailed dietary records, accelerometry for physical activity assessment, and comprehensive medication logs, to better control for potential confounding variables. However, it should be noted that implementing such protocols for older populations with cognitive impairment may be particularly challenging, requiring a high level of involvement and sustained commitment from residential institutions, caregivers, and health professionals. Therefore, the design of training protocols must strike a balance between the need for controlled conditions and the feasibility of executing the protocol in real-world environments.

4.3. Glycemic Control

Regarding glycemic control, the absence of significant changes in HbA1c and the estimated average glucose levels following RT may be attributed to the characteristics of the RT protocol, namely its duration (8 weeks) and weekly frequency (two sessions per week). While RT has been shown to acutely enhance insulin sensitivity, particularly in the hours following exercise [51], sustained improvements in glycemic markers such as HbA1c typically require longer-term interventions. Some studies have demonstrated that longer RT protocols, typically ranging from 12 to 24 weeks and involving higher volumes, produce measurable improvements in HbA1c levels in older adults with type 2 diabetes [52,53,54,55]. For instance, Castaneda et al. (2002) reported a significant reduction in HbA1c in older adults after 16 weeks of RT, showing the potential long-term benefits of resistance exercise on glycemic control [53]. Similarly, Ibañez et al. (2005) found improvements in insulin sensitivity following a 16-week RT program in older men, which translated into the better control of HbA1c [56]. Moreover, Misra et al. (2008) demonstrated that RT positively impacted glycemic markers, including HbA1c, in older individuals with metabolic syndrome after 12 weeks of intervention [52]. Since HbA1c reflects the average blood glucose over the two months preceding its measurement, short training periods may be insufficient to elicit measurable changes in this parameter [57].

4.4. Oxidative Stress Marker

Considering that the aging process is associated with increased oxidative stress, which has been implicated in the pathogenesis of neurodegenerative diseases [58], we investigated whether our RT protocol could modulate oxidative stress by assessing the circulating levels of MDA, a biomarker of lipid peroxidation. No significant changes in MDA concentrations were observed following the intervention, nor were there any differences between the 1SET and CON groups at the end of the study. The lack of increase in lipid peroxidation suggests that the RT protocol was not detrimental in promoting oxidative damage, an important consideration when working with older populations. Some studies in the literature report a decrease in oxidative stress levels after 12 or 18 weeks of RT [59,60], while others report no changes even with antioxidant supplementation over 24 weeks [61]. Exercise intensity may also impact oxidative stress. Vincent et al. (2002) investigated the effects of a 6-month RT program with varying intensities [62]. Their results showed a 14% reduction in MDA levels in a group that trained at 50% 1RM, while the group that used 80% 1RM showed a reduction of 18%. In summary, although our RT protocol did not significantly alter the MDA levels, the lack of increased lipid peroxidation suggests that the intervention was safe from an oxidative stress standpoint. Taken together with the previous findings, it is plausible that both exercise duration and intensity play critical roles in modulating oxidative stress. It is essential to acknowledge that although MDA is a widely utilized marker of lipid peroxidation, its limited specificity and inability to detect oxidative damage to other molecules, as well as the variations induced by external factors, represent significant limitations. Therefore, to achieve the more comprehensive assessment of oxidative stress, future studies should include a broader panel of both oxidative and antioxidant biomarkers. The previous studies have shown that resistance exercise can either increase or decrease oxidative stress, depending on the specific characteristics of the training protocols, and possibly the individual’s training status [63,64,65,66]. Therefore, the impact of our low-volume RT protocol on oxidative stress was evaluated by measuring the serum levels of MDA, a by-product of lipid peroxidation and a widely used marker of oxidative stress in cells and tissues (Figure 6). These results suggest that an 8-week low-volume RT protocol does not increase oxidative stress and may be considered a safe training approach for the population under study.

4.5. Methodological Considerations and Study Limitations

When interpreting the present findings, it is essential to acknowledge the methodological limitations that may have influenced the outcomes. First, the small sample size substantially reduced the statistical power to detect subtle effects and limited the generalizability of the results to broader populations. This is particularly important given the interindividual variability often observed in clinical and metabolic parameters. Second, the quasi-experimental design, without random assignment, may have introduced a potential risk of selection bias. The participants were allocated based on practical considerations, including institutional constraints, individual availability, and ease of transport to the training facility. Although this allocation method was not random, there is a risk that unmeasured differences between the groups could have influenced the outcomes. While this approach boosted participant adherence, which is key in studies involving vulnerable populations, it may have compromised the internal validity more compared to that of a randomized controlled trial. Third, the duration of the intervention (8 weeks) may have been insufficient to elicit significant changes in specific metabolic and functional outcomes. Adaptations related to lipid metabolism, glycemic control, and oxidative stress often require longer training periods to present robust physiological effects. Fourth, there was no systematic monitoring of the participants’ spontaneous physical activity outside the intervention sessions. This lack of control, especially in the CON group, introduces the possibility that untracked variations in daily activity may have influenced the metabolic outcomes, limiting the interpretation of intervention effects. Finally, we did not consistently track medication throughout this study. Changes in medication, such as the initiation, discontinuation, and dose adjustment of lipid-lowering or antidiabetic drugs, could have significantly influenced the biochemical markers measured. To strengthen the validity and applicability of future research, we recommend the inclusion of a larger randomized sample; extended intervention durations; and the implementation of objective, systematic methods to track dietary intake, physical activity (e.g., via accelerometry), and medication adherence. These methodological improvements would allow for clearer attribution of observed effects to the intervention and enhance confidence in the intervention’s efficacy.

4.6. Summary and Future Directions

In summary, our findings suggest that a low-volume RT dose can promote modest, yet clinically meaningful improvements in the patients’ metabolic profile without significant changes in the commonly used markers of oxidative stress, liver function, and muscle damage in individuals with cognitive impairment. These findings are particularly important for vulnerable populations, in which safety is the primary concern. Future randomized controlled studies should aim to clarify the relative contributions of training volume, intensity, and duration in optimizing health benefits, particularly in vulnerable populations where safety and adherence are the key concerns. Additionally, age, specific clinical conditions, and baseline physical status should also be considered to design more tailored and effective intervention approaches.

5. Conclusions

The reluctance of older adults to engage in more demanding training programs can be attributed to several factors, such as physical limitations, the fear of injury, and reduced motivation. The findings of this study suggest that preliminary, but meaningful health benefits may be achievable in older adults with cognitive impairment through low-volume RT exercises of a short duration, such as eight weeks. The protocol appeared to be safe with respect to muscle health and liver function, while showing potential improvements in their lipid profile. Although additional benefits might be expected with longer interventions (e.g., improved glycemic control and reduced oxidative stress), future studies should optimize training characteristics, while maintaining low training volumes. These strategies may be particularly relevant since low-volume protocols can enhance long-term adherence to training programs, potentially resulting in sustained health benefits in this population. These findings suggest that low-volume RT protocols may be a promising approach in long-term care facilities, particularly for older adults with cognitive impairment. Given their simplicity, safety, and minimal resource requirements, such interventions could be feasibly integrated into routine care to support metabolic health and functional maintenance in this vulnerable population. In summary, the current study provides preliminary, yet promising evidence that an 8-week low-volume RT dose may offer metabolic benefits in older adults with cognitive impairment. However, further randomized trials and a larger sample size are needed to confirm these findings and better define the scope of potential benefits.

Author Contributions

Conceptualization, M.C.M., M.I., D.E. and C.P.F.; methodology, M.C.M., D.E. and C.P.F.; formal analysis, M.L., D.L.M. and C.N.; investigation, M.L. and N.F.; resources, D.A.M., M.C.M., H.P.N. and D.E.; data curation, M.L., N.F. and D.L.M.; writing—original draft preparation, M.L., N.F. and D.L.M.; writing—review and editing, N.F., D.L.M., M.C.M., H.P.N., M.I., D.E. and C.P.F.; visualization, M.L. and C.P.F.; supervision, M.C.M., D.E. and C.P.F.; project administration, M.C.M., D.E. and C.P.F.; funding acquisition, D.A.M., M.C.M. and D.E. All authors have read and agreed to the published version of the manuscript.

Funding

This research was funded by the Portuguese Institute of Sport and Youth, I.P. (IPDJ) [TRAIN4BRAIN project; reference number: CP/0542/DDT/2023], “la Caixa” Foundation with the project SR24-00179, and by the National Funds by FCT—Foundation for Science and Technology under the following project UID/04045: Research Center in Sports Sciences, Health Sciences, and Human Development, as well as grant numbers BII5 CIDESD-UBI UIDB/04045/2020 (M.L.), and PRT/BD/154638/2023 (N.F.).

Institutional Review Board Statement

This study was conducted in accordance with the Declaration of Helsinki and approved by the Ethics Committee of the University of Beira Interior (approval number: CE-UBI-Pj-2022-065; date of approval: 15 November 2022).

Informed Consent Statement

Informed consent was obtained from all subjects involved in this study.

Data Availability Statement

The original contributions presented in the study are included in the article. Further inquiries can be directed to the corresponding author.

Acknowledgments

We sincerely thank all the residential care facilities (Santa Casa da Misericórdia da Covilhã; Lar de São José, Covilhã; Associação Centro Social Sagrado Coração Mária, Ferro; Centro Social de Nossa Senhora da Conceição, Vila do Carvalho; Centro Social Vales do Rio; Centro de Convívio e Apoio à 3.ª Idade, Tortosendo) and the participants who agreed to be part of this study.

Conflicts of Interest

The authors declare no conflicts of interest. The funders had no role in the design of this study; in the collection, analyses, or interpretation of data; in the writing of this manuscript; or in the decision to publish the results.

Abbreviations

The following abbreviations are used in this manuscript:
1RMOne-Repetition Maximum
ADAGA1c-Derived Average Glucose
ALTAlanine Aminotransferase
ASTAspartate Aminotransferase
ATPAdenosine Triphosphate
CKCreatine Kinase
CONControl
DRS-2Dementia Rating Scale-2
HbA1cHemoglobin A1c
HDLHigh-Density Lipoprotein
LDHLactate Dehydrogenase
LDLLow-Density Lipoprotein
MDAMalondialdehyde
NADNicotinamide Adenine Dinucleotide
NADPHNicotinamide Adenine Dinucleotide Phosphate
RRepetition
RTResistance Training
SDStandard Deviation
1SETSingle Set
SPPBShort-Physical-Performance Battery
TBAThiobarbituric Acid
TBARSThiobarbituric Acid-Reactive Substances
TCATrichloroacetic Acid

References

  1. Liguori, I.; Russo, G.; Curcio, F.; Bulli, G.; Aran, L.; Della-Morte, D.; Gargiulo, G.; Testa, G.; Cacciatore, F.; Bonaduce, D.; et al. Oxidative Stress, Aging, and Diseases. Clin. Interv. Aging 2018, 13, 757–772. [Google Scholar] [CrossRef] [PubMed]
  2. Palmer, A.K.; Jensen, M.D. Metabolic Changes in Aging Humans: Current Evidence and Therapeutic Strategies. J. Clin. Investig. 2022, 132, e158451. [Google Scholar] [CrossRef] [PubMed]
  3. Asejeje, F.O.; Ogunro, O.B. Deciphering the Mechanisms, Biochemistry, Physiology, and Social Habits in the Process of Aging. Arch. Gerontol. Geriatr. Plus 2024, 1, 100003. [Google Scholar] [CrossRef]
  4. López-Otín, C.; Blasco, M.A.; Partridge, L.; Serrano, M.; Kroemer, G. The Hallmarks of Aging. Cell 2013, 153, 1194–1217. [Google Scholar] [CrossRef]
  5. World Health Organization. World Report on Ageing and Health; World Health Organization: Geneva, Switzerland, 2024. [Google Scholar]
  6. Fonseca, N.; Esteves, D.; Marques, D.L.; Faíl, L.B.; Sousa, T.; Pinto, M.P.; Neiva, H.P.; Izquierdo, M.; Marques, M.C. Acute and Time-Course Changes in Hemodynamic and Physical Performance Parameters Following Single and Multiple Resistance Training Sets in Cognitively Impaired Individuals: A Randomized Crossover Study. Exp. Gerontol. 2025, 201, 112688. [Google Scholar] [CrossRef]
  7. Fragala, M.S.; Cadore, E.L.; Dorgo, S.; Izquierdo, M.; Kraemer, W.J.; Peterson, M.D.; Ryan, E.D. Resistance Training for Older Adults: Position Statement From the National Strength and Conditioning Association. J. Strength Cond. Res. 2019, 33, 2019–2052. [Google Scholar] [CrossRef]
  8. Marcos-Pardo, P.J.; Vaquero-Cristóbal, R.; Huber, G. The Power of Resistance Training: Evidence-Based Recommendations for Middle-Aged and Older Women’s Health. Retos 2023, 51, 319–331. [Google Scholar] [CrossRef]
  9. Khodadad Kashi, S.; Mirzazadeh, Z.S.; Saatchian, V. A Systematic Review and Meta-Analysis of Resistance Training on Quality of Life, Depression, Muscle Strength, and Functional Exercise Capacity in Older Adults Aged 60 Years or More. Biol. Res. Nurs. 2023, 25, 88–106. [Google Scholar] [CrossRef]
  10. Fernandes, J.F.T.; Lamb, K.L.; Norris, J.P.; Moran, J.; Drury, B.; Borges, N.R.; Twist, C. Aging and Recovery After Resistance-Exercise-Induced Muscle Damage: Current Evidence and Implications for Future Research. J. Aging Phys. Act. 2021, 29, 544–551. [Google Scholar] [CrossRef]
  11. Swales, B.; Ryde, G.C.; Whittaker, A.C. A Randomized Controlled Feasibility Trial Evaluating a Resistance Training Intervention With Frail Older Adults in Residential Care: The Keeping Active in Residential Elderly Trial. J. Aging Phys. Act. 2022, 30, 364–388. [Google Scholar] [CrossRef]
  12. de Alencar Silva, B.S.; de Lira, F.S.; de Freitas, M.C.; Uzeloto, J.S.; dos Santos, V.R.; Freire, A.P.C.F.; Bertolini, G.N.; Gobbo, L.A. Traditional and Elastic Resistance Training Enhances Functionality and Lipid Profile in the Elderly. Exp. Gerontol. 2020, 135, 110921. [Google Scholar] [CrossRef] [PubMed]
  13. Amiri, E.; Sheikholeslami-Vatani, D. The Role of Resistance Training and Creatine Supplementation on Oxidative Stress, Antioxidant Defense, Muscle Strength, and Quality of Life in Older Adults. Front. Public Health 2023, 11, 1062832. [Google Scholar] [CrossRef] [PubMed]
  14. Herold, F.; Törpel, A.; Schega, L.; Müller, N.G. Functional and/or Structural Brain Changes in Response to Resistance Exercises and Resistance Training Lead to Cognitive Improvements—A Systematic Review. Eur. Rev. Aging Phys. Act. 2019, 16, 10. [Google Scholar] [CrossRef] [PubMed]
  15. Lee, K. Strategies to Optimize Recovery in Frail Patients with Cardiovascular Disease Through Exercise-Based Cardiac Rehabilitation. J. Lipid Atheroscler. 2025, 14, 159–173. [Google Scholar] [CrossRef]
  16. Nuzzo, J.L.; Pinto, M.D.; Kirk, B.J.C.; Nosaka, K. Resistance Exercise Minimal Dose Strategies for Increasing Muscle Strength in the General Population: An Overview. Sports Med. 2024, 54, 1139–1162. [Google Scholar] [CrossRef]
  17. Wan, Y.; Su, Z. The Impact of Resistance Exercise Training on Glycemic Control Among Adults with Type 2 Diabetes: A Systematic Review and Meta-Analysis of Randomized Controlled Trials. Biol. Res. Nurs. 2024, 26, 597–623. [Google Scholar] [CrossRef]
  18. Dos Santos, P.R.P.; Cavalcante, B.R.; Vieira, A.K.D.S.; Guimarães, M.D.; Da Silva, A.M.L.; Armstrong, A.D.C.; Carvalho, R.G.D.S.; De Carvalho, F.O.; De Souza, M.F. Improving Cognitive and Physical Function through 12-Weeks of Resistance Training in Older Adults: Randomized Controlled Trial. J. Sports Sci. 2020, 38, 1936–1942. [Google Scholar] [CrossRef]
  19. de Sousa Fernandes, M.S.; Ordônio, T.F.; Santos, G.C.J.; Santos, L.E.R.; Calazans, C.T.; Gomes, D.A.; Santos, T.M. Effects of Physical Exercise on Neuroplasticity and Brain Function: A Systematic Review in Human and Animal Studies. Neural Plast. 2020, 2020, 1–21. [Google Scholar] [CrossRef]
  20. Macaulay, T.R.; Fisher, B.E.; Schroeder, E.T. Potential Indirect Mechanisms of Cognitive Enhancement After Long-Term Resistance Training in Older Adults. Phys. Ther. 2020, 100, 907–916. [Google Scholar] [CrossRef]
  21. Liu-Ambrose, T.; Donaldson, M.G. Exercise and Cognition in Older Adults: Is There a Role for Resistance Training Programmes? Br. J. Sports Med. 2009, 43, 25–27. [Google Scholar] [CrossRef]
  22. Northey, J.M.; Cherbuin, N.; Pumpa, K.L.; Smee, D.J.; Rattray, B. Exercise Interventions for Cognitive Function in Adults Older than 50: A Systematic Review with Meta-Analysis. Br. J. Sports Med. 2018, 52, 154–160. [Google Scholar] [CrossRef] [PubMed]
  23. Falck, R.S.; Davis, J.C.; Milosevic, E.; Liu-Ambrose, T. How Much Will Older Adults Exercise? A Feasibility Study of Aerobic Training Combined with Resistance Training. Pilot. Feasibility Stud. 2017, 3, 2. [Google Scholar] [CrossRef] [PubMed]
  24. Lixandrão, M.E.; Bamman, M.; Vechin, F.C.; Conceicao, M.S.; Telles, G.; Longobardi, I.; Damas, F.; Lavin, K.M.; Drummer, D.J.; McAdam, J.S.; et al. Higher Resistance Training Volume Offsets Muscle Hypertrophy Nonresponsiveness in Older Individuals. J. Appl. Physiol. 2024, 136, 421–429. [Google Scholar] [CrossRef]
  25. Sayers, S.P. High-Speed Power Training: A Novel Approach to Resistance Training in Older Men and Women. A Brief Review and Pilot Study. J. Strength Cond. Res. 2007, 21, 518–526. [Google Scholar] [CrossRef]
  26. Meredith, S.J.; Cox, N.J.; Ibrahim, K.; Higson, J.; McNiff, J.; Mitchell, S.; Rutherford, M.; Wijayendran, A.; Shenkin, S.D.; Kilgour, A.H.M.; et al. Factors That Influence Older Adults’ Participation in Physical Activity: A Systematic Review of Qualitative Studies. Age Ageing 2023, 52, afad145. [Google Scholar] [CrossRef]
  27. Healy, S.; Patterson, F.; Biddle, S.; Dumuid, D.; Glorieux, I.; Olds, T.; Woods, C.; Bauman, A.E.; Gába, A.; Herring, M.P.; et al. It’s about Time to Exercise: Development of the Exercise Participation Explained in Relation to Time (EXPERT) Model. Br. J. Sports Med. 2024, 58, 1131–1144. [Google Scholar] [CrossRef]
  28. Radaelli, R.; Rech, A.; Molinari, T.; Markarian, A.M.; Petropoulou, M.; Granacher, U.; Hortobágyi, T.; Lopez, P. Effects of Resistance Training Volume on Physical Function, Lean Body Mass and Lower-Body Muscle Hypertrophy and Strength in Older Adults: A Systematic Review and Network Meta-Analysis of 151 Randomised Trials. Sports Med. 2025, 55, 167–192. [Google Scholar] [CrossRef]
  29. Abreu, F.; Rodrigues, A.; Baptista, F. Low-Volume Resistance Training: A Feasible, Cost-Effective Strategy for Musculoskeletal Frailty in Older Adults Attending Daycare Centers. Front. Sports Act. Living 2025, 7, 1542188. [Google Scholar] [CrossRef]
  30. Hong, H.; Jiang, K.; Ye, H.; Xue, H.; Chen, M. The Aspartate Aminotransferase to Alanine Aminotransferase Ratio: A Novel Indicator for Skeletal Muscle Mass in Chinese Community Adults. Nutrition 2024, 117, 112214. [Google Scholar] [CrossRef]
  31. Lee, B.T.; Chintamaneni, K.; Kaplowitz, N. Markedly Elevated Serum Aspartate Aminotransferase to Alanine Aminotransferase Ratio: A Clue to Hepatic Neoplasia. Hepatol. Commun. 2020, 4, 1099–1101. [Google Scholar] [CrossRef]
  32. He, Y.; Su, Y.; Duan, C.; Wang, S.; He, W.; Zhang, Y.; An, X.; He, M. Emerging Role of Aging in the Progression of NAFLD to HCC. Ageing Res. Rev. 2023, 84, 101833. [Google Scholar] [CrossRef] [PubMed]
  33. Cavaco, S.; Jurica, P.J.; Mattis, S.; Pinto, A.T. DRS-2: Escala de Avaliação de Demência—2; CEGOC-TE: Lisboa, Portugal, 2011. [Google Scholar]
  34. de Vos, N.J.; Singh, N.A.; Ross, D.A.; Stavrinos, T.M.; Orr, R.; Fiatarone Singh, M.A. Optimal Load for Increasing Muscle Power during Explosive Resistance Training in Older Adults. J. Gerontol. A Biol. Sci. Med. Sci. 2005, 60, 638–647. [Google Scholar] [CrossRef] [PubMed]
  35. Marques, D.L.; Neiva, H.P.; Marinho, D.A.; Pires, I.M.; Nunes, C.; Marques, M.C. Load-Power Relationship in Older Adults: The Influence of Maximal Mean and Peak Power Values and Their Associations with Lower and Upper-Limb Functional Capacity. Front. Physiol. 2022, 13, 1007772. [Google Scholar] [CrossRef] [PubMed]
  36. Friedewald, W.T.; Levy, R.I.; Fredrickson, D.S. Estimation of the Concentration of Low-Density Lipoprotein Cholesterol in Plasma, without Use of the Preparative Ultracentrifuge. Clin. Chem. 1972, 18, 499–502. [Google Scholar] [CrossRef]
  37. Castelli, W.P.; Abbott, R.D.; McNamara, P.M. Summary Estimates of Cholesterol Used to Predict Coronary Heart Disease. Circulation 1983, 67, 730–734. [Google Scholar] [CrossRef]
  38. Nathan, D.M.; Kuenen, J.; Borg, R.; Zheng, H.; Schoenfeld, D.; Heine, R.J. Translating the A1C Assay Into Estimated Average Glucose Values. Diabetes Care 2008, 31, 1473–1478. [Google Scholar] [CrossRef]
  39. Callegari, G.A.; Novaes, J.S.; Neto, G.R.; Dias, I.; Garrido, N.D.; Dani, C. Creatine Kinase and Lactate Dehydrogenase Responses After Different Resistance and Aerobic Exercise Protocols. J. Hum. Kinet. 2017, 58, 65–72. [Google Scholar] [CrossRef]
  40. Lavin, K.M.; Roberts, B.M.; Fry, C.S.; Moro, T.; Rasmussen, B.B.; Bamman, M.M. The Importance of Resistance Exercise Training to Combat Neuromuscular Aging. Physiology 2019, 34, 112–122. [Google Scholar] [CrossRef]
  41. Halonen, P.I.; Konttinen, A. Effect of Physical Exercise on Some Enzymes in the Serum. Nature 1962, 193, 942–944. [Google Scholar] [CrossRef]
  42. Loll, H.; Hilscher, A. Change of Substrate Concentration and Enzyme Activity in Serum by Physical Exercise. Arztl. Forsch. 1958, 12, II/85–II/86. [Google Scholar]
  43. Pettersson, J.; Hindorf, U.; Persson, P.; Bengtsson, T.; Malmqvist, U.; Werkström, V.; Ekelund, M. Muscular Exercise Can Cause Highly Pathological Liver Function Tests in Healthy Men. Br. J. Clin. Pharmacol. 2008, 65, 253–259. [Google Scholar] [CrossRef] [PubMed]
  44. de Freitas, M.C.; Gerosa-Neto, J.; Zanchi, N.E.; Lira, F.S.; Rossi, F.E. Role of Metabolic Stress for Enhancing Muscle Adaptations: Practical Applications. World J. Methodol. 2017, 7, 46–54. [Google Scholar] [CrossRef] [PubMed]
  45. Robert, J.; Osto, E.; von Eckardstein, A. The Endothelium Is Both a Target and a Barrier of HDL’s Protective Functions. Cells 2021, 10, 1041. [Google Scholar] [CrossRef]
  46. Conte, M.; Petraglia, L.; Poggio, P.; Valerio, V.; Cabaro, S.; Campana, P.; Comentale, G.; Attena, E.; Russo, V.; Pilato, E.; et al. Inflammation and Cardiovascular Diseases in the Elderly: The Role of Epicardial Adipose Tissue. Front. Med. 2022, 9, 844266. [Google Scholar] [CrossRef]
  47. Ghafari, M.; Faramarzi, M.; Baghurst, T. Effect of Exercise Training on Lipid Profiles in the Elderly: A Systematic Review and Meta-Analysis of Randomized Controlled Trials. J. Shahrekord Univ. Med. Sci. 2020, 22, 200–207. [Google Scholar] [CrossRef]
  48. Tomeleri, C.M.; Ribeiro, A.S.; Souza, M.F.; Schiavoni, D.; Schoenfeld, B.J.; Venturini, D.; Barbosa, D.S.; Landucci, K.; Sardinha, L.B.; Cyrino, E.S. Resistance Training Improves Inflammatory Level, Lipid and Glycemic Profiles in Obese Older Women: A Randomized Controlled Trial. Exp. Gerontol. 2016, 84, 80–87. [Google Scholar] [CrossRef]
  49. Yun, H.; Su, W.; Zhao, H.; Li, H.; Wang, Z.; Cui, X.; Xi, C.; Gao, R.; Sun, Y.; Liu, C. Effects of Different Exercise Modalities on Lipid Profile in the Elderly Population: A Meta-Analysis. Medicine 2023, 102, e33854. [Google Scholar] [CrossRef]
  50. Cunha, P.M.; Ribeiro, A.S.; Nunes, J.P.; Tomeleri, C.M.; Nascimento, M.A.; Moraes, G.K.; Sugihara, P.; Barbosa, D.S.; Venturini, D.; Cyrino, E.S. Resistance Training Performed with Single-Set Is Sufficient to Reduce Cardiovascular Risk Factors in Untrained Older Women: The Randomized Clinical Trial. Active Aging Longitudinal Study. Arch. Gerontol. Geriatr. 2019, 81, 171–175. [Google Scholar] [CrossRef]
  51. Hurley, B.F.; Hanson, E.D.; Sheaff, A.K. Strength Training as a Countermeasure to Aging Muscle and Chronic Disease. Sports Med. 2011, 41, 289–306. [Google Scholar] [CrossRef]
  52. Misra, A.; Alappan, N.K.; Vikram, N.K.; Goel, K.; Gupta, N.; Mittal, K.; Bhatt, S.; Luthra, K. Effect of Supervised Progressive Resistance-Exercise Training Protocol on Insulin Sensitivity, Glycemia, Lipids, and Body Composition in Asian Indians with Type 2 Diabetes. Diabetes Care 2008, 31, 1282–1287. [Google Scholar] [CrossRef]
  53. Castaneda, C.; Layne, J.E.; Munoz-Orians, L.; Gordon, P.L.; Walsmith, J.; Foldvari, M.; Roubenoff, R.; Tucker, K.L.; Nelson, M.E. A Randomized Controlled Trial of Resistance Exercise Training to Improve Glycemic Control in Older Adults with Type 2 Diabetes. Diabetes Care 2002, 25, 2335–2341. [Google Scholar] [CrossRef] [PubMed]
  54. Brooks, N.; Layne, J.E.; Gordon, P.L.; Roubenoff, R.; Nelson, M.E.; Castaneda-Sceppa, C. Strength Training Improves Muscle Quality and Insulin Sensitivity in Hispanic Older Adults with Type 2 Diabetes. Int. J. Med. Sci. 2006, 4, 19–27. [Google Scholar] [CrossRef] [PubMed]
  55. Dunstan, D.W.; Daly, R.M.; Owen, N.; Jolley, D.; De Courten, M.; Shaw, J.; Zimmet, P. High-Intensity Resistance Training Improves Glycemic Control in Older Patients with Type 2 Diabetes. Diabetes Care 2002, 25, 1729–1736. [Google Scholar] [CrossRef] [PubMed]
  56. Ibañez, J.; Izquierdo, M.; Argüelles, I.; Forga, L.; Larrión, J.L.; García-Unciti, M.; Idoate, F.; Gorostiaga, E.M. Twice-Weekly Progressive Resistance Training Decreases Abdominal Fat and Improves Insulin Sensitivity in Older Men with Type 2 Diabetes. Diabetes Care 2005, 28, 662–667. [Google Scholar] [CrossRef]
  57. Rahman, M.A.; Islam, S.; Hossen, M.A.A.; Mia, M.; Ferdous, K. A Review: Assessment of HbA1c as A Diagnostic Tool in Diabetes Mellitus. Mol. Mech. Res. 2023, 1. [Google Scholar] [CrossRef]
  58. Cenini, G.; Lloret, A.; Cascella, R. Oxidative Stress in Neurodegenerative Diseases: From a Mitochondrial Point of View. Oxid. Med. Cell Longev. 2019, 2019, 2105607. [Google Scholar] [CrossRef]
  59. Alikhani, S.; Sheikholeslami-Vatani, D. Oxidative Stress and Anti-oxidant Responses to Regular Resistance Training in Young and Older Adult Women. Geriatr. Gerontol. Int. 2019, 19, 419–422. [Google Scholar] [CrossRef]
  60. Carru, C.; Da Boit, M.; Paliogiannis, P.; Zinellu, A.; Sotgia, S.; Sibson, R.; Meakin, J.R.; Aspden, R.M.; Mangoni, A.A.; Gray, S.R. Markers of Oxidative Stress, Skeletal Muscle Mass and Function, and Their Responses to Resistance Exercise Training in Older Adults. Exp. Gerontol. 2018, 103, 101–106. [Google Scholar] [CrossRef]
  61. Bobeuf, F.; Labonte, M.; Dionne, I.J.; Khalil, A. Combined Effect of Antioxidant Supplementation and Resistance Training on Oxidative Stress Markers, Muscle and Body Composition in an Elderly Population. J. Nutr. Health Aging 2011, 15, 883–889. [Google Scholar] [CrossRef]
  62. Vincent, K.R.; Vincent, H.K.; Braith, R.W.; Lennon, S.L.; Lowenthal, D.T. Resistance Exercise Training Attenuates Exercise-Induced Lipid Peroxidation in the Elderly. Eur. J. Appl. Physiol. 2002, 87, 416–423. [Google Scholar] [CrossRef]
  63. McBride, J.M.; Kraemer, W.J.; Triplett-McBride, T.; Sebastianelli, W. Effect of Resistance Exercise on Free Radical Production. Med. Sci. Sports Exerc. 1998, 30, 67–72. [Google Scholar] [CrossRef] [PubMed]
  64. Hoffman, J.R.; Im, J.; Kang, J.; Maresh, C.M.; Kraemer, W.J.; French, D.; Nioka, S.; Kime, R.; Rundell, K.W.; Ratamess, N.A.; et al. Comparison of Low- and High-Intensity Resistance Exercise on Lipid Peroxidation: Role of Muscle Oxygenation. J. Strength Cond. Res. 2007, 21, 118–122. [Google Scholar] [CrossRef] [PubMed]
  65. Bloomer, R.J.; Goldfarb, A.H.; McKenzie, M.J. Oxidative Stress Response to Aerobic Exercise: Comparison of Antioxidant Supplements. Med. Sci. Sports Exerc. 2006, 38, 1098–1105. [Google Scholar] [CrossRef] [PubMed]
  66. Thirupathi, A.; Wang, M.; Lin, J.K.; Fekete, G.; István, B.; Baker, J.S.; Gu, Y. Effect of Different Exercise Modalities on Oxidative Stress: A Systematic Review. BioMed Res. Int. 2021, 2021, 1947928. [Google Scholar] [CrossRef]
Figure 1. A CONSORT flow diagram of the crossover trial.
Applsci 15 07091 g001
Figure 2. Dot plots showing effects of intervention on creatine kinase (a) and lactate dehydrogenase (b). Significance values are reported for within-group comparisons. Effect sizes (g) only apply to normally distributed variables. Dashed lines represent reference ranges. Blue and green dashed lines indicate creatine kinase reference values for men (46–171 U/L) and women (34–145 U/L), respectively; black dashed line indicates reference range for lactate dehydrogenase (120–146 U/L). Clinically meaningful thresholds are also indicated where applicable.
Applsci 15 07091 g002
Figure 3. Dot plots showing effects of intervention on aspartate aminotransferase (AST; (a)), alanine aminotransferase (ALT; (b)), and AST/ALT ratio (c). Significance values are reported for within-group comparisons. Effect sizes (g) only apply to normally distributed variables. Dashed lines represent reference ranges. Black dashed lines indicate clinical reference ranges for AST (<34 U/L) and ALT (10–49 U/L) for both men and women. Clinically meaningful thresholds are also indicated where applicable.
Applsci 15 07091 g003
Figure 4. Dot plots showing effects of intervention on total cholesterol (a), HDL cholesterol (b), LDL cholesterol (c), triglycerides (d), and atherogenic index (e). Significance values are reported for within-group comparisons. Effect sizes (g) only apply to normally distributed variables. Dashed lines represent reference ranges. Blue and green dashed lines indicate HDL cholesterol reference values for men (>40 mg/dL) and women (>45 mg/dL), respectively; black dashed lines indicate reference values for total cholesterol (<190 mg/dL), LDL cholesterol (<100 mg/dL), triglycerides (<150 mg/dL), and atherogenic index (<5.00) for both sexes. Clinically meaningful thresholds are also indicated where applicable.
Applsci 15 07091 g004
Figure 5. Dot plots showing effects of intervention on (a) glycated hemoglobin (HbA1c) and (b) estimated average glucose. Significance values are reported for within-group comparisons. Dashed lines indicate clinical reference values for both sexes for HbA1c (<5.7%). Estimated average glucose is shown solely as value derived from HbA1c, which is parameter with direct clinical relevance. Clinically meaningful thresholds are also indicated where applicable. Corresponding p-values and effect sizes (g) are shown above bars.
Applsci 15 07091 g005
Figure 6. Dot plots showing effects of intervention on serum malondialdehyde (MDA) levels. Significance values are reported for within-group comparisons. Effect sizes (g) only apply to normally distributed variables.
Applsci 15 07091 g006
Table 1. Resistance training program.
ExercisesWeek 1Week 2Week 3Week 4Week 5Week 6Week 7Week 8
Leg press (R × %1RM)12 × 5012 × 5010 × 6010 × 608 × 658 × 656 × 706 × 70
Chest press (R × %1RM)12 × 4012 × 4010 × 5010 × 508 × 558 × 556 × 606 × 60
Chair squat (R)121210108866
Medicine ball throw (R × kg)12 × 112 × 110 × 110 × 18 × 18 × 16 × 16 × 1
1RM, one-repetition maximum; R, repetition.
Table 2. Participants’ demographic and anthropometric characteristics.
CON
(n = 13)
1SET
(n = 15)
Age (years)Mean ± SD 90.00 ± 10.3981.00 ± 9.66
Min–max57–9558–93
Sex (n)Female96
Male49
Height (m) 1.58 ± 0.081.53 ± 0.09
Body mass (kg) 66.40 ± 11.2167.90 ± 10.74
Cognitive
Impairment (DRS-2, n)
Mild24
Moderate14
Severe107
CON: control group; 1SET: low-volume RT group.
Disclaimer/Publisher’s Note: The statements, opinions and data contained in all publications are solely those of the individual author(s) and contributor(s) and not of MDPI and/or the editor(s). MDPI and/or the editor(s) disclaim responsibility for any injury to people or property resulting from any ideas, methods, instructions or products referred to in the content.

