Abstract
To investigate the erosion and deposition evolution characteristics of the Xinqiman–Kelelik reach along the main stem of the Tarim River, this study analyzed river channel dynamics and planform morphological changes using Landsat satellite imagery (1993–2024) and hydrological data (water discharge and sediment load) from gauge stations. The results show that the thalweg line swings indefinitely in the river. The thalweg length increased by 29 km, while the mean channel width decreased by 0.28 km. The sinuosity index rose from 1.95 to 2.34, indicating a gradual intensification of channel curvature. The north bank is in a state of siltation, while the south bank is in a state of erosion. The riverbank exhibited an overall southward migration. The farmland area in the study area increased from 1510 hectares in 1993 to 5140 hectares in 2024. During this period, the thalweg near the water-diversion sluice continuously shifted toward the sluice side. To ensure flood protection safety for farmlands and villages on both banks, as well as ecological water diversion, river channel regulation and channel pattern control should be implemented.
1. Introduction
The evolutionary patterns of river systems constitute a critical domain in the study of water–sediment dynamics, particularly in high-sediment-laden rivers, which exhibit pronounced lateral migration characteristics. These river channels demonstrate interannual migration magnitudes on the order of meters. Accurate river regime forecasting is vital for river basin engineering management, covering applications like shoreline protection, engineering safety, and farmland conservation [1]. The Tarim River, located in China’s northwest arid region, is a typical endorheic river basin. It is characterized by an arid climate, fragile ecological environment, and sparse population distribution [2,3]. Historically, due to limitations in transportation and technological methods, long-term field observation data in hydrology, ecology, and other fields have been lacking. Before the 1980s, research relied on limited hydrological and weather station data and manual surveys, with insufficient spatial and temporal data coverage. As for early research methods, in the 1950s and 1960s, the first systematic documentation of river channel morphology and water distribution characteristics was carried out by the Chinese Academy of Sciences expedition team. On this basis, on 8 August 1958, Zhou Tingru and Zhao Ji [4] participated in an investigation of the Tarim River by the Xinjiang Comprehensive Investigation Team of the Chinese Academy of Sciences, and studied the issues of water resources, soil salinization and wind prevention and sand returning in the Tarim River.
Analysis of historical river-channel changes and oasis evolution can be performed using ancient texts like “Commentary on the Water Classic” and “Records of Rivers in the Western Regions”, along with ancient maps. Historical documents are an important basis for analyzing river channel changes and oasis evolution in historical periods. As Yin Yanli [5] and Qin Peiheng [6] have pointed out, Li Daoyuan’s “Commentary on the Water Classic” systematically recorded the origin, hydrological characteristics and flood events of 1252 rivers in China in the 6th century, which provided a reference for the study of early river conditions and changes. In particular, the flood information recorded is the key evidence for the analysis of river diversion. Xu Song’s “Records of Rivers in the Western Regions” takes 11 lakes in the Western Regions as the outline, and combs in detail the waterway network of western Gansu and Xinjiang in the Qing Dynasty. Its record of Lop Nur becoming a “moving lake” due to the change of river diversion water volume, as well as the textual research on the relationship between the water systems of the Danghe River and Sulehe River and Haranur, provides direct and precious historical data support for understanding the change of river channels in the arid region of Northwest China and the succession of terminal lakes and oases (such as Loulan and Dunhuang). These two classic geographical works, through detailed textual records, laid a core foundation for later generations to use ancient books to analyze historical hydrological and geographical changes. The reconstruction of ancient river-channel evolution and identification of climatic impacts can be performed via geological-section and sediment-analysis techniques.
Geological profiling and sediment analysis are the core technical means to reconstruct the evolution of ancient rivers and identify the impact of climate change. Zhao Chengsheng et al. [7] provided a classic example for the study of the middle and lower reaches of the Yangtze River. Through the systematic analysis of the geological structure of the river valley, they successfully revealed the fundamental control of different types of geological structures on the plane shape and evolution mode of the river channel, and laid a methodological foundation for the inversion of the ancient river-channel shape by using the geological profile.
Since the 1980s, with the widespread use of remote-sensing images (e.g., Landsat and MODIS) and GIS technology, research has achieved dynamic monitoring of multiple elements across the entire river basin.
Based on multi-temporal Landsat remote sensing images and subterranean stratigraphic records, Nawfee [8] reveals that the strong asymmetric bank erosion in the Padma River section in Bangladesh is the main source supply, which drives the evolution model of river zoning, and provides a key case for understanding the response mechanism of large river geomorphology under the intervention of strong human activities. Based on multi-temporal satellite image data, Hossain [9] revealed the dynamic process of asymmetric erosion and deposition on the left and right banks of the Ganges River in Bangladesh, the continuous widening of the river channel, and the significant enhancement of the curvature driven by high erodibility in riparian material and monsoon high flow. Wahiduzzaman [10] revealed that the continuous rise of the bending rate and bifurcation index of the Padma (Ganges) River in Bangladesh broke through the critical value, driving its morphology to transform from a meandering to a braided river, and the bifurcation index increased significantly.
Based on multi-temporal remote sensing images and field survey data, Debnath [11] revealed that the material properties of non-viscous riverbanks, persistent meandering atrophy, and potential human land use jointly trigger the disappearance of historical cutoff points and the risk of high cutoff in the future, which provides a quantitative basis for predicting geomorphological evolution and management.
Based on multi-temporal remote sensing images and GIS technology, Ali [12] revealed the transformation process of historical active migration to recent erosion weakening and activity reduction of the Yamuna River’s alluvial section under the combined action of historical flood driving and recent runoff attenuation, which provided technical support for the scientific delineation of the river channel’s migration boundary. Langat [13] reveals that the significant erosion–deposition dynamics and morphological evolution of the lower reaches of the Tana River in Kenya are driven by multiple factors such as hydrological fluctuation, upstream land use, and river slope and riparian vegetation change, which provides a comprehensive framework and quantitative basis for understanding the self-organization process of the river channel without strong engineering intervention. Based on Landsat satellite remote sensing time series data (1989–2021) and GIS spatial analysis technology, Basnayaka [14] revealed that the meander curvature and channel mobility of the lower reaches of the Dtruu Eurasian River in Sri Lanka have shown a significant increasing trend in the past 32 years. Basnayaka. Based on SPOT satellite time series images (1996–1999) combined with geomorphological methods, Gupta [15] established a regional geomorphological database, depicted environmental degradation and sediment transport maps, and evaluated the impact of the proposed project in a typical section of the middle reaches of the Mekong River in Laos. Gupta and Binh [16] developed a new spectral riverbank erosion detection method and applied it to Landsat images to verify NDWI M-AMERL. The SMA algorithm is the optimal riparian extraction scheme for the Mekong River Delta in Vietnam.
These studies have fully confirmed the universality and reliability of multi-temporal remote sensing images combined with GIS technology to analyze channel morphological parameters (such as curvature, branching index, and shoreline migration rate) and erosion and deposition dynamics, which provides a solid technical paradigm and operational framework for monitoring the erosion and deposition evolution of the main stream of the Tarim River. This study reveals the general mechanism of how driving factors such as hydrological regime changes, riparian material properties, and strong human activity interventions shape river migration, morphological transformation, and spatial differentiation of erosion and deposition, and provides a key theoretical reference and comparison benchmark for the analysis of evolution characteristics against the background of strong human intervention in arid areas.
The study of the long-term evolution of large river systems in arid areas is also worthy of attention. For example, Said [17] systematized the geological background and long-term evolution of the Nile River. Stanley and Warne [18] deeply analyzed the modern geological evolution of the Nile Delta and its significant impact on human activities, providing an important reference framework for understanding the geomorphological evolution and human disturbance response of large arid rivers. Lawal and Omosanya [19] used multi-decade remote sensing images to reveal the change pattern of the plane shape of the confluence of the Niger River and the Benue River in West Africa. Dada [20] combined rainfall and river flow data to study the trend of shoreline evolution in the Niger River delta over the last 100 years and demonstrated the mechanism of its response to hydrological changes in the basin.
Focus has been placed on the Tarim River Basin in the arid region of Northwest China. For instance, Jianga [21] and Chen [22] investigated the natural fluvial processes, morphological evolution, and driving factors of river desiccation in the Tarim River over the past three decades. Their findings reveal that human activities—specifically upstream irrigation expansion, intensified water consumption in the middle-upper reaches, and reservoir construction—have significantly altered natural riverine dynamics. These interventions have led to a decline in the structural complexity of the river network system and accelerated hydrological and ecological degradation characterized by progressive desiccation. Li [2] used multi-temporal remote sensing images and field survey data to reveal that in the extremely arid environment of the middle reaches of the Tarim River, strong lateral erosion, limited riparian root systems, and human water regulation jointly drive the high degree of avulsion and morphological transformation of non-cohesive meandering systems in arid areas. Yu [23] employed an integrated approach combining historical literature, hydrological data, and remote sensing imagery to reveal the nonlinear response of arid-region fluvial geomorphology to anthropogenic disturbances. Zhenglong [24] analyzed multi-temporal remote sensing data and showed that after the water diversion project in the lower reaches of the Tarim River was implemented (1999–2004), the vegetation coverage increased significantly, and the area of desertification was reduced.
The river section of Xinqiman–Kelelik mainstem is characterized by a winding and meandering course, with frequent changes in the river dynamics. The river often experiences meander cutoffs, posing significant threats to flood control and water diversion safety along both banks [25,26]. Therefore, based on Landsat satellite images and hydrological data from 1993 to 2024, this study extracted the characteristic river channel parameters such as thalweg length change, thalweg migration rate, section width evolution and shoreline erosion/accumulation area in the Xinqiman–Kelelik section, and revealed the evolution law of riverbed erosion and deposition in this section.
It further elucidates the driving mechanisms of river morphological changes, considering both natural water–sediment variations and human activities, such as agricultural expansion, water diversion gate regulation, and the construction of hydraulic structures. Our findings offer a scientific basis for optimizing riparian project layouts, restoring sediment–transport balance, and managing thalweg shifts. The research supports integrated management of arid-zone rivers, addressing flood control, ecological protection, and irrigation needs. Synergistic management of water and sand in the Tarim River Basin needs to integrate the dual-track path of “engineering dispatch optimization” and “transboundary ecological compensation” [27,28,29]. It is highly valuable for the coordinated management of sediment and water in similar basins. The arid regions of the world are mainly located in the arid zones of North Africa and the Middle East, the inland arid zones of Central and South Asia, the arid zones of the Americas, and the arid zones of Australia and South Africa, such as the Nile Basin, the Amu Darya and Syr Darya basins (the Aral Sea Basin), the Tarim River Basin (northwestern China), the Colorado River Basin (southwestern North America), and the Murray–Darling River Basin (Australia), among others. The coordinated management of water and sediment in rivers in arid areas is very important. For example, in the Amu Darya River Basin in Central Asia, synergistic management of water and sand in the basin is achieved through transboundary coordination and reservoir drainage [30,31,32]. Hazel [33] made a study of the Colorado River Basin in the United States, which flows through the arid regions of North America, and which achieves synergistic management of water and sand in the basin through the combined scheduling of reservoir complexes and artificial floods.
2. Study Area
The Tarim River, the longest endorheic river in Asia, is located in the northern Tarim Basin of Xinjiang, China. This composite river system is fed by glacial meltwater from the Tianshan, Karakoram, and Kunlun Mountains. Its mainstem originates at the confluence of the Aksu, Yarkand, and Hotan Rivers near Xiaojiake (adjacent to Alar City) and ultimately drains into Lake Taitema. The main channel extends approximately 1321 km, draining a catchment area of 1.76 × 10⁴ km2, and is classified as a typical plain river [34]. The river reach from Xinqiman to Kelelik is in the upper Tarim River. The river bed slope is 0.19‰ on average, with a height difference of 2.0–4.0m between the floodplain and river channel. The main channel can convey 700–800 m3/s of water [35]. The study reach extends from Area 3 of Tarim Farm (5 km upstream of the Xinqiman Hydrological Station) to Kelelik, with a total length of 171.9 km. The segment from Area 3 of Tarim Farm to the vicinity of Qumaogejin (Paman Reservoir) is classified as a transitional reach, spanning 72.3 km. The downstream segment from Qumaogejin (Paman Reservoir) to Kelelik represents a typical meandering reach, measuring 99.6 km in length [36]. Over the past 32 years, much farmland has been reclaimed along both banks of the Tarim River’s main stream from Xinqiman to Kelelik. The farmland area expanded from 1510 hectares in 1993 to 5140 hectares in 2024. Irrigation primarily relies on water diversion gates and reservoirs along the riverbanks.
The study area is the Xinqiman–Kelelik river segment (see Figure 1). This river section is located in the upper reaches of the Tarim River, situated between 82°76′ E–83°63′ E and 41°02′ N–40°99′ N. To the north of the river channel lie the Tianshan Mountains, while to the south is the Taklamakan Desert. The Tarim River is mainly recharged by seasonal ice-snow meltwater originating from the surrounding mountains [37]. The region experiences sparse precipitation, high evaporation, significant temperature fluctuations, frequent wind and sand activities, and intense sunlight and radiation. The annual sunshine duration ranges from 2800 to 3100 h, with an average annual precipitation of only 51.2 mm. The annual evaporation can reach between 2300 and 3000 mm, making it a typical warm temperate extreme arid desert climate zone [38,39]. The river channel cross-section is broad and shallow, with a width generally ranging from 160 to 1600 m, and in some areas, the floodplain exceeds 1 km. The river flows through the alluvial plain on the northern edge of the Tarim Basin, characterized by low and gentle topography, strong lateral erosion, sparse vegetation, poor surface erosion resistance, and intensified sediment accumulation that raises the riverbed elevation. The sediment particle size in the riverbed ranges from 0–0.9 mm, with the predominant grain composition consisting of clay, silt, and sand particles [19].
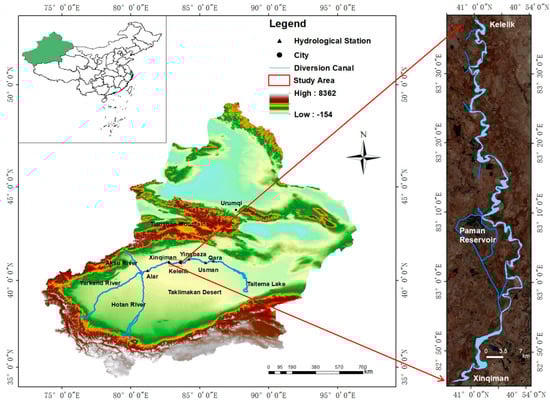
Figure 1.
Geographic location of the river reach from Xinqiman to Kelelik.
The Xinqiman hydrological station is the control section of the lower section of the upper reaches of the main stream of the Tarim River. It is located in Shaya County, Aksu Prefecture. The geographical coordinates are 80°43′ E, 41°02′ N, and the distance from the Yingbazha Hydrological Station is 258 km. The Yingbazha Hydrological Station is located in Yingbazha Village, Lunnan Town, Luntai County, Bayingol Mongol Autonomous Prefecture, Xinjiang. The geographical coordinates are 84°14′ E, 41°11′ N. The test items include water level, flow, suspended sediment, etc. The hydrological station data in this paper are from the Tarim River Basin Management Bureau. Based on the existing data of the two hydrological stations, the missing sediment transport data are supplemented according to the relationship between sediment transport rate and flow rate [40].
Monitoring data (see Figure 2) from the Xinqiman Hydrological Station and Yingbaza Station on the main stem of the Tarim River (1993–2024) indicate that annual runoff and sediment discharge at both stations have exhibited fluctuating upward trends and are significantly positively correlated. At the Xinqiman Hydrological Station, annual runoff and sediment transport fluctuations intensified after 2010, reaching their peak in 2022 (runoff of 8.562 × 10⁹ m3 and sediment transport of 3.7074 × 10⁷ tons), with the lowest values recorded in 2009 (8.37 × 10⁸ m3 and 3.624 × 10⁶ tons). At the Yingbaza Hydrological Station, fluctuations in annual runoff and sediment transport were even more pronounced, with a peak in 2017 (5.947 × 10⁹ m3 and 2.60258 × 10⁷ tons) and the lowest values in 2009 (1.83 × 10⁸ m3 and 2.232 × 10⁵ tons). Both annual runoff and annual sediment transport exhibited a positive correlation.
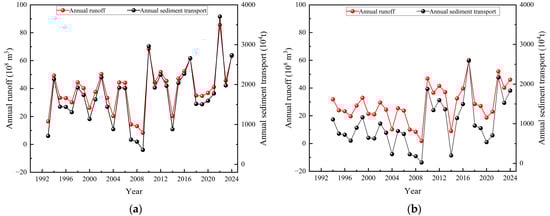
Figure 2.
Annual runoff and sediment load changes for the Xinqiman–Kelelik river reach: (a) variations in runoff and sediment from 1993 to 2024 at the Xinqiman Station; (b) variations in runoff and sediment from 1993 to 2024 at the Yingbaza Station.
3. Data and Methods
3.1. Data Sources
The study period is from 1993 to 2024, covering a total of 32 years. The data were sourced from Landsat series satellite imagery. Landsat 5-TM, Landsat 7-ETM+, Landsat 8-OLI, and Landsat 9-OLI satellite imagery for the period from 1993 to 2024, with cloud cover less than 10%, was downloaded from the Geospatial Data Cloud Platform of the Computer Network Information Center, Chinese Academy of Sciences (http://www.gscloud.cn accessed on 10 January 2025), as shown in Table 1. The Landsat 5 TM, Landsat 7 ETM+, Landsat 8 OLI, and Landsat 9 OLI satellites have a 30-m spatial resolution for multispectral bands. The Landsat 7 ETM+, Landsat 8 OLI, and Landsat 9 OLI satellites have a 15-m spatial resolution for panchromatic bands. Landsat 5 TM lacks a panchromatic band due to its earlier launch.

Table 1.
Satellite imagery utilized in the study (http://www.gscloud.cn).
3.2. Research Methods
Remote sensing technology, with its advantages of long time series, wide coverage, and multi-source data fusion [41,42], provides an efficient dynamic monitoring tool for river evolution studies. Remote sensing technology can quickly capture changes in the process of river evolution and provide long-term data to help researchers reveal the patterns and mechanisms of river evolution [43]. This study used ENVI 5.6 software to perform geometric, radiometric, and atmospheric corrections on satellite imagery. These corrections removed errors from sensors and the atmosphere, standardized the data, and improved their quality. This ensured that the subsequent analysis was scientific and repeatable. Using ArcMap 10.8 software, spectral information from different bands of Landsat series satellites was combined into multi-band composites to enhance the identification of vegetation, water bodies, and bare land. For Landsat 5-TM and Landsat 7-ETM+, bands B3 (red), B2 (green), and B1 (blue) were used, while for Landsat 8/9-OLI, bands B4 (red), B3 (green), and B2 (blue) were selected. True color imagery was generated, with vegetation appearing green, water bodies in deep blue, and bare land in gray-brown. To quickly and accurately extract water body boundaries, false color composites are commonly used. For Landsat 5-TM and Landsat 7-ETM+, bands B4 (near-infrared), B3 (red), and B2 (green) were applied, while for Landsat 8/9-OLI, bands B5 (near-infrared), B4 (red), and B3 (green) were selected. In the synthesized image, vegetation appears bright red (with hue reflecting density), water bodies appear deep black, and bare land appears cyan-blue [44,45].
In order to achieve accurate registration of multi-year remote sensing images, a polynomial model + DEM-assisted method is used to correct the terrain of Landsat images. The whole process will eliminate the projection displacement caused by topographic relief and improve the registration accuracy of multi-temporal images. The 2018 Copernicus DEM was used to perform topographic correction on Landsat images, and the DEM was re-projected into the UTM coordinate system of Landsat images and re-sampled to a spatial resolution of 30 m. Based on the RPC parameters in the Landsat MTL metafile and the DEM elevation data (Landsat5-TM and Landsat7-ETM + no RPC files, which need to be replaced by ground control points + polynomial correction), the terrain displacement is iteratively solved by the collinear equation model, and the orthophoto product is generated by the bilinear interpolation method. Through correction, the geometric accuracy is improved, the timing consistency is guaranteed, and all time-phase images are unified to the orthographic projection datum, so that the pixel-level residuals of multi-year change detection are controlled within 0.5 pixels. The radiation distortion is suppressed, and the radiation comparability between different time-phase images is enhanced by eliminating the slope illumination difference [46].
The flood season in the Xinqiman–Kelelik area is from June to August, and the dry season is from November to March of the following year. In the process of downloading and sorting Landsat series satellite image data, this paper found that the image data for this river section is limited, and the satellite image data of the same period in different years cannot be obtained. In different periods of each year, the flow of the Tarim River varies greatly, and the water body area in the river channel varies greatly. It can be seen from Figure 3 that the water area and the distribution of vegetation along the river in different periods are quite different. The interpretation of satellite images is highly dependent on the comprehensive analysis of image tone (water depth indication), shape (river bend characteristics) and shadow. The existing automatic method based on the Landsat spectrum is difficult to extract stably and accurately. Similarly, the river shoreline is in the riparian vegetation coverage area or shoal area. When extracting the river shoreline, the machine learning algorithms in ENVI, ArcGIS and NDVI, NDWI technology often become confused by wet beach areas, and the boundary accuracy cannot easily meet the requirements of morphological change analysis.
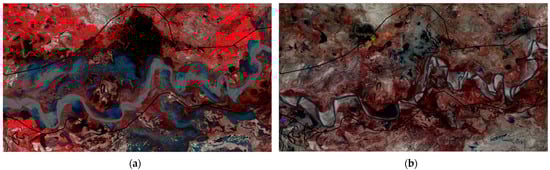
Figure 3.
Satellite images of different periods: (a) Satellite image of Paman reservoir reach on 22 August 1994; (b) Satellite image of Paman reservoir reach on 5 May 1995.Two satellite images are synthesized by band. The black lines in the figure represent the study area. The red part is the vegetation on both sides.
Automatic methods (especially low-resolution images such as Landsat) often face difficulty achieving the accuracy of manual interpretation in the location determination of river shorelines and sandbar edges, especially in curved river sections, bifurcated river sections, and riparian vegetation coverage areas. Visual interpretation can use all the interpretation elements such as hue, texture, shape, shadow, position and correlation to make a comprehensive judgment. For the analysis of long time series (32 years) satellite images, it is very important to ensure the consistency of interpretation standards in different periods. Visual interpretation can flexibly and uniformly apply a set of rules according to the specific characteristics of the study area and the overall performance of all images. However, the parameters of the automatic algorithm may be difficult to maintain stable when the image quality varies greatly in different periods, resulting in systematic deviations in the results. There are interference factors such as clouds, seasonal vegetation cover changes, and turbid water bodies in the study area. Visual interpretation can better identify and eliminate these interferences, and accurately capture the morphological information of the river itself. It has advantages in distinguishing water shadows and actual land boundaries, and distinguishing wet areas on beaches and permanent water bodies.
Therefore, when analyzing the river boundary of the Xinqiman–Kelelik section in the flood season, considering the characteristics of wide river width and river water area, changes to wet beach areas have a great influence on the river boundary. Taking the riverside vegetation boundary as the boundary of river width, the riverside vegetation is relatively stable, and can remain relatively unchanged in the fluctuation of water level in the flood season, which can eliminate the influence of water level change on the measurement of river width and improve the accuracy of measurement results.
This study investigates the multi-scale drivers of sedimentation and erosion in the Tarim River and their effects on ecological and social systems. It provides a scientific basis for managing arid-area river systems through both natural restoration and artificial regulation. It also has crucial practical value for ensuring food security and ecological stability in arid regions [47]. On this basis, using ArcMap 10.8 software and a remote sensing visual interpretation method [48], the river boundary from Xinqiman to Kelelik was extracted.
In order to systematically reveal the characteristics of river evolution from 1993 to 2024 in the Xinqiman–Kelelik section, this study used multi-dimensional quantitative indicators to conduct spatial and temporal comparative analysis based on the river boundary vector data extracted year by year: (1) The change of thalweg length: The annual thalweg geometric length (km) was accurately calculated in ArcGIS, and the overall trend and change rate were quantified by length-time curve and linear regression analysis, and the differences in typical years were compared. (2) The migration rate of the thalweg: In the typical river section, the plane displacement of the thalweg points of each section between adjacent years was calculated, and the mean value was divided by the time interval to obtain the annual average migration rate, and the migration rate of the thalweg of the typical river section was analyzed. (3) Bending coefficient: Based on satellite remote sensing imagery from 1993 to 2024, the thalweg line (the connection line of the deepest point of the main channel of each section of the river channel in the dry season) of the Xinqiman–Kelelik river segment over a 32-year period was extracted. Additionally, the river’s curvature coefficient k (Equation (1)) for the past 32 years was calculated.
In the equation, k is the curvature coefficient. L is the thalweg length, km. l is the straight-line length of the river segment, km. In this study, l is taken as 73.33 km.
(4) The evolution of cross-section width: The river section was divided into the key geomorphic units (bends, bifurcations, artificial buildings) and human activity sensitive areas (villages, farmland). Based on the same section, the annual river width was measured, and the average value was calculated to reflect the overall trend, identify significant local changes, and analyze the spatial distribution. (5) Shoreline erosion/deposition area: ArcGIS overlay analysis was used to accurately calculate the area of erosion area and deposition area at the river boundary between adjacent years, and the total erosion and deposition area was accumulated year by year; a spatial distribution map was drawn to clarify the erosion and deposition area. The above methods comprehensively evaluated the evolution of the plane shape (length, width) and dynamic process (thalweg migration, shoreline erosion and deposition) of the river section in the past 32 years.
4. Results and Analysis
4.1. Spatiotemporal Evolution Characteristics of Thalweg
The main channel of the upper reaches of the Tarim River (above Yangjibazha) is relatively stable in the dry season, and the riverbed is not bifurcated. The water flow is basically limited in the main channel, and there is no obvious bifurcation or beach segmentation. At this time, the thalweg is approximately distributed along the central axis of the main channel. The geometric shape of the main channel in the dry season is easy to determine by remote sensing images. The central line of the main channel is obtained by extracting the main channel in the dry season, and the central axis of the main channel in the dry season is approximated to the thalweg of the river. The thalweg line refers to the continuous connection of the deepest point along the longitudinal direction of the riverbed, which usually represents the path of the deepest water flow in the river channel. It usually corresponds to the mainstream trajectory (the main water flow axis), and is also the area with the fastest flow rate and the strongest erosion capacity.
As shown in Figure 4, the thalweg length of the Xinqiman–Kelelik river segment increased from 142.9 km to 171.9 km between 1993 and 2024, and the curvature coefficient rose from 1.95 to 2.34. This indicates that the curvature of the river has increased significantly, and the side erosion is the dominant driving force. The deposition of the beach makes the river pass passively as the secondary driving force in the active development of the meandering river. Combined with the changes in annual runoff and sediment load (Figure 2), the evolution of the thalweg can be divided into three phases: The first stage, the rapid development period of the river (1993–1995): Runoff increased from 1.646 × 10⁹ m3 to 3.341 × 10⁹ m3, and the sediment load rose from 7.127 × 10⁵ tons to 1.4467 × 10⁶ tons. The strengthened flow triggered intensified erosion, leading to an increase in thalweg length and enhanced river channel meandering. The second stage, the river fluctuation adjustment period (1996–2011): Runoff (8.37 × 10⁹~6.839× 10⁹ m3) and sediment discharge (3.623 × 10⁷~2.9613 × 10⁷ tons) were characterized by violent fluctuations, and the peak appeared in 2010 (runoff 6.839 × 10⁹ m3, sediment discharge 2.9613 × 10⁷ tons). During this period, there were four bends (1998, 2001, 2002, 2006), resulting in frequent river channel adjustment. The third stage, the secondary development period of the river (2012–2024): The thalweg was extended by 17.9 km, and the bending coefficient increased by 0.24. With the periodic growth of runoff and sediment transport, sediment deposition formed a beach body, forcing the water body to bypass and extend the thalweg.
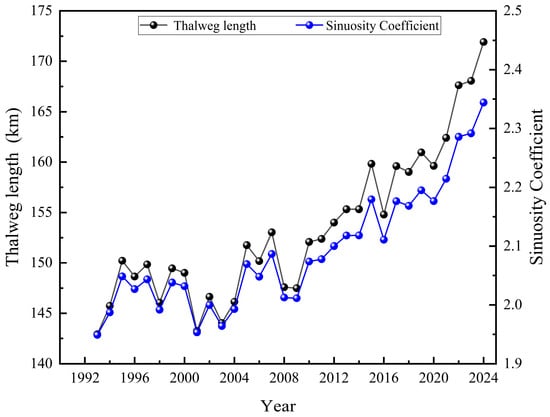
Figure 4.
Trends in thalweg length and curvature coefficient of the Xinqiman–Kelelik river segment from 1993 to 2024.
The river sections with severe evolution in typical years were selected for comparative analysis of thalweg changes, namely Tarim Farm Area 5, the Paman Reservoir river section in Tarim Township, the Pama river section, the Kuerqiaoer river section, and the Moon Bay scenic spot river section, as shown in Figure 5. The maximum offset distance of the thalweg was calculated respectively, and the results are shown in Table 2.
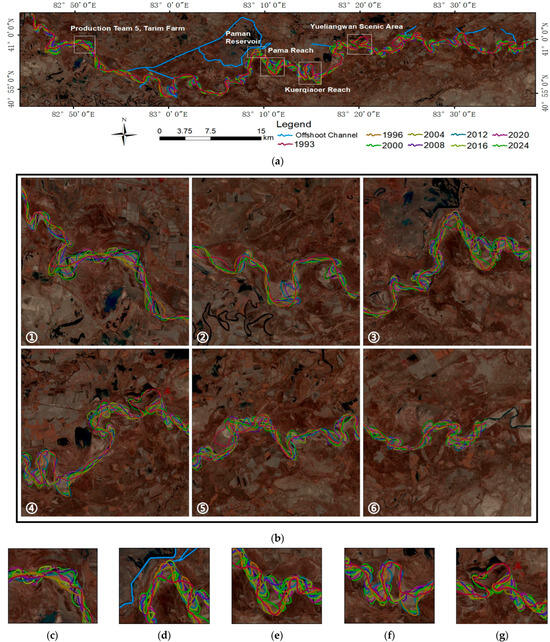
Figure 5.
Thalweg changes at typical reaches of the Xinqiman–Kelelik segment: (a) the thalweg from Xinqiman–Kelelik section in typical years from 1993 to 2024; (b) the overall thalweg change amplification diagram of the river section, the entire study area is divided into six parts, numbered 1–6 in the figure; (c) the change of thalweg in the Tarim Farm Area 5 reach; (d) the change of thalweg in the Paman reservoir reach; (e) the change of thalweg in the Pama reach; (f) the change of thalweg in the Kuerqiaoer reach; (g) the change of thalweg in the Yueliangwan Scenic Area reach.
Table 2.
Thalweg migration distance in typical areas of the Xinqiman–Kelelik segment (1993–2024).
As shown in Figure 5 and Table 2, the thalweg of the Tarim Farm Area 5 reach and Paman Reservoir reach has exhibited a significant northward migration trend over the past 32 years (Figure 5c,d). Specifically, the former has migrated a total of 801.2 m northward over 32 years, with the peak migration rate and distance occurring between 2004 and 2008, at a rate of 324.6 m/a and a distance of 1298.2 m. The latter has migrated a total of 1209.9 m northward, with the northward migration trend continuing to dominate after 2000. This phenomenon is primarily driven by the transverse circulation of the meander, where the concave bank is deepened by high-velocity spiral flow erosion, while the convex bank is elevated due to sediment deposition from low-velocity flow [49,50,51,52]. Together, these processes drive the northward migration of the thalweg. After 2008, the construction of the north bank revetment significantly slowed the migration rate of the thalweg. The average annual migration rate of the Tarim Farm Area 5 segment decreased from 49.11 m/a to 4.03 m/a, while the rate for the Paman Reservoir segment decreased from 64.03 m/a to 15.59 m/a. However, the northward migration trend of the thalweg has not been fully restrained. The continuous northward migration threatens the flood control safety of the northern bank villages in Tarim Farm Area 5 (with an increased risk of overtopping at sharp bends) and the stability of the bank foundation at the Paman Reservoir. To address the threats, the following governance measures are suggested for the two river sections. Tarim Farm Area 5 reach: Extend the bank protection system upstream. Install downstream slope erosion resistance—pointing spur dikes to divert flows southward, and adding vegetation buffer strips to enhance bank. Pam Reservoir Section: Construct permeable spur dikes and diversion walls on the north bank to curb erosion. Optimize the cross-section morphology (deeper north, shallower south) to weaken lateral circulation. Combine these efforts with sediment promotion projects on the south bank and reservoir sediment water regulation to stabilize the river channel.
The thalweg evolution in the Pama Reach (Figure 5e) and the Kuerqiaoer Reach (Figure 5f) both exhibit the characteristic of “early oscillation–later directional migration”. In the early stages (Pama Reach 1993–2004, Kuerqiaoer Reach 1993–2012), due to the wide and shallow channel and the dispersed flow, the main flow dynamics axis was unstable, leading to frequent north–south oscillations of the thalweg. In the later stages, driven by the high runoff year (with runoff of 4.411 × 10⁹ m3 in 2006 for the Pama Reach and 5.242 × 10⁹ m3 in 2016 for the Kuerqiaoer Reach), the river underwent meander cutoffs and straightening. It is inferred that the narrowing of the new channel is due to the continuous erosion of the concave bank (the north bank of the Bama River and the south bank of the Kurjoer River) caused by the transverse circulation, which forms a deep-water channel and drives the directional migration of the thalweg. The thalweg of the Pama Reach exhibited a cumulative northward migration of 2143.4 m toward the Tianshan Mountains side between 1993 and 2024. Notably, between 2004 and 2008, the thalweg migrated 1892.6 m northward toward the Tianshan Mountains. This is mainly related to the high runoff of the river in 2006, which led to the river turning and straightening, resulting in the northward movement of the river. After 2006, the thalweg oscillation stabilized. The migration rate dropped from 111.56 m/a to 29.38 m/a, and it showed a slow northward migration trend. The thalweg of the Kuerqiaoer Reach migrated a total of 2619.4 m southward from 1993 to 2024. Notably, between 2012 and 2016, the thalweg migrated 2507.7 m southward. This is due to the high runoff event in 2016, which led to the bending and straightening of the river channel, resulting in the southward movement of the river channel. The new river path moved farther away from the north bank farmland, affecting the irrigation water supply for the farmland.
In the Yueliangwan Scenic Area Reach (Figure 5g), the thalweg migrated southward from 1993 to 2016. From 1993 to 2004, the migration rate reached 119.6 m/a. After the meander cutoff and straightening in 2002, the river length shortened, the longitudinal slope increased, and flow energy became more concentrated. This enhanced vertical erosion capacity while weakening lateral erosion, resulting in a decrease in the migration rate to 6.9 m/a from 2004 to 2016. Between 2016 and 2024, the thalweg migrated northward. The migration rate was 9.1 m/a from 2016 to 2020 and increased to 21.5 m/a from 2020 to 2024. This accelerating northward shift threatens the flood prevention safety of the scenic area. To address this, it is essential to curb the accelerating northward migration of the thalweg by prioritizing the implementation of diversion projects, such as sills and spur dikes, along with ecological bank reinforcement to stabilize the river course.
The thalweg evolution in the Xinqiman–Kelelik segment exhibits significant spatial heterogeneity, influenced by both natural hydraulics and human interventions. In the typical areas, the river courses of the Tarim Farm Area 5 Reach, Paman Reservoir Reach, and Pama Reach have migrated northward (towards the Tianshan Mountains), eroding the bank slopes and posing flood control threats to the adjacent areas. The river course evolution in the Kuerqiaoer Reach and Yueliangwan Scenic Area Reach is active, with significant meander cutoffs and straightening. The overall river course has migrated southward (towards the Taklamakan Desert), necessitating priority measures to control erosion risks and prevent flood hazards caused by river course alterations.
The above studies clearly reveal the significant spatial and temporal heterogeneity and high migration rate of the thalweg in the Xinqiman–Kelelik section of the upper reaches of the Tarim River, and deepen the understanding of the evolution mechanism of rivers in arid areas. Compared with typical arid rivers such as the Nile River [17] and the Niger River [19], this study has quantified the thalweg oscillation characteristics of glacier-supplied inland rivers under strong human intervention for the first time. It confirms the conclusion of Li [2] on “strong lateral erosion” and “high risk of bending” in the middle reaches of the Tarim River, and also conforms to the mechanism of morphological transformation caused by breaking the critical value of bending rate observed by Wahiduzzaman [10]. However, this study further quantified the migration rate under the background of strong human activities (farmland expansion to 5140 hectares, intensive distribution of diversion sluices) (such as the peak value of Tarim Farm Area 5, 324.6 m/a). This complements the multi-factor driven framework proposed by Langat [13] in the Tana River. At the same time, the significant inhibitory effect of revetment projects (such as after 2008) on the migration rate was clearly quantified. For example, the thalweg migration rate of Tarim Farm Area 5 decreased from 49.11 m/a to 4.03 m/a, which provided valuable empirical data for understanding the effectiveness of artificial regulation measures in river geomorphology management in arid areas, and supplemented Ali’s [12] observation on the impact of engineering on river activity, while highlighting the necessity of targeted engineering interventions in fragile ecological areas (such as proposed spur dikes, diversion walls, and vegetation buffer zones). In addition, the maximum thalweg line offset (2619.4 m) is much larger than the 1200 m offset of the Ganges River [9], highlighting the synergistic amplification effect of loose riparian sediments and flood events.
4.2. Evolution of River Planform Morphology
4.2.1. River Width
The width of the river channel is an important parameter to study the change of river channel plane shape, which affects the flow velocity and sediment transport, directly reflects the lateral erosion–deposition balance of river, and then affects flood control and river bank stability. In order to explore the evolution law of river channel width, the cross-section of the river channel was divided according to the following principles, aiming to capture the key factors controlling the change of river channel plane shape and its spatial heterogeneity. Cross-sections (such as Cross-sections BB, CC, EE, FF, and MM) were preferentially set at the key geomorphological units (corner vertices and transition sections) that significantly affect a river’s morphology and evolution process. The bend is the most active area of lateral erosion and convex bank deposition. The section was set at the top of the bend (the strongest erosion point) and the upstream and downstream transition section to capture the influence of curvature change on river width and section shape. Priority sections (such as Cross-sections AA, II, JJ, KK, and OO) were set up in the upstream and downstream of artificial building interference sections (embankments, spur dikes, revetments, bridges, diversions, etc.) to evaluate their effects on river channel narrowing, widening or local erosion/deposition. In areas where human activities have a direct or potential significant impact on river bank stability and river morphology (villages, farmlands), encrypted sections (such as Cross-sections DD, GG, HH, LL, and NN) were used to assess flood control risks and protection needs, as well as the impact of agricultural activities (such as water intake, drainage, bank slope reclamation) on river bank erosion, river morphology and stability. In the stable river reaches (such as a straight, slightly curved section, and a controlled river section) with relatively uniform river morphology, slow evolution or less interference, the section spacing could be appropriately increased, and the channel stability between section EE and FF was the largest, reaching 21.9 km. In the vicinity of bends, bifurcations, man-made buildings and villages/farmlands, the cross-section spacing was significantly reduced by a minimum spacing of 2.6 km to more accurately characterize the complex morphological changes and dynamic processes in these key areas. On the basis of satisfying the above principles, it was ensured that the section could reasonably cover the entire study section from Xinqiman–Kelelik in space. A total of 15 representative cross sections were arranged in the study section (see Figure 6 for details), and the section spacing ranged from 2.6 km to 21.9 km. This non-equidistant layout reflects the non-uniform spatial distribution of the river’s geomorphological characteristics, the intensity of human activities, and potential evolution risks.
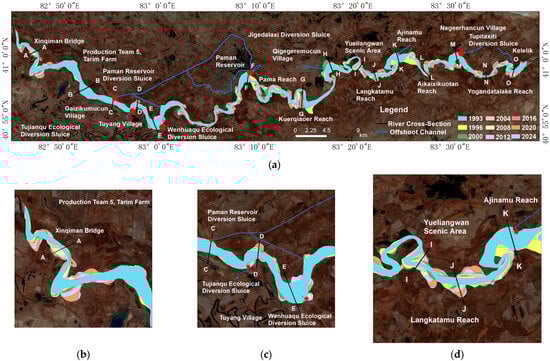
Figure 6.
Schematic diagram of the cross-section river division in the Xinqiman–Kelelik segment study area. (a) The overall schematic diagram from Cross-section AA to Cross-section OO. (b) Schematic diagram of Cross-section AA. Cross-section AA is located near the Xinqiman Bridge, which belongs to the typical section of the artificial building interference Cross-section. (c) Schematic diagram of Cross-sections CC, DD, and EE, located at the apex of the bend and the transition section of the Cross-section, belonging to the key geomorphic unit’s typical cross-section that significantly affects the river channel morphology and evolutionary process. (d) Schematic representation of Cross-sections II, JJ, and KK, typical of Cross-sections in areas where anthropogenic activities have had direct or potentially significant impacts on stream bank stability and channel morphology.
Since satellite imagery cannot obtain the cross-sectional shape of the river channel, this study only analyzes the change of the river channel width based on the river channel plane. Figure 7 shows the annual changes in the width of each typical cross-section. Based on the morphological evolution characteristics and driving mechanisms of the river cross-sections, the typical cross-sections were classified. Cross-sections BB, CC, EE, FF, and MM are categorized as meander-driven water-sediment differentiation types, as shown in Figure 7a, and are designated as Type I cross-sections. Cross-sections AA, II, JJ, KK, and OO are classified as engineering-flood composite disturbance types, as shown in Figure 7b, and are designated as Type II cross-sections. Cross-sections DD, GG, HH, LL, and NN are categorized as mixed evolution types, as shown in Figure 7c, and are designated as Type III cross-sections.
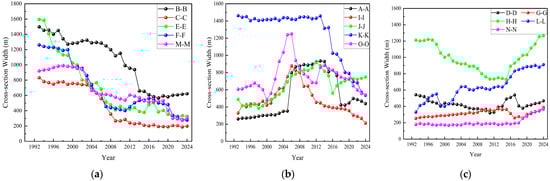
Figure 7.
Width changes of typical cross-sections: (a) cross-sections BB, CC, EE, FF, and MM; (b) cross-sections AA, II, JJ, KK, and OO; (c) cross-sections DD, GG, HH, LL, and NN.
As shown in Figure 7a, Type I cross-sections exhibited a significant contraction trend from 1993 to 2024, with a contraction rate ranging from 62.1% to 79.5%. These cross-sections are primarily located in the transitional sections of river bends (Figure 6). The contraction mechanism of the cross-sections is primarily driven by the water–sediment dynamic differentiation in river bends. The concave bank undergoes continuous lateral erosion, leading to shoreline retreat and threatening the safety of adjacent farmland and villages, thus necessitating the intervention of artificial bank protection measures to limit channel widening. In contrast, the convex bank experiences a significantly higher deposition rate than the erosion intensity of the concave bank due to reduced flow velocity, sediment deposition, and the root-induced stabilization effect of vegetation, driving an overall narrowing of the cross-sectional morphology. The “Recent Comprehensive Management Plan for the Tarim River Basin” began implementation in 2001, and by 2011, the plan entered its final stage. After 2011, the implementation of bank protection projects and flow regulation, along with other systemic management measures, effectively slowed down the dynamic evolution of the river, and the lateral instability of the riverbed was brought under control [52].
As shown in Figure 7b, the morphological evolution of Type II cross-sections exhibited a non-steady “expansion followed by contraction” pattern. This is because such cross-sections are mainly located in areas with dense hydraulic engineering structures and river evolution-sensitive zones (see Figure 6). The temporal and spatial variations of these cross-sections are primarily attributed to the dual disturbances of human activity interventions and extreme hydrological events on the hydrodynamic conditions. At Cross-section AA, which is predominantly influenced by human activities, the construction of the Xinqiman Bridge (2007–2008) altered the local flow regime, triggering erosion along the right bank and sediment deposition on the central shoal of the left bank. As a result, by 2018, the river channel had narrowed to 37.9% of its original width. Cross-section OO widened from 1993 to 2006, reaching a peak width of 1246.6 m in 2006, driven by sediment–water separation in bends. However, due to water diversion upstream and bank-protection projects, the channel width reduced by 56.6% to 541.5 m by 2024. Affected by the high runoff event in 2002 (runoff volume of 5.04 × 10⁹ m3 and sediment load of 2.1823 × 10⁷ tons), the river channel near the upstream Yueliangwan Scenic Area Reach underwent meander cutoffs and channel straightening. This morphological change led to a significant increase in downstream flow velocity, triggering severe erosion. Consequently, Cross-sections II, JJ, and KK reached their maximum widths of 877.9 m, 915.7 m, and 1458.2 m in 2006, 2012, and 2013, representing increases of 61.1%, 77.2%, and 2.1%, respectively. Subsequently, with the weakening of hydrodynamic forces combined with natural adjustment processes, the channel widths at these sections contracted by 75.9%, 18.2%, and 63.3% by 2024. The phenomenon reveals the differentiated driving mechanisms of short-term intense disturbances (such as engineering interventions and flood-driven channel cutoffs) and long-term water-sediment equilibrium processes in the morphological adjustment of river channels.
As shown in Figure 7c, Type III cross-sections are located at river bends and transition sections (Cross-sections DD, GG, LL, and NN), as well as in sensitive zones of river evolution (Cross-section HH). The channel width at Cross-sections DD and NN remained stable, primarily due to the combined effects of homogeneous lithology along both banks, flat terrain, and a low stream gradient. Clay with strong erosion resistance suppresses lateral erosion. The straight river channel and low flow velocity weaken the lateral erosive force, maintaining transverse stability. Cross-section LL showed a 175.3% widening from 1993 to 2017. This was mainly due to concave-bank erosion from lateral circulations in bends. The average lateral migration rate was 18.7 m/a. After 2017, bank-protection projects reduced the erosion rate to 4.2 m/a, showing that human intervention effectively controlled the river’s lateral migration. Cross-section GG experienced a 44.1% widening from 1993 to 2015 due to lateral circulation erosion. Continued erosion led to a narrowing of the meander neck, and in 2016, a high runoff (with a runoff of 5.242 × 10⁹ m3 and sediment transport of 2.2696 × 10⁷ tons) breached the neck, resulting in a channel cutoff and straightening. The new channel showed a widening trend under the erosive action of flowing water from 2017 to 2024. Cross-section HH exhibited an evolution characteristic of “shrinkage followed by expansion”. From 1993 to 2015, width reduction occurred due to an imbalance in water and sediment transport (similar to the mechanism observed at profile EE). However, in 2016, a high runoff upstream caused a channel cutoff and straightening, which triggered an increase in downstream hydrodynamic forces, driving continuous widening of the profile. By 2024, the width had reached 1264.5 m.
In the Xinqiman–Kelelik section of the Tarim River, the main causes of shrinkage are the strong siltation of the convex bank due to the weakening of hydrodynamics and vegetation sand fixation (net siltation of 7.72 km 2 on the north bank), and the limitation of the artificial revetment project on the erosion space of the concave bank (net erosion of 4.49 km 2 on the south bank). This “deposition-dominated shrinking” model is different from the erosion–deposition dynamics observed by Langat [13] in the Tana River, which highlights the unique morphological constraints and contradictions of rivers in arid areas under the high-intensity agricultural development (water diversion and bank protection) on both sides. The aggravation of undercutting and the rise in the water level (the increase of flood risk in the flood season) caused by shrinkage are new challenges in river management in arid areas. It is necessary to draw lessons from Hazel [34] and others in the regulation of water and sediment to seek a more precise balance between the method of artificial flood and sediment discharge in the Colorado River and the layout of revetment engineering, which is very important to ensure the safety of water diversion sluice and downstream ecological water conveyance, as noted by Zhenglong [25], 2007.
4.2.2. Channel Erosion and Sedimentation Changes
Based on satellite imagery from the flood season between 1993 and 2024, the riverbank lines of the Xinqiman–Kelelik River section were extracted. Typical years (1993, 1996, 2000, 2004, 2008, 2012, 2016, 2020, and 2024) were selected to construct the river channel boundary closure areas and quantify the areas of erosion and deposition patches on both banks. The results indicate that from 1993 to 2024, the river reach showed a general siltation trend, with a net siltation area of 3.23 km2. However, there were significant differences in the sedimentation and erosion conditions across different periods.
During the erosion-dominated periods (1993–1996, 2000–2004, 2008–2016, and 2020–2024), the total erosion area reached 15.25 km2. Between 2020 and 2024, which saw the most intense erosion, the erosion area was 5.59 km2 (Figure 8c). During this time, In the Kuerqiaoer Reach and the Yueliangwan Scenic Area Reach, the erosion on both sides of the river was serious (Figure 8b). This was primarily due to the increase in annual runoff from 2020 to 2024. In 2022, the annual runoff amounted to 8.562 billion m3, marking the highest level in 32 years. The intensified flooding eroded the riverbanks, leading to collapses. Driven by the increased runoff, the eroded sediment was transported by the water flow and deposited in various downstream areas.
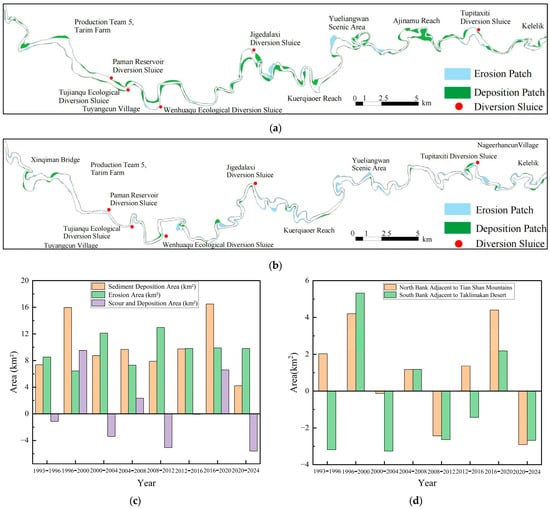
Figure 8.
The scouring and silting conditions of the Xinqiman–Kelelik reach from 1993 to 2024: (a) erosion and accumulation patches in Xinqiman–Kelelik reach from 1996 to 2000; (b) erosion and accumulation patches in Xinqiman–Kelelik reach from 2020 to 2024; (c) river erosion and deposition area; (d) erosion and deposition area on both sides of the river. (note: + represents siltation; − represents erosion).
During the sedimentation-dominated periods (1996–2000, 2004–2008, and 2016–2020), the total siltation area was 18.48 km2. Between 1996 and 2000, the most intensive siltation period, the siltation area reached 9.53 km2 (Figure 8c). During this period, the reduced annual runoff (only 2.623 billion m3 in 2000) caused significant sediment deposition along the riverbanks, forming extensive siltation flats. Along the banks of Tuyang Village, downstream of the Jigedalaxi Diversion Sluice, and along the banks of Ajinamu Reach (Figure 8a), these flats have fully developed. Spatially, the total erosion area on the southern bank (13.18 km2) was substantially greater than that on the northern bank (5.47 km2), whereas the total deposition area on the northern bank (13.19 km2) significantly exceeded that on the southern bank (8.69 km2), indicating a prevailing erosional trend along the southern bank and depositional conditions along the northern bank (Figure 8d). Overall, the river channel has exhibited a southward migration, shifting toward the Taklamakan Desert, which reflects the long-term interactions between regional hydrodynamic and sediment transport processes and fluvial geomorphology.
This study quantifies the significant spatial differentiation of shoreline erosion and deposition: the net erosion on the south bank is 4.49 km2, and the net deposition on the north bank is 7.72 km2, resulting in the overall southward movement of the river. This is consistent with the strong asymmetric erosion and deposition observed by Nawfee [8] and Hossain [9]. However, this study combines hydrological data (Figure 2) and human activity information (Figure 9) to further clarify that this differentiation in the upper reaches of the Tarim River is not only controlled by the influence of natural bend circulation, but also strongly affected by the location of diversion sluices, the distribution of revetment projects, and the destruction of bank slope stability by farmland reclamation. This pattern of natural processes and human interventions interweaving and superimposing in space to shape the pattern of erosion and deposition deepens our understanding of the response of river geomorphology in arid areas to composite driving factors, complementing the research of Li [2] and Yu [23] in the Tarim River.
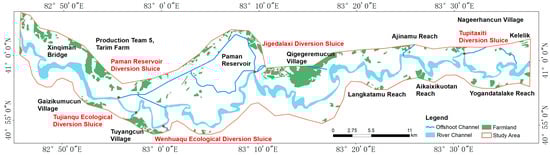
Figure 9.
Distribution of farmland and locations of ecological water diversion sluices along the Xinqiman–Kelelik river reach.
4.3. Impact of River Channel Evolution on Ecological Water Diversion
The Tarim River serves as the lifeline for agriculture and ecosystems in the arid regions of southern Xinjiang. River channel evolution is a fundamental aspect of natural fluvial processes, and its dynamic changes directly affect the feasibility and sustainability of ecological water diversion along both banks, thereby influencing agricultural production and ecological conditions in the surrounding The Xinqiman–Kelelik reach of the Tarim River traverses Shaya County and Kuche City. The water resources of the Tarim River are crucial for sustaining the agricultural systems and fragile ecological balance in these regions. Within this reach, there are five ecological diversion gates, namely the Paman Reservoir Diversion Sluice, Tujianqu Ecological Diversion Sluice, Wenhuaqu Ecological Diversion Sluice, Jigedalaxi Diversion Sluice, and Tupitaxiti Diversion Sluice (Figure 9). These sluices are responsible for irrigating 22,100 hectares of farmland and 68,700 hectares of ecological land in the region. Therefore, it is crucial to investigate the impact of river evolution on these ecological diversion gates.
As indicated by the analysis results from Section 3.2, the river channels at the Paman Reservoir Diversion Sluice (Cross-section CC), Wenhuaqu Ecological Diversion Sluice (Cross-section EE), Jigedalaxi Diversion Sluice (Cross-section FF), and Tupitaxiti Diversion Sluice (Cross-section MM) have undergone significant narrowing, while the river channel at the Tujianqu Ecological Diversion Sluice (Cross-section DD) has remained stable. The primary cause of river channel contraction is the combined effect of natural flow and sediment variations (helicoidal flow in bends causing concave bank erosion and convex bank deposition) and human activities (reduced base flow due to dam/gate regulation and restricted lateral movement from bank protection). These have led to deepened concave bank scour threatening gate foundation stability and convex bank sedimentation narrowing the flow cross-section, resulting in a local rise in water levels near gates. However, the specific threats to human development activities (such as farmland, construction, and infrastructure) on both sides of the Strait need to distinguish between the relative effects of natural processes and human activities. The strong lateral erosion (concave bank erosion migration) observed during the study period is mainly the natural attribute of river dynamic evolution, especially in areas without engineering intervention or with weak lithological corrosion resistance. However, the intervention of human activities has significantly amplified the negative impact of natural changes. On the one hand, water conservancy projects (dam regulation) have weakened the base flow that maintains the stability of river morphology and accelerated the shrinking trend; on the other hand, early river management was improper or lagging behind, failing to set up effective protection in key areas in time, and not halting human encroachment on settlements and agricultural development in floodplains, exposing these areas to the potential risk of river swing or shrinkage. It is recommended that the concave bank be stabilized using pile-founded caissons combined with eco-friendly gabion structures to control erosion, and sediment-guiding groynes should be installed along the convex bank to optimize deposition patterns. These measures are essential to ensure the structural safety of the diversion sluices and improve water intake efficiency.
Figure 10 illustrates the thalweg shifts near the eco-diversion gates of the Xinqiman–Kelelik reach. From 1993–2000, the thalweg in the vicinity of the Paman Reservoir Diversion Sluice shifted 557.3 m towards the gate at a rate of 79.6 m/a. This rapid migration was mainly caused by the strong lateral erosion driven by the transverse circulation of the natural bend, which directly threatened the safety of the adjacent sluice foundation and reflected the high variability of the natural evolution of the region. Post-2000, following the implementation of bank protection on the gate side, the migration rate slowed significantly to 4.9 m/a and stabilized. This proves that high-intensity human engineering intervention (revetment) is the key to effectively curb the threat of natural side erosion. Near the Tujianqu Ecological Diversion Sluice, the thalweg migrated 272.5 m towards the gate at 24.8 m/a during 1993–2004. Post-2004, bank protection on the gate side reduced the migration rate to 0.7 m/a. This also shows the importance of timely revetment engineering in dealing with natural side erosion and protecting coastal facilities. Regarding the Jigedalaxi Diversion Sluice, the maximum thalweg migration toward the gate from 1993–2016 was 1125.1 m (48.9 m/a). Continuous rapid migration is also a process dominated by natural side erosion. Post-2016, bank protection on the gate side reduced the migration rate to 4.2 m/a, stabilizing the thalweg. Near the Wenhuaqu Ecological Diversion Sluice, the thalweg swings unpredictably north or south. From 1993 to 2012, it migrated towards the south bank (ecological diversion sluice side). Post-2012, due to channel migration, it shifted northward (Figure 10). The violent swing of the thalweg is a typical manifestation of the natural variability of lateral river migration, and the degree of threat to both sides of the river is highly related to the layout of human development. This can cause sediment deposition upstream of the gate, reducing diversion efficiency and threatening the 12,000-hectare ecological water supply. To ensure safe water diversion, the river near the gate should be dredged. At the Tupitaxiti Diversion Sluice, the banks have uniform lithology. Erosion-resistant clay/cemented layers curb lateral erosion, stabilizing the river and keeping the thalweg largely unmigrated over the past 32 years. This area proves that the river channel can maintain a high degree of natural stability when the lithology is highly uniform and not disturbed by major human engineering. The potential threat to human development activities (such as diversion sluices) on both sides of the river is mainly due to the cumulative effect of long-term natural erosion or extreme events, rather than significant lateral swing. Its threat nature and evolution mechanism are significantly different from other regions.
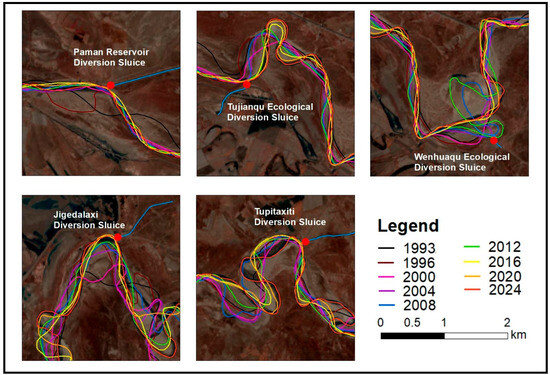
Figure 10.
Changes in the thalweg near ecological water diversion sluices along the Xinqiman–Kelelik river reach.
This study reveals the common problems of river shrinkage and thalweg migration to the sluice in the four diversion sluice areas. It provides a typical example for river water diversion management in arid areas. This is consistent with Debnath’s [11] research on the threat of bend cutting to the intake, but this study more systematically quantifies its rate and spatial distribution. The research results strongly indicate that the location, design and long-term maintenance of key infrastructure such as diversion sluices must fully consider the evolution trend of the upper and lower reaches of the Tarim River in the arid area where the relationship between water and sediment is drastically adjusted and the river regime is unstable.
5. Conclusions
This study focuses on the main stem of the Tarim River, specifically the Xinqiman–Kelelik reach, and extracts long-term time series data on riverbank and thalweg evolution based on Landsat satellite imagery from 1993 to 2024.
A systematic analysis was conducted on indicators such as channel sinuosity across different periods, migration rates of maximum thalweg points, width variations of representative cross-sections, and lateral erosion and deposition areas along the riverbanks, in order to assess river regime evolution and changes in planform morphology. The main conclusions are as follows:
Between 1993 and 2024, the main flow of the river exhibited bidirectional lateral oscillation along the north–south axis. During this period, the length of the thalweg increased from 142.9 km to 171.9 km, and the sinuosity index rose from 1.95 to 2.34, indicating an overall increase in channel meandering. The maximum lateral shift of the thalweg, reaching 2619.4 m, occurred near Kurquol, where channel straightening due to meander cutoff was observed, posing a significant threat to flood control safety for adjacent villages.
Over the past 32 years, the cross-sectional width of the Xinqiman–Kelelik reach of the Tarim River has shown a pronounced narrowing trend. The average channel width decreased from 784.9 m in 1993 to 506.9 m in 2024, representing an average reduction rate of 35.42%. This channel constriction has led to increased vertical incision, rising water levels, and accelerated flow velocities, thereby heightening the risk of flood disasters during the flood season.
Between 1993 and 2024, the Xinqiman–Kelelik reach of the Tarim River exhibited distinct erosion and deposition patterns along its banks. On the northern bank, adjacent to the Tianshan Mountains, the areas of erosion and deposition were 5.47 km2 and 13.19 km2, respectively, indicating a dominant depositional trend. Conversely, the southern bank, bordering the Taklamakan Desert, experienced 13.18 km2 of erosion and 8.69 km2 of deposition, reflecting a prevailing erosional state. Overall, the river reach exhibited a net depositional condition, with a total deposition area of 3.23 km2, and the riverbanks showed a general southward migration.
The evolution of river dynamics near the eco-diversion gates of the Xinqiman–Kelelik reach of the Tarim River is driven by both natural flow and sediment forces (concave bank erosion, convex bank deposition) and human activities (dam/gate regulation, bank protection). This caused river channel contraction at four gate areas, with the thalweg moving towards the gates at up to 79.6 m/a, threatening gate foundations and causing local water-level rises. At the Wenhuaqu Ecological Diversion Sluice, dredging is needed to maintain diversion efficiency. It is recommended to stabilize concave banks and guide sediment deposition on convex banks to ensure ecological and agricultural irrigation safety.
Author Contributions
Conceptualization, Z.L. and L.L.; methodology, Z.L. and J.L.; software, Z.L. and J.L.; validation, Z.L., L.L. and J.L.; formal analysis, L.L.; investigation, L.L.; resources, Z.L. and L.L.; data curation, Z.L.; writing—original draft preparation, Z.L.; writing—review and editing, L.L.; visualization, Z.L.; supervision, L.L. and J.L.; project administration, L.L.; funding acquisition, L.L. All authors have read and agreed to the published version of the manuscript.
Funding
This research was funded by Tianshan Elite Youth Talent Program of Xinjiang Uygur Autonomous Region (2024TSYCCX0039), the Key R&D project of Xinjiang Uygur Autonomous Region, grant number 2022B03024-2 and the 2024 research project of the Xinjiang Key Laboratory of Hydraulic Engineering Safety and Water Disaster Prevention (ZDSYS-YJS-2024-57).
Institutional Review Board Statement
Not applicable.
Informed Consent Statement
Not applicable.
Data Availability Statement
The data presented in this study are all available in the manuscript.
Conflicts of Interest
The authors declare no conflicts of interest.
References
- Yang, F.; Xue, L.; Wei, G.; Chi, Y.; Yang, G. Study on the dominant causes of streamflow alteration and effects of the current water diversion in the Tarim River Basin, China. Hydrol. Process. 2018, 32, 3391–3401. [Google Scholar] [CrossRef]
- Li, Z.; Yu, G.; Brierley, G.J.; Wang, Z.; Jia, Y. Migration and cutoff of meanders in the hyperarid environment of the middle Tarim River, northwestern China. Geomorphology 2017, 276, 116–124. (In Chinese) [Google Scholar] [CrossRef]
- Wang, G.; Wang, Y.; Gui, D. Research progress on water resources in the Tarim River Basin. Arid Land Geogr. 2018, 41, 1151–1159. [Google Scholar]
- Zhou, T.; Zhao, J. Changes in the middle reaches of the south Tarim River. J. Beijing Norm. Univ. (Nat. Sci.) 1959, 4, 46–60+104. [Google Scholar]
- Yin, Y. Encyclopedia of Rivers and Lakes in China and Commentary on the Water Classic. Henan Water Resour. 2006, 38. [Google Scholar]
- Qin, P. A brief commentary on Records of Rivers in the Western Regions: Preliminary tracing of the water sources of Lop Nur and Kara Nur. J. Zhengzhou Univ. (Philos. Soc. Sci. Ed.) 1988, 4–11.7. (In Chinese) [Google Scholar]
- Zhao, C.; Shi, L.; Xu, F.; Liu, H. Geological processes of the river and channel evolution in the middle and lower reaches of the Yangtze River. Yangtze River 2002, 33, 8–10+48. (In Chinese) [Google Scholar] [CrossRef]
- Nawfee, S.M.; Dewan, A.; Rashid, T. Integrating subsurface stratigraphic records with satellite images to investigate channel change and bar evolution: A case study of the Padma River, Bangladesh. Environ. Earth Sci. 2018, 77, 1–14. [Google Scholar] [CrossRef]
- Hossain, M.A.; Gan, T.Y.; Baki, A.B.M. Assessing morphological changes of the Ganges River using satellite images. Quat. Int. 2013, 304, 142–155. [Google Scholar] [CrossRef]
- Wahiduzzaman, M.; Yeasmin, A. An observation of the changing trends of a river channel pattern in Bangladesh using satellite images. Appl. Sci. 2022, 12, 11604. [Google Scholar] [CrossRef]
- Debnath, J.; Meraj, G.; Das Pan, N.; Chand, K.; Debbarma, S.; Sahariah, D.; Gualtieri, C.; Kanga, S.; Singh, S.K.; Farooq, M.; et al. Integrated remote sensing and field-based approach to assess the temporal evolution and future projection of meanders: A case study on River Manu in North-Eastern India. PLoS ONE 2022, 17, e0271190. [Google Scholar] [CrossRef] [PubMed]
- Ali, P.Y.; Jie, D.; Khan, A.; Sravanthi, N.; Rao, L.A.K.; Hao, C. Channel migration characteristics of the Yamuna River from 1954 to 2015 in the vicinity of Agra, India: A case study using remote sensing and GIS. Int. J. River Basin Manag. 2019, 17, 367–375. [Google Scholar] [CrossRef]
- Langat, P.K.; Kumar, L.; Koech, R. Monitoring river channel dynamics using remote sensing and GIS techniques. Geomorphology 2019, 325, 92–102. [Google Scholar] [CrossRef]
- Basnayaka, V.; Samarasinghe, J.T.; Gunathilake, M.B.; Muttil, N.; Hettiarachchi, D.C.; Abeynayaka, A.; Rathnayake, U. Analysis of meandering river morphodynamics using satellite remote sensing data—An application in the lower Deduru Oya (River), Sri Lanka. Land 2022, 11, 1091. [Google Scholar] [CrossRef]
- Gupta, A.; Hock, L.; Huang, X.; Ping, C. Evaluation of part of the Mekong River using satellite imagery. Geomorphology 2002, 44, 221–239. [Google Scholar] [CrossRef]
- Binh, D.V.; Wietlisbach, B.; Kantoush, S.; Loc, H.H.; Park, E.; de Cesare, G.; Cuong, D.H.; Tung, N.X.; Sumi, T. A novel method for river bank detection from landsat satellite data: A case study in the Vietnamese Mekong Delta. Remote Sens. 2020, 12, 3298. [Google Scholar] [CrossRef]
- Said, R. The Geological Evolution of the River Nile; Springer Science & Business Media: Berlin/Heidelberg, Germany, 2012. [Google Scholar]
- Stanley, D.J.; Warne, A.G. Nile Delta: Recent geological evolution and human impact. Science 1993, 260, 628–634. [Google Scholar] [CrossRef]
- Lawal, M.A.; Omosanya, K.O.L. Multidecadal changes in planform morphology of the confluence of River Niger and River Benue, West Africa. J. Hydrol. 2023, 623, 129764. [Google Scholar] [CrossRef]
- Dada, O.A.; Qiao, L.; Ding, D.; Li, G.; Ma, Y.; Wang, L. Evolutionary trends of the Niger Delta shoreline during the last 100 years: Responses to rainfall and river discharge. Mar. Geol. 2015, 367, 202–211. [Google Scholar] [CrossRef]
- Jiang, J.; Xiao, G.; Wu, W.; Ke, X.; He, Y.; Song, Y.; Zhou, X.; Zhang, M.; Liu, Y.; Fu, X.; et al. Is river-course change associated with the crustal movement? Geocarto Int. 2022, 37, 11846–11866. [Google Scholar] [CrossRef]
- Chen, Y.; Ye, Z.; Shen, Y. Desiccation of the Tarim River, Xinjiang, China, and mitigation strategy. Quat. Int. 2011, 244, 264–271. [Google Scholar] [CrossRef]
- Yu, G.; Disse, M.; Huang, H.Q.; Yu, Y.; Li, Z. River network evolution and fluvial process responses to human activity in a hyper-arid environment—Case of the Tarim River in Northwest China. CATENA 2016, 147, 96–109. [Google Scholar] [CrossRef]
- Yan, Z.L.; Huang, Q.; Tian, H.F.; Jin, X.C. Remote sensing analyses of spatio-temporal changes of the ecological environment in the lower reaches of the Tarim River. N. Z. J. Agric. Res. 2007, 50, 679–687. [Google Scholar]
- Frascati, A.; Lanzoni, S. Morphodynamic regime and long-term evolution of meandering rivers. J. Geophys. Res. Earth Surf. 2009, 114, F02002. [Google Scholar] [CrossRef]
- Camporeale, C.; Perucca, E.; Ridolfi, L. Significance of cutoff in meandering river dynamics. J. Geophys. Res. Earth Surf. 2008, 113, F01001. [Google Scholar] [CrossRef]
- Zhang, X.; Chen, Y.; Li, L.; Zhang, L. Study on the influence of revetment on the evolution law of river channel morphology in the wandering section of Tarim river. Sci. Rep. 2025, 15, 16355. [Google Scholar] [CrossRef]
- Zuo, Q.; Zhao, H.; Mao, C.; Ma, J.; Cui, G. Quantitative analysis of human-water relationships and harmony-based regulation in the Tarim River Basin. J. Hydrol. Eng. 2015, 20, 05014030. [Google Scholar] [CrossRef]
- Ling, H.; Guo, B.; Zhang, G.; Xu, H.; Deng, X. Evaluation of the ecological protective effect of the “large basin” comprehensive management system in the Tarim River basin, China. Sci. Total Environ. 2019, 650, 1696–1706. [Google Scholar] [CrossRef]
- Tanton, T.; Ikramova, M.; Rycroft, D. Natural and manmade risks to water resource security in the Amu Darya Basin. In Interstate Water Resource Risk Management Towards a Sustainable Future for the Aral Basin (JAYHUN); IWA Publishing: London, UK, 2010; pp. 99–116. [Google Scholar]
- Pak, M. International River Basin Management in the Face of Change: Syr Darya Basin Case Study. J Oregon State University: Corvallis, OR, USA, 2014; p. 3. Available online: https://ir.library.oregonstate.edu/concern/graduate_thesis_or_dissertations/4j03d425d (accessed on 23 May 2025).
- Sorg, A.; Mosello, B.; Shalpykova, G.; Allan, A.; Clarvis, M.H.; Stoffel, M. Coping with changing water resources: The case of the Syr Darya river basin in Central Asia. Environ. Sci. Policy 2014, 43, 68–77. [Google Scholar] [CrossRef]
- Hazel, J.E., Jr.; Kaplinski, M.A.; Hamill, D.; Buscombe, D.; Mueller, E.R.; Ross, R.P.; Kohl, K.A.; Grams, P.E. Multi-Decadal Sandbar Response to Flow Management Downstream from a Large Dam—The Glen Canyon Dam on the Colorado River in Marble and Grand Canyons, Arizona; US Geological Survey: Baltimore, MD, USA, 2022.
- Wang, Y.G.; Hu, C.H.; Zhou, W.H. Characteristics of riverbed evolution in the main stream of the Tarim River. J. Hydraul. Eng. 2003, 12, 27–33. [Google Scholar]
- Hu, C.; Wang, Y.; Guo, Q.; Hu, J. River Channel Evolution and Regulation of the Main Stream of Tarim River; Science Press: Beijing, China, 2005. [Google Scholar]
- Wang, Y.; Hu, C.; Zhou, W.; Li, X.; Zhu, B. River type and its cause of formation of the main stream of Tarim River. J. Sediment Res. 2002, 6, 19–25. [Google Scholar] [CrossRef]
- Gao, X.; Fang, G.; Chen, Y.; Zhang, X. Analysis of runoff variations in an arid catchment based on multi-model ensemble-a case study in the Tarim River Basin in Central Asia. Front. Earth Sci. 2023, 11, 1249107. [Google Scholar] [CrossRef]
- Chen, Y.; Li, W.; Chen, Y.; Liu, J.; He, B. Ecological effect of synthesized governing in Tarim River valley. J. China Environ. Sci. 2007, 27, 24–28. [Google Scholar]
- Chen, Y.; Li, W.; Xu, C.; Hao, X. Effects of climate change on water resources in Tarim River Basin, Northwest China. J. Environ. Sci. 2007, 19, 488–493. [Google Scholar] [CrossRef]
- Zhang, Y.; Guo, Q.; Qi, W.; Wang, X. Study on the influence of embankment construction on water and sediment transport in the main stream of Tarim River. J. Sediment Res. 2015, 4, 52–58. [Google Scholar]
- Bizzi, S.; Demarchi, L.; Grabowski, R.C.; Weissteiner, C.J.; Van de Bund, W.J.A.S. The use of remote sensing to characterise hydromorphological properties of European rivers. Aquat. Sci. 2016, 78, 57–70. [Google Scholar] [CrossRef]
- Legleiter, C.J.; Roberts, D.A.; Lawrence, R.L. Lawrence. Spectrally based remote sensing of river bathymetry. Earth Surf. Process. Landf. 2009, 34, 1039–1059. [Google Scholar] [CrossRef]
- Nicoll, T.J.; Hickin, E.J. Planform geometry and channel migration of confined meandering rivers on the Canadian prairies. Geomorphology 2010, 116, 37–47. [Google Scholar] [CrossRef]
- Yao, Z.; Xiao, J.; Ta, W.; Jia, X. Planform channel dynamics along the Ningxia-Inner Mongolia reaches of the Yellow River from 1958 to 2008: Analysis using Landsat images and topographic maps. Environ. Earth Sci. 2013, 70, 97–106. [Google Scholar] [CrossRef]
- Gurnell, A.M. Channel change on the River Dee meanders, 1946–1992, from the analysis of air photographs. Regul. Rivers 1997, 13, 13–26. [Google Scholar] [CrossRef]
- Parizi, E.; Khojeh, S.; Hosseini, S.M.; Moghadam, Y.J. Application of Unmanned Aerial Vehicle DEM in flood modeling and comparison with global DEMs: Case study of Atrak River Basin, Iran. J. Environ. Manag. 2022, 317, 115492. [Google Scholar] [CrossRef] [PubMed]
- Deng, S.Y. Analysis for the characteristics of sediment in Tarim river. Appl. Mech. Mater. 2014, 641, 25–28. [Google Scholar] [CrossRef]
- Hana, S. Analysis of visual interpretation of satellite data. Int. Arch. Photogramm. Remote Sens. Spat. Inf. Sci. 2016, 41, 675–681. [Google Scholar]
- Bathurst, J.C.; Hey, R.D.; Thorne, C.R. Secondary flow and shear stress at river bends. J. Hydraul. Div. 1979, 105, 1277–1295. [Google Scholar] [CrossRef]
- He, X.; Yu, M.; Wang, K.; Liu, Y. Propagation of the effect of upstream bend circulations to downstream flow and sediment transport in consecutive river bends. J. Hydrol. 2025, 660, 133358. [Google Scholar] [CrossRef]
- Tang, X.; Knight, D.W. The lateral distribution of depth-averaged velocity in a channel flow bend. J. Hydro-Environ. Res. 2015, 9, 532–541. [Google Scholar] [CrossRef]
- People’s Government of Xinjiang Uygur Autonomous Region. Report on Recent Comprehensive Control Planning of Tarim River Basin; China Water & Power Press: Beijing, China, 2001.
Disclaimer/Publisher’s Note: The statements, opinions and data contained in all publications are solely those of the individual author(s) and contributor(s) and not of MDPI and/or the editor(s). MDPI and/or the editor(s) disclaim responsibility for any injury to people or property resulting from any ideas, methods, instructions or products referred to in the content. |
© 2025 by the authors. Licensee MDPI, Basel, Switzerland. This article is an open access article distributed under the terms and conditions of the Creative Commons Attribution (CC BY) license (https://creativecommons.org/licenses/by/4.0/).