Featured Application
The outcome of this work can be implemented as an analytics framework within a digital twin environment in the manufacturing sector.
Abstract
The latest research highlights the need for circularity in modern industrial supply chains, which is reflected in the decisions of European and global policymakers, as well as in the strategies of major stakeholders. Digital Twins are considered a principal catalyst in the transition to circularity, while real-world, accurate and timely data is a key factor in these supply chains. This emphasis on data highlights the central role of data analytics in extracting key insights and utilizing machine learning to propose sustainability initiatives in decentralized production ecosystems. In consequence, commercial solutions are being developed; however, a single solution might not address all requirements. In this work we present a comprehensive modular, scalable and secure analytics architecture, designed to expand the available components in commercial solutions by providing an intelligent layer to Digital Twins. Our approach integrates with the latest standards for international data spaces, interoperability and process models in distributed environments where multiple actors engage in co-opetition. The proposed architecture is implemented in a market-ready solution and demonstrated in two case studies, in Spain and in Greece. Validation results confirm that the analytics service delivers accurate, timely and actionable insights, while following open communication standards and sustainability guidelines. Our research indicates that companies implementing digital twin solutions using standardized connectors for interoperability can benefit by customizing the proposed solution and avoiding complex developments from scratch.
1. Introduction
The notion of circular economy [1] appears as a potential solution to the need for transitioning to more sustainable systems in order to address environmental problems, geopolitical risks, society expectations and economic challenges. To this direction, multiple legislative approaches has been proposed by policymakers globally (for example, in the European Union [2] and in China [3]).
Adopting a circular economy can help mitigate these pressing issues while creating new paths for economic growth. A key approach to increasing circularity is embracing the Three R’s: Reduce, Reuse, and Recycle. The transition toward circularity presents a significant economic opportunity, particularly through the implementation of digitalization tools. These technologies enable companies to measure, track, and optimize circularity within their processes, ensuring more efficient resource utilization.
In this context, Digital Twins have emerged as a fundamental tool in Industry 4.0, enabling real-time monitoring and optimization of industrial operations by integrating IoT devices, cloud computing, and AI-driven analytics; Digital Twins provide real-time insights and predictive analytics. Their contribution to circularity includes extending product lifespans (e.g., predictive maintenance in manufacturing), optimizing material use and recycling (e.g., tracking rare-earth metals in electronic devices), reducing waste in production processes, enhancing energy efficiency, and closing the loop in supply chains (e.g., monitoring end-of-life products for reuse or recycling).
Digital twins trace their origins to NASA’s Apollo program, where they were developed as a means to remotely monitor key spacecraft systems. These physical models enabled engineers to predict and address potential issues in real-time [4]. In 2002, the concept was introduced into Product Lifecycle Management (PLM) as a virtual representation of physical assets spanning their entire lifecycle. The application of digital twins quickly expanded into various fields, including industry, health, and logistics [5].
The significance of digital twins grew alongside the Industry 4.0 revolution, driven by the explosion of data from diverse sources, such as logistics, manufacturing devices, and the Internet of Things (IoT). The proliferation of real-time data streams facilitated the development of digital twins that accurately represent physical systems. This new representation enabled the implementation of advanced analytics and artificial intelligence models within digital replicas, enhancing their capabilities and applications.
A key component of the Digital Twin system is an analytics service. As the digital twin can receive, process and store data streams from the real-world system, the analytics service is tasked with ingesting this data, cleaning, transforming, and making sense of it to generate actionable insights. The types of analysis can range from descriptive, to predictive and prescriptive while real-time data can be combined with historical or simulated data to provide a full understanding of the environment. The part of the digital twin that handles the analytics belongs to the core of the system, and its output is provided back to the digital twin platform and to the stakeholders, where it can be utilized as a basis for strategic, operational and tactical level decision-making.
To implement these systems in a modular, extensible and scalable way, multiple paradigms, standards and frameworks have been put forward. An independent microservices architecture is generally preferred to a monolith approach, in order to better support resilience, and stack-agnostic, contract-based integration. To the same direction, containerized deployments seem to help with the flexibility and portability of deployments, notwithstanding the increased overhead of container management and orchestration. To guarantee secure, transparent and interoperable data exchange, the data spaces protocol has been generally proposed. Moreover, on the field of data models, ontologies and semantic approaches tend to be promoted in tandem with established standards for easy adoption.
The paper is organized as follows: Section 2 presents the ecosystem of technologies supporting digital twins, along with common applications. Section 3 describes the guiding principles for developing the proposed framework, and outlines the proposed solution, highlighting its strengths and limitations. Section 4 details two use cases implemented in different countries. Finally, Section 5 presents the conclusions, including preliminary evaluation results.
2. Theoretical Background
Analytics in the industry has lately gained a lot of attention, not only in the context of circularity and sustainability, but also with the explosion [6] of the amount of data collected across the supply chains using sensors and simulation data. In this Section, we present the digital twin approaches, including a historical overview; we describe the common analytical methods that are encountered in the literature; and we also provide a high-level overview of the application domains and indicative use cases.
2.1. Digital Twin Approaches
Despite their widespread adoption, digital twins are often ambiguously defined and can vary in functionality and integration levels. The first standardized definition comes from Kritzinger who categorized them as Digital Model, Digital Shadow, and Digital Twin, depending on the extent of data integration, where the digital model only contains information from the physical, the digital shadow includes real-time data and the digital twin, in addition, can provide real-time feedback to the physical system [7]. DTs use real-time data to model the physical asset and analyze its status.
The rise of AI proved valuable to be incorporated in DTs to model physical assets and led to their improvement being renamed Cognitive Digital Twins (CDT). CDTs encapsulate AI models and services, allowing them to reason in specific situations, predict the impact of different scenarios, and adapt their behavior accordingly [8]. These predictions and adaptations can come from the incorporation of optimizers, recommender systems, anomaly detection models, or any other type of AI-based models. Thus, CDT can be used not only for monitoring but can also be part of the decision-making process.
In the context of supply chains where multiple actors exchange goods to manufacture a product, there is a collaboration between them. In the case of a collaborative scenario, different actors can agree to develop a CDT that exchanges the required information between them. In this form, the individual use of a CDT can be expanded into the concept of Supply Chain Cognitive Digital Twin (SC-CDT). Thus, the SC-CDT is a network of interrelated CDTs involving all actors and assets. The SC-CDT governance framework encompasses business collaboration terms, data, and AI models at the CDT level, with sustainability being a crucial factor driving decisions [9].
2.2. Analytics Methods
In contexts where digital twins are most applicable, different machine learning and computational techniques have been proposed, ranging from supervised, unsupervised and reinforcement. Some of them have been more thoroughly researched and can provide a basis for a comprehensive analytics framework for Digital Twin implementations.
Association rules (ARs) are a commonly used technique also found in industrial settings. For example, in [10] a rule-based ML process is designed, applied and evaluated in an automotive industry, where firstly the prevalent and important anomaly class is identified, association rules and network analysis are employed to understand its effects to the overall equipment effectiveness (OEE), and a Deming Cycle is used as for its application and evaluation.
Multi-agent systems represent an AI technique utilizing intelligent agents that interact with each other to execute specific tasks, such as handling large amounts of factory data. Such systems are evaluated for anomaly detection [11], where they join forces with the potential of ML, enabling them to reach critical solutions in the applications of industry 4.0. A demonstrated paradigm is multi-agent learning, where multiple learning agents adapt and adjust their behavior to the environment [12].
A review [13] of 78 papers in 2024, identified a significant number of efforts for implementing anomaly detection in various advanced industry fields, with the most prominent being smart manufacturing, energy forecasting and health monitoring. Autoencoders and convolutional neural networks, and combinations of the two were prominently represented in the research efforts. Autoencoders tend to fail when reconstructing an anomaly, so when they are given anomalous data inputs, they produce reconstruction errors. Therefore, a reconstruction error that exceeds a given threshold can be used as an indicator that given data represent an anomaly. Variational Autoencoders (VAE) have been also proposed [14], which map inputs to distributions rather than fixed points in the latent space, allowing them to model uncertainty and improve robustness in cases where the data may have overlapping distributions.
There is a transformative potential of deep learning methodologies since features learning can happen faster and without the need for manual feature engineering. However, it should be noted that given the fast evolution of the analytics landscape, and the breakthroughs achieved in areas, such as LLMs (Large Language Models), an analytics system for digital twin integration should be open to extensions and to utilization of evolving methodologies.
2.3. Applications
The AI and ML methods mentioned in the previous Section have found applications in multiple fields where, in conjunction with Digital Twin, they can make a difference. These fields include, but they are not limited to, asset health, fault detection, energy and supply chain optimization.
Assisted evaluation of asset health is crucial across various systems and applications. In the construction sector, buildings often have lifespans exceeding 50 years, and based on a Digital Twin using Building Information Modeling (BIM) with building data, analytics can detect health problems in components like pumps [15]. For oil companies, real-time monitoring and analytics is essential in asset management due to fluctuating prices. Analytics can provide critical insights into the status and condition of their static and rotating equipment [16]. Additionally, asset monitoring can extend turbine lifespans by predicting blade failures using system data, which is vital in harsh environments where defects are prevalent [17].
Another field with similar applications is that of Real-Time Fault Detection and Diagnosis, where machine learning is evaluated. Promising research is notably focusing on Future Fault Detection and Diagnosis (FDD), better refined techniques for unbalanced datasets and temporal series data, and implementations of Explainable Artificial Intelligence (XAI) tailored to industrial fault detection for enhancing interpretability and trustworthiness. [18]
As described in [19], Smart Grid is another field of high importance where common applications of analytics include fault classification and identification, which involves detecting, classifying, and localizing faults in microgrids, ensuring the protection of loads from voltage and frequency fluctuations. Additionally, in preventive maintenance machine learning techniques, such as SVM, LSTM, and hybrid models, are used to analyze operations data and diagnostics data to predict equipment failures.
In supply chain optimization, multiple data sources can become available for analytics and optimization, including customer, shipping, delivery, order, sale, store, and product data [20]. These data sources offer multiple applications in scheduling, inventory management, and demand forecasting. Techniques, such as neural networks and regression analysis, are frequently used, along with time-series forecasting, clustering, and support vector machines [21]. The implementation of AI techniques in supply chain management is estimated to reduce costs by 10 to 25% across various aspects [22].
3. Digital Twin Analytics Framework
3.1. Design Principles
In this Section, the Digital Twin Analytics Framework will be introduced. This platform is designed to provide a generic and interoperable solution for integrating advanced analytics with Digital Twins. It supports portable and platform-agnostic deployment, enabling user-centric iterations to enrich operational capabilities and facilitate secure data exchange between industrial partners, service providers and authorities. The framework’s design incorporates key principles that are crucial for its scalability, security and ease of integration with Digital Twins.
3.1.1. Secure and Interoperable Data Exchange
The proposed framework is part of an extended digital twin ecosystem, that can connect multiple organizations, giving special attention in terms of both security and interoperability. To support this direction, we incorporate data space technology, supported by a dedicated Data Space Connector component. This component is designed to support data exchange negotiations, as promoted by various initiatives of the European Commission (e.g., Simpl [23]) and the International Data Spaces Association [24]. Regarding the data representation, we follow the approach of semantic aspect meta models [25], which allows both precise definitions and flexible, highly compatible standards.
In terms of data exchange, the data spaces approach has been followed, which requires a negotiation process between the data producer and data consumer. This process involves the use of Open Digital Rights Language (ODRL), to establish contracts between the parties, which define the policies (permissions, duties and prohibitions) that need to be followed for every data point. For this integration, the Eclipse Data Space Components infrastructure has been used as a foundation.
In terms of data modeling, a metamodel approach has been employed, where a detailed dictionary is used to generate specific models, depending on the parties that need to exchange information. Semantic aspect meta models introduce the notion of aspects that represent services that provide data about an asset that is represented by a Digital Twin. This approach is compatible with the Asset Administration Shell (AAS), allows for common data transport (HTTP or MQTT), and can be used to support standardized short messages (e.g., JSON) for quick set up and lean information exchange between components.
3.1.2. Portable Platform-Agnostic Universal Deployment
To ensure the adaptability and ease of deployment of the proposed framework, every component of the system is individually containerized. The framework’s modular architecture ensures each component serves a specific functionality, enabling system portability and scalability. Each component is started as a separate container using its own image, defined in a configuration file, which includes all necessary dependencies, configurations, and environment variables required for operation. These images can be deployed independently on different machines or together on the same virtual machine, offering versatility in resource distribution and deployment strategies. Every image contains the code and logic for the specific application or service it hosts, enabling isolated and efficient execution. A potential integration with an orchestration platform can further promote scalability and manageability, allowing for automated deployment, scaling, and traffic management across diverse environments. This design also ensures compatibility with various hosting providers and infrastructure models, making the system universally deployable while maintaining high performance and adaptability.
3.1.3. User-Centric Interface Design and Role-Based Interaction
The effective interaction between the framework and the human in charge is very important for successful adoption within industrial environments. The inclusion of interconnected components should not be overwhelming for the users of existing digital twin services in organizations. For that, dedicated User Interfaces (UIs) allow users to manage their actions and their data, monitoring every process that is connected with their digital twin and the framework. These interfaces prioritize the user perspective and actively seek and receive feedback from different users.
Users within the same organization can be categorized as data providers and consumers. Administrators can define and manage various data sources that ingest data either directly from different organization processes or from the digital twin. Factory users can visualize historical data, perform statistical analysis, and use AI-based inferences, such as forecasting and anomaly detection. These insights enable the users of the framework to reach data-driven actions and evaluate or update their methodologies, potentially leading to maintenance scheduling, process optimization, or strategic decision-making, to enhance operational efficiency.
3.2. Conceptual Architecture
The proposed analytics architecture, as a specialized extension of the architecture proposed in [6], comprises a digital twin-attached, independent service with potential integrations to external service providers and overseeing authorities (Figure 1). The service incorporates the main stages of data processing, including data ingestion from the twins of the organizations, the transformation, harmonization and standardization of data, the generation of data catalogue, and the generation of insights in the form of descriptive, predictive and prescriptive analytics. The connectivity between the service and the digital twin, as well as stakeholders and authorities, can be compatible with the international data spaces standard [24], allowing for interoperable and secure connections.
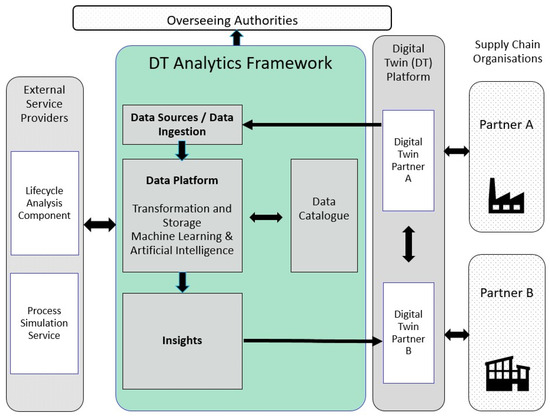
Figure 1.
Digital Twin Analytics in a Supply Chain Ecosystem.
This service can provide a portable, compatible and extensible intelligent layer for the digital twin.
3.3. Integration with Lifecycle Analysis and Process Model Simulators
The framework is designed as an extensible system that enables integration with other services that provide additional value. Two services, the Lifecycle Assessment (LCA) and the Process Model Simulator (PSM), have been integrated with the system, showcasing the framework’s ability to enrich core Digital Twin data with advanced analytics, insights and KPIs.
The lifecycle assessment (LCA) component is an external service that calculates on demand the environmental footprint of all different processes in the production pipeline, given the specific parameters of the production (for example the weight of oranges that are given as input). The footprint is a complex calculation that requires knowledge of the specific domain and information about the factory’s infrastructure, the processes and the machines that are used. The analytics system utilizes LCA services by using their API endpoints.
The analytics system is internally integrated with Process Simulation Tools (PSM). These tools are essential for the system because of their capability of simulating all of the processes in the production pipeline. These tools have modelled every process and component inside the factory, by analyzing them and documenting every characteristic. The analytics system is integrated with these tools and utilizes them when an anomaly is detected or when it is necessary for the engineers of the factory to change a production parameter in the process.
By simulating every potential new parameter in the production machines, analyzing the simulation results, the energy consumption and the environmental footprint, production engineers are enabled to make the best decision for an optimized and sustainable factory process pipeline. This extensibility allows industrial users to leverage both framework and external services to maximize the value from their investments in Digital Twin software technologies and installations, as evaluated in the solution developed during the Plooto project (https://www.plooto-project.eu/).
A complete overview of the proposed conceptual architecture, including external services can be found in Figure 2. The proposed analytics framework supports the entire insights lifecycle, encompassing data ingestion, transformation, and insight generation through notifications and visualizations.
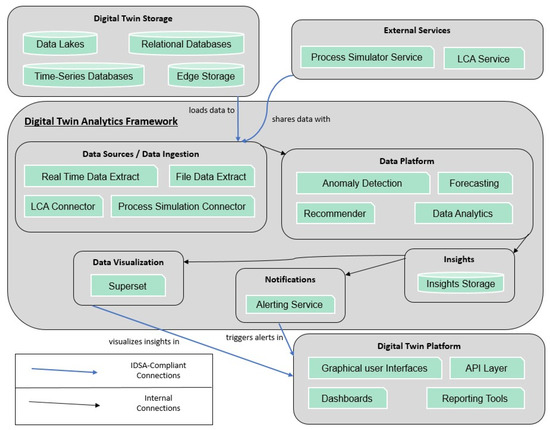
Figure 2.
Conceptual architecture of framework’s components and communication with digital twins and external services.
3.4. Data Models
The efficiency of the analytics system to deliver actionable insights about every factory process and empower engineers with a tool to make decisions and actions is based on its robust and well-defined data models. These models enable the processes of organizing, storing and analyzing complex data generated throughout the production lifecycle.
Figure 3 presents the Entity–Relationship Diagram (ERD) showcasing the core data models and their relationships within the Digital Twin Analytics Framework. These models are vital for the framework as they empower it to achieve interoperability across digital twin instances and flexibility. Each entity is defined by a Primary key (PK) that is a unique identifier of the record. Foreign keys (FK) are also included, and their purpose is to link records in one table to records in another.
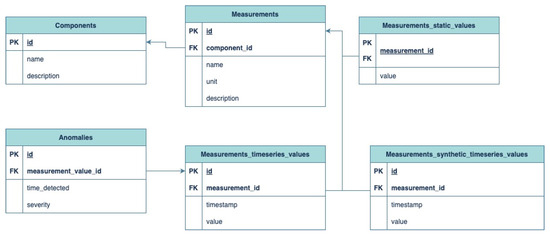
Figure 3.
Framework Entity–Relationship Diagram.
The data models that are presented in Figure 3, are designed to handle all types of manufacturing data and to model the processes in the factory. The following are the specific data model types:
Components: This data model captures information about physical components within the factory. Its attributes are the id, which is the unique identifier, the name of the component (for example Decanter) and the description of the component (for example Decanter separates solid impurities from liquid molasses). A component can be related with multiple measurements.
Measurements: This entity is responsible for all measurable parameters and values that are associated with the components. In the attributes are included the id, the component_id, which is the foreign key to components, the name (for example Molasses pH), the description and the measurement unit.
Measurements_static_values: This data model stores the stable measurement values that do not change over time. It is linked to the measurement and contains the current value.
Measurements_timeseries_values: This entity stores the dynamic, time series values of measurements. Its attributes contain the id, the measurement_id, which is the related measurement, the value and the timestamp when the value is measured.
Measurements_synthetic_timeseries_values: This table models the generated timeseries values for measurements. These values are synthetic, created by the analytics system for potential evaluation and testing purposes.
Anomalies: This table contains the anomalies that the analytics system detected and their severity. It contains the id of the anomaly and the measurement value id, which is classified as an anomaly and the time that is detected. The severity can be low, medium or high.
4. Case Studies
4.1. Pilot Descriptions/Demonstration
4.1.1. Greek Pilot
The analytics service as described in Section 3, is applied to a Greek manufacturing factory that produces orange juice and other related products. This factory operates a production pipeline that integrates various components, each responsible for processes that are essential to its diverse product line. Their basis of their production pipeline is oranges, lime and water. A complex process is followed to efficiently transform raw materials into multiple valuable products, including pellets, orange juice, oil, molasses, and sludge, utilizing multiple processing components. The main goal of the factory is to maximize the utilization of oranges as raw materials, promote data-driven decision making and establishing optimal and environmental-friendly processes.
Upon detailed analysis of the production components, the decanter has been identified as a critical area requiring further investigation and optimization. The decanter plays a key role in the orange juice production process that separates solid waste (sludge) from the liquid, which is further processed to create molasses. This component stands out due to its high energy consumption, presenting a significant opportunity for efficiency improvements.
The measurements regarding molasses in the input of the decanter, can support insight regarding the subsequent steps—for example:
Molasses pH: Measures the acidity or alkalinity of the molasses and having a stable and correct pH is vital for molasses stability and spoilage prevention.
Molasses Soluble Solids Brix: Measured in degrees Brix (°Bx), this indicates the concentration of dissolved solids, primarily sugars, in the molasses and can affect the performance of the decanter.
Molasses Sediment Pulp %: Represents the percentage of insoluble solid particles, such as fruit pulp and fiber. By keeping sediment pulp in a low percentage, is crucial for product clarity and for preventing equipment failures.
By integrating in the digital twin of the factory, real-time data from decanter and molasses products become accessible in the data analytics platform, where algorithms continuously monitor and analyze the production process for anomalies.
For example, the system can detect an unusually high value in the molasses sediment pulp, indicating a potential production anomaly. This can trigger a notification to the factory’s production engineers, alerting them to the issue and prompting immediate action. With this information, the production engineer can use the platform’s process simulation and modeling tool to experiment with different production parameters.
Moreover, the analytics dashboard can provide a comprehensive view of historical production and environmental data, including the previous and current measurements, and carbon footprints enabling the comparison of different, real and simulated, production parameters.
4.1.2. Spanish Pilot
The analytics service applied in Spain focuses on recovering and recycling End-Of-Life (EOL) Permanent Magnets (PMs) from Waste Electronic and Electric Equipment (WEEE). It has three organizations covering different steps from the recovering, recycling and manufacturing of magnets. Together, they cover different steps in a supply chain that requires the exchange of information in order to optimize their production, analyze their costs and be aware of the materials that they will receive. On the supply chain scale, the first organization is a recycling company that receives the home appliances collected at recycling points in Spain. They process each appliance based on the current European regulations, dismantling harmful components and recovering recycling materials. Within these materials, they extract magnets that otherwise will be mixed with scrap metals and sent to melt. These recovered magnets are sent to a lab specialized in magnet processing and capable of recycling sintered magnets. The magnets are analyzed, processed and transformed into magnetic pellets that can be injected into new magnets by a magnet producer. Finally, there is a magnet producer that can manufacture new magnets and internally recover scraps from their production.
It is estimated that each year, 30–50 million tons of Waste Electrical and Electronic Equipment (WEEE) is produced. This waste contains a significant amount of end-of-life (EOL) magnets, which are often not recovered and are mixed with other metallic recycling streams. Due to the presence of rare-earth elements in these magnets, the European Commission has emphasized the importance of recovering EOL magnets [26]. This importance is expected to grow as the first large wind turbines and mass-produced electric cars reach the end of their operational life.
PMs can be divided into two main groups: those based on Ferrite alloys and those based on Neodymium alloys. The demonstrator has focused its efforts on Ferrite magnets due to their more widespread use.
The objective of this pilot is to ensure that recycling end-of-life (EOL) magnets is a viable option, considering both the technical processes and economic viability. This can be achieved by sharing crucial data among key partners, enabling organizations to make data-driven decisions.
To meet this objective, the involved companies agreed to share information through an external digital twin service. This service provides data-sharing capabilities and includes the data-sharing agreement between the partners.
The analysis of the various processes at each organization identified three critical points in production that required the implementation of analytics. The first was the need to gather statistics about the types of magnets used in different waste items received by the recycling company. The second was to analyze whether all recycling steps were necessary. Finally, an estimation for the total energy consumed by the recycling process was provided.
The first point is crucial because magnets in home appliances represent a small fraction of the total device and extracting them can require significant time for minimal yield. Using historical data to estimate the probability of extracting a specific type of magnet from a given device helped the recycling company focus on relevant equipment.
The second critical area is the recycling process itself. The current lab-scale recycling process includes the following:
Crushing: The received end-of-life (EOL) magnets are crushed and transformed into powder.
Ball Milling: This process reduces the grain size of the magnetic powder to a few micrometers.
Thermal Treatment: The magnetic powder undergoes annealing, where it is heated and cooled at a controlled rate to modify its crystallographic structure and enhance magnetic properties.
Homogenizing: The magnetic powder is mixed with a polymer.
Extrusion: The mixture of magnetic powder and polymer is heated to form pellets.
Among these processes, milling and thermal treatment can enhance the magnetic properties of the final magnets but are time-consuming and energy intensive. In fact, the milling process is the main bottleneck, allowing for the processing of less than 100 g per day. Additionally, thermal treatment is critical since the total quantity of processed materials per day is still lower than 500 g. These processes are optional, as can be seen in Figure 4, but significantly impact the quality of the final product, as performing all of them improves magnetic properties.
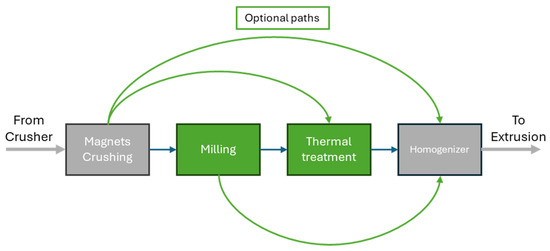
Figure 4.
Visualization of the possible paths in the Spanish Pilot. In this color convention, grey represents processes and links that are always performed, green processes and links are optional and blue links represent the set of processes generally performed.
4.2. Analytic Tools for Each Demonstrator
The analytics services and tools for the Greek pilot case are included in the main dashboard of the system and in some additional pages for specific actions from the users. The system is deployed and focusing on the Decanter component along with its measurements and metrics. Staff and engineers from the factory can access the main dashboard to monitor metrics and timeseries values that are related to the Molasses, the main substance that is processed inside the Decanter component.
The analytics dashboard provides a variety of charts to enable smooth monitoring and analysis. In addition, calculations, simulation results and footprints are presented to help users evaluate their processes. Production engineers and system administrators have more action privileges. Separate pages and dedicated views enable those actions to be performed, such as extracting data from various data sources into the analytics system database, creating synthetic data and forecasting future values for the measurements. A form is also available, to provide a useful interface to test and evaluate new production parameters, after an anomaly is detected or an environmental footprint improvement is required. Anomalies or critical system alerts can be enabled to inform authorized users and employees of the factory immediately.
After deploying the system, all of these tools are available for use along with some API endpoints to enable data integration with external platforms and services that may be requested. In Figure 5, a view with unified analytics can be seen.
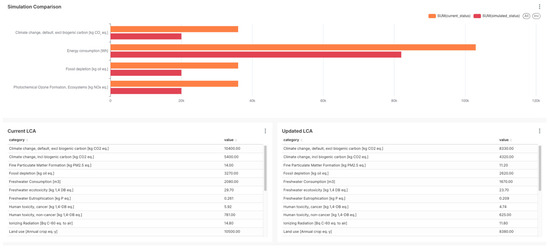
Figure 5.
Comparison results in the main dashboard after simulations using external services.
The analytics service for the Spanish pilot was enriched with two tools that use the data generated and improve the decision-making between the different possible paths in recycling. The first tool estimates the total energy consumed by the different recycling processes helping to compare the differences in the cost between processes. The objective was not to compute accurate values, but to give an estimation that could aid operators when deciding on manufacturing choices.
To achieve this, different process parameters from the available data sources were used, along with a catalogue of consumption data obtained from each machine’s datasheet. In this form, specific formulas are used to scale the energy consumed depending on the maximum performance provided by the manufacturers. This service runs on an API that updates the estimated energy upon request from the manufacturers.
For the magnetic properties, a set of ML regressors with different parameters was trained using manufacturing data, together with the magnetic properties after each process was performed. The three magnetic properties used as target values were magnetic saturation, remanence and coercivity. The trained algorithms were compared and the best model for each magnetic property was selected. Thus, by using the ML models, the magnet recycler can estimate beforehand how much the magnetic properties can vary depending on the combination of process parameters selected.
In this way, the magnets recycler has two simple tools that, when combined, function as a decision support system. While these tools do not make decisions, they help determine the energy required to recycle a batch of EOL magnets and predict their potential final magnetic properties. This information allows operators to decide whether to proceed with all possible manufacturing processes or to select a subset of processes for each batch, as can be seen in Figure 6.
4.3. Validation
The efficiency and the capabilities of the Digital Twin Analytics Framework were validated through its application and deployment to the industrial environments of the Greek and Spanish pilot factories. These deployments demonstrated how the framework addresses the limitations of the existing Digital Twin infrastructure by enabling interoperability, extensibility, and providing advanced data analytics and intelligence.
The framework is not designed to replace, but to expand the functionalities of the already installed Digital Twins in an industry. Thus, the primary validation is to expand the existing Digital Twins and present the new services and capabilities that are enabled.
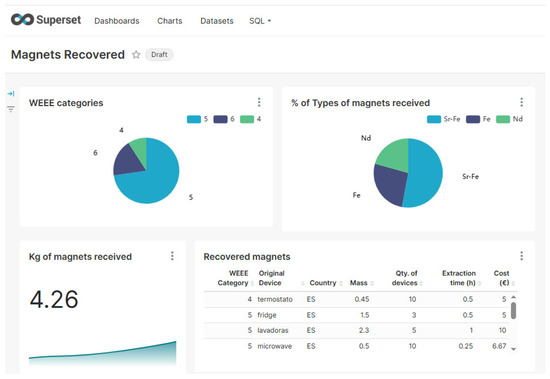
Figure 6.
Dashboard of the data generated from the recovered magnets in the Spanish pilot. As seen in the dashboard, manual data entry by operators can produce inconsistencies in the data.
More specifically, the framework’s successful integration provided the following:
- Enhanced data management capabilities: Beyond the basic data functionalities, the framework enabled more sophisticated data extraction, data transformation and secure data storage and data exchange.
- Intelligence: The framework integrates Machine Learning (ML) algorithms into industrial processes. This includes capabilities, such as real-time anomaly detection, data forecasting of operational parameters and future measurement’s values and recommender systems.
- Insights and decision-making support: The framework provides user interfaces for factory engineers and people in charge. These interfaces visualize real-time operational data by using interactive charts and dashboards, create post-analysis reports for every tracked component that Digital Twins contain, and receive alerts when action is needed. Additionally, forms that utilize external services are provided to enable users to simulate and evaluate new parameters and take better data-driven decisions.
The validation of the framework, therefore, is its proven ability to act as an intelligent layer. It transforms simple monitoring to advanced analytics and insights dashboards and interfaces. The successful deployment in both Greek and Spanish pilot environments serves as a proof-of-concept for the framework and its capabilities.
5. Discussion and Conclusions
In this work we presented a comprehensive, modular, scalable, and secure analytics framework architecture that can enhance Digital Twins by adding a cognitive layer, which transforms a Digital Twin into a Cognitive Digital Twin for a single or multi-tenant. This enables the extraction of key insights and the utilization of machine learning for circularity, sustainability and efficiency initiatives in complex production ecosystems. Our approach adheres to the standards for security and interoperability, supporting the principle of data sovereignty. It is important to note that our approach is not focused on the performance of specific analytics services, but on effectiveness of the analytics framework as a catalyst to support a Digital Twin solution.
We demonstrated the effectiveness of the proposed architecture in two case studies, one in Spain and another in Greece, demonstrating its ability to deliver accurate, timely, and actionable insights. Analytics in tandem with Digital Twins can provide significant support in achieving sustainability goals, aligning with the goals of sustainability, circularity and data protection.
Future research can focus on evaluating the accuracy and recall of specific algorithms in real-life environments, to further validate their usability in daily life. Additionally, the integration of emerging technologies can be assessed, such as LLM-based ML and edge computing, to further enhance the capabilities of an Analytics Service and Digital Twins in driving circularity.
Author Contributions
Conceptualization, V.X. and K.C.; methodology, K.C.; software, all; validation, all; formal analysis, V.X., J.M.G.C. and K.C.; investigation, V.X., J.M.G.C. and K.C.; resources, V.X., J.M.G.C. and K.C.; data curation, V.X., J.M.G.C. and K.C.; writing—original draft preparation, all; writing—review and editing, all; visualization, V.X., J.M.G.C. and K.C.; supervision, V.X., J.M.G.C. and K.C.; project administration, V.X., J.M.G.C. and K.C.; funding acquisition, B.M. and J.M.G.C. All authors have read and agreed to the published version of the manuscript.
Funding
This research was funded by the European Union’s Horizon 2020 research and innovation programme, for Plooto project under grant number 101092008. The APC was funded by the European Union’s Horizon 2020 research and innovation programme, for Plooto project under grant number 101092008.
Institutional Review Board Statement
Not applicable.
Informed Consent Statement
Not applicable.
Data Availability Statement
Restrictions apply to the availability of these data. Data were obtained from organisations that participated in pilot studies in Greece and in Spain, in the context of the Plooto project (Grant Number 101092008) and are available from the authors with the permission of the corresponding organisations.
Acknowledgments
We would like to acknowledge the contributions of all the technical partners that provided feedback on the Plooto deliverables “D2.3 Plooto complete suite of services V1” and “D2.4 Plooto complete suite of services V2”, as they provided valuable input in the development of the presented framework.
Conflicts of Interest
Authors V.X., B.M. and K.C. were employed by the company Frontier Innovations IKE. The remaining authors declare that the research was conducted in the absence of any commercial or financial relationships that could be construed as a potential conflict of interest.
Abbreviations
The following abbreviations are used in this manuscript:
| AAS | Asset Administration Shell |
| AI | Artificial Intelligence |
| API | Application Programming Interface |
| BIM | Building Information Modeling |
| CDT | Cognitive Digital Twin |
| DT | Digital Twin |
| EOL | End Of Life |
| FDD | Fault Detection and Diagnosis |
| FK | Foreign Key |
| HTTP | Hypertext Transfer Protocol |
| IoT | Internet of Things |
| JSON | JavaScript Object Notation |
| LCA | Lifecycle Assessment |
| LLM | Large Language Model |
| LSTM | Long Short-term Memory |
| ML | Machine Learning |
| MQTT | Message Queuing Telemetry Transport |
| ODRL | Open Digital Rights Language |
| OEE | Overall Equipment Effectiveness |
| PK | Primary Key |
| PLM | Product Lifecycle Management |
| PM | Permanent Magnets |
| SC-CDT | Supply Chain Cognitive Digital Twin |
| SVM | Support Vector Machine |
| UI | User Interface |
| VAE | Variational Autoencoders |
| WEEE | Waste Electronic and Electric Equipment |
| XAI | Explainable Artificial Intelligence |
References
- Geissdoerfer, M.; Savaget, P.; Bocken, N.M.P.; Hultink, E.J. The Circular Economy—A new sustainability paradigm? J. Clean. Prod. 2017, 143, 757–768. [Google Scholar] [CrossRef]
- Act: Communication from the Commission to the European Parliament. The European Green Deal. Available online: https://eur-lex.europa.eu/legal-content/EN/TXT/?uri=CELEX:52019DC0640 (accessed on 29 April 2025).
- Zhu, J.; Fan, C.; Shi, H.; Shi, L. Efforts for a Circular Economy in China: A Comprehensive Review of Policies. J. Ind. Ecol. 2019, 23, 110–118. [Google Scholar] [CrossRef]
- Bonney, M.S.; Wagg, D. Historical Perspective of the Development of Digital Twins. In Special Topics in Structural Dynamics & Experimental Techniques; Conference Proceedings of the Society for Experimental Mechanics Series; Springer Nature: Berlin, Germany, 2022; Volume 5. [Google Scholar]
- Grieves, M.; Vickers, J. Origins of the digital twin concept. Fla Inst. Technol. 2016, 8, 3–20. [Google Scholar]
- Gröger, C. Industrial analytics—An overview. It–Inf. Technol. 2022, 64, 55–65. [Google Scholar] [CrossRef]
- Kritzinger, W.; Karner, M.; Traar, G.; Hejnes, J.; Sihn, W. Digital twin in manufacturing: A categorical literature review and classification. IFAC-Pap. 2018, 51, 1016–1022. [Google Scholar] [CrossRef]
- Kalaboukas, K.; Rožanec, J.; Košmerlj, A.; Kiritsis, D.; Arampatzis, G. Implementation of Cognitive Digital Twins in Connected and Agile Supply Networks—An Operational Model. Appl. Sci. 2021, 11, 4103. [Google Scholar] [CrossRef]
- Kalaboukas, K.; Kiritsis, D.; Arampatzis, G. Governance framework for autonomous and cognitive digital twins in agile supply chains. Comput. Ind. 2023, 146, 103857. [Google Scholar] [CrossRef]
- Lucantoni, L.; Antomarioni, S.; Ciarapica, F.E.; Bevilacqua, M. A rule-based machine learning methodology for the proactive improvement of OEE: A real case study. Int. J. Qual. Amp. Reliab. Manag. 2023, 41, 1356–1376. [Google Scholar] [CrossRef]
- García, N.M. Multi-agent system for anomaly detection in Industry 4.0 using Machine Learning techniques. ADCAIJ Adv. Distrib. Comput. Artif. Intell. J. 2019, 8, 33. [Google Scholar]
- Hernandez-Leal, P.; Kartal, B.; Taylor, M.E. A survey and critique of multiagent deep reinforcement learning. Auton. Agents Multi-Agent. Syst. 2019, 33, 750–797. [Google Scholar] [CrossRef]
- Liso, A.; Cardellicchio, A.; Patruno, C.; Nitti, M.; Ardino, P.; Stella, E.; Renò, V. A Review of Deep Learning-Based Anomaly Detection Strategies in Industry 4.0 Focused on Application Fields, Sensing Equipment, and Algorithms. IEEE Access 2024, 12, 93911–93923. [Google Scholar] [CrossRef]
- Chen, Z.; Li, Z.; Huang, J.; Liu, S.; Long, H. An effective method for anomaly detection in industrial Internet of Things using XGBoost and LSTM. Sci. Rep. 2024, 14, 23969. [Google Scholar] [CrossRef] [PubMed]
- Lu, Q.; Xie, X.; Parlikad, A.K.; Schooling, J.M. Digital twin-enabled anomaly detection for built asset monitoring in operation and maintenance. Autom. Constr. 2020, 118, 103277. [Google Scholar] [CrossRef]
- Iluore, O.E.; Onose, A.M.; Emetere, M. Development of asset management model using real-time equipment monitoring (RTEM): Case study of an industrial company. Cogent. Bus. Manag. 2020, 7, 1763649. [Google Scholar] [CrossRef]
- Kong, K.; Dyer, K.; Payne, C.; Hamerton, I.; Weaver, P.M. Progress and Trends in Damage Detection Methods, Maintenance, and Data-driven Monitoring of Wind Turbine Blades—A Review. Renew. Energy Focus. 2023, 44, 390–412. [Google Scholar] [CrossRef]
- Leite, D.; Andrade, E.; Rativa, D.; Maciel, A.M.A. Fault Detection and Diagnosis in Industry 4.0: A Review on Challenges and Opportunities. Sensors 2025, 25, 60. [Google Scholar] [CrossRef] [PubMed]
- Syed, D.; Zainab, A.; Ghrayeb, A.; Refaat, S.S.; Abu-Rub, H.; Bouhali, O. Smart Grid Big Data Analytics: Survey of Technologies, Techniques, and Applications. IEEE Access 2021, 9, 59564–59585. [Google Scholar] [CrossRef]
- Constante, F.; Silva, F.; Pereira, A. DataCo Smart supply chain for big data analysis. Mendeley Data. 2019. Available online: https://data.mendeley.com/datasets/8gx2fvg2k6/5 (accessed on 29 April 2025).
- Seyedan, M.; Mafakheri, F. Predictive big data analytics for supply chain demand forecasting: Methods, applications, and research opportunities. J. Big Data. 2020, 7, 1–22. [Google Scholar] [CrossRef]
- Nweje, U.; Taiwo, M. Leveraging Artificial Intelligence for predictive supply chain management, focus on how AI- driven tools are revolutionizing demand forecasting and inventory optimization. Int. J. Sci. Res. Arch. 2025, 14, 230–250. [Google Scholar] [CrossRef]
- Home | Simpl Programme. Available online: https://simpl-programme.ec.europa.eu/ (accessed on 29 April 2025).
- Home [Internet]. International Data Spaces. Available online: https://internationaldataspaces.org/ (accessed on 29 April 2025).
- Semantic Aspect Meta Model (SAMM): Bosch Semantic Stack Documentation. Available online: https://docs.bosch-semantic-stack.com/oss/samm-specification.html (accessed on 29 April 2025).
- Lixandru, A.; Venkatesan, P.; Jönsson, C.; Poenaru, I.; Hall, B.; Yang, Y.; Walton, A.; Güth, K.; Gauß, P.; Gutfleisch, O. Identification and recovery of rare-earth permanent magnets from waste electrical and electronic equipment. Waste Manag. 2017, 68, 482–489. [Google Scholar] [CrossRef] [PubMed]
Disclaimer/Publisher’s Note: The statements, opinions and data contained in all publications are solely those of the individual author(s) and contributor(s) and not of MDPI and/or the editor(s). MDPI and/or the editor(s) disclaim responsibility for any injury to people or property resulting from any ideas, methods, instructions or products referred to in the content. |
© 2025 by the authors. Licensee MDPI, Basel, Switzerland. This article is an open access article distributed under the terms and conditions of the Creative Commons Attribution (CC BY) license (https://creativecommons.org/licenses/by/4.0/).