Article

Integrating Financial Knowledge for Explainable Stock Market Sentiment Analysis via Query-Guided Attention

by
Chuanyang Hong
1 and
Qingyun He
2,*
1
School of Computing and Artificial Intelligence, Southwestern University of Finance and Economics, Chengdu 611130, China
2
School of Finance and Economics, Anhui Science and Technology University, Bengbu 233030, China
*
Author to whom correspondence should be addressed.
Appl. Sci. 2025, 15(12), 6893; https://doi.org/10.3390/app15126893
Submission received: 16 May 2025 / Revised: 10 June 2025 / Accepted: 12 June 2025 / Published: 18 June 2025
(This article belongs to the Special Issue Explainable Artificial Intelligence Technology and Its Applications)

Abstract

:
Sentiment analysis is widely applied in the financial domain. However, financial documents, particularly those concerning the stock market, often contain complex and often ambiguous information, and their conclusions frequently deviate from actual market fluctuations. Thus, in comparison to sentiment polarity, financial analysts are primarily concerned with understanding the underlying rationale behind an article’s judgment. Therefore, providing an explainable foundation in a document classification model has become a critical focus in the financial sentiment analysis field. In this study, we propose a novel approach integrating financial domain knowledge within a hierarchical BERT-GRU model via a Query-Guided Dual Attention (QGDA) mechanism. Driven by domain-specific queries derived from securities knowledge, QGDA directs attention to text segments relevant to financial concepts, offering interpretable concept-level explanations for sentiment predictions and revealing the ’why’ behind a judgment. Crucially, this explainability is validated by designing diverse query categories. Utilizing attention weights to identify dominant query categories for each document, a case study demonstrates that predictions guided by these dominant categories exhibit statistically significant higher consistency with actual stock market fluctuations (p-value = 0.0368). This approach not only confirms the utility of the provided explanations but also identifies which conceptual drivers are more indicative of market movements. While prioritizing interpretability, the proposed model also achieves a 2.3% F1 score improvement over baselines, uniquely offering both competitive performance and structured, domain-specific explainability. This provides a valuable tool for analysts seeking deeper and more transparent insights into market-related texts.

1. Introduction

With the flourishing popularity of social media, researchers are striving to create innovative financial applications that leverage the substantial volume of news and reviews. An essential aspect of these endeavors involves applying sentiment analysis (SA) to assess the impact of sentiment on stock market fluctuations. Numerous instances illustrate the impact of social media reviews on the movement of stocks [1]. Remarkably, a single comment or retweet from a prominent internet figure can lead to significant fluctuations in a listed company’s stock price within days, prompting public responses to counteract adverse social media sentiment.
Consequently, sentiment analysis has become increasingly important in the financial domain following seminal work that explored the asymmetric and affective effects of news on financial market volatility [2]. Different forms of textual information, ranging from news articles and tweets to commentaries and corporate disclosures, have been applied in various financial research studies.
However, unlike sentiment analysis in other fields [3], the goal of sentiment analysis in the financial field is more complex. To establish a robust foundation for market prediction models, analysts not only aim to extract sentiment polarity from texts but also to comprehend the underlying rationale behind an article’s judgment. They are interested in identifying the specific financial concepts or arguments that drive the sentiment, which can act as confidence indicators that either reflect subjective human judgments or correlate with objective market movements.
Indeed, predicting the price of a chaotic system such as the stock market is inherently challenging, especially in the short term. Analysis of financial media commentaries related to securities drawn from a real-world dataset covering the past two decades has revealed that the consistency between media recommendations and subsequent stock price movements is less than one-third. Hence, even experienced securities analysts who devote considerable time to analyzing diverse financial news and social media comments often treat such commentary as referential opinions rather than absolute truths. Specifically, the arguments presented within these comments and the financial reasoning they embody hold more value than the summarized conclusions.
Thus, the value of SA in the financial domain goes beyond merely providing highly accurate sentiment classification outcomes [4]; it critically includes the capability to offer interpretable concept-level explanations that reveal the ’why’ behind a judgment, supporting the overall sentiment direction of documents. This aspect is crucial for financial analysts, who often rely on such analyses to streamline the process of identifying sentiment trends in content related to securities. It also provides them with a structured and domain-specific foundational rationale for their evaluations. Consequently, the credibility of outcomes from the sentiment analysis model is substantially increased, particularly when the model is pivotal in financial decision-making processes.
For the purpose of enhancing the explainability of sentiment classification models in the financial domain, this study proposes a novel approach that integrates financial domain knowledge into a hierarchical model. Inspired by the foundational BERT [5] model and the hierarchical attention structure involving word- and sentence-level queries as described in FISHQA [6], this work introduces a Query-Guided Dual Attention (QGDA) mechanism within a hierarchical BERT-GRU architecture. Unlike traditional BERT models commonly employed in text classification, our model is specifically designed to advance the explainability of classification decisions by incorporating this query-driven attention. These queries are derived from securities knowledge and act as explicit guides, directing the model’s attention to text segments relevant to predefined financial concepts. This approach not only refines attention from word and sentence levels but also extends it to the query set itself, introducing a novel way to achieve concept-level explainability for document-level sentiment analysis in the stock market. Each specific query includes a list of financial terms and embodies a particular perspective, that is, a distinct financial concept, which analysts can use when evaluating stock market-related documents.
In practical applications, deploying our BERT-GRU model with QGDA as a classifier demonstrates a notable advantage over conventional sentiment analysis models tailored to the financial domain. Rather than merely predicting the sentiment polarity within stock-related articles, our model goes a step further: by examining the attention distribution across the domain-specific query set, it illuminates the query category representing a particular financial concept or driver, which holds significant influence during classification. Consequently, this approach allows for a deeper understanding of the basis of text classification models during decision-making, specifically the perspective from which sentiment classification judgments are made, thereby providing a more valuable and interpretable foundation for analysts in the financial domain.
Compared to prior deep learning approaches, our study not only enhances classification performance for financial domain texts by integrating BERT with our Query-Guided Dual Attention mechanism, it also provides a significant leap in structured, domain-specific explainability. This strategic incorporation fills a critical gap in financial sentiment analysis, where existing models often excel in performance but lack in transparently explaining their decision-making process. By focusing on both the content of the financial texts and the queries defined by financial experts, our QGDA mechanism offers an innovative route to more comprehensively understanding the underlying sentiments and their drivers in financial documents.
To rigorously verify the reliability of the explanatory basis offered by the QGDA mechanism, a quantitative experiment was further devised, as detailed in the subsection titled “Effect of Explainable Basis”. Crucially, this validation framework assesses whether the model’s explanations correlate with real-world outcomes, specifically the dominant query categories identified by QGDA for each document. Our findings demonstrate that predictions guided by these dominant conceptual drivers exhibit statistically significant higher consistency with actual stock market fluctuations. This quantitative exploration strengthens our model’s position by empirically demonstrating its ability to offer not just superior classification accuracy but also actionable and validated insights into the decision-making process, providing a dual benefit that is especially crucial in the field of financial sentiment analysis.
The first level of our model fine-tunes the pretrained BERT model to capture the connections between words and learn the features of sentences that are split from documents. In the second level, we construct a GRU [7] model with the novel QGDA mechanism to aggregate the sentence representations obtained from BERT into document representations. The QGDA mechanism incorporates the customized knowledge-driven query set into the attention mechanism’s calculation process as derived from the transformer [8]. Through the distribution of attention weight on queries, our model is able to provide explainable evidence of which kind of query plays the main role in the document classification model, allowing it to represent specific financial concepts.
The weights across the different sentences are assigned by the first layer of the QGDA mechanism. Rather than self-attention, attention weights derived from the deployment of diverse financial knowledge-based query sets can help the model pay more attention to the sentences connected to these queries, which are more indicative of financial analyst opinions. The second attention layer assigns weights across the different queries This can aid in determining which category of query should play the most important role in the mechanism across the sentences. In addition, the weight distribution helps to determine which category of query (i.e., which financial concept) receives more attention under the black-box model, enabling judgment on the specific perspective that influences the document’s conclusion. Through this mechanism, our model achieves a degree of explainability that goes beyond mere polarity classification, offering insights into the conceptual drivers of sentiment and catering to the varied requirements of users.
Experiments conducted on a real-world dataset of Securities Media Review documents demonstrate that our BERT-GRU model with QGDA significantly outperforms the compared methods in classification while also producing a meaningful explanatory basis. Furthermore, our subsequent analysis links the dominant query categories guiding predictions to subsequent stock market trends, demonstrating that arguments rooted in certain financial concepts (as captured by our queries) are significantly more indicative of actual stock price movements. This empirically validates the utility of our explainable basis.
This paper makes several significant contributions, which can be summarized as follows:
  • We propose a hierarchical BERT-GRU model that integrates financial domain knowledge for sentiment classification of stock market documents via a novel Query-Guided Dual Attention (QGDA) mechanism. This mechanism effectively directs attention based on domain-specific conceptual queries.
  • We design a query set derived from securities knowledge and utilize the attention weights distributed by the QGDA mechanism among these queries to provide an entirely new and interpretable form of concept-level explainability for stock-related document classification that reveals the ’why’ behind predictions.
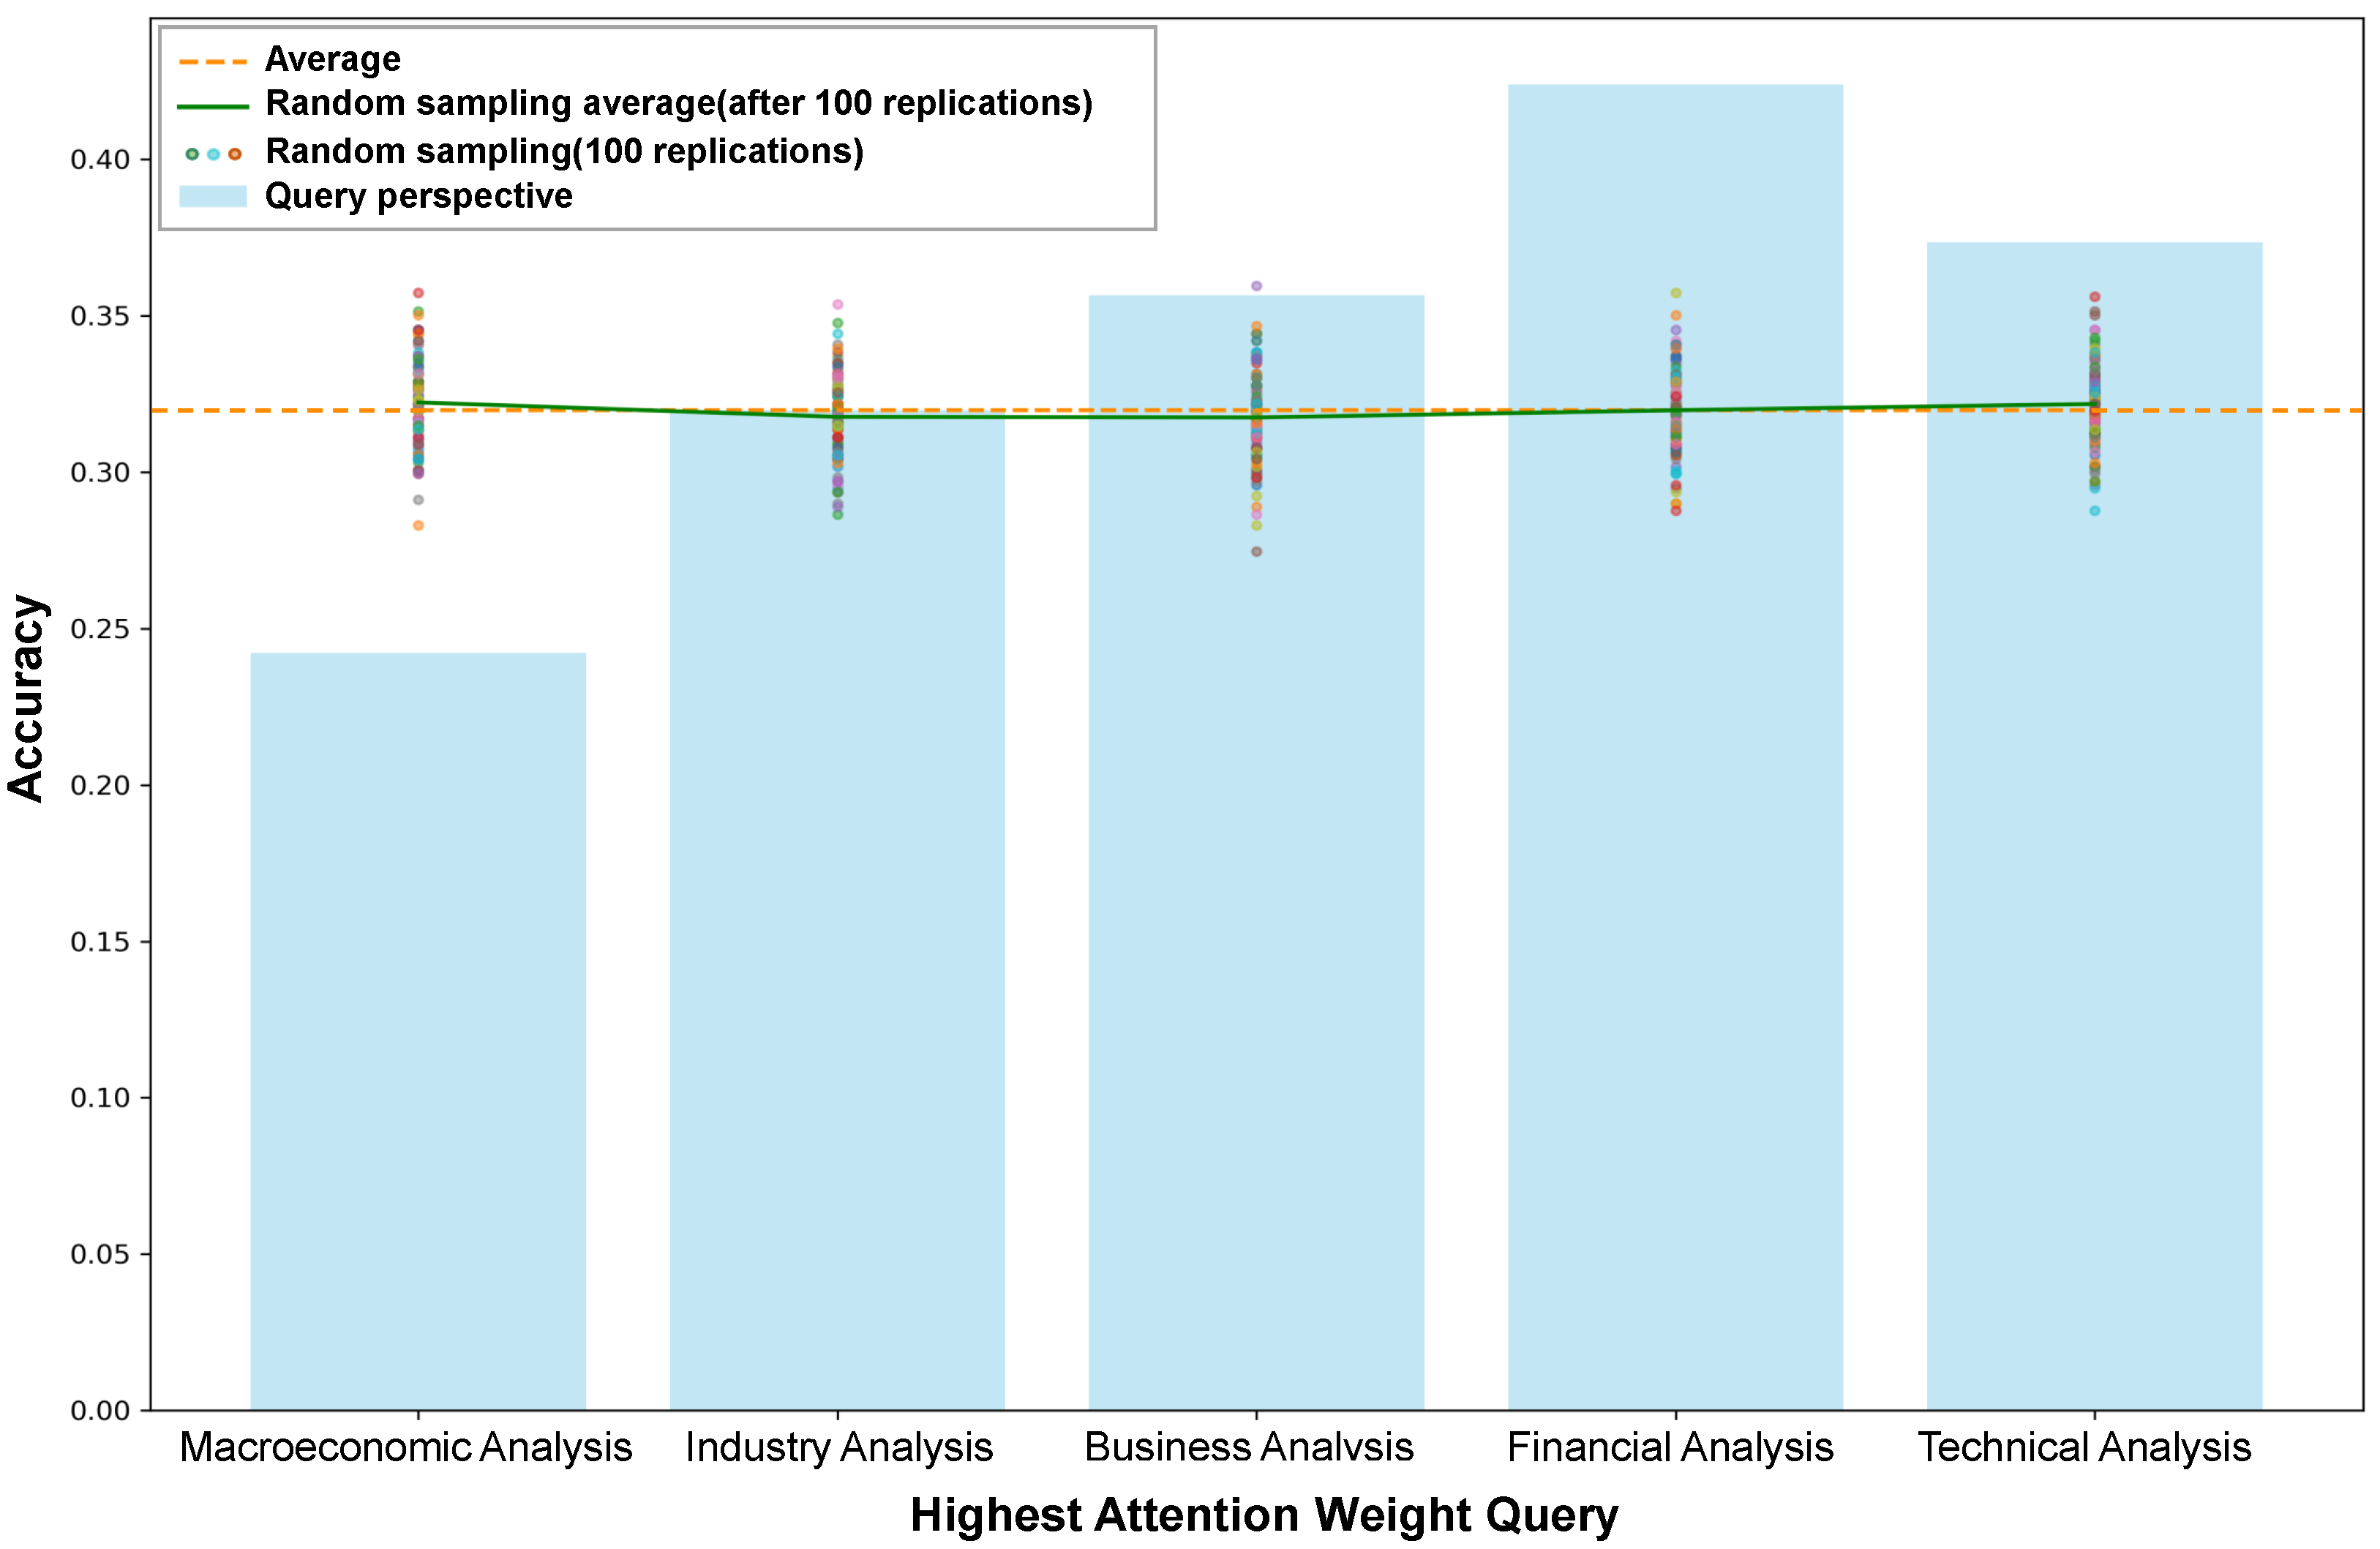
  • Crucially, we quantitatively validate our model’s explainability. Our case study demonstrates that predictions guided by dominant query categories identified through QGDA exhibit statistically significant higher consistency with actual stock market fluctuations (p-value = 0.0368). This not only confirms the utility of our explanations but also identifies which conceptual drivers are more indicative of market movements.

2. Related Work

The efficient market hypothesis (EMH) states that investors constantly update their market beliefs based on the information they obtain, which leads to fluctuations in market prices [9]. Behavioral finance believes that investors’ cognitive and irrational emotional biases may cause unexpected fluctuations in stock prices [10]. Indeed, emotions may sometimes be more influential than fundamentals [11]. However, both theories consider information that influences investors’ judgment to be a key indicator of stock market movements [12]. This recognition has spurred research into sentiment analysis of financial documents.

2.1. Sentiment Analysis for Financial Articles

Sentiment analysis aims to compute opinions, sentiments, and subjectivity from text [13]. It can be applied at three levels based on the analyzed text unit: document level, sentence level, or aspect level [14]. The most commonly used approaches include lexicon-based, machine learning, and hybrid approaches [15]. To handle the massive unstructured data accumulated on social media, deep learning-based methods are gaining increasing attention and achieving state-of-the-art results on various tasks [16]. For example, ref. [17] demonstrated the effectiveness of integrating BERT and deep CNN for sentiment analysis of COVID-19 tweets, achieving exceptional performance. Additionally, ref. [18] discussed the use of Gephi and R for mining and visualizing social media and DBpedia data, highlighting the importance of graph-based analysis in understanding data structures.
In the financial field, studies have applied deep learning methods to the stock market [19] and examined the effects of financial related articles such as economic news and social media reviews on stock movements. For example, ref. [20] used tweet comments to analyze stock fluctuations over time. In [21], the authors used data from Chinese financial news websites such as Dongfang Fortune and Sina Finance to capture public sentiment toward companies through the comment sections of these financial websites, discovering that the combination of public sentiment and financial news is a good predictor of stock trends. In [22], the authors conducted a comparative analysis of LSTM and GRU models for stock market forecasting under similar conditions. In [23], a topic model to predict stock price movement was constructed using sentiments on social media. Through the analysis of news about real estate related listed companies, ref. [24] not only argued for the impact of news optimism or pessimism on the stock price of the real estate sector but also found that such news could be used predict the volatility of the stock market as much as 14 days before it was released. In [25,26] the authors further incorporated transformer and BERT for stock price prediction to enhance predictive performance.
Following the initial exploration of deep learning’s impact on financial markets, the rise of large language models (LLMs) such as ChatGPT (GPT-3.5) [27] and GPT-4 [28] has redefined state-of-the-art benchmarks across numerous fields [29]. However, while LLMs exhibit impressive general-purpose capabilities, their application in the high-stakes financial domain presents significant challenges. These include high computational costs that hinder rapid and widespread deployment as well th inherent “black-box” nature of such models, which conflicts with the critical need for transparent and verifiable reasoning in financial decision-making.
This gap highlights a crucial tradeoff between raw performance and practical utility. Our QGDA framework is designed to address this gap by offering a lightweight, cost-effective, and inherently interpretable alternative. Its specialized architecture is particularly well suited for deployment in environments with sensitive or proprietary data, where reliance on large-scale external APIs is not feasible. More importantly, QGDA provides not just sentiment prediction but concept-level explanation by design, revealing the `why’ behind its conclusions.
Furthermore, we envision a powerful synergy in which our QGDA model complements rather than competes with LLMs. The challenge of mitigating hallucinations and grounding LLMs in factual domain-specific knowledge is a prominent research area that is often addressed through retrieval-augmented generation (RAG) frameworks [30]. As demonstrated in fields such as fact-checking [31], leveraging structured knowledge can significantly enhance LLM reliability. In this context, our QGDA model can serve as an intelligent and domain-aware retrieval component. It can rapidly preprocess financial articles to identify and extract the most relevant conceptual drivers, then feed this structured, explainable evidence to an LLM. This approach not only grounds the LLM’s output in verifiable information but also augments its reasoning with a layer of financial concept awareness. Thus, our work presents a dual contribution: first, a practical standalone tool for explainable financial sentiment analysis, and second, a valuable component for building more robust and transparent next-generation financial AI systems.

2.2. Explainable Sentiment Analysis Network

As explained above, sentiment analysis methods which consider only the polarity or classification of the text sentiment are insufficient in the financial field, leading to our research on explainable sentiment analysis. Explanation and interpretation are ambiguous concepts, especially for the black-box models resulting from deep learning-based methods. On the other hand, aspect-based sentiment analysis (ABSA) [32] aims to determine which specific aspects are mentioned in the comments and to assess their corresponding emotional polarity, while explainable sentiment analysis [33] aims to provide explainable justifications for the decisions in some level of detail.
In research of eXplainable Artificial Intelligence (XAI), the term “explainability” is not well defined and often has different research goals with different approaches [34]. Nonetheless, all of these goals and approaches fall under the overall concept of explainability, which seeks to augment the training process, learned representations, and decisions with human-interpretable explanations [35]. For example, interpretable local surrogate-based approaches such as LIME [36] aim to explain classifiers’ results by replacing the decision function with a local self-explanatory model. Occlusion analysis-based methods aim to repeatedly test the effect of occluding patches or individual features on the neural network output [37]. In one instance, SHAP [38] provides practical algorithms to approximate Shapley values, which can increase model transparency. Gradient-based techniques provide explanations by integrating the gradient [39]. Finally, layerwise relevance propagation (LRP) [40] iteratively utilizes the layered structure of the neural network to provide explanations.
To achieve the best possible explainability of sentiment analysis models, the interpretability of attention mechanisms has garnered increased attention. By manipulating the attention distribution and reducing the highest attention value to zero, ref. [41] were able to investigate the interpretability of the attention mechanism. Similarly, ref. [42] employed an adversarial generation method to scrutinize the role of attention distribution, positing that the model’s prediction pathway is not singular. For financial text sentiment classification, ref. [6] proposed a specialized hierarchical model that utilizes a set of custom queries as part of a distinctive hierarchical attention mechanism. This model offers a degree of interpretability through the distribution of attention weights among the queries while enhancing classification accuracy for financial documents.
Recent works in the domain of sentiment classification have made strides in explainable research. The study by [43] introduced a novel Information Bottleneck-based Gradient (IBG) explanation framework that significantly enhances model interpretability by isolating sentiment-aware features through a focused refinement of word embeddings on intrinsic dimensions. In analyzing sentiment on social media, the research by [44] employed graph neural network embeddings and machine learning algorithms to classify sentiments about ChatGPT using a dataset of 8202 manually labeled tweets. This work notably advances model transparency usin gSHapley Additive exPlanations (SHAP), establishing a robust framework for explainable AI in assessing public perceptions of technological progress. Moreover, ref. [45] introduced eXplainable Lexicons (XLex), a method that merges lexicon-based analysis with the capabilities of transformer models for financial sentiment analysis, resulting in improved accuracy, efficiency, and interpretability.
However, ref. [46] demonstrated that diminishing the attention weight of specified tokens during training can cause models to generate outputs akin to their original predictions. This suggests a potential risk of misinterpretation or manipulation when relying on attention weights as a basis for judgment. In our study, we observe that employing attention mechanisms or other XAI methods for explainable sentiment analysis in the finance sector remains a challenging and open question.

3. Preliminaries and Problem Definition

3.1. Preliminaries

One of the main challenges in sentiment analysis is accurately classifying texts based on the sentiments they convey. Unlike aspect-level or sentence-level SA, document-level SA involves analyzing the sentiment expressed in a complete document rather than just a single sentence or aspect. This requires a deeper understanding of the complex relationships between sentiment and the phrases it depends on.
Bidirectional Encoder Representations from Transformers (BERT) is a state-of-the-art language representation model that utilizes a transformer architecture [8] and contextualized word representations [47] to generate contextual representations of words. By utilizing pretraining on a vast text corpus, BERT can better understand the meaning of words in the context of a sentence and effectively capture sequential features. Additionally, BERT is highly adaptable thanks to its capacity for fine-tuning to specific subtasks or datasets, making it a powerful tool in various natural language processing scenarios.
The attention mechanism in neural networks is employed to enhance the model’s comprehension of input data and improve its performance by focusing on certain parts of the input. The interpretability of the attention mechanism refers to the ability to understand and explain how the model uses the attention mechanism to process input data. This can be achieved by studying the attention weights (the level of focus) and the attention paths (the sequence of attention) that the model assigns to each input part.

3.2. Problem Definition

In this subsection, the problem of explainable sentiment analysis in the stock market domain is formally defined. A document related to the stock market consists of numerous sentences and aspects. While the sentiment of each sentence or aspect may be different, there is usually a single overarching conclusion that comprehensively considers the influence of various aspects. For example, a securities review article may include positive or negative reviews about the company’s operating performance, economic environment, market sentiment, etc. Subsequently, an overall recommendation regarding the stock is conducted through comprehensive analysis.
Definition 1.
Let a stock-related review document with m sentences be represented as d = s 1 , s 2 , , s m D , where D denotes the total set of documents employed in our analysis. In document d, let i-th sentence with n words be represented as s i = w i 1 , w i 2 , , w i n | w i t V , where V is the vocabulary. The problem of document sentiment analysis is to learn a function f that can predict the overall sentiment polarity r p o s i t i v e , n e u r a l , n e g a t i v e of document d.
Definition 2.
Given a document d for which the function f predicts sentiment polarity r, the challenge of explainability is to find a suitable basis for interpreting the decisions of function f. A common approach is to visualize attention weights in order to identify the relative importance of inputs to the entire model.
Definition 3.
An artificial query set containing k queries is designed to enhance the attention mechanism and improve its interpretability. Let the query set be represented as Q = q 1 , q 2 , , q k , where each query is commonly defined as a set of keywords relevant to the data domain in order to represent a distinct analytical perspective. On the sentence level, the i-th query with j words is similarly represented as q i = w i 1 , w i 2 , , w i j | w i t V . The size k of the query set and length j of each individual query can be arbitrary. By incorporating domain-specific knowledge, this query set aims to provide a more informed and focused analysis of the data. Through careful selection of relevant keywords, queries can be used to direct attention to specific features and aspects of the data, thereby enhancing the overall performance of the model.

4. Methodology

This section provides a description of the algorithm and details the proposed approach step-by-step. The main components are systematically explained, with Figure 1 illustrating the architecture of our proposed hierarchical BERT-GRU model with Query-Guided Dual Attention (QGDA).

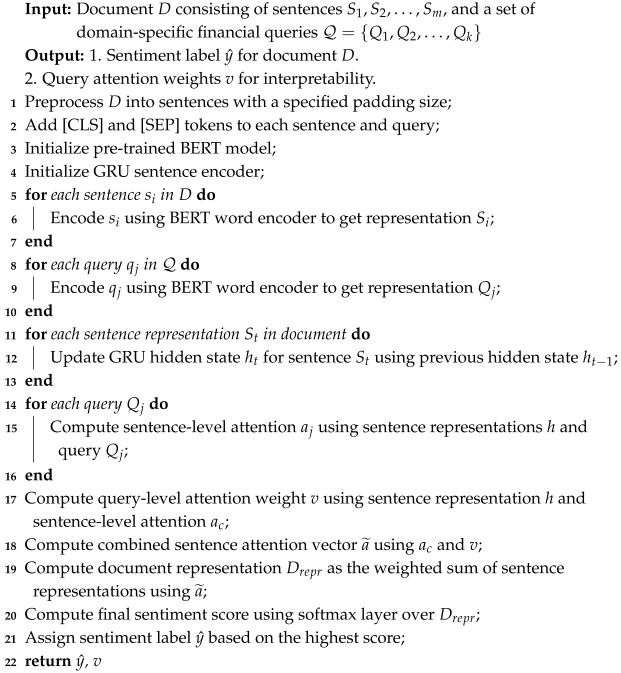
4.1. Algorithm Description

Algorithm 1 details the forward pass of our proposed method, which serves as the core computational engine within our broader experimental pipeline. This algorithm illustrates how a document D and set of financial queries Q are processed to generate two key outputs: a final sentiment label and a set of interpretable query attention weights. These outputs are subsequently used in our evaluation pipeline (detailed in Section 5.2) to assess both the model’s classification performance and the practical utility of its explanations.
Specifically, lines 1–4 handle the initial setup and preprocessing, lines 5–10 describe the encoding of sentences and queries using the BERT encoder, and lines 11–13 utilize a GRU to capture sequential dependencies between sentences. The core of our contribution, the QGDA mechanism, is detailed in lines 14–18, where sentence-level and query-level attentions are computed and combined. Finally, lines 19–21 derive the final document representation and sentiment prediction.
Algorithm 1: Hierarchical BERT-GRU Model with Query-Guided Dual Attention (QGDA) for Financial Sentiment Analysis
Applsci 15 06893 i001

4.2. BERT Word Encoder

Hierarchical structures are a commonly used approach in sentiment analysis for handling documents with multiple levels of granularity. In this approach, the document is segmented into a hierarchy of sentences and each sentence is further analyzed independently.
BERT [5] is recognized as a state-of-the-art approach for various NLP tasks. To better capture both the local context of individual words as well as the global context of the entire sentence, we adopted the BERT model as the foundation for the word encoder in our hierarchical architecture. At this level, we utilize the architecture of the pretrained BERT model [48] on a large Chinese corpus to encode words and generate representations for both the sentences in the documents and the domain-specific financial queries in the query set.
Considering the features and length limitations of BERT, we preprocess the text to meet the input requirements. Both the sentences and queries are segmented to be within 512 words, and the special symbols [CLS] and [SEP] are added at the beginning and end of each segment, respectively.
Figure 1. The model architecture of our hierarchical BERT-GRU model with Query-Guided Dual Attention (QGDA).
Applsci 15 06893 g001
We input all the sentences and queries into a pretrained Chinese BERT model and employ a commonly used approach for sentence classification that utilizes the vector at the [CLS] position as the representation vector S i and Q j for the i-th sentence and j-th query [49]. Subsequently, we obtain the representation vectors for all sentences in the financial document as [ S 1 , S 2 , , S m ] and the representation vectors for all queries in the query set as [ Q 1 , Q 2 , , Q k ] .

4.3. Query-Guided Dual Attention (QGDA)

At the sentence level of the proposed hierarchical structure, individual sentence representations are combined to derive the overall sentiment score of the document.
Modeling the sequential nature of sentences within a document requires an effective sentence encoder. We selected bidirectional gated recurrent unit (GRU) [7] as the fundamental block for three primary reasons. First, GRUs are a standard and proven architecture for sequence modeling in hierarchical NLP tasks, demonstrating strong performance in capturing contextual dependencies. Second, they offer greater computational efficiency and faster training times compared to alternatives such as LSTMs and often achieve comparable performance, which is a significant advantage for practical applications. Finally, our preliminary experiments confirmed that Bi-GRU provided a robust performance-to-complexity tradeoff for our specific dataset and task. Therefore, we utilize Bi-GRU to process the sequence of sentence representations generated by the BERT encoder. For the t-th sentence representation, the hidden state h t is updated based on the previous state h t 1 as follows:
r t = σ U r S t + W r h t 1 + b r
z t = σ U z S t + W z h t 1 + b z
h t ˜ = t a n h U h S t + W h r t h t 1 + b h
h t = z t h t 1 + 1 z t h t ˜
where r t and z t represent the reset and update gates, respectively. The sentence representation sequence is processed bidirectionally, i.e., in both the forward and backward directions.
We then concatenate the forward hidden states h t = G R U S t and backward hidden states h t = G R U S t , where t 1 , m , obtaining the final representation of sentence t as h t = [ h t , h t ] .
To effectively integrate financial domain knowledge and guide the model’s focus, we employ our Query-Guided Dual Attention (QGDA) mechanism. This mechanism directs the model to prioritize those sentence vectors that are most relevant to the financial concepts embedded in our query set.
The QGDA mechanism includes two levels. The first is the sentence level, where we calculate the attention weight between sentence and query using all queries in the query set Q . The representation of sentence in the document is expressed as follows:
u j = t a n h W j h + b j , j 1 , k
a j = s o f t m a x u j Q j T d Q , j 1 , k
where h = ( h 1 , h 2 , , h m ) T denotes the concatenation of all sentence hidden states in document d and a j denotes the attention weight for carrying out the calculation using h and the query representation Q j . This first level identifies sentences relevant to each specific financial query/concept.
In the second level, we calculate attention weights over the queries themselves in order to determine the relative importance of each query’s perspective for the given document:
u c = t a n h W c h + b c
v = s o f t m a x u c a c T a c
where a c = [ a 1 , a 2 , , a j ] , j 1 , k represents the concatenation of all query attention weights and v determines which of the query representations should play a more importance role in the second level of the attention mechanism. Based on v, we obtain the final attention weight a ˜ = v T a c that is combined with all of the query attention weight a c .
Given a financial reviews document d, we measure the importance of each sentence using the attention vector a ˜ ; given a query set Q , the query attention vector v measures the importance of each financial query/concept, providing insight into the conceptual basis of the model’s judgment.
The overall representation vector of document d is calculated using the final attention vector a ˜ . This final vector considers the weight between different queries and the sentence hidden state h, which are combined with all of the sentence hidden states as D = a ˜ T h . This ensures that the document representation is guided by the financial concepts deemed most relevant by the QGDA mechanism

4.4. Output Layer

In the output layer, we feed the document representative vector D into a fully-connected layer and predict the sentiment categories. We use the softmax mechanism to obtain the probability distribution of the categories in each review prediction. The training objective is to minimize the cross-entropy loss, as follows:
L = d D c = 1 c y d c · log y ^ d c .

5. Experimental Results and Evaluation

5.1. Datasets and Query Construction

In this section, we employ the proposed QGDA model for explainable sentiment analysis of documents related to the Chinese stock market. We compiled a securities news review dataset obtained from the RESSET (http://www.resset.com (accessed on 12 March 2025)) database, which consists of analysts’ evaluation articles of the Chinese stock market since 1 January 2000. The articles in this raw dataset inherently come with five sentiment labels based on their overall recommendations: buy, sell, hold, follow, and other.
Because our raw dataset exhibited significant class imbalance, we implemented a targeted data screening and stratified sampling strategy to ensure robust model training and unbiased evaluation. This process was crucial to obtaining a balanced dataset in which each of the five sentiment categories contained an equal number of samples. The resulting balanced dataset totaling 21,200 documents was then stratified and divided into training (14,835 samples), validation (2120 samples), and test (4240 samples) sets at a ratio of approximately 7:1:2. This division ensured that each sentiment category contained an equal number of samples within each split. After segmenting all the documents into sentences, we utilized BERT’s tokenizer to tokenize the words within each sentence.
The query set Q can be defined according to specific task requirements. To ensure that our model aligns with the analytical perspectives of investors and systematically inject domain knowledge, the selection and definition of the query categories followed a structured procedure rather than an arbitrary manual process. This procedure was conducted by financial experts, and involved two key stages: first, the experts performed a qualitative analysis of the financial articles within our dataset to identify recurring themes and pivotal factors that influence stock market sentiment; second, these data-driven observations were synthesized and structured by cross-referencing them with established knowledge and common analytical frameworks used in the financial domain.
This synthesis resulted in the five query categories shown in Table 1, which represent fundamental aspects considered by investors when evaluating stock-related information. Each query category consists of a set of representative keywords. Crucially, this knowledge injection methodology is adaptable; the query categories and keywords can be readily modified for different datasets or applied to other domains (e.g., legal or medical text analysis), demonstrating the generalizability of our query-guided approach. The subsequent experiments show strong correlation with stock market feedback, serving as empirical validation for the effectiveness of our chosen query categories.

5.2. Experimental Setup

To evaluate our proposed method, we conducted a series of experiments on the dataset in order to answer the following research questions:
(1)
How does BERT affect the performance of hierarchical structure in the document-level SA task?
(2)
Is our Query-Guided Dual Attention (QGDA) mechanism leveraging manually-defined financial queries able to improve model performance?
(3)
How does the concept-level explainable basis derived from the QGDA mechanism (specifically, the dominant query categories) affect the analysis of stock market predictions and their consistency with actual market fluctuations?
Table 1. Example of expert-defined domain-specific query set for the QGDA framework.
Query SymbolQuery AspectsContent Example
q 1 Macroeconomic AnalysisEconomy, Cycle, Price, International, Finance, Currency, Policy, Politics, Macro, etc.
q 2 Industry AnalysisIndustry, Market, Industry, Product, Innovation, Shipment, Sales Volume, Business, Peers, etc.
q 3 Business AnalysisPersonnel, Executives, Management, Law, Litigation, Cases, Resignation, Complaints, Stepping down, etc.
q 4 Financial AnalysisRevenue, Profit, Sales, Loan, Cost, Loss, Debt, Liability, Arrears, etc.
q 5 Technical AnalysisCandlestick chart, Tangent line, Pattern, Trend, Market index, Indicator, Technical analysis, Share, Equity capital, etc.
Our evaluation pipeline is designed to systematically address these questions by leveraging the outputs of our model, for which the architecture and logic are detailed in Figure 1 and Algorithm 1, respectively. To answer RQ1 and RQ2, we assess the model’s core classification performance using the widely-adopted F1-score. For RQ3, we evaluate the practical utility of the model’s explainable basis; specifically, we analyze the dominant query categories derived from the attention weights in Algorithm 1 and measure their consistency with actual stock price fluctuations using the accuracy metric.
For our experiments, we set the maximum sentence length to 32 tokens and the maximum document length to 24 sentences. Sentences exceeding 32 tokens were truncated, and documents containing more than 24 sentences were processed by considering only their initial 24 sentences. This approach was adopted based on an empirical analysis of our dataset, which showed that the majority of financial review documents are relatively concise and that the key sentiment-bearing information is often concentrated in the earlier sentences. This design choice also balances computational efficiency with retaining essential content for sentiment analysis. We utilized the BERT model as our base, with 12 transformer layers, a hidden size of 768, and 12 attention heads. The subsequent Bi-GRU sentence encoder was configured with two layers, each having a hidden size of 384.
The final training hyperparameters were determined through a systematic tuning process. We performed a grid search on a dedicated validation set, exploring values for key parameters including the learning rate ([5 × 10 5 , 1 × 10 4 , 1 × 10 3 ]), batch size ([16, 32, 64]), and dropout rate ([0.1, 0.2, 0.3]). The optimal configuration employed an Adam optimizer with a learning rate of 0.001 and was selected based on the best F1-score achieved on the validation set. We also utilized an early stopping mechanism with a patience of five epochs to prevent overfitting. All models were implemented in PyTorch 1.13 and trained on a single NVIDIA RTX 3090 GPU.

5.3. Baselines

To answer RQ1 and evaluate the performance of our approach, we compared our proposed model with several baseline methods that are commonly used in document-level sentiment analysis tasks. To answer RQ2, we conducted ablation experiments to evaluate the impact of query set and dual attention mechanism.
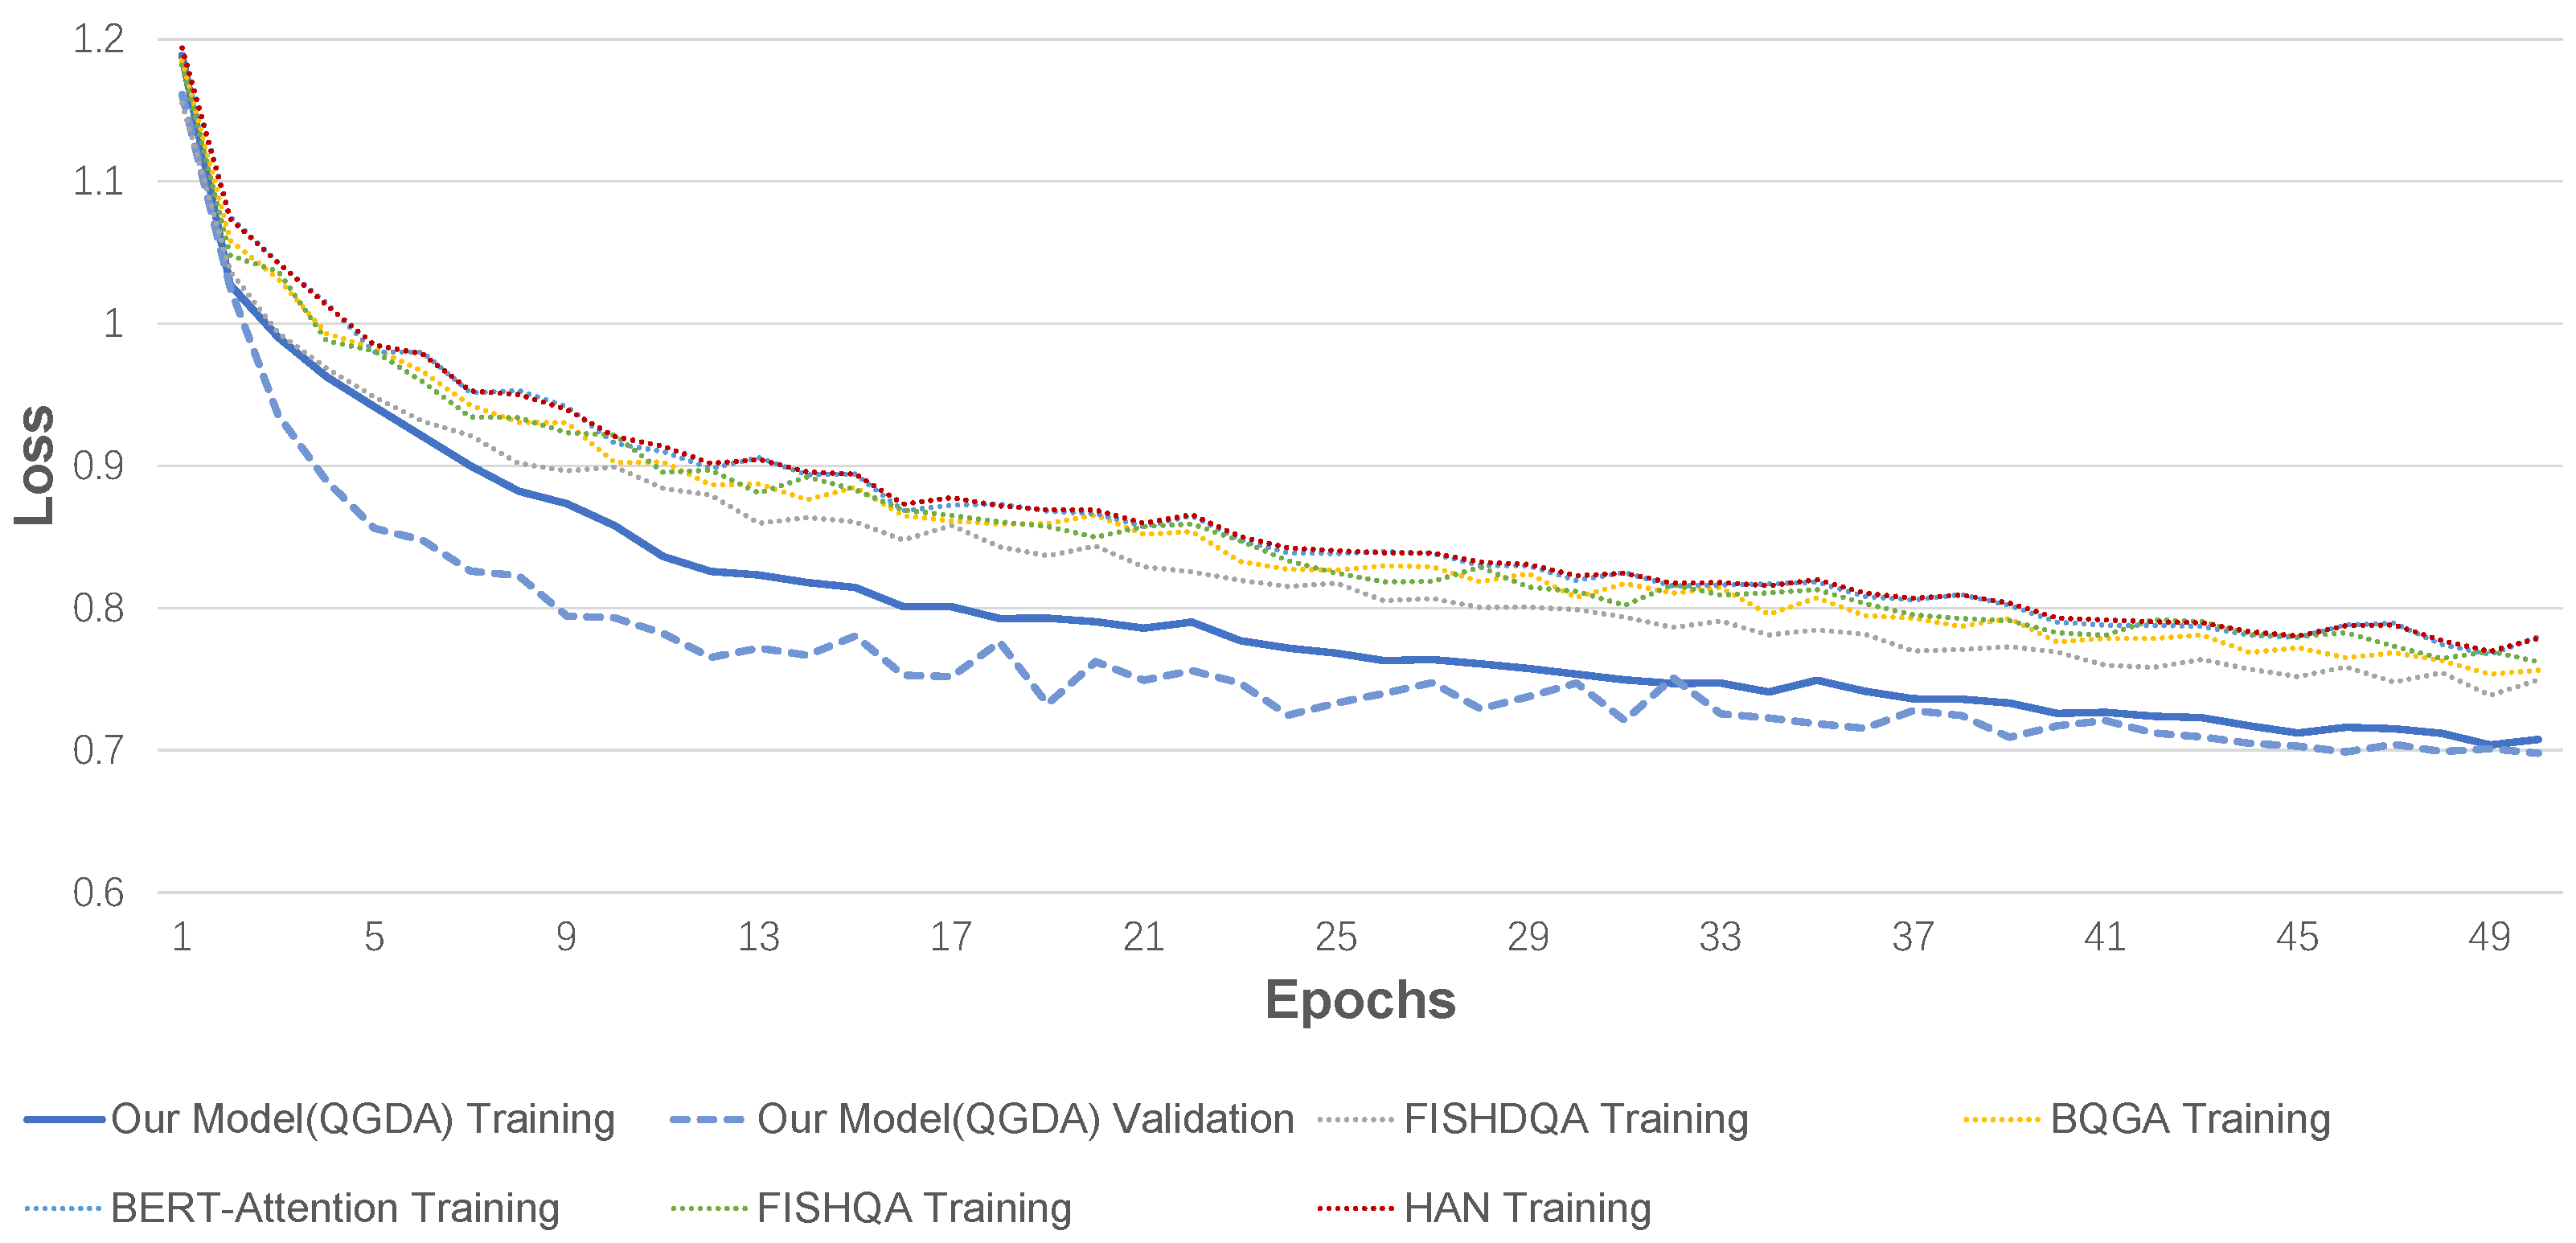
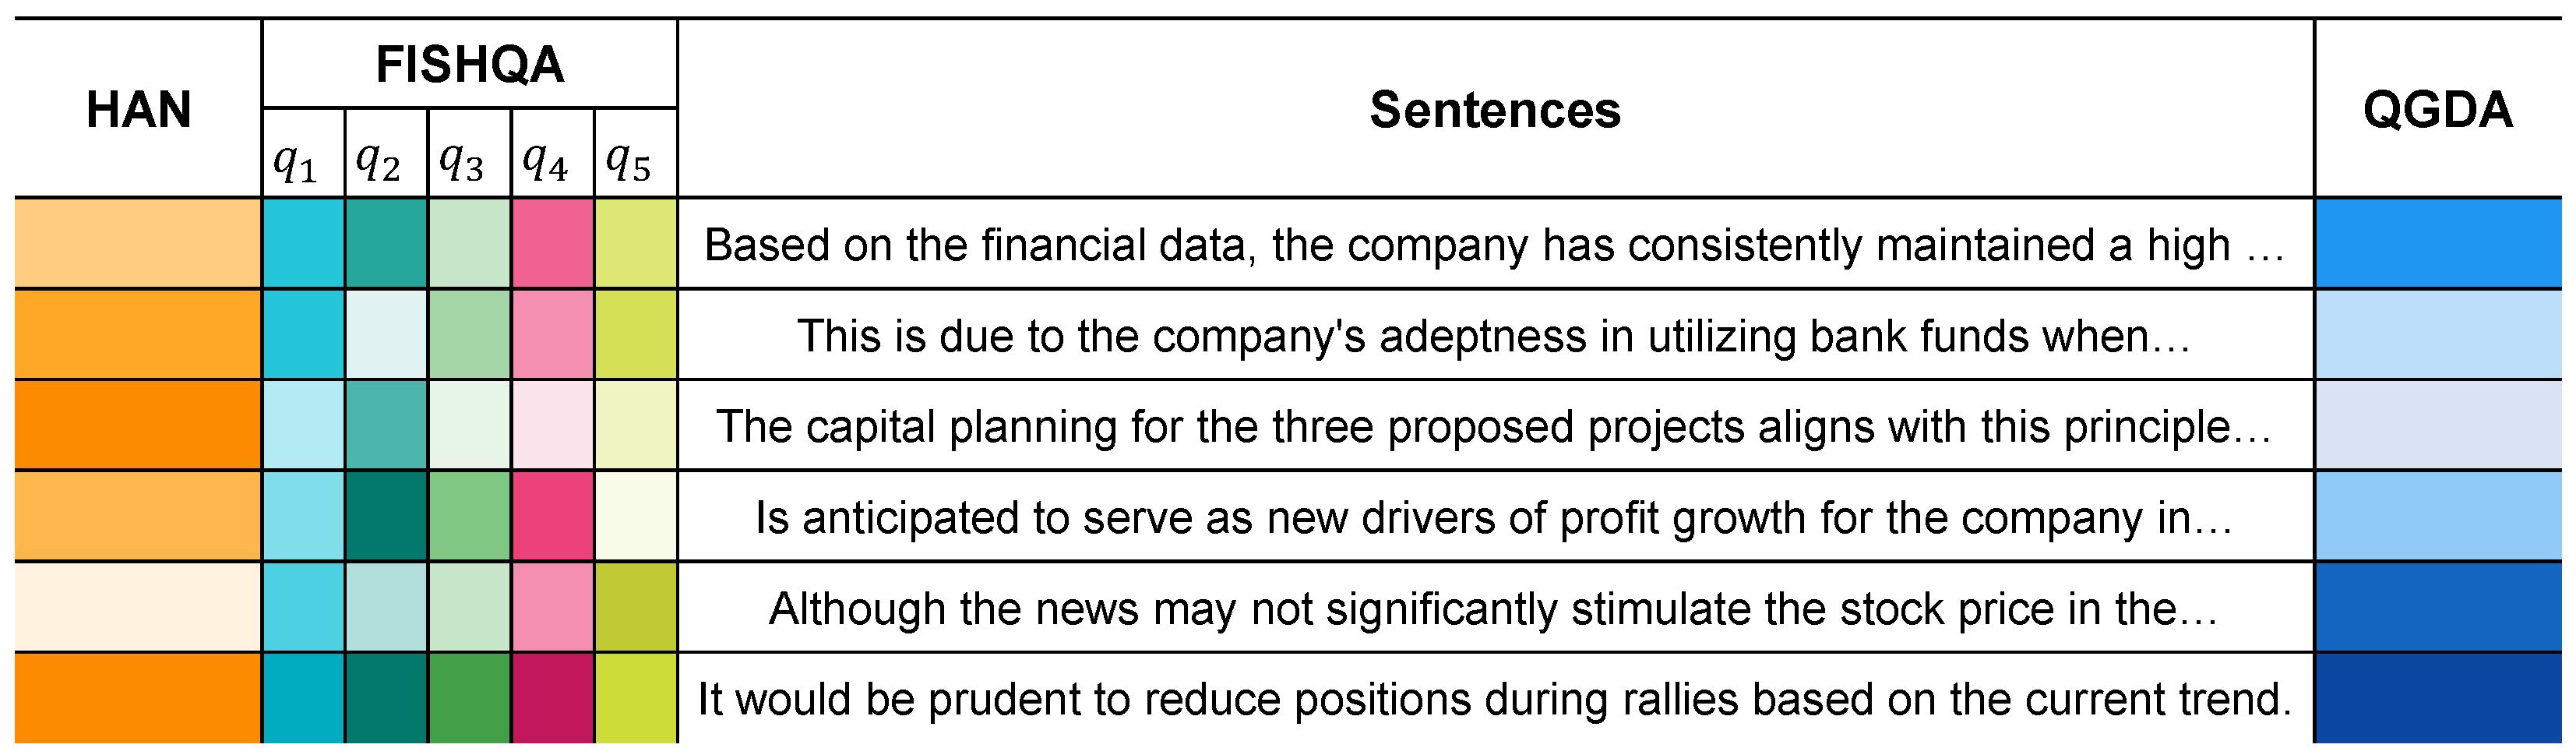
  • HAN [50]: This method adopts a hierarchical structure with GRU based word-level and sentence-level attention mechanisms. The original paper demonstrated that deep learning-based methods can outperform lexicon-based methods.
  • FISHQA [6]: A novel attention mechanism that incorporates user-specified queries to spotlight texts on different levels and provide explainability through the distribution of attention weights.
  • BERT-Attention [5]: We designed a hierarchical BERT with a standard GRU attention mechanism without queries in order to evaluate the performance of BERT and the impact of queries.
  • BERT-GRU-QA (BQGA): We conducted an ablation experiment by removing the dual attention mechanism from the sentence-level encoder in our full model in order to evaluate the performance of our proposed QGDA mechanism.
  • FISHDQA: We conducted an ablation experiment by adding the dual attention mechanism to FISHQA in order to evaluate its performance within the hierarchical GRU structure.

5.4. Results Analysis

In this study, we rigorously evaluated the sentiment classification performance of our novel hierarchical BERT-GRU model with Query-Guided Dual Attention (QGDA) in comparison to several baseline methods. To ensure a robust evaluation, we utilized a 7:1:2 training–validation–testing split for our datasets. The outcomes of our experimental analysis on the test set are thoroughly documented in Table 2. This table provides a detailed performance comparison of QGDA against other baseline models, highlighting our model’s superior accuracy and efficiency in sentiment classification. Additionally, Table 3 offers a class-wise performance analysis, which helps in understanding the effectiveness of our model across different sentiment categories.
From Table 2, it can be observed that our QGDA model achieved an F1-score of 75.38%. While this represents a modest 2.3% improvement over the next-best baseline, its primary significance lies not in the marginal gain itself but in demonstrating that our model achieves state-of-the-art performance while simultaneously introducing a crucial layer of concept-level explainability. The performance gain indicates that guiding the model with an explicit financial concept-based query set is not only effective for interpretability but also contributes positively to classification accuracy. This result validates our core thesis, namely, that integrating domain-specific verifiable explanations does not come at the cost of performance, and can in fact enhance it.
To validate the model’s performance, we conducted statistical tests comparing the proposed QGDA model against each baseline model. The one-sample t-tests yielded p-values significantly below the 0.05 threshold, indicating that the performance improvements of the QGDA model are statistically significant for both the accuracy and F1-score metrics. The consistency of these p-values across comparisons underscores the robustness of our model’s enhancements.
Table 3. Detailed performance metrics (precision and recall) per sentiment category across all models.
ClassQGDA FISHQDA BQGA BERT-Att FISHQA HAN
Prec.RecallPrec.RecallPrec.RecallPrec.RecallPrec.RecallPrec.Recall
Buying0.7630.784 0.7240.823 0.6740.817 0.7100.769 0.7430.790 0.6590.820
Selling0.9000.8620.9270.8670.8820.8680.8890.8290.8470.8970.9250.843
Holding0.8320.6260.8640.5990.7580.5810.7700.5880.8840.5670.7450.633
Following0.7250.8170.7050.7240.6860.7650.6570.7810.6520.7560.6770.712
Others0.5980.6790.5340.6450.5900.5440.5460.5640.5180.5580.5480.514
Table 3 presents the detailed precision and recall results for each sentiment category across all models, allowing more granular performance characteristics to be observed. Our QGDA model generally maintains strong performance across categories, exhibiting notable recall in the “Following” (0.817) and “Others” (0.679) classes, demonstrating its proficiency in capturing nuanced sentiments within these diverse categories. It is interesting to note that while FISHQDA shows strong recall for “Buying” (0.823) and FISHQA for “Selling” (0.897), our QGDA model still achieves a balance of high precision and recall across all classes. This indicates QGDA’s robustness and comprehensive understanding of various sentiment expressions, which collectively contributes to its superior overall F1-score, as shown in Table 2. The disaggregated metrics in Table 3 provide insights into the strengths and weaknesses of each model at a finer level of granularity, reinforcing QGDA’s leading performance across the board.
Another valuable insight can be garnered through the observation of the loss value’s progression curve. The training of all models was configured to span 50 epochs. Figure 2, shows how the loss curves of various models evolved during the iterative training process. At the outset of each model’s training, the loss value exhibits a continuous decline accompanied by a simultaneous enhancement in the model’s accuracy on the validation set.
However, around the fifteenth epoch a shift is observed in which the loss value initiates an upward trajectory, eventually plateauing; notably, our QGDA model showcases a marked advantage in its loss curve on both the training and validation sets when contrasted with other baseline models. In reference to the phenomenon of the validation set’s loss being lower than that of the training set, it is posited that this disparity arises due to the regularization term exclusively employed during training. This augmentation of the training set’s loss is not mirrored during the validation or prediction phases, leading to a reduction in loss compared to that of the training set.
A series of ablation experiments were also conducted to investigate the impact of different components of our model. First, the performance of BERT-Attention was evaluated, which achieved an F1-score of 70.61%, almost equal to that of HAN. This suggests that simply using BERT to replace the word encoder is not highly effective. We next evaluated the performance of BQGA, which not only employs BERT but also incorporates a query set in the sentence-level attention mechanism; it achieved an F1-score of 71.51%, outperforming BERT-Attention and FISHQA by 0.9% and 0.14%, respectively. Similar to the comparison between FISHQA and HAN, this result demonstrates the effectiveness of our query set-based attention mechanism.
Subsequently, a comparison was made with FISHDQA, consisting of FISHQA with a dual attention mechanism similar to that of our proposed QGDA model. It achieved an F1-score of 73.16%, significantly outperforming the original FISHQA by 1.79% and BQGA by 1.65%. This suggests that the dual mechanism between different queries improves model performance even more than the use of BERT in the word encoder.
However, the performance of FISHDQA remained lower than that of our QGDA model by 2.3%. It is hypothesized that this discrepancy stems from the enhanced representativeness of the sentence vectors produced by BERT when used in conjunction with our query-based dual attention mechanism within the sentence encoder. This is further corroborated by comparison to BQGA, which lacks the dual attention mechanism; in this comparison, our QGDA model shows a performance improvement of 3.96%. This significant enhancement underlines the efficacy of the query-driven attention mechanism, which when coupled with our novel dual attention framework systematically guides the model’s focus across different interpretive query perspectives. By assigning varying degrees of attention to these queries, the model can leverage the most relevant aspects for each category, thereby enriching the explainability and accuracy of the predictions. Our detailed analysis reveals that this selective attention not only facilitates a deeper understanding of the factors influencing stock fluctuations but also substantially boosts the predictive power of our QGDA model, highlighting the critical role of targeted query-specific attention in complex sentiment analysis tasks.

5.5. Effect of Explainable Basis

The performance of our proposed model on this dataset demonstrates the effectiveness of queries and a dual attention mechanism at the sentence level. To answer RQ 3, we conducted several case studies to validate the explainability of our QGDA model. We focused on the query category attention weights, which are integral to the dual attention mechanism. By analyzing how different queries influence the attention mechanism, it is possible trace the reasoning behind the model’s sentiment classification decisions.
To begin, we compare the attention weight distribution of our proposed QGDA model with that of HAN and FISHQA on the same article. As previous research has shown that the explainability of attention distributions is sometimes ambiguous [51] and can be deceived [46], we refrained from analyzing the distribution of attention weights at the word-level. Instead, for greater reliability we focused solely on comparing the distribution of attention weights at the sentence level.
Figure 3 visualizes the attention weights between sentences. As indicated in the figure caption, the depth of color in each sentence block directly represents its assigned attention weight, with darker shades signifying higher importance to the model’s prediction. Our QGDA model stands out by virtue of its utilization of a dual attention mechanism that distinctly differentiates itself based on the queries. In contrast to FISHQA, which employs multiple queries to guide the attention mechanism and generates multiple query attention weights within the same sentence, our distinctive approach yields a singular and combined query-guided attention weight ( a ˜ ) that steers the attention mechanism across different sentences.
In this example article, our QGDA model clearly assigns high attention weights to the first and last sentence, effectively highlighting the most salient parts of the document for sentiment judgment. In comparison, the HAN model’s attention weights are relatively average across sentences. Additionally, the distribution of attention weights between different queries in FISHQA appears less regular, which may complicate the interpretability of its attention mechanism at a granular level. However, from the perspective of financial analysis, the ability to clearly identify which sentences in a document (via our combined attention a ˜ ) or which underlying financial concepts (via query attention v) play a crucial role in the sentiment analysis model provides a direct and tangible degree of explainable basis. Even if it is difficult to quantify precisely, this qualitative insight into the model’s reasoning is invaluable for financial professionals seeking to understand the `why’ behind a prediction.
Thus, we propose a novel concept-level explainable basis founded on the query attention weights from our QGDA mechanism. This not only considers the attention weight between words and sentences, but more critically considers the attention given to different perspective queries representing financial concepts. Because the queries themselves play a crucial role in guiding the attention mechanism in document sentiment classification, the attention weights between different queries may provide an explainable basis that can illustrate the main analytical perspective influencing the article’s sentiment prediction.
Especially in stock-related review articles, the main perspectives in the analysis not only affect the credibility but also directly impact the accuracy of the analytical content. Thus, we conducted a case study on our dataset to analyze the price fluctuations of stocks covered in securities review articles.
To further substantiate the explanatory power of our QGDA model, we devised an experiment to compare consistency between the stock price movement trends indicated by articles (where sentiment is predicted by our model) and the subsequent actual price fluctuations when predictions are grouped by the dominant financial concept (query category) identified by QGDA. This case study was designed to test the utility of the concept-level explainable basis provided by our model. It emphasizes the correlation between the new perspectives offered by our model and the predictive capabilities of the corresponding articles. This method not only enhances our understanding of the model’s explanatory ability but also demonstrates how analyzing the attention weights generated by different queries can precisely capture key factors influencing the predictive ability of review articles for stock market movements.
For the purposes of this case study, we define the price fluctuation of the related stock as the change in price from the day of the article’s release to the subsequent 30 non-suspended trading days. Specifically, we simplified the analysis of stock price fluctuations into three categories: Rising (when the stock price increases by more than 10%), Falling (when the stock price decreases by more than 10%), and Other (when the stock price fluctuates within a 10% range). To determine whether the price fluctuation is in accordance with the article’s prediction, we classify the sentiment category labels as “buy” and “hold” to indicate an expected rise, “sell” to indicate an expected fall, and “follow” to indicate other. Based on the experimental settings outlined above, we found that the stock review articles in our dataset have an accuracy of only 31% in predicting subsequent stock fluctuations.
To conduct a quantitative analysis of our proposed novel explainable basis derived from the query attention weights in QGDA, we propose the following hypothesis: the query category receiving the highest attention weight from the QGDA mechanism during article classification represents the main financial concept or perspective used by the article to analyze the stock and draw its final conclusion. We then compare the accuracy of stock fluctuation prediction between different main perspectives (dominant query categories) identified by our QGDA model and the average prediction accuracy of our dataset. To bolster the credibility of this hypothesis, we undertook an evaluation of the variations in accuracy across diverse classifications. This approach aimed to enhance the robustness of our findings regarding the disparity in accuracy among different categorizations produced by our proposed explainable basis.
To ensure the methodological rigor of our case study, we focused our analysis solely on the test dataset comprising 4240 instances from the total dataset. Furthermore, to substantiate the effectiveness of our explainability experiments and avoid potential influence stemming from stochastic variability, we conducted a series of 100 classification experiments on the dataset using completely random sampling. This comprehensive validation approach was undertaken in order to empirically substantiate the explainable basis of our model’s QGDA mechanism, thereby reinforcing the significance of its role as a discerning factor in classification explainability.
As shown in Figure 4, significant variation is observed in the accuracy of subsequent stock price predictions across articles grouped by different dominant query perspectives (identified by the highest weight query from QGDA). Notably, articles where q 4 (Financial Analysis) is the dominant query category during QGDA classification exhibit the highest accuracy in predicting stock prices. This is likely because financial analysis content often provides more direct, company-specific, and actionable signals (e.g., earnings, valuation) that correlate closely with immediate stock movements. In contrast, those dominated by q 2 (Industry Analysis) are close to average and q 1 (Macroeconomic Analysis) significantly lower, as their influences are generally broader and less immediately tied to individual stock performance. The difference in accuracy between the highest- and lowest-performing classes reached a substantial 18.18%.
Meanwhile, the mean accuracy resulting from the 100 replications of random sampling classification closely mirrored the overall dataset mean. Furthermore, the result of each random sampling classification, represented by the colored dots in the graph, indicates that the disparities in accuracy among the 100 random classifications are significantly narrower than the classification effects achieved by the QGDA mechanism of our model. This graphical representation reinforces the robustness and distinctiveness of our model’s concept-level explainable basis.
Figure 4. Comparison of stock fluctuation prediction accuracy across different highest attention weight queries.
Applsci 15 06893 g004
The statistical validation of the explainability basis provided by different dominant query categories on the predictive performance is demonstrated in Table 4. One-way ANOVA was utilized to assess the variance in performance across these query-driven categories. The significant p-value of 0.0368 from ANOVA suggests non-uniformity in performance, indicating that certain query categories significantly influence predictive accuracy when identified as the dominant driver by QGDA. Subsequent t-tests comparing the accuracy of each QGDA-identified dominant query group against the mean accuracy from random sampling revealed a marked difference, with all categories except Industry Analysis showing statistically significant improvements or differences. This evidence suggests that the concept-level explainable basis generated through QGDA’s query attention contributes substantially to identifying articles with predictions that are more consistent with market movements, with each category offering distinctive insights that deviate from random baseline expectations.
Even though the experimental results may be influenced by the size and type of the dataset, the evident discrepancies in accuracy among different dominant query categories allow us to infer that the empirical evidence substantiates the reliability of our query-based QGDA mechanism as a solid foundation for concept-level explainability.
In the realm of financial analysis, interpreting the QGDA query attention weights v as indicative of an article’s main analytical perspective proves to be highly valuable. For instance, within our experimental framework, q 4 is indicative of a financial perspective, whereas q 1 aligns with macroeconomic. As derived from the outcomes of our quantitative analysis, it can be reasonably concluded that utilizing our QGDA model to classify stock review articles and identify the dominant analytical perspective (via query attention) significantly enhances the reliability of analyses grounded in specific financial perspectives (such as q 4 ) over those based on macroeconomic perspectives (such as q 1 ), as demonstrated by the distribution of QGDA’s query attention weights.
Our proposed model endowed with this validated concept-level explainable basis makes a unique contribution to financial sentiment analysis. The practical utility of this explainability is multi-faceted:
  • For financial analysts, it allows for rapid verification of a prediction’s rationale. An analyst can see whether the model’s decision was based on relevant financial concepts (e.g., `profit margin’, `debt ratio’) or spurious correlations, thereby building trust and facilitating human-in-the-loop validation.
  • For model auditing and debugging, it provides a transparent lens to diagnose model failures. If a prediction is wrong, the concept-level explanations can reveal whether the model misinterpreted a key financial term or focused on irrelevant information.
  • For future AI integration, this structured and verifiable explainability provides a powerful asset for integration with large language models (LLMs). The identified dominant query concepts can serve as high-quality reliable context in retrieval-augmented generation (RAG) systems, guiding LLMs to generate more accurate and factually grounded financial summaries or reports in order to mitigate the risk of hallucination.
Unlike black-box models, including many LLMs, our approach provides not just a classification but also a ’why’. By demonstrating that high performance and structured domain-specific interpretability are not mutually exclusive, our work paves the way for more trustworthy and practically applicable AI in the financial domain.

6. Conclusions

In this article, we have introduced a hierarchical BERT-GRU model featuring a novel Query-Guided Dual Attention (QGDA) mechanism tailored for the sentiment analysis of stock-related documents. The QGDA mechanism is guided by domain-specific financial queries defined by experts and integrated into the GRU sentence encoder via two attention stages, significantly enhancing the model’s performance and providing a new perspective of concept-level explanatory basis that can foster transparency in the financial domain.
We conducted experiments on a real-world dataset with various baseline and ablation models to illustrate the efficacy of our proposed approach incorporating the QGDA mechanism. Additionally, we designed a case study involving stock price fluctuations to examine the concept-level explanatory basis (derived from QGDA’s query attention) and assess its robustness and applicability in securities analysis. The results demonstrate the superiority of our approach over baseline models, particularly highlighting the QGDA mechanism’s contribution to providing a validated explanatory basis. Crucially, by identifying which conceptual drivers are more indicative of market movements, our model offers financial professionals a transparent `why’ behind sentiment predictions. This can empower more informed investment decision-making and processes, helping to both mitigate risks and optimize strategies.
However, it is important to acknowledge the limitations associated with our current study. While extensive, the scope of our experiments was confined to a specific dataset, which may impact the generalizability of our findings across broader financial documents. Moreover, the practical application of our model in real-world financial analysis might encounter challenges, such as varying data quality and the dynamic nature of financial markets that could affect the model’s predictive accuracy and explanatory power.
Looking ahead, we plan to extend our research to include larger and more diverse datasets, aiming to further evaluate the model’s generalizability across various stock-related documents. Additional experiments are also planned in order to more thoroughly verify the reliability of our financial concept-based query set and the resulting explanatory basis. In addition to financial analysis, the adaptability of our QGDA framework holds promise for explainable AI applications in other specialized fields. In particular, we envision integrating QGDA into retrieval-augmented generation (RAG) frameworks to provide structured and explainable evidence for LLMs, thereby enhancing their reliability in domain-specific tasks. This effort lays the groundwork for future research into synergistic systems that combine the strengths of specialized models and large language models to create transparent and valuable tools for experts across diverse sectors.

Author Contributions

C.H. contributed to conceptualization, methodology, software, investigation, and writing—original draft. Q.H. contributed to visualization, data curation, and writing—review. All authors have read and agreed to the published version of the manuscript.

Funding

This research was funded by the talent introduction project of the School of Finance and Economics at Anhui Science and Technology University, titled “Research on Data-Driven Chance Constraint Optimization Problem with Application to Portfolio Management” (grant number CJYJ202401). The APC was funded by the authors.

Institutional Review Board Statement

Not applicable.

Informed Consent Statement

Not applicable.

Data Availability Statement

The datasets generated during the current study are not publicly available but are available from the corresponding author on reasonable request.

Conflicts of Interest

The authors declare that there are no conflicts of interest regarding the publication of this paper.

References

  1. Li, Q.; Chen, Y.; Wang, J.; Chen, Y.; Chen, H. Web media and stock markets: A survey and future directions from a big data perspective. IEEE Trans. Knowl. Data Eng. 2017, 30, 381–399. [Google Scholar] [CrossRef]
  2. Engle, R.F.; Ng, V.K. Measuring and testing the impact of news on volatility. J. Financ. 1993, 48, 1749–1778. [Google Scholar] [CrossRef]
  3. Liu, B. Sentiment analysis and opinion mining. Synth. Lect. Hum. Lang. Technol. 2012, 5, 1–167. [Google Scholar]
  4. Sousa, M.G.; Sakiyama, K.; de Souza Rodrigues, L.; Moraes, P.H.; Fernandes, E.R.; Matsubara, E.T. Bert for stock market sentiment analysis. In Proceedings of the 2019 IEEE 31st International Conference on Tools with Artificial Intelligence (ICTAI), Portland, OR, USA, 4–6 November 2019; IEEE: Piscataway, NJ, USA, 2019; pp. 1597–1601. [Google Scholar]
  5. Devlin, J.; Chang, M.-W.; Lee, K.; Toutanova, K. Bert: Pre-training of deep bidirectional transformers for language understanding. arXiv 2018, arXiv:1810.04805. [Google Scholar]
  6. Luo, L.; Ao, X.; Pan, F.; Wang, J.; Zhao, T.; Yu, N.; He, Q. Beyond polarity: Interpretable financial sentiment analysis with hierarchical query-driven attention. In Proceedings of the International Joint Conference on Artificial Intelligence—IJCAI, Stockholm, Sweden, 13–19 July 2018; pp. 4244–4250. [Google Scholar]
  7. Bahdanau, D.; Cho, K.; Bengio, Y. Neural machine translation by jointly learning to align and translate. arXiv 2014, arXiv:1409.0473. [Google Scholar]
  8. Vaswani, A.; Shazeer, N.; Parmar, N.; Uszkoreit, J.; Jones, L.; Gomez, A.N.; Kaiser, Ł.; Polosukhin, I. Attention is all you need. In Proceedings of the 31st Annual Conference on Neural Information Processing Systems (NIPS 2017), Long Beach, CA, USA, 4–9 December 2017; Volume 30, pp. 5998–6008. [Google Scholar]
  9. Fama, E.F. The behavior of stock-market prices. J. Bus. 1965, 38, 34–105. [Google Scholar] [CrossRef]
  10. De Long, J.B.; Shleifer, A.; Summers, L.H.; Waldmann, R.J. Noise trader risk in financial markets. J. Political Econ. 1990, 98, 703–738. [Google Scholar] [CrossRef]
  11. Shleifer, A.; Vishny, R.W. The limits of arbitrage. J. Financ. 1997, 52, 35–55. [Google Scholar] [CrossRef]
  12. Chan, W.S. Stock price reaction to news and no-news: Drift and reversal after headlines. J. Financ. Econ. 2003, 70, 223–260. [Google Scholar] [CrossRef]
  13. Medhat, W.; Hassan, A.; Korashy, H. Sentiment analysis algorithms and applications: A survey. Ain Shams Eng. J. 2014, 5, 1093–1113. [Google Scholar] [CrossRef]
  14. Do, H.H.; Prasad, P.; Maag, A.; Alsadoon, A. Deep learning for aspect-based sentiment analysis: A comparative review. Expert Syst. Appl. 2019, 118, 272–299. [Google Scholar] [CrossRef]
  15. Ravi, K.; Ravi, V. A survey on opinion mining and sentiment analysis: Tasks, approaches and applications. Knowl.-Based Syst. 2015, 89, 14–46. [Google Scholar] [CrossRef]
  16. Zhang, L.; Wang, S.; Liu, B. Deep learning for sentiment analysis: A survey. Wiley Interdiscip. Rev. Data Min. Knowl. Discov. 2018, 8, e1253. [Google Scholar] [CrossRef]
  17. Joloudari, J.H.; Hussain, S.; Nematollahi, M.A.; Bagheri, R.; Fazl, F.; Alizadehsani, R.; Lashgari, R.; Talukder, A. Bert-deep cnn: State of the art for sentiment analysis of covid-19 tweets. Soc. Netw. Anal. Min. 2023, 13, 99. [Google Scholar] [CrossRef]
  18. Hussain, S.; Muhammad, L.; Yakubu, A. Mining social media and dbpedia data using gephi and r. J. Appl. Comput. Sci. Math. 2018, 12, 14–20. [Google Scholar] [CrossRef]
  19. Creamer, G.G.; Sakamoto, Y.; Nickerson, J.V.; Ren, Y. Hybrid human and machine learning algorithms to forecast the european stock market. Complexity 2023, 2023, 5847887. [Google Scholar] [CrossRef]
  20. Bollen, J.; Mao, H.; Zeng, X. Twitter mood predicts the stock market. J. Comput. Sci. 2011, 2, 1–8. [Google Scholar] [CrossRef]
  21. Li, Q.; Wang, T.; Li, P.; Liu, L.; Gong, Q.; Chen, Y. The effect of news and public mood on stock movements. Inf. Sci. 2014, 278, 826–840. [Google Scholar] [CrossRef]
  22. Shahi, T.B.; Shrestha, A.; Neupane, A.; Guo, W. Stock price forecasting with deep learning: A comparative study. Mathematics 2020, 8, 1441. [Google Scholar] [CrossRef]
  23. Nguyen, T.H.; Shirai, K. Topic modeling based sentiment analysis on social media for stock market prediction. In Proceedings of the 53rd Annual Meeting of the Association for Computational Linguistics and the 7th International Joint Conference on Natural Language Processing (Volume 1: Long Papers), Beijing, China, 26–31 July 2015; pp. 1354–1364. [Google Scholar]
  24. Chen, Y.; Xie, Z.; Zhang, W.; Xing, R.; Li, Q. Quantifying the effect of real estate news on chinese stock movements. Emerg. Mark. Financ. Trade 2021, 57, 4185–4210. [Google Scholar] [CrossRef]
  25. Li, Y.; Lv, S.; Liu, X.; Zhang, Q. Incorporating transformers and attention networks for stock movement prediction. Complexity 2022, 2022, 7739087. [Google Scholar] [CrossRef]
  26. Tang, X.; Lei, N.; Dong, M.; Ma, D. Stock price prediction based on natural language processing. Complexity 2022, 2022, 9031900. [Google Scholar] [CrossRef]
  27. OpenAI. Openai: Introducing Chatgpt. 2022. Available online: https://openai.com/blog/chatgpt (accessed on 12 March 2025).
  28. OpenAI. Openai: Gpt-4. 2023. Available online: https://openai.com/research/gpt-4 (accessed on 12 March 2025).
  29. Ramjee, P.; Chhokar, M.; Sachdeva, B.; Meena, M.; Abdullah, H.; Vashistha, A.; Nagar, R.; Jain, M. ASHABot: An LLM-Powered Chatbot to Support the Informational Needs of Community Health Workers. In Proceedings of the 2025 CHI Conference on Human Factors in Computing Systems, New York, NY, USA; 2025; pp. 1–22. [Google Scholar]
  30. Edge, D.; Trinh, H.; Cheng, N.; Bradley, J.; Chao, A.; Mody, A.; Truitt, S.; Metropolitansky, D.; Ness, R.O.; Larson, J. From local to global: A graph rag approach to query-focused summarization. arXiv 2024, arXiv:2404.16130. [Google Scholar]
  31. Hang, C.N.; Yu, P.D.; Tan, C.W. TrumorGPT: Graph-Based Retrieval-Augmented Large Language Model for Fact-Checking. IEEE Trans. Artif. Intell. 2025, 1–15. [Google Scholar] [CrossRef]
  32. Jo, Y.; Oh, A.H. Aspect and sentiment unification model for online review analysis. In Proceedings of the Fourth ACM International Conference on Web Search and Data Mining, Hong Kong, China, 9–12 February 2011; pp. 815–824. [Google Scholar]
  33. Gilpin, L.H.; Bau, D.; Yuan, B.Z.; Bajwa, A.; Specter, M.; Kagal, L. Explaining explanations: An overview of interpretability of machine learning. In Proceedings of the 2018 IEEE 5th International Conference on Data Science and Advanced Analytics (DSAA), Turin, Italy, 1–4 October 2018; IEEE: Piscataway, NJ, USA, 2018; pp. 80–89. [Google Scholar]
  34. Arrieta, A.B.; Díaz-Rodríguez, N.; Del Ser, J.; Bennetot, A.; Tabik, S.; Barbado, A.; García, S.; Gil-López, S.; Molina, D.; Benjamins, R.; et al. Explainable artificial intelligence (xai): Concepts, taxonomies, opportunities and challenges toward responsible ai. Inf. Fusion 2020, 58, 82–115. [Google Scholar] [CrossRef]
  35. Samek, W.; Montavon, G.; Lapuschkin, S.; Anders, C.J.; Müller, K.-R. Explaining deep neural networks and beyond: A review of methods and applications. Proc. IEEE 2021, 109, 247–278. [Google Scholar] [CrossRef]
  36. Ribeiro, M.T.; Singh, S.; Guestrin, C. “Why should i trust you?” Explaining the predictions of any classifier. In Proceedings of the 22nd ACM SIGKDD International Conference on Knowledge Discovery and Data Mining, San Francisco, CA, USA, 13–17 August 2016; pp. 1135–1144. [Google Scholar]
  37. Zeiler, M.D.; Fergus, R. Visualizing and understanding convolutional networks. In European Conference on Computer Vision; Springer: Berlin/Heidelberg, Germany, 2014; pp. 818–833. [Google Scholar]
  38. Lundberg, S.M.; Lee, S.-I. A unified approach to interpreting model predictions. In Proceedings of the 31st Annual Conference on Neural Information Processing Systems (NIPS 2017), Long Beach, CA, USA, 4–9 December 2017; Volume 30, pp. 4765–4774. [Google Scholar]
  39. Smilkov, D.; Thorat, N.; Kim, B.; Viégas, F.; Wattenberg, M. Smoothgrad: Removing noise by adding noise. arXiv 2017, arXiv:1706.03825. [Google Scholar]
  40. Bach, S.; Binder, A.; Montavon, G.; Klauschen, F.; Müller, K.R.; Samek, W. On pixel-wise explanations for non-linear classifier decisions by layer-wise relevance propagation. PLoS ONE 2015, 10, e0130140. [Google Scholar] [CrossRef]
  41. Serrano, S.; Smith, N.A. Is attention interpretable? arXiv 2019, arXiv:1906.03731. [Google Scholar]
  42. Wiegreffe, S.; Pinter, Y. Attention is not not explanation. arXiv 2019, arXiv:1908.04626. [Google Scholar]
  43. Cheng, Z.; Zhou, J.; Wu, W.; Chen, Q.; He, L. Learning intrinsic dimension via information bottleneck for explainable aspect-based sentiment analysis. arXiv 2024, arXiv:2402.18145. [Google Scholar]
  44. Rizinski, M.; Peshov, H.; Mishev, K.; Jovanovik, M.; Trajanov, D. Sentiment analysis in finance: From transformers back to explainable lexicons (xlex). IEEE Access 2024, 12, 7170–7198. [Google Scholar] [CrossRef]
  45. Anoop, V.; Krishna, C.S.; Govindarajan, U.H. Graph embedding approaches for social media sentiment analysis with model explanation. Int. J. Inf. Manag. Data Insights 2024, 4, 100221. [Google Scholar] [CrossRef]
  46. Pruthi, D.; Gupta, M.; Dhingra, B.; Neubig, G.; Lipton, Z.C. Learning to deceive with attention-based explanations. arXiv 2019, arXiv:1909.07913. [Google Scholar]
  47. Peters, M.E.; Neumann, M.; Iyyer, M.; Gardner, M.; Clark, C.; Lee, K.; Zettlemoyer, L. Deep contextualized word representations. In Proceedings of the 2018 Conference of the North American Chapter of the Association for Computational Linguistics: Human Language Technologies, Volume 1 (Long Papers), New Orleans, LA, USA, 1–6 June 2018; Association for Computational Linguistics: Philadelphia, PA, USA, 2018; pp. 2227–2237. [Google Scholar] [CrossRef]
  48. Wolf, T.; Debut, L.; Sanh, V.; Chaumond, J.; Delangue, C.; Moi, A.; Cistac, P.; Rault, T.; Louf, R.; Funtowicz, M.; et al. Transformers: State-of-the-art natural language processing. In Proceedings of the 2020 Conference on Empirical Methods in Natural Language Processing: System Demonstrations, Online, 16–20 November 2020; Association for Computational Linguistics: Philadelphia, PA, USA, 2020; pp. 38–45. [Google Scholar]
  49. Sun, C.; Qiu, X.; Xu, Y.; Huang, X. How to fine-tune bert for text classification? In Proceedings of the Chinese Computational Linguistics: 18th China National Conference, CCL 2019, Kunming, China, 18–20 October 2019; Proceedings 18. Springer: Berlin/Heidelberg, Germany, 2019; pp. 194–206. [Google Scholar]
  50. Yang, Z.; Yang, D.; Dyer, C.; He, X.; Smola, A.; Hovy, E. Hierarchical attention networks for document classification. In Proceedings of the 2016 Conference of the North American Chapter of the Association for Computational Linguistics: Human Language Technologies, San Diego, CA, USA, 12–17 June 2016; pp. 1480–1489. [Google Scholar]
  51. Jain, S.; Wallace, B.C. Attention is not explanation. arXiv 2019, arXiv:1902.10186. [Google Scholar]
Figure 2. Comparison of the loss value of each model.
Applsci 15 06893 g002
Figure 3. Comparison of attention weight distributions between different sentences in the same article.
Applsci 15 06893 g003
Table 2. Overall sentiment analysis performance comparison of baseline and proposed models.
MethodsAccuracyF1-Score
HAN70.4470.48
FISHQA71.3271.37
BERT-Attention70.6370.61
BQGA71.3471.51
FISHDQA73.4573.16
Our Model(QGDA)75.3875.47
Table 4. Statistical analysis of stock fluctuation predictive performance across different highest attention weight queries.
Categoryp-Value (ANOVA)p-Value (t-test)
Macroeconomic Analysis0.0368<0.0001
Industry Analysis0.03680.1390
Business Analysis0.0368<0.0001
Financial Analysis0.0368<0.0001
Technical Analysis0.0368<0.0001
Disclaimer/Publisher’s Note: The statements, opinions and data contained in all publications are solely those of the individual author(s) and contributor(s) and not of MDPI and/or the editor(s). MDPI and/or the editor(s) disclaim responsibility for any injury to people or property resulting from any ideas, methods, instructions or products referred to in the content.

