Article

Fs-Laser-Induced Micro- and Nanostructures on Polycarbonate and Cellulose Acetate Butyrate for Cell Alignment

1
Institute of Applied Physics, Johannes Kepler University Linz, Altenberger Strasse 69, 4040 Linz, Austria
2
Institute of Biomedical Mechatronics, Johannes Kepler University Linz, Altenberger Strasse 69, 4040 Linz, Austria
*
Author to whom correspondence should be addressed.
Appl. Sci. 2025, 15(12), 6754; https://doi.org/10.3390/app15126754
Submission received: 30 April 2025 / Revised: 23 May 2025 / Accepted: 13 June 2025 / Published: 16 June 2025
(This article belongs to the Special Issue Ultrafast and Nonlinear Laser Applications)

Abstract

:

Featured Application

Nerve conduits for the treatment of injuries to the peripheral nervous system.

Abstract

Laser-generated structures have a huge potential to induce an alignment of biological cells, which may be important for various fields in medicine and biotechnology. We describe the formation of fs-laser-induced micro- and nanostructures for achieving the directed growth of Schwann cells, a type of glial cell that can support the regeneration of nerve pathways by guiding the neuronal axons in the direction of their alignment. Polymer surfaces, i.e., polycarbonate (PC) or cellulose acetate butyrate (CAB), were exposed to the beam of a 1040 nm Yb-based amplified fs-laser system with a pulse length of about 350 fs. With appropriate parameters, the laser exposure resulted in a surface topography with oriented micro-grooves, which, for PC, were covered with nano-ripples. Schwann cell growth on these substrates was inspected after 3 to 5 days of cultivation by means of scanning electron microscopy (SEM). We show that Schwann cells can grow in a certain direction, predetermined by micro-groove or nano-ripple orientation. In contrast, cells cultivated on randomly oriented nanofibers or unstructured surfaces show an omnidirectional growth behavior. This method may be used in the future to produce nerve conduits for the treatment of injuries to the peripheral nervous system.

1. Introduction

As we have outlined in our previous work [1], neurons play a crucial role in receiving and sending electrochemical information within the peripheral nervous system of vertebrates. Here, the neurons are essentially supported and protected by glial cells. Among these, Schwann cells are particularly significant. They are responsible for forming myelin sheaths, which insulate and protect neuronal axons [2], and are indispensable for axon regeneration following injury [3]. Peripheral axons regenerate within regeneration tracks, which consist in principle of parallelly aligned glial cells [4]. While small gaps in axons can regenerate independently, larger gaps typically require the assistance of a nerve graft. Peripheral nerve injuries often leave life-long disabilities affecting millions of people worldwide. In Europe alone, the typical annual number of nerve repair procedures exceeds 300,000, and this is projected to increase over time. The global peripheral nerve injury market size was estimated at USD 1.65 billion in 2024 and is expected to grow at a compound annual growth rate (CAGR) of 7.80% from 2025 to 2030 [5].
The current gold standard for treating nerve injuries involving large gaps is the use of autografts. However, this approach has notable limitations, such as donor site morbidity and the requirement of a second surgical procedure, highlighting the need for improved alternatives. One such alternative is nerve allografts, which circumvent the drawbacks of autografts but necessitate approximately 18 months of immunotherapy to prevent graft rejection [6]. A third option for addressing large nerve injuries is the use of synthetic neuronal implants. These commercially available implants are typically hollow tubular channels that connect the two severed nerve ends, aiming to enhance the growth of newly formed axons, i.e., more axons growing longer and faster [6]. To be effective, nerve conduits must possess key properties such as biocompatibility, biodegradability and appropriate mechanical and biochemical characteristics. However, significant challenges remain, including issues like incorrect target innervation and axonal dispersion. Additionally, the repair length in humans achievable with current implants has its limitations. Gaps of more than 3 cm are considered to be critical [6]. For larger nerve gaps spanning several centimeters, the success rates of artificial nerve grafts remain insufficient. A critical factor here is the stimulation of the Schwann cells from their surrounding environment, such as the extracellular matrix (ECM) or, in the case of artificial implants, the supporting material, which can influence their elongated alignment and therefore the regeneration of the axons [3,7].
One potential approach to guiding Schwann cells is the employment of silk materials from nature. For example, the studies reported in [8,9] highlight promising advancements in utilizing natural silk fathoms produced by spiders for guiding newly formed neuronal axons. However, collecting spider silk fathoms is expensive and requires a lot of time. As an alternative, synthetic electrospun fibers with sub-µm diameters offer a more practical solution. Early research efforts in this direction have been documented in [10].
Recently, it has been shown that Schwann cells grow significantly faster and with better directionality on spider silk with parallel grooves, with periodicities and heights in the dimensions of a few micrometers, compared to smooth spider silk fibers without grooves [11]. An interesting material in this aspect is cellulose acetate butyrate (CAB). CAB is a biocompatible and biodegradable polymer, its main part being the biomaterial cellulose with attached acetyl and acyl rests. It is used as artificial silk and can be prepared in fiber form by electrospinning. Electrospun CAB nanofibers with longitudinal nano-grooves on the fiber surface were used for the regeneration of nerves in rats [12].
One possibility for guiding and aligning cells is to create a substrate with laser-induced nanoripples. These structures, commonly referred to as LIPSS (which stands for laser-induced periodic surface structures) may be created using pulsed laser processing techniques with pulse lengths from the ns down to the fs range [13]. Earlier studies have shown that adherent cells can be influenced by underlying laser-generated nano- and microstructures, or hierarchical combinations of both [14,15,16]. Depending on the specific structural design, various cellular behaviors can be influenced. This includes determining how cells adhere, proliferate, or migrate; inducing that cells align; enhancing extracellular matrix protein production; or promoting progenitor cell differentiation into specific phenotypes. Notably, we have demonstrated previously that laser-generated sub-µm ripples and dual-scale hierarchical micro/nanostructures may effectively regulate how Schwann cells attach and migrate, at least on silicon surfaces [17]. Also on polymers, laser-induced micro- and nanostructures on the surface were used to determine that biological cells grow with a defined orientation [18]. In our recent work, we demonstrated the alignment of Schwann cells on LIPSS produced with a 248 nm KrF* excimer laser using ns pulses on polyethylene terephthalate (PET) [1].
In this work, we present for the first time detailed experiments where polycarbonate (PC) or CAB samples were irradiated with a near-infrared (NIR) 1040 nm Yb-based fs laser, while in previous work on LIPSS formation on PC samples, ultrashort laser pulses in the ultraviolet (UV) spectral range were used [19,20]. We structured the polymer surfaces by fs IR laser exposure and then seeded Schwann cells on the structured samples. The structured samples with and without cells were characterized by electron microscopy. Additionally, the polymer materials were measured by infrared spectroscopy.

2. Materials and Methods

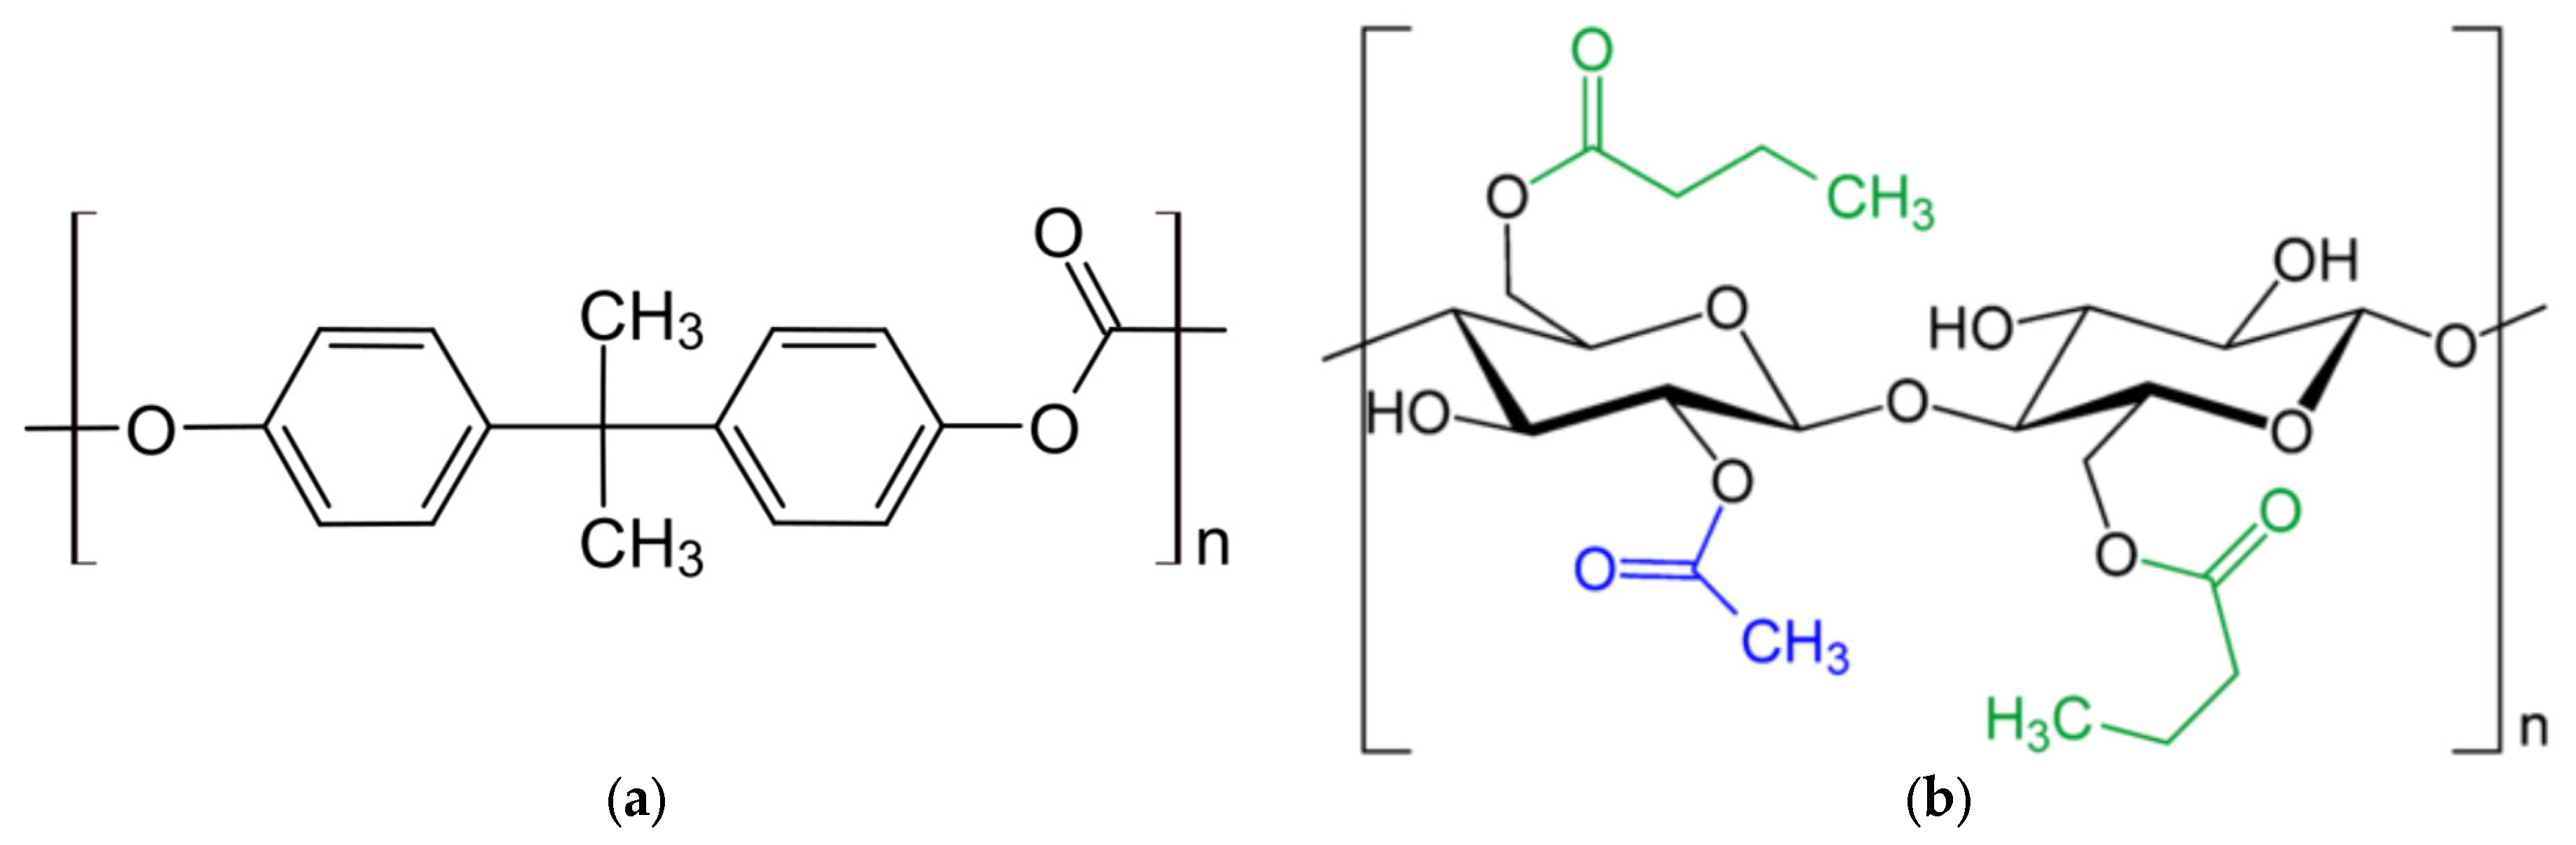
2.1. Polymer Samples

The first material was polycarbonate (PC). The chemical structure of PC can be seen in Figure 1a. As a source for this sample material, commercial recordable compact disks (CDs) of the brand Platinum® (CD-R, 700 MB, BestMedia, Hohldorf, Germany) were used, which were cut into small pieces using a manual knife (to ensure the lowest possible stress and damage to the material). To make sure the CDs were really made from PC, Fourier transform infrared spectroscopy in the attenuated total reflection mode (FTIR-ATR) was performed on a small test sample, which is shown in Figure S1a in the Supplementary Materials. The spectrometer used was a Bruker-Equinox 55 (Bruker, Karlsruhe, Germany). In the spectral range between 400 and 4000 cm−1, the same absorption peaks occurred as reported in the literature for PC, for instance in [21]. As the second polymer, cellulose acetate butyrate (CAB) was used. CAB is a biocompatible and biodegradable polymer with its main part being the biomaterial cellulose with attached acetyl rests of acetic acid and acyl rests of butyric acid. A representation of the molecule can be seen in Figure 1b. Two different CAB materials were used. One was produced via an extrusion process (further referred to as extruded CAB). For the extrusion process to work, some softener was added to the CAB (substance not mentioned by manufacturer of raw material). The fabrication of the extruded CAB was performed by heating up small CAB pearls (CELLIDOR B 501-10, MOCOM Compounds GmbH & Co. KG, Hamburg, Germany) and pressing them into the desired shapes. The other one was made by heating up CAB powder (product number 419044, average molecular weight Mn ≈ 70,000), which was produced by Sigma Aldrich (Merck, Darmstadt, Germany), and then pressing it from either one or both sides (further referred to as pure CAB). Sigma Aldrich (Merck, Darmstadt, Germany) claims in the specification sheet provided with this material that it has a purity of better than 97% and that the infrared spectrum conforms to the structure [22]. For the extruded CAB, we have no information about the purity, but a comparison of the FTIR-ATR spectra, shown in Figure S1b,c in the Supplementary Materials, show that the spectral lines of the pure CAB and extruded CAB are practically identical. Only the line intensities of the extruded CAB were comparably weaker, which was due to worse contact with the ATR prisms due to the higher stiffness of this thick material and its rather rough surface.
The typical sample size of the polymers used for laser-structuring and the cell experiments was approximately 2 cm × 2 cm, with a thickness of 1.2 mm for PC, 4 mm for the extruded CAB and about 0.4 mm for the pure CAB, respectively. In some cases, broken parts of these samples were used. The original form of the extruded CAB was bone-shaped, with a length of 17 cm and a width of 2 cm at the ends and 1 cm in the middle of the extruded parts.

2.2. Laser-Structuring

Ultrashort pulsed fs lasers enable the creation of extremely fine surface structures, as surface thermal melting typically does not occur during laser processing. In this study, laser processing was carried out using an Ytterbium-based amplified Spirit 1040-16 HE femtosecond laser system (Spectra Physics, Rankweil, Austria). This laser had a wavelength, λ, of 1040 nm; a pulse length, τ, of 350 fs; a typical laser power, p, between 5 and 50 mW; and a repetition frequency, f, of 500 Hz to 5 kHz. A lens with a focal length of 100 mm (LB1676-B-ML, Thorlabs, Bergkirchen, Germany) was used to focus the linearly polarized laser beam onto the sample. The resulting beam profile was Gaussian-shaped with a beam waist, 2w0, of 75 µm. Before the lens, we measured the power, p, using a power-meter TPM-A.1 (Gentec, Olching, Germany). The calculation of the corresponding pulse energy, E, and peak fluence, F0, took into account a loss of approximately 6.7% due to the passage through the lens. To obtain the lateral movement of the samples (fixed with double-sided tape) into the x- and y-directions during the irradiation, we used two linear mechanical positioning stages. This setup could be used either in a scanning mode or in a burst pulse mode. The active mode was chosen by a switch box. For line scanning, stage velocities vscan = 1000 to 2000 µm/s were used. Each line could be scanned once or several times in a sequence (in the so called “overscan” mode). The line distance ΔS between neighboring lines was typically 20 to 70 µm. On each sample, several regions with laser-induced structures were generated. The samples were cleaned before the laser treatment with ethanol and dried by nitrogen gas. After the laser treatment, this procedure was repeated. For CAB, this cleaning step was performed in an ultrasonic bath (for a duration of 600 s).
The laser beam waist, 2w0, at the focus was determined using measurements obtained with the 14-bit digital camera system WinCamD (DataRay, Boulder Creek, CA, USA) at various positions relative to the focus, and its value was extrapolated from measurements taken some distance away from the focal point. We assumed a Gaussian beam profile, which was fulfilled according to our beam profile measurements. The formulas describing Gaussian beams are well known in the literature [25,26]. The radial fluence distribution is given by
F r = F 0   e x p 2 ( r 2 / w 0 2 ) .
Given a lens transmission Tlens = 92.3%, the following relationship holds for the dependance of the laser pulse energy, E, on the laser power, p, measured before the lens and the frequency, f
E = p / f · T l e n s .
According to this definition, the peak fluence, F0, and the laser pulse energy, E, are linearly related through the following equation
F 0 = E / ( 0.5 π w 0 2 ) .
For the pulse burst mode, the number of pulses, N, per area is defined by the irradiation time and the pulse repetition frequency, f, while for line scanning at a constant velocity, vscan, an effective irradiation time is given be the ratio of the beam waist, 2w0, and vscan. This results in an effective pulse number, Nline, expressed as
N l i n e = 2 w 0 f / v s c a n .
In the case of multiple overscans, Nline has to be multiplied by the number of overscans #os. Please also keep in mind that non-uniformities in pulse distribution arise due to the use of laser spots with Gaussian beam profiles. However, Equation (4) assumes uniform pulse overlap in two dimensions.

2.3. Cell Cultivation

To validate and demonstrate oriented cell growth on the samples produced using the methods described above, murine Schwann cells (Immortalized Mouse Schwann Cells (IMS32), T0295, Applied Biological Materials Inc., Richmond, BC, Canada) were cultured for 3 to 5 days. The cells were maintained in 4 mL of growth medium composed of PriGrow III (TM003, Applied Biological Materials Inc., Richmond, BC, Canada) supplemented with 10% fetal bovine serum (FBS) (F7524, Sigma-Aldrich, St. Louis, MO, USA) and 1% Penicillin/Streptomycin solution (G255, Applied Biological Materials Inc., Richmond, BC, Canada). The cultures were incubated at 37.0 °C with 5% CO2 in an incubator (New Brunswick Galaxy® 48 S CO2, Eppendorf, Hamburg, Germany). The growth medium was replaced every two days. Cells were seeded onto the samples at an initial density of 25,000 cells per cm2.

2.4. Preparation for Electron Microscope Investigation

Scanning electron microscopy (SEM) imaging provides a relatively quick and straightforward method for assessing cell coverage on surfaces, though it requires several days of sample preparation. After 3 to 5 days of incubation, the samples were retrieved and prepared for SEM analysis. The preparation process involved rinsing the samples with phosphate-buffered saline (PBS), followed by fixation in 6.25% glutaraldehyde (SERVA Electrophoresis GmbH, Heidelberg, Germany) in PBS overnight. The samples were then dehydrated through a graded ethanol series, and final drying was performed using hexamethyldisilazane (HMDS, Carl Roth GmbH + Co. KG, Karlsruhe, Germany) overnight to prevent the deformation and shrinkage of the structures. Once dried, the samples were sputter-coated with a gold layer for 80 s at 22 mA. The coated samples were subsequently examined using a scanning electron microscope (1540 XB, Zeiss, Oberkochen, Germany) at an acceleration voltage of 5 kV. Control samples without cells were only sputter-coated with gold and directly analyzed with SEM.

3. Results

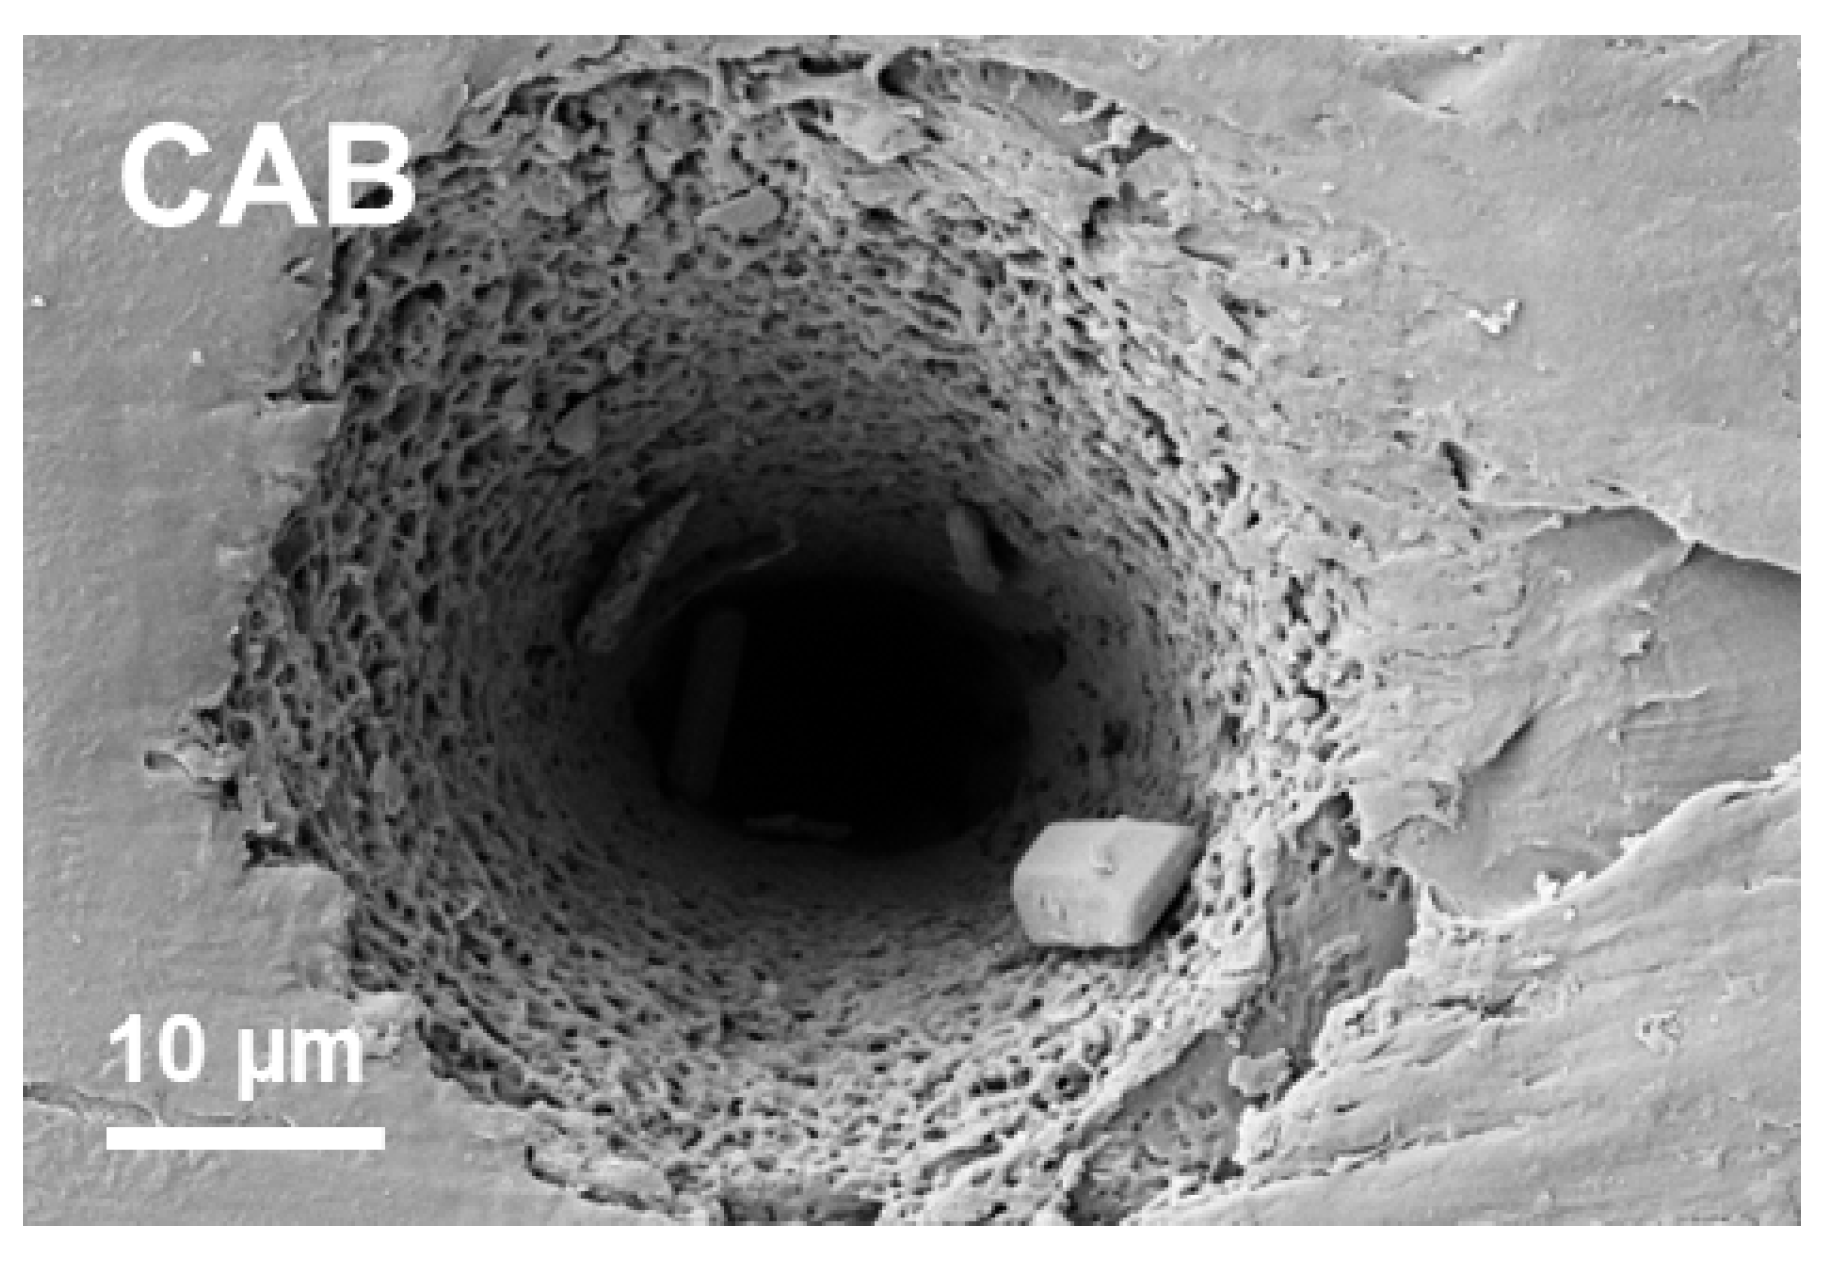
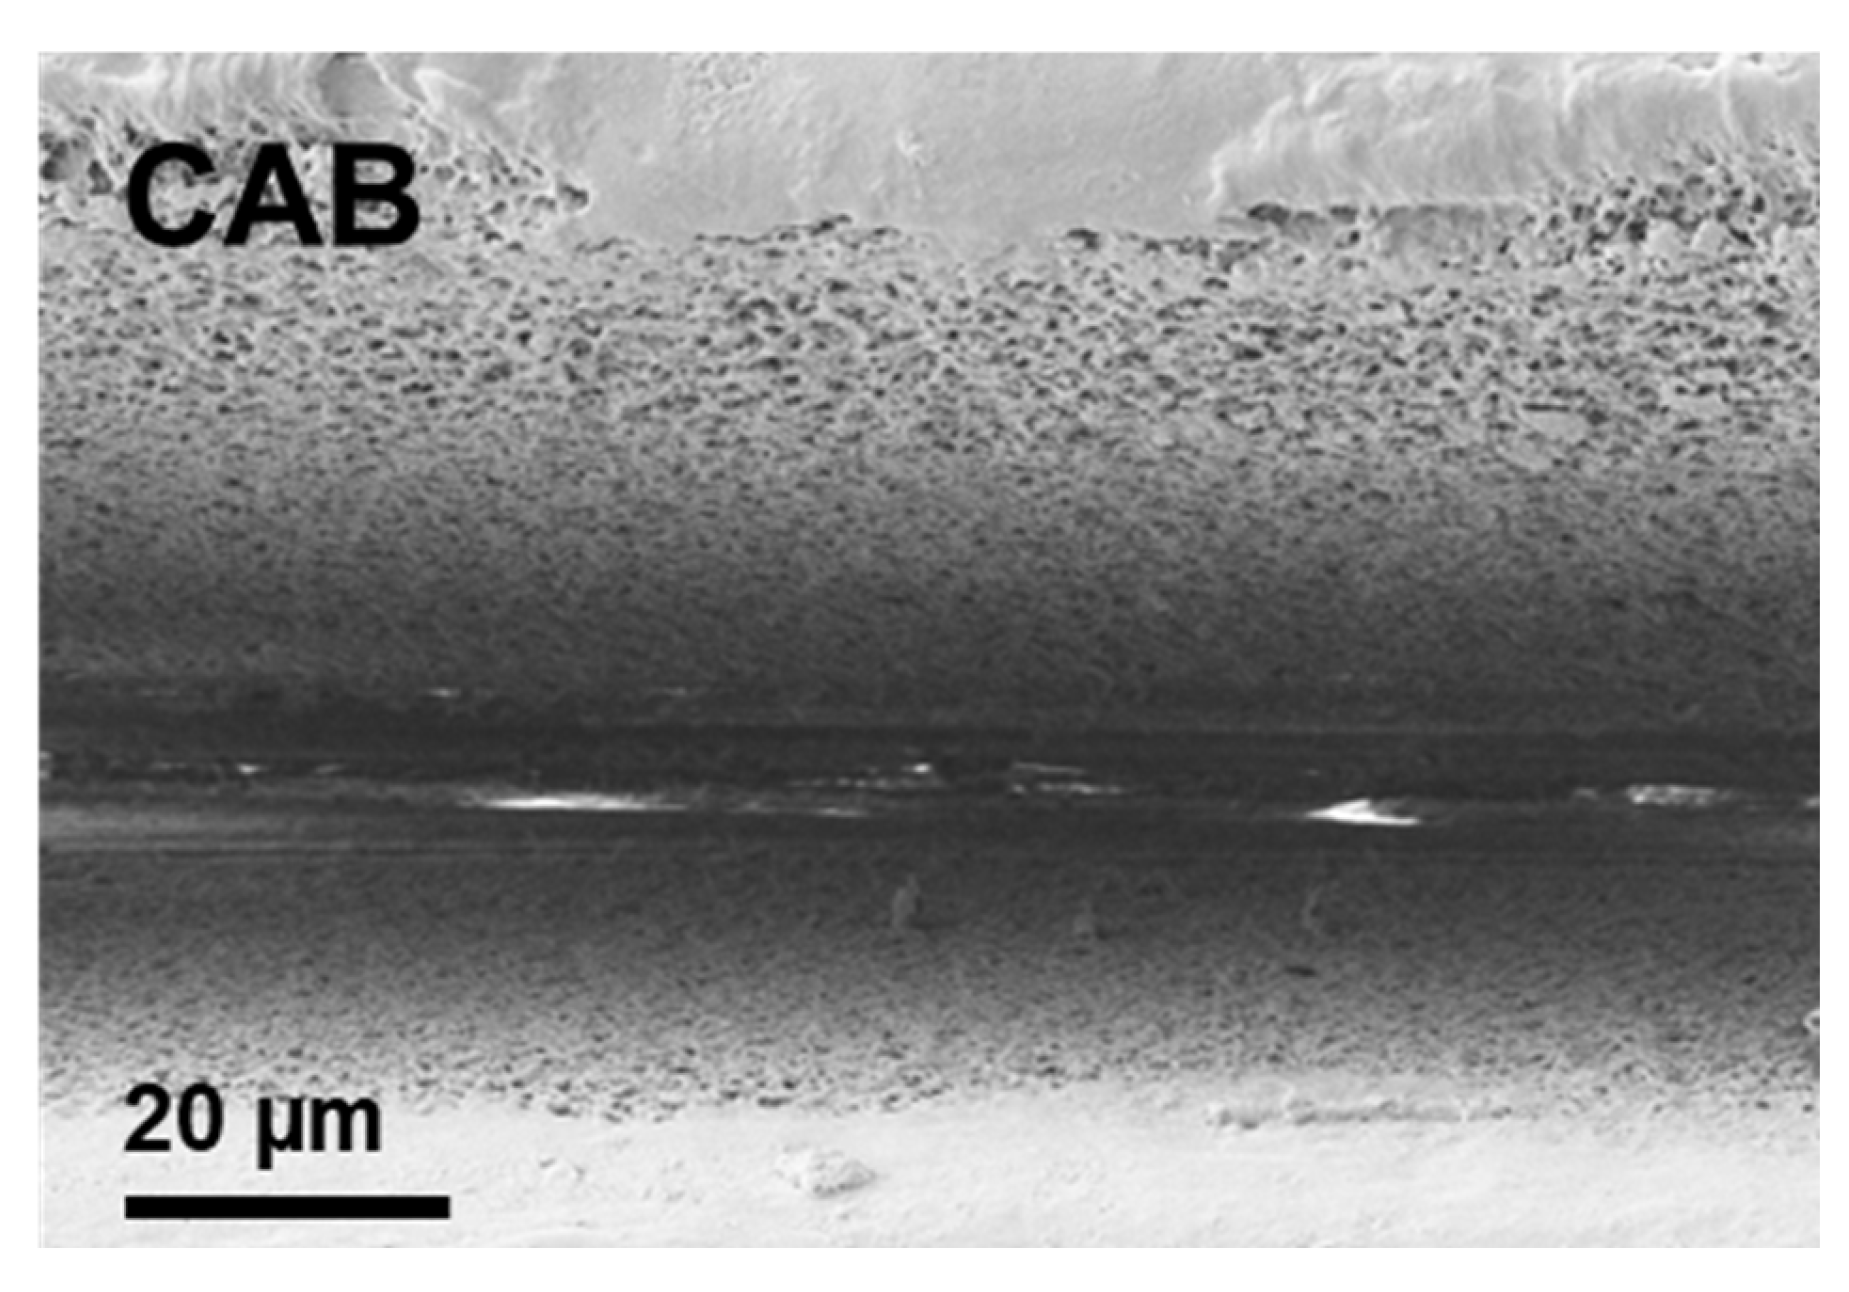
3.1. Single-Pulse-Burst Craters

For the PC samples, a low number of pulses was first tested, beginning with N = 1 and rising up to 100 pulses at a relatively high laser powers (p = 40 to 78 mW). A representative image of this experimental series is shown in Figure 2a. All the produced craters in this experiment series showed the same structure inside the crater and no structure around the crater. The inside shows an irregular sponge-like structure, like the one observed later with extruded CAB, with a high surface area.
With lower laser powers (range p = 8 to 20 mW), the number of pulses was increased to compensate for the reduction in laser power (N = 500 to 1000). In this parameter range, we found that our PC samples showed laser-induced periodic surface structures (LIPSS). In some cases, both LIPSS variants (as described, for instance, in [13]) could be observed on the same sample: (1) high-spatial-frequency (HSF) LIPSS inside the crater and at the edge; (2) low-spatial-frequency (LSF) LIPSS appearing faintly in a first ring around the crater (orientated approximately perpendicular to the HSF-LIPSS), followed by a second ring of debris. In Figure 2b, the ring containing the LSF-LIPSS can be seen in between the two added red circles. For p = 11 mW and N = 500, a similar result was observed.
Details from Figure 2b can be seen in Figure 2c,d. Figure 2c is a zoom-in, where an area covered with LSF-LIPSS, which was before located between the two red circles, is better visible. In Figure 2d, the HSF-LIPSS can be clearly seen in the bottom left corner, and LSF-LIPSS are visible in the neighboring areas to the right and above. These two structures together are only observed in fs-laser processing. They form perpendicular to one another. Please note that the LSF-LIPSS are shallow and rather indistinct. The power range in which the structures could be observed was small (p = 11 mW with N = 500 or 750 to p = 15 mW with N = 500, corresponding to a peak fluence range from F0 = 0.92 to 1.25 J/cm2). At laser powers below p = 10 mW, only the HSF-LIPSS inside the crater could be observed, as well as with powers above p = 15 mW. Figure 3 shows a typical image of the structures inside a single-pulse-burst crater in this parameter range. Here the nominal laser power was p = 8 mW and the focus position was about 50 μm below the surface of the PC sample. Only a part of the surface is covered with HSF-LIPSS. Interestingly, the HSF-LIPSS form preferentially on some terraces within the irregular sponge-like structures.
For the extruded CAB samples, several craters with different number of pulses were achieved using the pulsed mode of the laser setup. Figure 4 shows a typical crater with a diameter of 40 to 45 μm, which is already quite small. The diameters of the craters can vary significantly for this material (e.g., p = 13 mW resulted in diameters from 20 to 50 μm). Inside, the craters show a sponge-like structure without spatial regularity. This structure could be observed in power ranges from p = 12 to 18 mW. Below p = 10 mW, the craters are slightly bigger but show a smooth surface, indicating that the sample is melting during the structuring process. A laser power increase here also increased the depth of the craters. The same effect could be observed when increasing the number of pulses.
A wide laser power range from p = 7 to 26 mW was tested for extruded CAB, with the number of pulses for the crater varying from N = 100 to 1000. In none of the cases, LIPSS could be observed, but only a sponge-like structure without a spatial regularity, as in Figure 4.

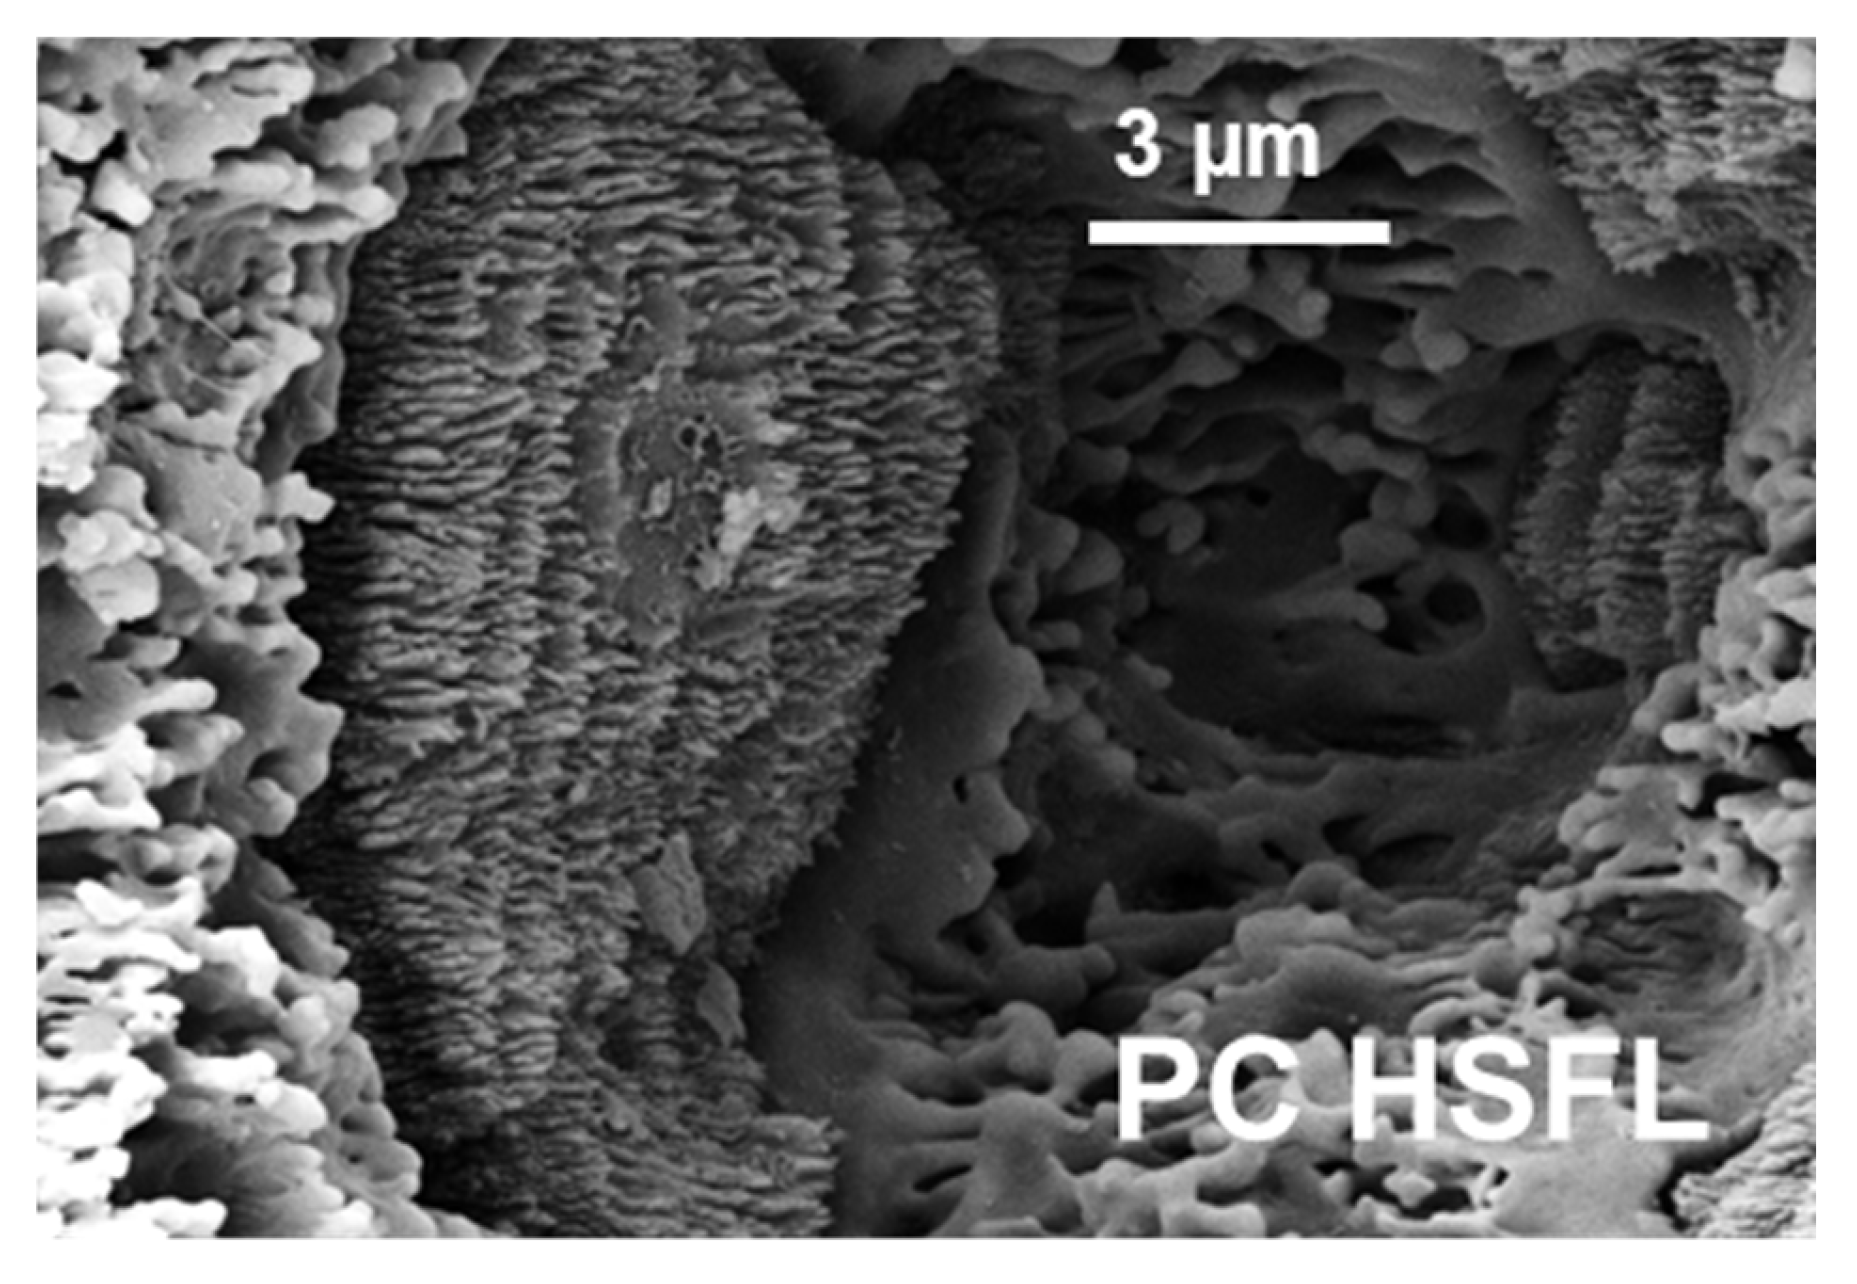
3.2. Single- and Multiple-Overscan Lines

For PC, we systematically investigated the dimensions of the laser-written lines. The line width was measured with SEM. The main results are shown as Figure S2 in the Supplementary Materials. We observed a linear dependence of the square of the line width (or line radius) and the natural logarithm of the laser pulse energy, as is expected for a Gaussian laser beam profile. This has been discussed in more detail, for instance in [25].
The most promising results for the manufacturing of HSF-LIPSS-covered lines on PC were obtained using up to 100 overscans with moderate laser powers and relatively low repetition rates. Figure 5a shows an overscan line which is almost completely covered with HSF-LIPSS. This line showed a uniform distribution of HSF-LIPSS at the sidewalls and the formation of a debris area around the line. In this debris area, LSF-LIPSS are sometimes faintly visible, as previously observed in the craters (see Figure 2c). However, they are so indistinct that obtaining images of them was found to be difficult, and no good image can be presented here. The line width for 9 mW was 50 μm and the line width including the debris area (referred to as the outer line) 63 μm. Figure 5b shows a higher-magnification image of an 8 mW overscan line. The depth and the width of this line are slightly smaller than for the 9 mW line. The sidewalls are still not entirely covered with HSF-LIPSS, which form preferentially on some plateaus, similarly to in the crater in Figure 3.
To structure an area at least 2 × 1 mm2 (necessary for the cell experiments), multiple 100-overscan lines must be stacked. The whole line array was written once before starting the next overscan. Figure 5c shows an image of multiple-overscan lines with ΔS = 70 µm line spacing. The unstructured flat PC surface remains unaffected between the lines, and some debris fragments are also clearly visible. The LIPSS on the sidewalls of the lines can be seen by zooming in.
With 100 overscans, HSF-LIPSS-covered lines were found in a power range between 7 and 11 mW. Lines with fewer overscans at 9 mW power already showed some HSF-LIPSS with 20 overscans (slightly less than the 7 mW line with 100 overscans). For the other powers in this range, we only observed HSF-LIPSS after at least 50 overscans. An increase in laser power could also cause the HSF-LIPSS to disappear. Instead, an irregular sponge-like structure appeared, as previously observed for the craters at high laser powers (see, for instance, Figure 2a). An exemplary line pattern, where only irregular sponge-like structures can be seen on the laser-irradiated surface, is shown in Figure 5d.
For pure CAB, the best, most promising line results were obtained with a laser power of 20 mW. This is shown exemplarily in Figure 6. In this image, the irregular sponge-like structure previously observed in the craters (see, for instance, Figure 4) can be seen on the sidewalls of the line. The line shows a width of 50 μm, which should be well suited for the cell experiments. At considerably lower laser powers, the material just melts, which was confirmed with multiple-overscan lines as well as with craters.

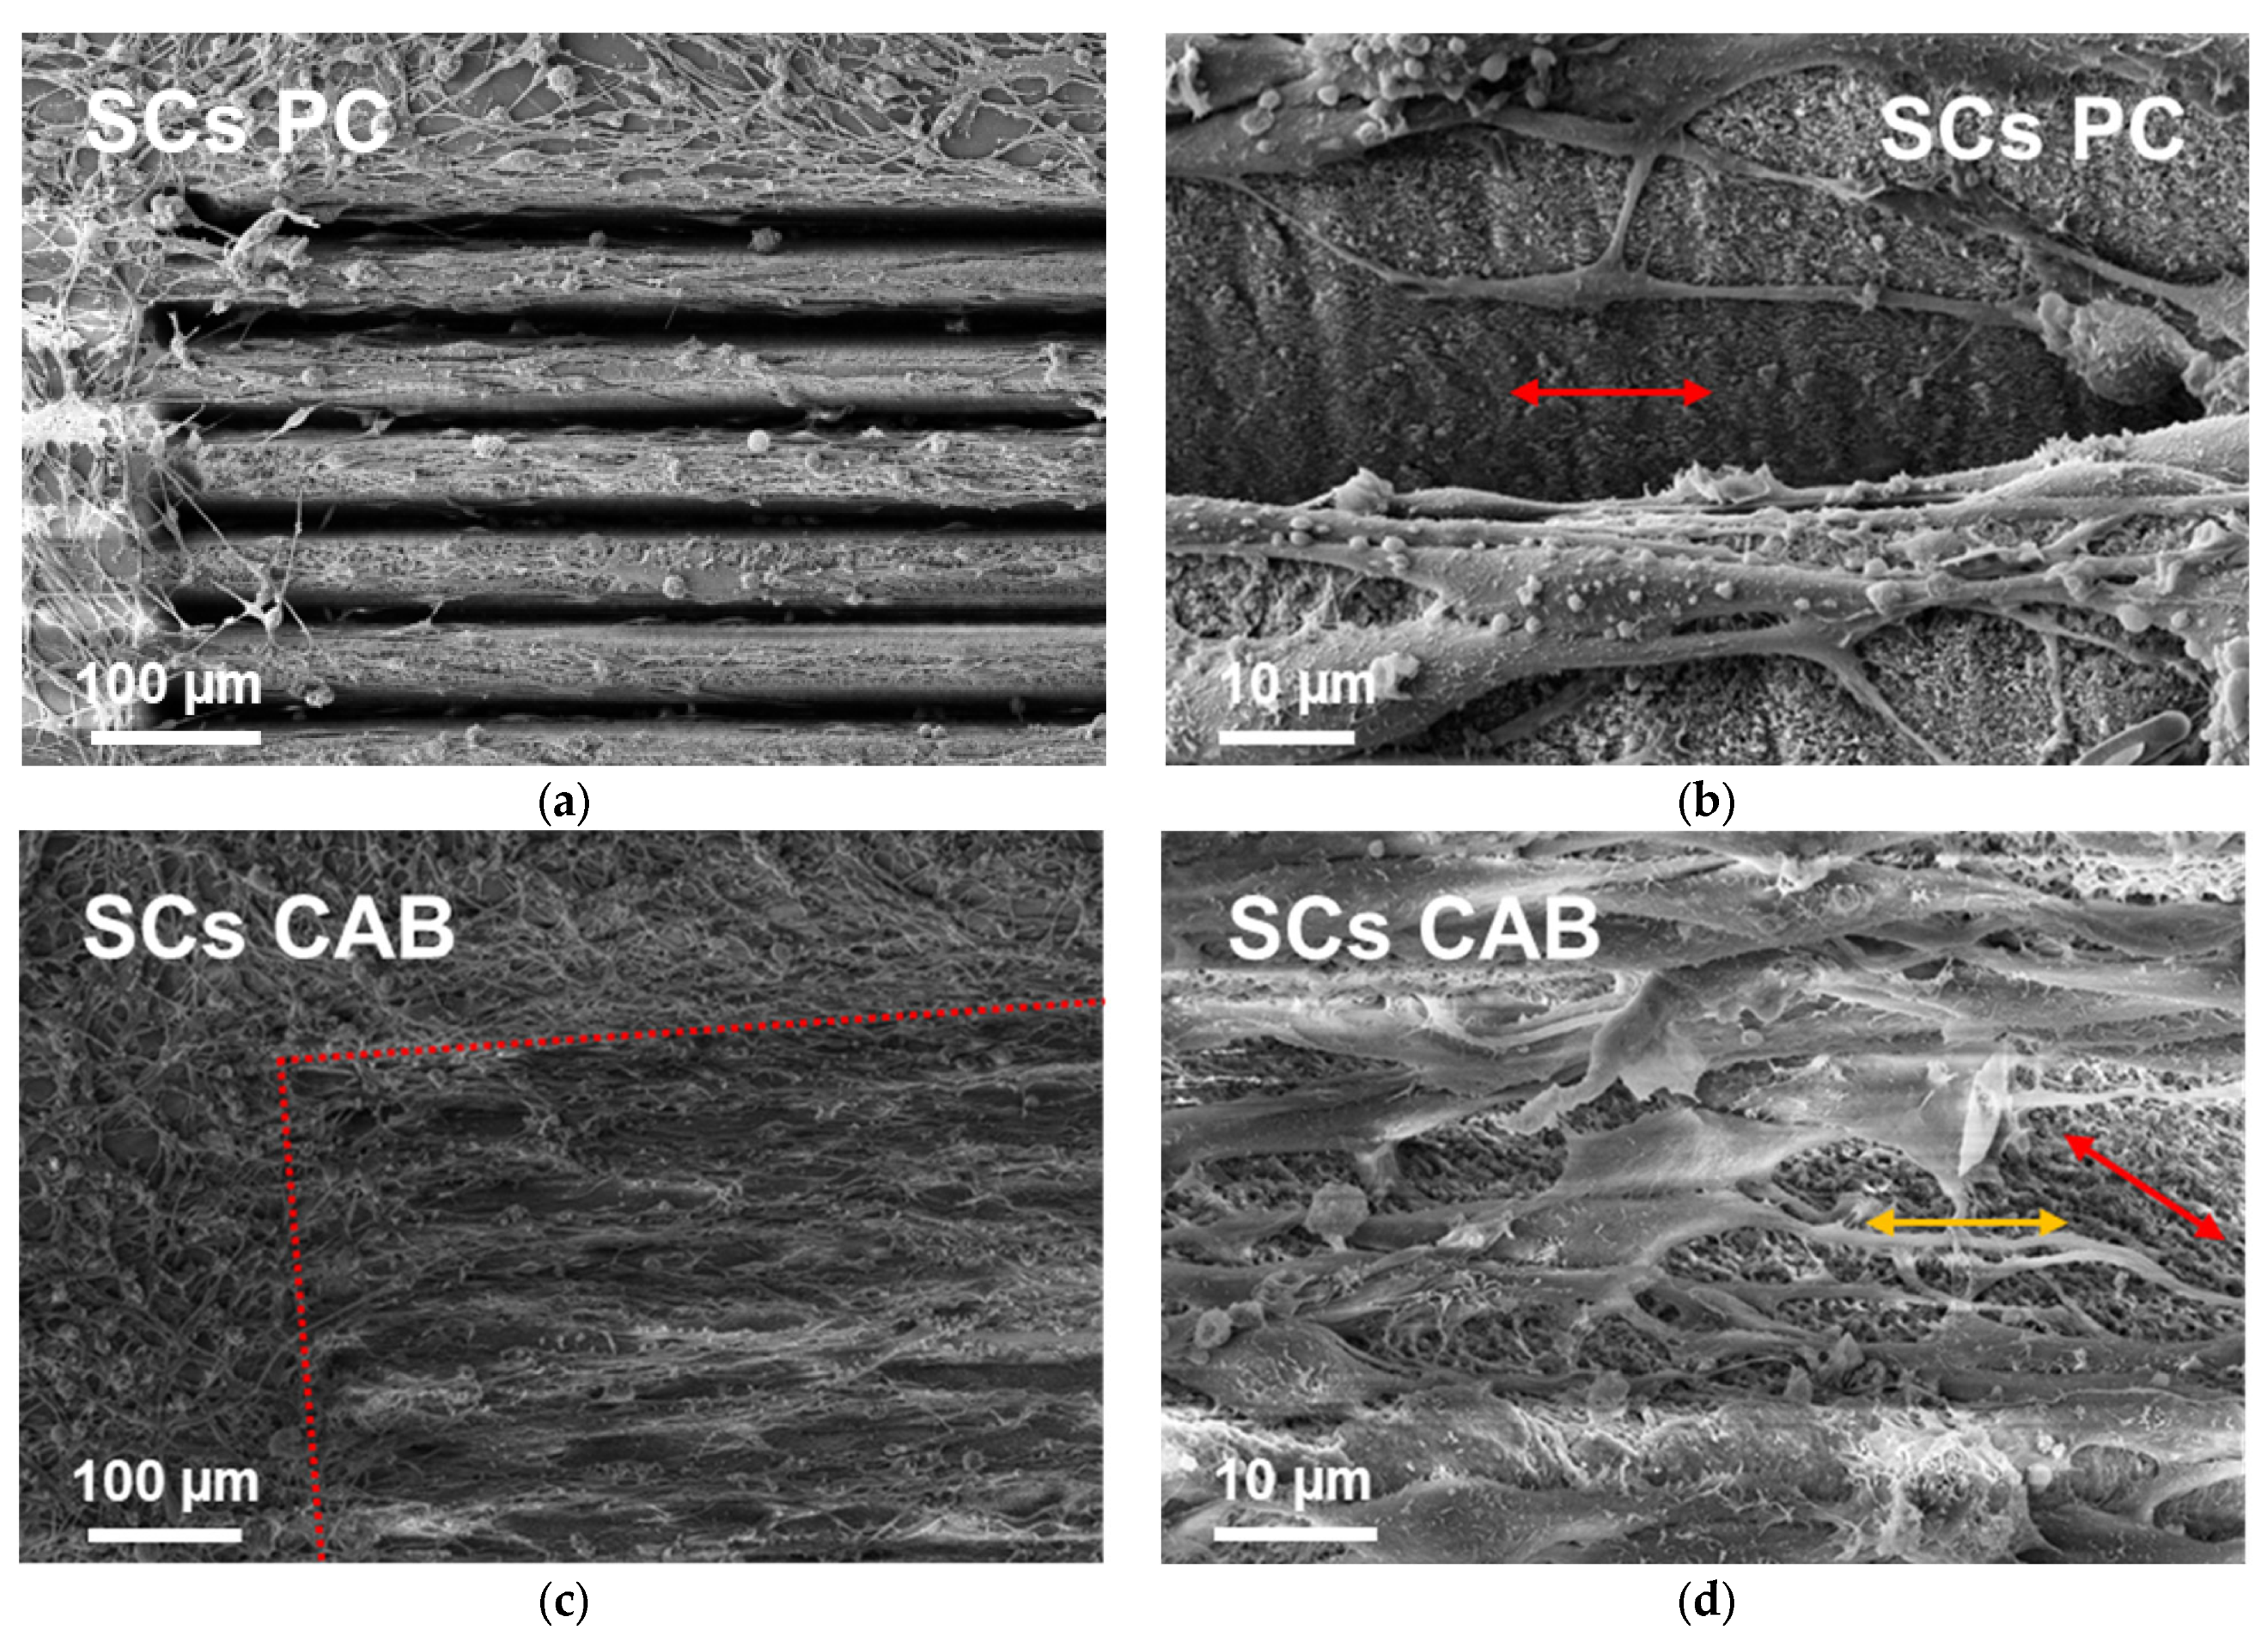
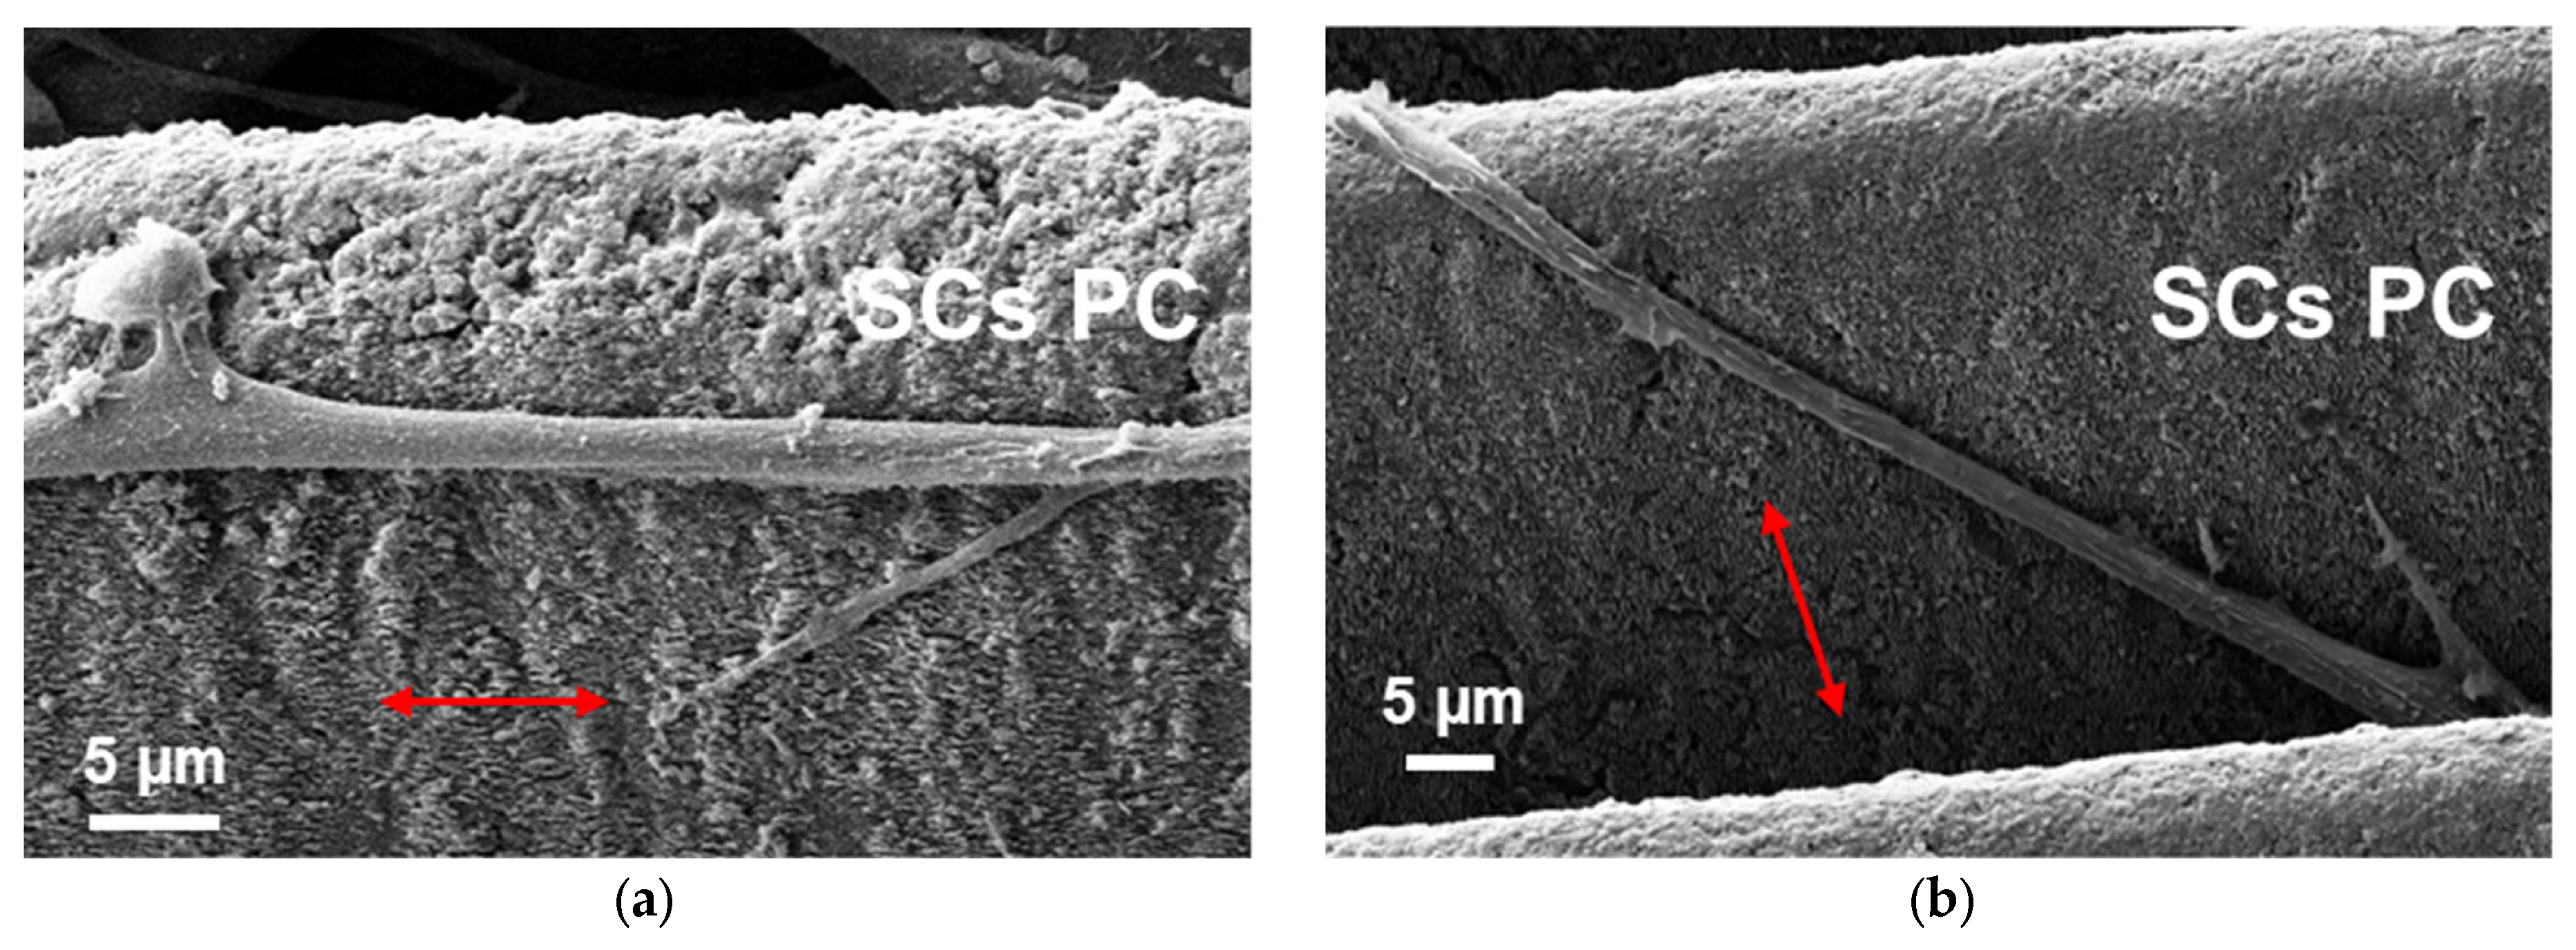
3.3. Schwann Cells Growing on Laser-Written Lines

Figure 7 shows SEM images of Schwann cells growing on laser-written lines after 5 days in culture. These sample show a far higher coverage with cells than the ones cultured for 3 days, but the laser-written squares can still be seen quite easily with SEM.
Figure 7a shows an overview for PC. Here, cells also grow outside of the lines and show no directional growth. But whenever the laser-written lines are present, the cells not only show an alignment but have the tendency to also be on the sidewalls of the line, where the HSF-LIPSS are located. They grow even more on the lines that show an ablation of the topmost layer of the PC. This indicates that the cells prefer not to grow on the laser-treated areas of the PC surface. Figure 7b shows a higher-magnification SEM image of Schwann cells on laser-written lines on PC. The sample was tilted 45° to enable a closer look at the sidewalls. The alignment of the cell protrusions (i.e., the lamellipodia) can be seen well. Between the cells, it is visible that the topmost layer of the PC sample was slightly ablated, and that cells grow there. The HSF-LIPSS also probably have a guiding effect on these cell protrusions, but it seems that the line itself has the major effect on the alignment.
Figure 7c shows an overview for pure CAB. The cell coverage on this sample is so high that the structured areas are difficult to find. To make it clear where the structured area is in Figure 7c, red lines are added. These red lines indicate the edges of the structured area. The cells outside of the red marks show no directional growth, whereas inside they show alignment along the laser-structured lines. With a closer look, it is also possible to see the irregular, sponge-like structure in between the cells of the not-so-densely cell-covered area in the valleys between the lines. The cells show a tendency to stay at the top section of the lines. The spacing of the lines with ΔS = 55 µm was chosen so that a small bridge of unstructured surface remained in between the laser-written lines. The cells seem to stack on top of this small bridge. Some of them also attach to the sidewall or even grow across the laser-written line to the other sidewall. Figure 7d shows a more detailed SEM image. The main directions of the cell protrusions (marked by the orange and red arrows) seem to react to the irregular, sponge-like structure by growing in a similar, but not identical direction, which is indicated by the red arrow. This means the nanostructures may add to the alignment of the Schwann cells of this sample to a certain degree. But the microstructure, the lines themselves and especially the unstructured small bridges between them, seems to play the major role in the alignment process of the cells.

4. Discussion

In Figure 2c,d, we see two types of ripple structures for laser-structured PC, one with a periodicity Λ of about 750 nm and a second one with a periodicity Λ of about 200 nm. They are oriented perpendicular to each other and parallel and perpendicular to the linear polarization of the laser light, respectively. In accordance with the classification reported for the ps-laser-structuring of PC [19], we address the first type as low-spatial-frequency (LSF) LIPSS and the second type as high-spatial-frequency (HSF) LIPPSs. The latter also occurred inside the craters and on the sidewalls of the samples shown in Figure 3, Figure 5a–c and Figure 7a,b. However, we want to point out that the sequence of the LIPSS types is different in our work in comparison to that in [19]. In our case, the LSF-LIPSS are outside of areas where the HSF-LIPSS are observed, while in [19] it is the other way round. This means that, in our case, due to the Gaussian beam profile, the HSF-LIPSS occur at higher laser fluences than the LSF-LIPSS. This discrepancy with the results in [19] may be related to the fact that they used a UV laser light, where the PC absorbs considerably more light than at our laser wavelength in the NIR region. Therefore, we needed fluences F0 of at least 500 mJ/cm2 for the structuring of the PC, while the experiments in [19] were performed with fluences F0 of only a few tens of mJ/cm2. These different fluence ranges may cause different mechanisms of ripple formation.
For both studies, rather higher pulse numbers per area were used, especially for the lines with multiple overscans. These high pulse numbers may lead to photodegradation effects on the PC, as is described, for instance, in [27,28]. This photodegradation can result in a step-wise change in the optical properties of the samples during multi-pulse laser irradiation is often addressed as the incubation effect. For this reason, we have discussed our results in terms of laser power instead of laser fluence, as these incubation effects would probably scale with the power.
In [19], the effect of an increased bulk temperature on structure formation is also discussed. In this paper, it is mentioned that, in the case of PC, the LIPSS, especially the LSF-LIPSS subvariant, are not formed at the surface but in a sub-layer at a certain temperature. This temperature lies, in the case of polycarbonate, near the glass transition temperature (~150 °C). We also performed laser-irradiation experiments at elevated bulk temperatures. Overall, these experiments showed that the heating of the sample during the structuring process in the NIR region and for fs pulses also leads to a lower necessary laser power for the formation of the same amount of LIPSS, as was also observed in the UV region. The effect in the NIR region is far smaller than in the UV region, probably due to the lower absorption of PC in this wavelength range. That the effect is rather small means, for instance, that for p = 9 mW at room temperature we obtained roughly the same amount of LIPSS for 100-overscan lines as for p = 7 mW lines at 50 °C.
For PC as well as for CAB, the sponge structures appear at relatively high laser powers. It seems that the material is becoming hot enough to make the transition to the gas state in some local areas. This gas may then leave the sample and leave behind this sponge-like irregular structure. This explanation is supported by the fact that, at least for CAB, lower laser powers led to lines with molten sidewalls, as the temperature may not have been high enough for evaporation. In the NIR spectral range, CAB exhibits a very low absorption of laser light. This could be one reason that some characteristic laser structures, like the HSF-LIPSS on PC, do not appear in the experiments with CAB, as they require an appropriate amount of laser light to be absorbed.
In our previous work [18], we have shown that LIPSS on polymer surfaces can be used to align different kinds of mammalian cells along the ripples. This effect starts with an orientation of the cell protrusions, i.e., the filo- and lamellipodia. This alignment takes place when the periodicity of the ripples is above a critical value, which depends on the cell type. As shown in Figure 8, we produced lines on PC whose sidewalls were covered with LIPSS running parallel or perpendicular to the line direction (indicated by the red arrows). In both images, cell protrusions of individual Schwann cells are visible; however, they are only partially aligned along the ripple direction. This may be an indication that the HSF-LIPSS on PC are slightly too small regarding structure height and/or periodicity to achieve full alignment.
The extruded CAB variant was the only material in this study showing no alignment effect for Schwann cells after laser-structuring. This is due to barely any cells attaching to the surface during the 5 days of culture time. The pure CAB variant with an identical culture time showed a dense coverage of the sample, which leads to the conclusion that the added softener in the extruded CAB is most likely cytotoxic. It is supposed that the increased capability of certain cellulose-based materials to take up water and to retain it under humid environmental conditions favors cellular attachment and growth [29,30]. This scenario probably does not apply as an explanation for the cell-repellent property of the extruded CAB material, as after heat treatment, which probably removed the cytotoxic softening agent in the materials but also eventually retained water, some Schwann cells could be cultured on the material again.

5. Conclusions

Laser-induced micro- and nanostructures on PC and CAB surfaces were used for achieving the directed growth of Schwann cells, which are of special interest as they support the regeneration of the nerve pathways by guiding the neuronal axons in the direction of their alignment. Schwann cells can grow in a certain direction, predetermined by micro-groove orientation. In contrast, cells cultivated on unstructured surfaces show an omnidirectional growth behavior. For PC, the LIPSS at the walls of the micro-grooves led to an additional orientation effect by guiding the protrusions of the Schwann cells, even though the orientation was not perfect. The sponge-like nanostructure on the walls of the micro-grooves of CAB seems to have this effect only to a minor degree. The next step in the direction of a potential application of these structures would be to obtain the investigated materials in fiber form (as fillers for nerve conduits) and to test whether laser treatment improves nerve regeneration capability.

Supplementary Materials

The following supporting information can be downloaded at: https://www.mdpi.com/article/10.3390/app15126754/s1, Figure S1: FTIR-ATR spectra of investigated polymer materials; Figure S2: Width of 1040 nm fs laser-written lines on PC as function of laser pulse energy.

Author Contributions

Conceptualization, J.H.; methodology, L.W., S.L., W.B. and J.H.; investigation, L.W., W.B. and A.W.; resources, J.H. and W.B.; writing—original draft preparation, L.W., S.L. and J.H.; writing—review and editing, L.W., W.B., A.W., S.L. and J.H.; visualization, L.W. and J.H.; supervision, W.B. and J.H.; project administration, J.H.; funding acquisition, J.H. All authors have read and agreed to the published version of the manuscript.

Funding

This research was funded by the Austrian Federal State of Upper Austria, in the frame of the scheme OÖ. ANBAHNUNGSFÖRDERUNG EXPANDING HORIZON.

Institutional Review Board Statement

Not applicable.

Informed Consent Statement

Not applicable.

Data Availability Statement

The original contributions presented in the study are included in the article, further inquiries can be directed to the corresponding author.

Conflicts of Interest

The authors declare no conflicts of interest. The funders had no role in the design of the study; in the collection, analyses, or interpretation of data; in the writing of the manuscript; or in the decision to publish the results.

Abbreviations

The following abbreviations are used in this manuscript:
ATRAttenuated total reflection
CABCellulose acetate butyrate
CAGRCompound annual growth rate
CDsCompact disks
ECMExtracellular matrix
FTIRFourier transform infrared
fsFemtosecond
HMDSHexamethyldisilazane
HSFHigh-spatial-frequency
HSFLHigh-spatial-frequency LIPSS
KrF*Krypton fluoride excimer
LIPSSLaser-induced periodic surface structure
LSFLow-special-frequency
LSFLLow-special-frequency LIPSS
NIRNear-infrared
nsNanosecond
PBSPhosphate-buffered saline
PCPolycarbonate
PETPolyethylene terephthalate
psPicosecond
SCsSchwann cells
SEMScanning electron microscopy
USDUnited States Dollar
UVUltraviolet

References

  1. Lifka, S.; Plamadeala, C.; Weth, A.; Heitz, J.; Baumgartner, W. Oriented artificial nanofibers and laser induced periodic surface structures as substrates for Schwann cells alignment [version 3; peer review: 2 approved, 1 approved with reservations]. Open Res. Eur. 2024, 4, 80. [Google Scholar] [CrossRef] [PubMed]
  2. Cattin, A.L.; Burden, J.J.; Van Emmenis, L.; Mackenzie, F.E.; Hoving, J.J.A.; Garcia Calavia, N.; Guo, Y.; McLaughlin, M.; Rosenberg, L.H.; Quereda, V.; et al. Macrophage-induced blood vessels guide Schwann cell-mediated regeneration of peripheral nerves. Cell 2015, 162, 1127–1139. [Google Scholar] [CrossRef] [PubMed]
  3. Manganas, P.; Kavatzikidou, P.; Kordas, A.; Babaliari, E.; Stratakis, E.; Ranella, A. The role of mechanobiology on the Schwann cell response: A tissue engineering perspective. Front. Cell. Neurosci. 2022, 16, 948454. [Google Scholar] [CrossRef] [PubMed]
  4. Jessen, K.R.; Mirsky, R. The success and failure of the Schwann cell response to nerve injury. Front. Cell. Neurosci. 2019, 13, 33. [Google Scholar] [CrossRef]
  5. Peripheral Nerve Injury Market Size & Trends. Available online: https://www.grandviewresearch.com/industry-analysis/peripheral-nerve-injuries-market-report (accessed on 22 May 2025).
  6. Meena, P.; Kakkar, A.; Kumar, M.; Khatri, N.; Nagar, R.K.; Singh, A.; Malhotra, P.; Shukla, M.; Saraswat, S.K.; Srivastava, S.; et al. Advances and clinical challenges for translating nerve conduit technology from bench to bed side for peripheral nerve repair. Cell Tissue Res. 2021, 383, 617–644. [Google Scholar] [CrossRef]
  7. Jiang, M.; Chen, M.; Liu, N. Interactions between Schwann cell and extracellular matrix in peripheral nerve regeneration. Front. Neurol. 2024, 15, 1372168. [Google Scholar] [CrossRef]
  8. Millesi, F.; Weiss, T.; Mann, A.; Haertinger, M.; Semmler, L.; Supper, P.; Pils, D.; Naghilou, A.; Radtke, C. Defining the regenerative effects of native spider silk fibers on primary Schwann cells, sensory neurons, and nerve-associated fibroblasts. FASEB J. 2021, 35, e21196. [Google Scholar] [CrossRef]
  9. Stadlmayr, S.; Peter, K.; Millesi, F.; Rad, A.; Wolf, S.; Mero, S.; Zehl, M.; Mentler, A.; Gusenbauer, C.; Konnerth, J.; et al. Comparative Analysis of Various Spider Silks in Regard to Nerve Regeneration: Material Properties and Schwann Cell Response. Adv. Healthc. Mater. 2024, 13, e2302968. [Google Scholar] [CrossRef]
  10. Schnell, E.; Klinkhammer, K.; Balzer, S.; Brook, G.; Klee, D.; Dalton, P.; Mey, J. Guidance of glial cell migration and axonal growth on electrospun nanofibers of poly-epsilon-caprolactone and a collagen/poly-epsilon-caprolactone blend. Biomaterials 2007, 28, 3012–3025. [Google Scholar] [CrossRef]
  11. Peter, K.; Stadlmayr, S.; Naghilou, A.; Ploszczanski, L.; Hofmann, M.; Riekel, C.; Liu, J.; Burghammer, M.; Gusenbauer, C.; Konnerth, J.; et al. Exploring the Unique Properties and Superior Schwann Cell Guiding Abilities of Spider Egg Sac Silk. ACS Appl. Bio Mater. 2025, 8, 1307–1319. [Google Scholar] [CrossRef]
  12. Huang, C.; Ouyang, Y.; Niu, H.; He, N.; Ke, Q.; Jin, X.; Li, D.; Fang, J.; Liu, W.; Fan, C.; et al. Nerve guidance conduits from aligned nanofibers: Improvement of nerve regeneration through longitudinal nanogrooves on a fiber surface. ACS Appl. Mater. Interfaces 2015, 7, 7189–7196. [Google Scholar] [CrossRef] [PubMed]
  13. Bonse, J.; Höhm, S.; Kirner, S.V.; Rosenfeld, A.; Krüger, J. Laser-Induced Periodic Surface Structures—A Scientific Evergreen. IEEE J. Sel. Top. Quantum Electron. 2017, 23, 9000615. [Google Scholar] [CrossRef]
  14. Fosodeder, P.; Baumgartner, W.; Steinwender, C.; Hassel, A.W.; Florian, C.; Bonse, J.; Heitz, J. Repellent rings at titanium cylinders against overgrowth by fibroblasts. Adv. Opt. Technol. 2020, 9, 113–120. [Google Scholar] [CrossRef]
  15. Maalouf, M.; Abou Khalil, A.; Di Maio, Y.; Papa, S.; Sedao, X.; Dalix, E.; Peyroche, S.; Guignandon, A.; Dumas, V. Polarization of Femtosecond Laser for Titanium Alloy Nanopatterning Influences Osteoblastic Differentiation. Nanomaterials 2022, 12, 1619. [Google Scholar] [CrossRef]
  16. Muck, M.; Wolfsjäger, B.; Seibert, K.; Maier, C.; Lone, S.A.; Hassel, A.W.; Baumgartner, W.; Heitz, J. Femtosecond Laser-Processing of Pre-Anodized Ti-Based Bone Implants for Cell-Repellent Functionalization. Nanomaterials 2021, 11, 1342. [Google Scholar] [CrossRef]
  17. Yiannakou, C.; Simitzi, C.; Manousaki, A.; Fotakis, C.; Ranella, A.; Stratakis, E. Cell patterning via laser micro/nano structured silicon surfaces. Biofabrication 2017, 9, 025024. [Google Scholar] [CrossRef]
  18. Rebollar, E.; Frischauf, I.; Olbrich, M.; Peterbauer, T.; Hering, S.; Preiner, J.; Hinterdorfer, P.; Romanin, C.; Heitz, J. Proliferation of aligned mammalian cells on laser-nanostructured polystyrene. Biomaterials 2008, 29, 1796–1806. [Google Scholar] [CrossRef]
  19. Mezera, M.; Bonse, J.; Römer, G.R.B.E. Influence of Bulk Temperature on Laser-Induced Periodic Surface Structures on Polycarbonate. Polymers 2019, 11, 1947. [Google Scholar] [CrossRef]
  20. Stratakis, E.; Vlahou, M.; Protopapa, N.; Maragkaki, S.; Tsibidis, G.D. Fabrication of Highly Uniform Laser-Induced Periodic Structures on Polycarbonate Via UV Femtosecond Pulses. Opt. Laser Technol. 2025, 189, 113121. [Google Scholar] [CrossRef]
  21. Parshin, A.; Gunyakov, V.; Zyryanov, V.; Shabanov, V. Domain Structures in Nematic Liquid Crystals on a Polycarbonate Surface. Int. J. Mol. Sci. 2013, 14, 16303–16320. [Google Scholar] [CrossRef]
  22. Technisches Datenblatt. Available online: https://www.sigmaaldrich.com/AT/de/specification-sheet/ALDRICH/419044 (accessed on 22 May 2025).
  23. Polycarbonate. Available online: https://de.wikipedia.org/wiki/Polycarbonate (accessed on 3 April 2025).
  24. Celluloseacetatbutyrat. Available online: https://de.wikipedia.org/wiki/Celluloseacetatbutyrat (accessed on 3 April 2025).
  25. Garcia-Lechuga, M.; Grojo, D. Simple and robust method for determination of laser fluence thresholds for material modifications: An extension of Liu’s approach to imperfect beams [version 2; peer review: 2 approved, 1 approved with reservations]. Open Res. Eur. 2021, 1, 7. [Google Scholar] [CrossRef] [PubMed]
  26. Liu, J.M. Simple technique for measurements of pulsed Gaussian-beam spot sizes. Opt. Lett. 1982, 7, 196–198. [Google Scholar] [CrossRef] [PubMed]
  27. Diepens, M.; Gijsman, P. Photodegradation of bisphenol A polycarbonate. Polym. Degrad. Stab. 2007, 92, 397–406. [Google Scholar] [CrossRef]
  28. Rivaton, A.; Sallet, D.; Lemaire, J. The photochemistry of bisphenol-A polycarbonate reconsidered. Polym. Photochem. 1983, 3, 463–481. [Google Scholar] [CrossRef]
  29. Marcuello, C.; Foulon, L.; Chabbert, B.; Aguié-Béghin, V.; Molinari, M. Atomic force microscopy reveals how relative humidity impacts the Young’s modulus of lignocellulosic polymers and their adhesion with cellulose nanocrystals at the nanoscale. Int. J. Biol. Macromol. 2020, 147, 1064–1075. [Google Scholar] [CrossRef]
  30. Golizadeh, M.; Karimi, A.; Gandomi-Ravandi, S.; Vossoughi, M.; Khafaji, M.; Joghataei, M.T.; Faghihi, F. Evaluation of cellular attachment and proliferation on different surface charged functional cellulose electrospun nanofibers. Carbohydr. Polym. 2019, 207, 796–805. [Google Scholar] [CrossRef]
Figure 1. Chemical structure formula of (a) polycarbonate (PC) and (b) cellulose acetate butyrate (CAB). Images taken from [23,24], respectively. Images show simple structural formulas ineligible for copyright and therefore in public domain.
Applsci 15 06754 g001
Figure 2. SEM images of single-burst craters on PC with (a) p = 50 mW, f = 1 kHz, N = 50 and F0 = 2.09 J/cm2 and (b) with p = 11 mW, f = 1 kHz, N = 750 and F0 = 0.92 J/cm2. The images (c,d) are zoom-ins of image (b) at two different positions and with two different magnifications. In image (b), faint LSF-LIPSS are visible in the area between the two red circles, which are more obvious in the zoom-in in image (c). In image (c), the red arrow points to an area with LSF-LIPSS which was previously located between the two red circles, and in image (d), the red arrow points to an area with HSF-LIPSS at the edge of the crater.
Applsci 15 06754 g002
Figure 3. SEM images of the inside of a single-burst crater on PC with p = 8 mW, f = 0.5 kHz, N = 500 and F0 = 0.67 J/cm2. The focus position was about 50 μm below the surface of the PC sample.
Applsci 15 06754 g003
Figure 4. SEM images of the inside of a single-burst crater on extruded CAB with p = 16 mW, f = 0.5 kHz, N = 750 and F0 = 1.34 J/cm2. The larger (rectangular) particles inside the crater in the image probably originate from redeposited material (i.e., debris).
Applsci 15 06754 g004
Figure 5. SEM images of laser-written lines on PC: (a) multiple-overscan line with p = 9 mW, f = 0.5 kHz, vscan = 2000 µm/s, Nline = 18.75, #os = 100 and F0 = 0.75 J/cm2; (b) detail of multiple-overscan line with p = 8 mW, f = 0.5 kHz, vscan = 2000 µm/s, Nline = 18.75, #os = 100 and F0 = 0.67 J/cm2; (c) multiple-overscan lines (ΔS = 70 µm) with p = 9 mW, f = 0.5 kHz, vscan = 2000 µm/s, Nline = 18.75, #os = 100 and F0 = 0.75 J/cm2; (d) single lines (ΔS = 20 µm) with p = 24 mW, f = 2 kHz, vscan = 1000 µm/s, Nline = 150, #os = 1 and F0 = 0.50 J/cm2. Bright areas at bottom of lines in image (a,c) probably originate from charging during SEM investigation. All lines written in x-direction.
Applsci 15 06754 g005
Figure 6. SEM image of laser-written line on pure CAB: a multiple-overscan line with p = 20 mW, f = 0.5 kHz, vscan = 2000 µm/s, Nline = 18.75, #os = 100 and F0 = 1.67 J/cm2. The bright areas at the bottom of the lines in the image probably originate from charging during the SEM investigation. The line is written in the x-direction.
Applsci 15 06754 g006
Figure 7. SEM images of Schwann cells (after 5 days in culture) on laser-written lines: (a) multiple overscan lines (ΔS = 60 µm) on PC with p = 9 mW, f = 0.5 kHz, vscan = 2000 µm/s, Nline = 18.75, #os = 100 and F0 = 0.75 J/cm2; (b) magnified details with the same parameters as image (a) but viewed under a tilt angle of 45°; (c) multiple-overscan lines (ΔS = 55 µm) on pure CAB with p = 20 mW, f = 0.5 kHz, vscan = 2000 µm/s, Nline = 18.75, #os = 100 and F0 = 1.67 J/cm2; (d) magnified details with the same parameters as image (c). The red arrow in image (b) indicates the direction of the HSF-LIPSS, the red lines in image (c) show the border of the area with laser-written lines, and the red and orange arrows in image (d) show the main directions of the sponge-like nanostructures and the Schwann cells, respectively. All lines are written in the x-direction.
Applsci 15 06754 g007
Figure 8. SEM images of Schwann cells (after 3 days in culture) on multiple-overscan lines (ΔS = 60 µm) on PC with p = 9 mW, f = 0.5 kHz, vscan = 2000 µm/s, Nline = 18.75, #os = 100 and F0 = 0.75 J/cm2, viewed under a tilt angle of 45°: (a) a line written in the x-direction; (b) lines written the in y-direction. The red arrow in images (a,b) indicates the direction of the HSF-LIPSS.
Applsci 15 06754 g008
Disclaimer/Publisher’s Note: The statements, opinions and data contained in all publications are solely those of the individual author(s) and contributor(s) and not of MDPI and/or the editor(s). MDPI and/or the editor(s) disclaim responsibility for any injury to people or property resulting from any ideas, methods, instructions or products referred to in the content.

