1. Introduction
Allergies represent a significant aspect of the modern world [
1,
2,
3], with a noticeable rise over the past two to three decades [
3,
4], affecting nearly one-third of the global population [
5] and becoming a major worldwide issue [
6]. In the case of food allergies, it is estimated that an alarming 10% of the world’s population is affected, with children being the most vulnerable group [
1,
7].
Clemens von Pirquet (1874–1929) was the first to use the term “allergy” in the early 20th century, in the context of discoveries regarding the role of antibodies not only in protective immune responses but also in hypersensitivity reactions [
5]. This refers to an exaggerated immune reaction to a substance that would normally cause no adverse effects [
5], characterized by a rapid onset followed by a quick regression, which can lead to local or systemic dysfunctions [
6].
Allergic or hypersensitivity reactions are classified into four main types [
8], based on the immunological response mechanisms involved: Type I (immediate hypersensitivity), Type II (cytotoxic hypersensitivity), Type III (immune complex-mediated hypersensitivity), and Type IV (delayed-type hypersensitivity) [
6,
9]. Food allergies are part of the first category (type I) [
10] and rank among the most common types of allergies, along with pollen, dust mite, and animal dander allergies [
5], representing a substantial percentage of 90% of allergic diseases [
6]. As a mechanism, mast cells and basophils release allergic mediators [
8], following an IgE-mediated response, with inflammation playing a central role in the allergic process [
9].
The general reactions associated with allergies are characterized by digestive disturbances, skin manifestations, and respiratory difficulties [
6,
11]. In most cases, the primary goal is to reduce the symptoms associated with adverse reactions, which involves the use of antihistamines, corticosteroids, non-steroidal drugs, or adrenaline, depending on the severity of the allergic reaction [
11]. The limitations of conventional anti-allergic treatments—such as side effects [
12], the inability to use certain medications in children under 2 years of age [
11], and the potential development of resistance over time [
6]—create opportunities for new research directions.
Therefore, in the context of the increasing incidence of allergies, there is a growing need to explore alternatives that can reduce the impact of allergic reactions. Phenolic compounds and flavonoids are considered valuable potential bioactive agents, with the ability to support health, prevent certain conditions, and contribute to their treatment [
13].
Consequently, increasing attention is being directed towards natural plant sources, which, through their active components, may contribute to the development of natural treatments [
6,
14]. Additionally, adjusting the diet by including active compounds with anti-allergic effects represents a promising approach in reducing the incidence of food allergies [
6].
Antioxidant compounds, such as vitamins and flavonoids, alongside polyunsaturated fatty acids and amino acids, represent nutraceutical sources with the potential to modulate allergic reactions through a complex mechanism involving mast cells, which are essential in allergic responses [
5]. Natural polyphenols are considered effective in reducing allergic manifestations [
8], with flavonoids being the class that has benefited the most significant research advancements in recent years [
6]. Through compounds like quercetin, kaempferol, and isoquercitrin, the release of chemical mediators and cytokine production by mast cells, basophils, or T cells can be blocked [
6,
9].
The scientific literature has highlighted the beneficial effects of plants such as cocoa,
Moringa oleifera, and algae in combating allergies [
6,
8,
15]. Due to its high flavonoid content, the consumption of at least 7 g of cocoa daily has been shown to be helpful in reducing the incidence of food allergies [
6]. The rich content of flavonoids and flavanol glycosides, including quercetin, astragalin, kaempferol, and rutin in
Moringa oleifera, can be associated with its potential anti-allergic properties [
15]. The anti-allergic activity of an extract from the brown algae
Scytosiphon sp. has been shown to be even stronger than that of the classic anti-allergic drug disodium cromoglycate (DSCG) [
8]. Naringenin chalcone, a polyphenol found in the skin of red tomatoes, has been shown to be useful in reducing allergic asthma by inhibiting Th2-type cytokine activity [
12].
Horseradish (
Armoracia rusticana) is well-known for its antioxidant properties [
16], antimicrobial effects [
17,
18,
19], anti-inflammatory [
19,
20], and even anti-carcinogenic properties [
16,
17,
20], containing a variety of bioactive substances such as antioxidants, flavonoid compounds, and vitamin C [
16], which may interact with the immune system. Due to its characteristics, horseradish is attributed with medicinal properties [
16], a fact also confirmed by a survey showing that 30.3% of respondents from various regions use it for therapeutic purposes [
17]. It is traditionally used and has been shown to be effective in treating urinary infections, respiratory problems, and pain (such as toothaches and back pain) [
17].
Although the composition of horseradish indicates similarities with other plants traditionally associated with anti-allergic properties, its bioactive profile remains insufficiently explored. Therefore, there is an opportunity to investigate the phytochemical composition of horseradish in greater detail, as a basis for future studies on its potential functional applications.
Accordingly, this study aims to identify, quantify, and characterize the bioactive compounds in freeze-dried horseradish (Armoracia rusticana) extracts, in order to provide a comprehensive reference for its use as a natural source of bioactive compounds associated with antiallergenic properties.
2. Materials and Methods
2.1. Materials and Chemicals
Root horseradish (Armoracia rusticana), with approximate dimensions of 35 cm in length and 2.5 cm in diameter, was harvested in November 2024 from the northeastern region of Romania, Bucovina. The fresh roots were washed with water to remove impurities, and the skins were subsequently peeled off. The roots were then chopped using a Thermomix TM6. The horseradish samples, initially frozen at −14 °C, were freeze-dried for 24 h at a pressure of 10 Pa, a process carried out until a temperature of −40 °C was reached, using the Biobase BK-FD12S equipment. Subsequently, the freeze-dried horseradish was ground again with the Thermomix TM6, and the fine-grained powder obtained was subjected to automatic sieving using the Retsch AS 200 Basic vibrating sieve system (Retsch GmbH, Haan, Germany), equipped with a 200 μm sieve. The sample obtained after sieving was stored in an airtight container and kept at 4 °C for further experiments.
All reagents necessary for the determinations, such as Folin-Ciocalteu reagent, DPPH (2,2-diphenyl-1-picrylhydrazyl), sodium carbonate (Na2CO3), aluminum chloride (AlCl3), sodium nitrite (NaNO2), and sodium hydroxide (NaOH), were analytically pure and were purchased from Sigma-Aldrich (Darmstadt, Germany).
2.2. Extract Preparation and Experimental Setup
For the extraction of bioactive compounds, two types of solvents were used: ultrapure water and a hydroalcoholic mixture of methanol–water (1:1,
v/
v). The extracts were prepared in a 1:10 (
m/
v) ratio, using 2 g of lyophilized horseradish and 20 mL of solvent [
21,
22].
The extraction was performed using an ultrasonic bath (Elma Transsonic TI-H15, Singen, Germany) set at a constant frequency of 45 kHz, in normal operating mode, with variations in time (A), temperature (B), and potency (C) during the ultrasonic process.
After the extraction process, the resulting solutions were centrifuged (Ohaus Frontier 5718R, Parsippany, NJ, USA) for 20 min at 2000 rpm, and the supernatant was collected and then filtered through Millipore syringe filters (Merck, Darmstadt, Germany) with a pore size of 0.45 μm to obtain the final extracts for the analyses.
2.3. Determination of Total Polyphenol Content (TPC)
The total phenolic content was determined spectrophotometrically using the Folin-Ciocalteu method [
21,
23,
24]. To 1 mL of the sonicated horseradish extract, 5 mL of Folin-Ciocalteu reagent, previously diluted 1:10 with ultrapure water, was added. After 3 min, 4 mL of 7.5% sodium carbonate solution was added. The solutions were left in the dark at room temperature for 2 h of incubation [
25]. The absorbance was measured at a wavelength of 765 nm using a UV-VIS-NIR 300 spectrophotometer (Schimadzu Corporation, Tokyo, Japan). Three determinations were performed for each sample, and the result was expressed as the average of the three values obtained in mg gallic acid equivalents per gram of dry sample (mg GAE/g DM).
2.4. Determination of Total Flavonoid Content (TFC)
The total flavonoid content of horseradish extracts was determined using the spectrophotometric method described by Wang et al. [
26] with some modifications. To 5 mL of the extract, 0.3 mL of 5% NaNO
2 solution was added, and the mixture was homogenized and allowed to react for 5 min. After the reaction, 0.3 mL of 10% AlCl
3 × 6H
2O solution was added, and the mixture was left to rest for 6 min. Subsequently, 2 mL of 1 mol/L NaOH was added. The absorbance was measured using the Shimadzu 300 UV-VIS-NIR spectrophotometer (Tokyo, Japan) at 510 nm [
27]. The control sample consisted of adding ultrapure water or a 1:1 water-methanol mixture instead of the tested extract. The analyses were performed in triplicate, and only the average value was reported, expressed as mg QE/g DM (mg quercetin equivalents per gram of dry sample).
2.5. Evaluation of DPPH Radical Scavenging Activity (Antioxidant Capacity)
The antioxidant capacity was evaluated by measuring the DPPH (2,2-diphenyl-1-picrylhydrazyl) free radical scavenging activity of the horseradish extracts, according to the method described by Calabone et al. [
23]. A fresh 0.1 mmol/L DPPH solution (diluted in methanol) was prepared, and 5 mL of this solution was added to 1 mL of each extract previously prepared. The samples were kept for 30 min at room temperature, in the absence of light. Since the samples underwent a flocculation process upon contact with the DPPH reagent, before measuring the absorbance (Shimadzu 300 UV-VIS-NIR spectrophotometer, Tokyo, Japan) at a wavelength of 571 nm [
18,
20,
21,
24,
28], they were filtered through a Millipore syringe filter (Merck, Darmstadt, Germany) with a pore size of 0.45 μm to avoid affecting the accuracy and precision of the measurement. The antioxidant activity of the extracts was evaluated by the percentage of DPPH radical inhibition, which reflects their ability to neutralize free radicals, according to the following equation:
2.6. Polyphenolic Profile Analysis by HPLC-DAD
The extracts of horseradish with optimal values were analyzed using a high-performance liquid chromatography (HPLC) system (Shimadzu Corporation, Kyoto, Japan) coupled with a diode array detector (SPD-M20A) to obtain the polyphenol profile. The separation was performed using a Kinetex Biphenyl HPLC column (150 × 4.6 mm, 2.6 µm, 100 Å, Phenomenex, Torrance, CA, USA) at room temperature (25 °C). Two mobile phases, A (0.1% acetic acid in water) and B (acetonitrile), were used at a flow rate of 1 mL∙min
−1. Phenolic compounds were identified based on the retention times of standard substances (Sigma-Aldrich, St. Louis, MO, USA) and quantified by measuring the absorbance in the chromatograms relative to these external standards. Chromatograms were recorded at specific wavelengths of 280 nm and 320 nm, depending on the nature of the analyzed compounds [
25,
29]. Detection was performed at 280 nm for protocatechuic acid,
p-hydroxybenzoic acid, and vanillic acid, and at 320 nm for caffeic acid, chlorogenic acid,
p-coumaric acid, and rosmarinic acid. All standard calibration curves exhibited a high degree of linearity (R
2 > 0.99).
Quantification was performed by measuring the peak areas from the chromatograms using LC Solution software, version 1.25 (Shimadzu, Kyoto, Japan). The concentrations of each compound are expressed in mg/g of dry sample, and the percentage values reflect the relative proportion of each polyphenol in relation to the total polyphenol content (TPC) determined for each extract.
2.7. Identification and Quantification of Vitamin C by HPLC-DAD
The vitamin C content in the optimal extract variants (based on extraction yield) was determined by high-performance liquid chromatography (HPLC) (Shimadzu, Kyoto, Japan) equipped with a diode array detector (SPD-M20A) and a Zorbax Extended C18 column (150 × 4.6 mm, 5 µm, Agilent Technologies, Santa Clara, CA, USA [
20,
21,
24,
28]). The mobile phase consisted of 0.02 mol/L monopotassium phosphate, adjusted with 10% orthophosphoric acid to a pH of 3.5. The flow rate was set to 0.8 mL∙min
−1. The run time was set to 7 min, and the injection volume used for HPLC analysis was 20 μL. Vitamin C content was measured at a wavelength of 245 nm [
30,
31] and was determined using a standard calibration curve with concentrations ranging from 25 to 100 mg/L, which demonstrated excellent linearity (R
2 = 0.998). Data collection and further processing were performed using LC Solution software, version 1.25 (Shimadzu, Kyoto, Japan).
2.8. Fatty Acids Analysis by Gas Chromatography (GC)
For the analysis of fatty acids, the method described by Chetrariu et al. [
32] was used, with some modifications. A quantity of 100 mg of oil obtained from lyophilized horseradish by the Soxhlet method was dissolved in 0.4 mL of n-hexane and 0.4 mL of 15% boron trifluoride. The mixture was maintained for 15 min at 60 °C in a water bath to facilitate the complete dissolution of the lipid fraction. After cooling to room temperature, 2 mL of saturated NaCl solution was added. The sample was then centrifuged at 3000 rpm for 5 min (Ohaus Frontier 5718R, Parsippany, NJ, USA) to achieve separation of the organic phase. The upper (organic) phase, containing the dissolved lipid fraction, was collected and filtered using a Millipore syringe filter (Merck, Darmstadt, Germany) with a pore size of 0.22 μm.
The analysis of fatty acids was performed using a GC-MS spectrometer, equipped with a Supelcowax Fused Silica Capillary Column 10 (60 m × 0.25 mm, 0.25 µm, Supelco, Sigma-Aldrich, St. Louis, MO, USA). The injection of samples was performed in split mode with a split ratio of 50:1, at an injector temperature of 220 °C. The chromatograph oven temperature was set to 100 °C. Helium was used as the carrier gas, with a pressure of 123.7 kPa, a total flow rate of 45.5 mL/min, and a column flow rate of 0.83 mL∙min−1. The flow control mode was set to “Linear Velocity” (24 cm/s), and the purge flow rate was set to 3 mL∙min−1. The mass spectrometer operated at an ion source temperature of 200 °C and an interface temperature of 250 °C.
The identification and quantification of fatty acid methyl esters (FAMEs) were performed by correlating the retention times obtained with those of a FAMEs mixed standard (Restek, Lisses, France), in parallel with the interpretation of the mass spectra, using the NIST (National Institute of Standards and Technology) database and MS Search 2.0 software (Thermo Fisher Scientific, Waltham, MA, USA) for validation. The unit of measurement used is µg·mL−1. The results were also reported as a percentage of the total identified fatty acids.
2.9. Experimental Design and Statistical Analysis
The extraction conditions for freeze-dried horseradish were established according to a Box-Behnken experimental design (
Table 1), using Design-Expert 13 software (free trial version, Stat-Ease Inc., Minneapolis, MN, USA).
A total of 12 experiments were conducted, complemented by 5 replicates to assess reliability, resulting in a Box-Behnken design (BBD) consisting of 17 runs for each solvent (
Table 2).
The same experimental design was applied to two different solvents (water and methanol–water 1:1, v/v) for the comparative evaluation of extraction efficiency depending on the solvent.
To analyze the experimental data, a quadratic polynomial model was fitted using multiple regression analysis within the framework of the Box–Behnken design. The response surface was described by the following second-order Equation (2):
where Y denotes the predicted response (TPC, TFC, and DPPH), X
i refers to the coded levels of the independent variables (time, temperature and potency), b
0 is the intercept, b
i corresponds to the linear coefficients, b
ii represents the quadratic terms, and b
ij accounts for the interaction effects between variables.
The statistical differences in the content of antioxidant compounds, polyphenols, and flavonoids in horseradish extracts were evaluated by analysis of variance (ANOVA) to determine the influence of ultrasonic parameters in the extraction process. To improve the extraction process, a numerical optimization function was used, a statistical method frequently applied in Response Surface Methodology (RSM), with the goal of identifying the ideal experimental conditions that would lead to maximum efficiency. In this regard, three essential factors were considered: antioxidant capacity, total polyphenol content, and flavonoid content. The experimental data were analyzed using response surface methodology (RSM) with two types of regression models: the two-factor interaction (2FI) model, which includes linear terms and interaction terms between pairs of variables, and the quadratic model, which also incorporates squared terms to account for curvature in the response. The quality assessment and model accuracy validation were performed based on statistical indicators: the coefficient of determination (R2), the adjusted coefficient of determination (adjusted R2), and the lack of fit test. The significance level considered was p < 0.05.
The desirability function available in Design-Expert software was employed to simultaneously optimize these multiple responses by converting them into a single composite desirability score, facilitating the identification of the most favorable overall extraction conditions.
3. Results
3.1. Polyphenol Content
Phenolic compounds are an important group of antioxidant phytochemicals, known for their beneficial health properties, including the prevention of cancer, aging, atherosclerosis, and neurodegenerative diseases [
33]. Moreover, polyphenol consumption has been associated with the inhibition of IgE production [
2].
The antiallergic action of polyphenols is manifested by the influence on the activity of enzymes and cellular receptors, contributing to the reduction in allergic responses [
6]. Polyphenols can reduce the ability of foods to cause a reaction by binding with food proteins, forming soluble and insoluble complexes [
2], whose functional properties are modified [
4]. This binding changes the conformation of allergenic proteins, thus reducing their allergenic potential [
6]. Polyphenols, especially quercetin, have the ability to inhibit the release of histamine from mast cells and basophils, an important effect in the context of allergies [
2,
3].
The results of the analysis of variance (ANOVA) for the total polyphenol content in lyophilized horseradish show strong statistical significance (p < 0.05) and a regression coefficient of R2 = 0.9469 for hydroalcoholic extraction and R2 = 0.9809 for aqueous extraction, indicating that the extraction parameters analyzed (time, temperature, and ultrasound potency) have a significant effect on the concentration of extracted polyphenols. Additionally, the recovery of polyphenols from horseradish extracts is influenced by the solubility of phenolic compounds in the solvent used. The results demonstrated that the methanol-water solvent (1:1, v/v) promotes a more efficient extraction of polyphenols compared to ultrapure water. This suggests a higher solubility of the polyphenols found in lyophilized horseradish in the mixed solvent.
The statistical modeling performed (2FI and Quadratic) provides the ability to predict the total polyphenol content based on experimental parameters, as well as to evaluate their influence on the obtained values. Equations (3) and (4) represent the mathematical form of the statistical model used in the analysis of total polyphenol content:
A = coded factor representing extraction time (min);
B = coded factor representing extraction temperature (°C);
C = coded factor representing potency (W);
AB, AC, BC = interaction effects between variables;
A2, B2, C2 = quadratic effects of each factor.
According to Equation (3), the most pronounced positive effect on the total polyphenol content is attributed to the interaction between factors A and B (time and temperature), followed by the interaction between factors A and C (time and potency), suggesting a favorable synergistic effect between these factors. On the other hand, the most significant negative influence is associated with the linear factor B (temperature), followed by the interaction between factors B and C (temperature and potency), reflecting the sensitivity of polyphenols to high temperatures, as well as the potential negative synergistic effect between temperature and ultrasound potency on their stability.
Regarding the aqueous extract, Equation (4) suggests a significant relationship between the experimental factors and the total polyphenol content. The strongest positive influence is observed for the quadratic factor C2 (potency), followed by the quadratic factor B2 (temperature). On the other hand, the most important negative influence is represented by the interaction between factors B and C (temperature and potency), followed by the linear factor B (temperature) and the quadratic component A2 (time). The results confirm the instability of polyphenols under high temperature conditions, as well as the negative influence of the combination of temperature and potency on their stability, highlighting the need for fine optimization of the extraction conditions.
High temperatures are associated with the degradation of polyphenolic compounds in horseradish, which may also affect the DPPH radical scavenging ability [
26].
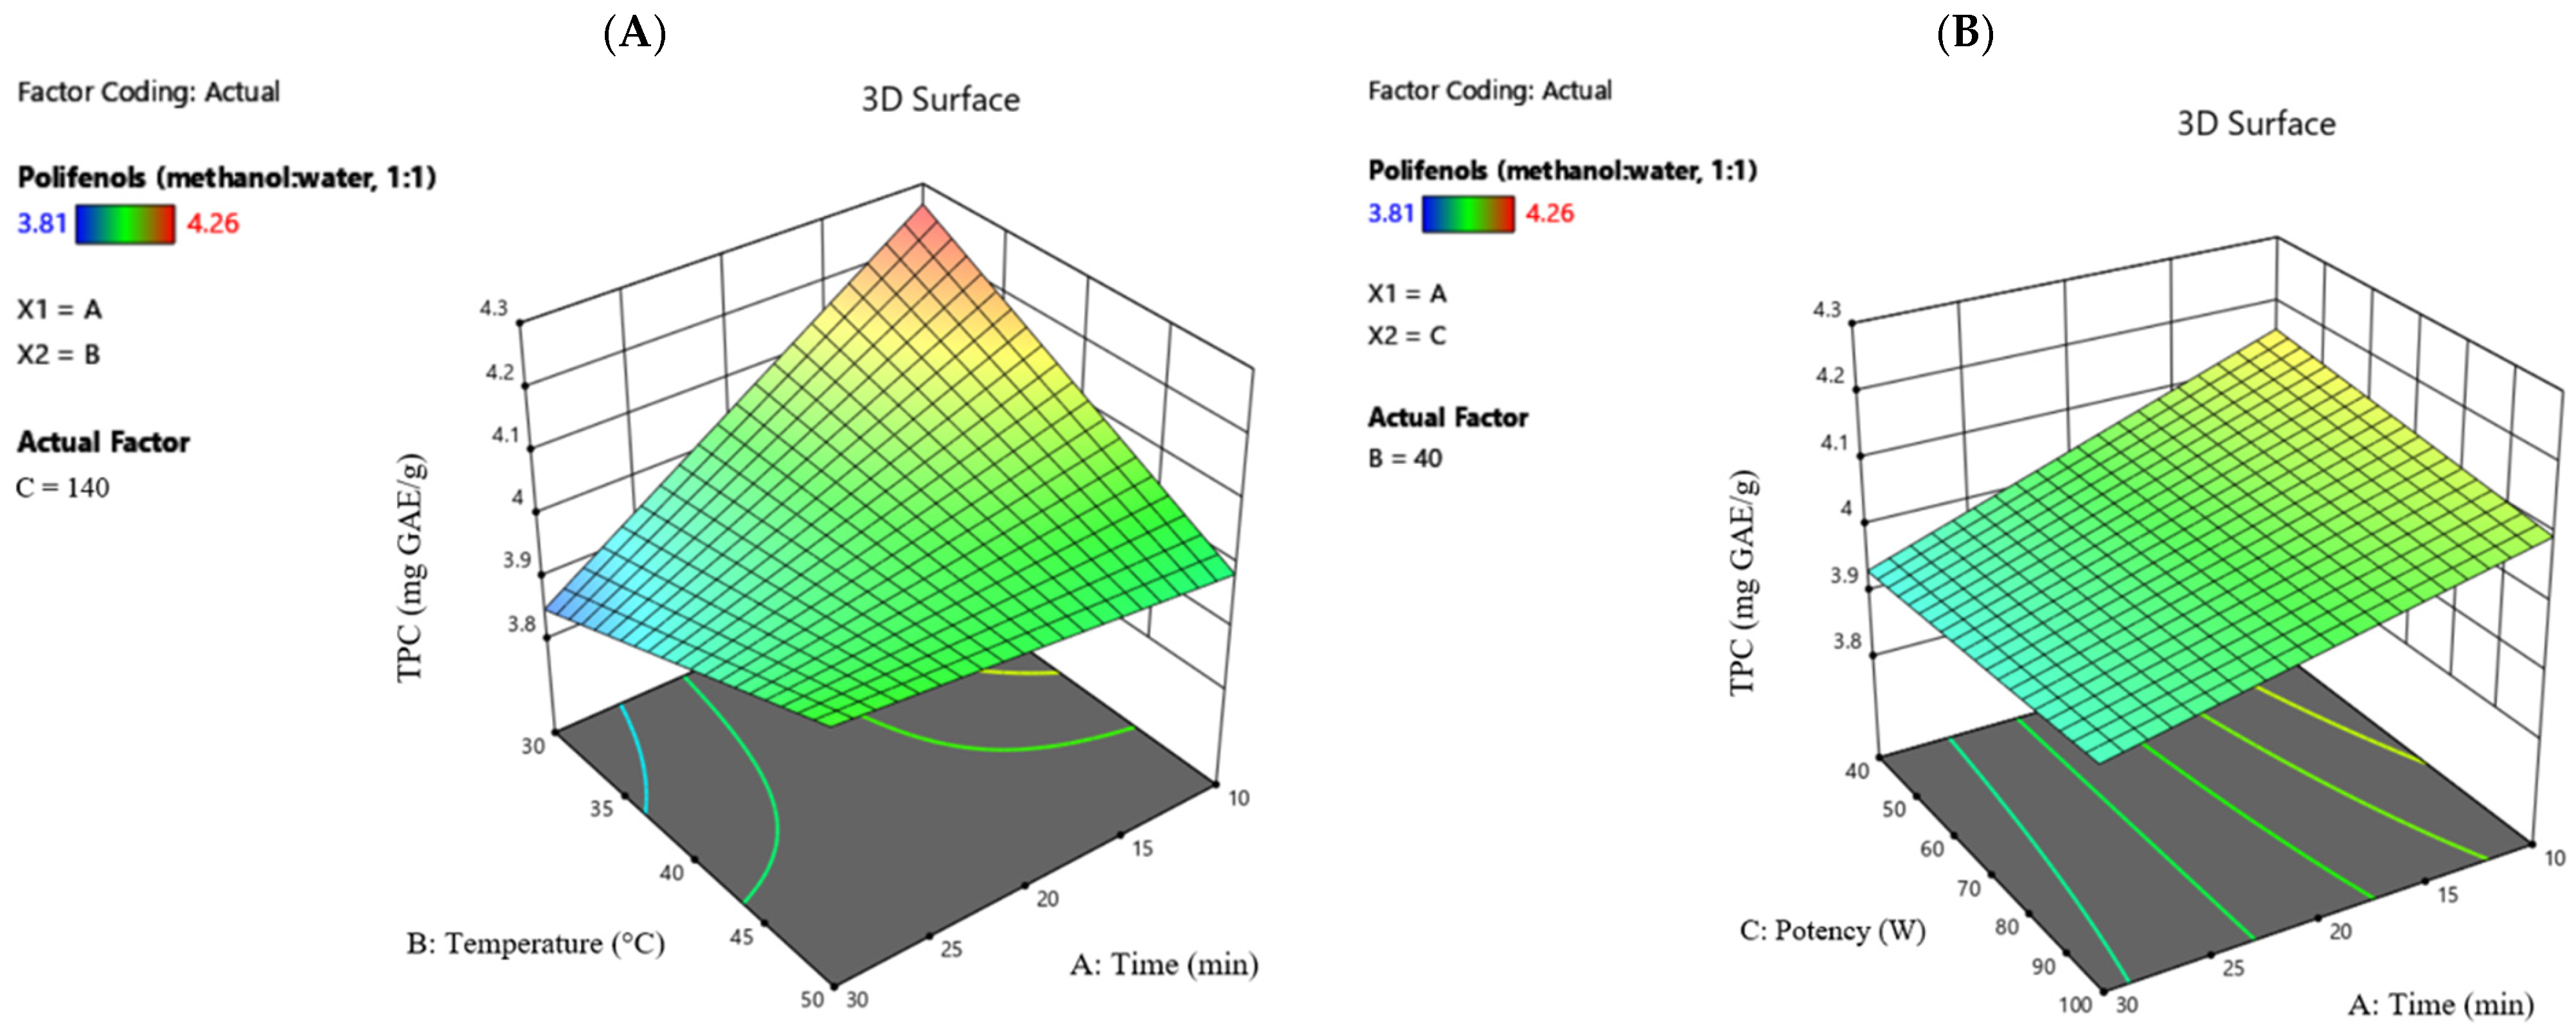
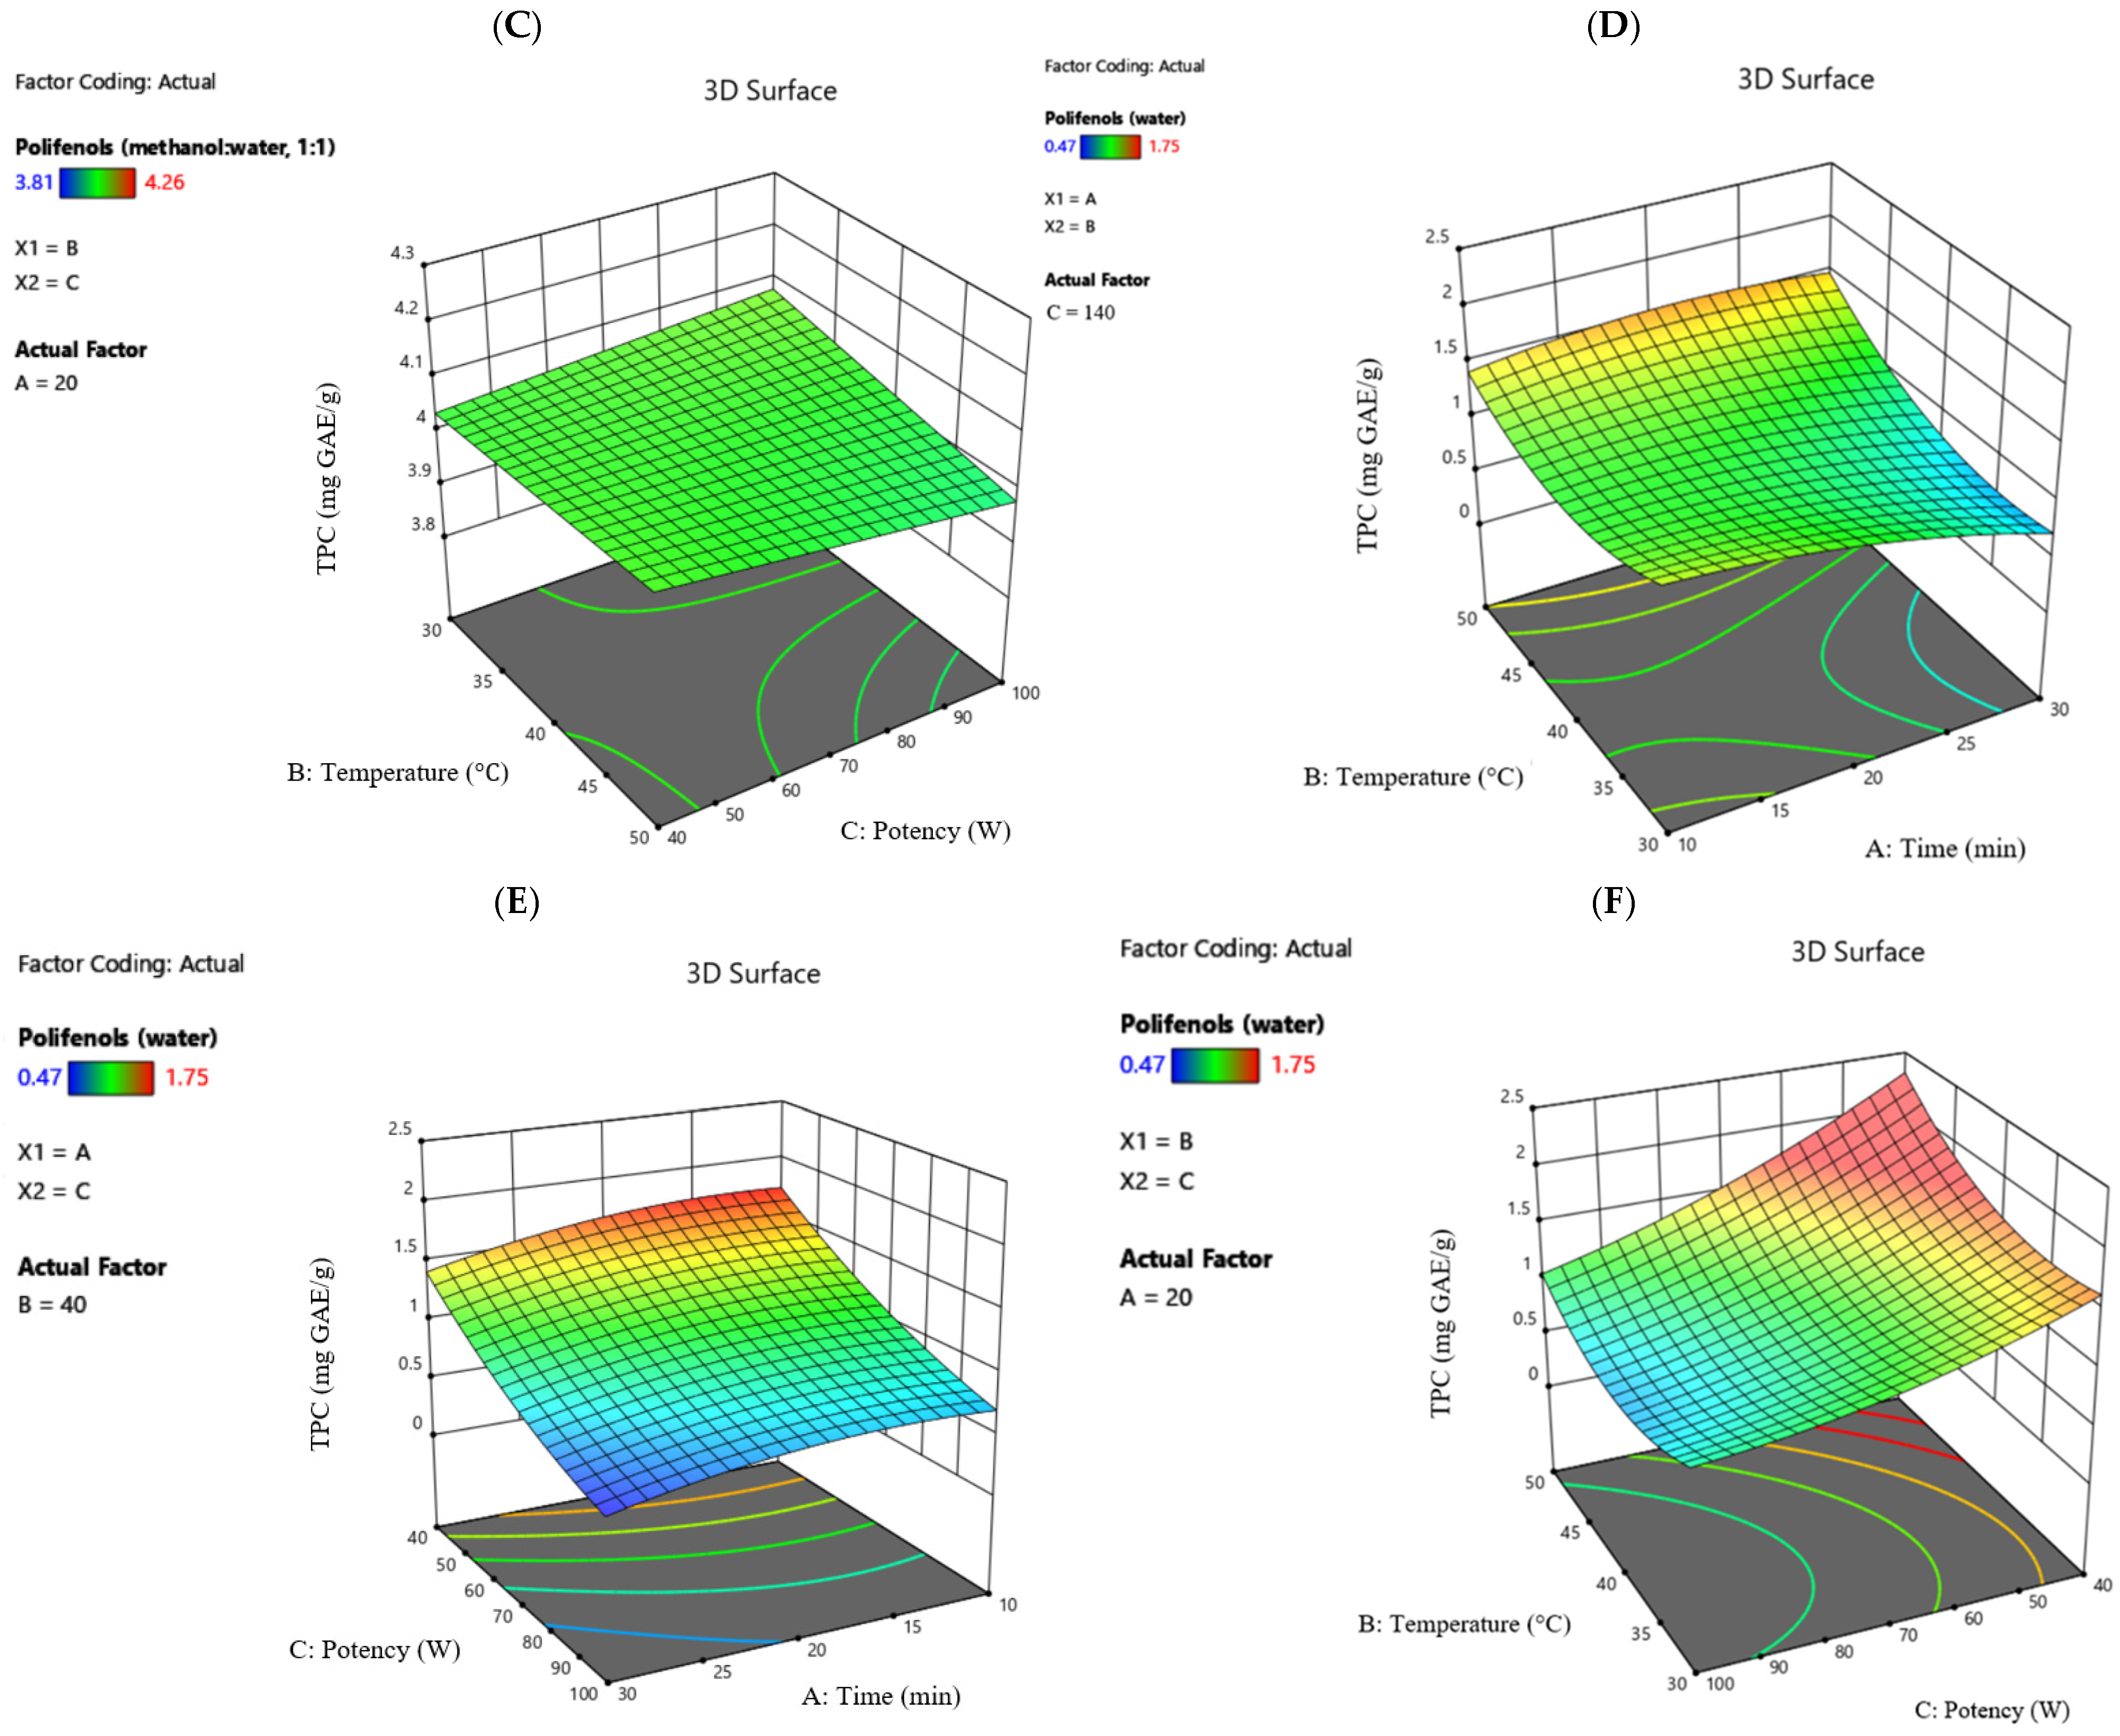
Figure 1 shows the effects of different ultrasound treatments on the total polyphenol content in horseradish extracts with a methanol–water (1:1,
v/
v) solvent and ultrapure water.
The maximum TPC value recorded in the study was 4.26 mg GAE/g (methanol–water solvent 1:1, 10 min, 30 °C, potency 140 W), and 1.75 mg GAE/g (water solvent, 20 min, 30 °C, potency 200 W), while the minimum value was 3.81 mg GAE/g (methanol–water solvent 1:1, 20 min, 50 °C, potency 140 W), and 0.47 mg GAE/g (water solvent, 10 min, 50 °C, potency 140 W).
3.2. Flavonoid Content
Plant secondary metabolites are represented by polyphenols, which include flavonoids [
6]. Flavonoids are the most abundant polyphenols in plants [
23] and play several essential roles, including protecting against oxidative stress and radiation-induced damage [
34,
35]. They are naturally found in fruits and vegetables and are primarily absorbed in the colon, a characteristic that contributes to the growth of beneficial gut microbiota, particularly strains belonging to the Bifidobacterium and Lactobacillus genera [
12]. The BBD model is well described by a second-order polynomial equation, with R
2 = 0.9028 for the hydroalcoholic extract and R
2 = 0.9606 for the aqueous extract.
The statistical modeling performed using 2FI (Second-Order Factorial with Interactions) and Quadratic models (second-order polynomial model) allows for the prediction of total flavonoid content based on the experimental variables. This method also provides an evaluation of the influence of each factor on the results obtained, helping to identify the most significant extraction conditions for high efficiency. Equations (5) and (6) represent the mathematical forms of the model used in the analysis of experimental data and allow the estimation of total polyphenol content based on specific parameters (factors A, B, C) and their interactions.
A = coded factor representing extraction time (min);
B = coded factor representing extraction temperature (°C);
C = coded factor representing potency (W);
AB, AC, BC = interaction effects between variables;
A2, B2, C2 = quadratic effects of each factor.
According to Equation (5), in the case of the hydroalcoholic solvent, all factors are highlighted by their negative linear coefficients, indicating that as their values increase, the total flavonoid content tends to decrease. The most significant negative effect on flavonoid content is observed in the interaction between factors A and C (time and potency), followed by the interaction between factors B and C (temperature and potency).
According to the mathematical relationship described in Equation (6), specific to the aqueous extract, a significant positive effect is noted in the interaction between factors A and B (time and temperature), followed by the linear factor B (temperature). Negative influences on flavonoid levels are identified in the case of the quadratic factor B2, followed by the interactions between factors A and C (time and potency), and then between B and C (temperature and potency), indicating a high sensitivity of flavonoid compounds to the combination of these variables.
The spectrophotometric results highlighted the presence of flavonoids in both types of extracts analyzed; however, the concentrations were significantly higher in the extract prepared with a methanol–water mixture (1:1, v/v), compared to the one obtained with ultrapure water.
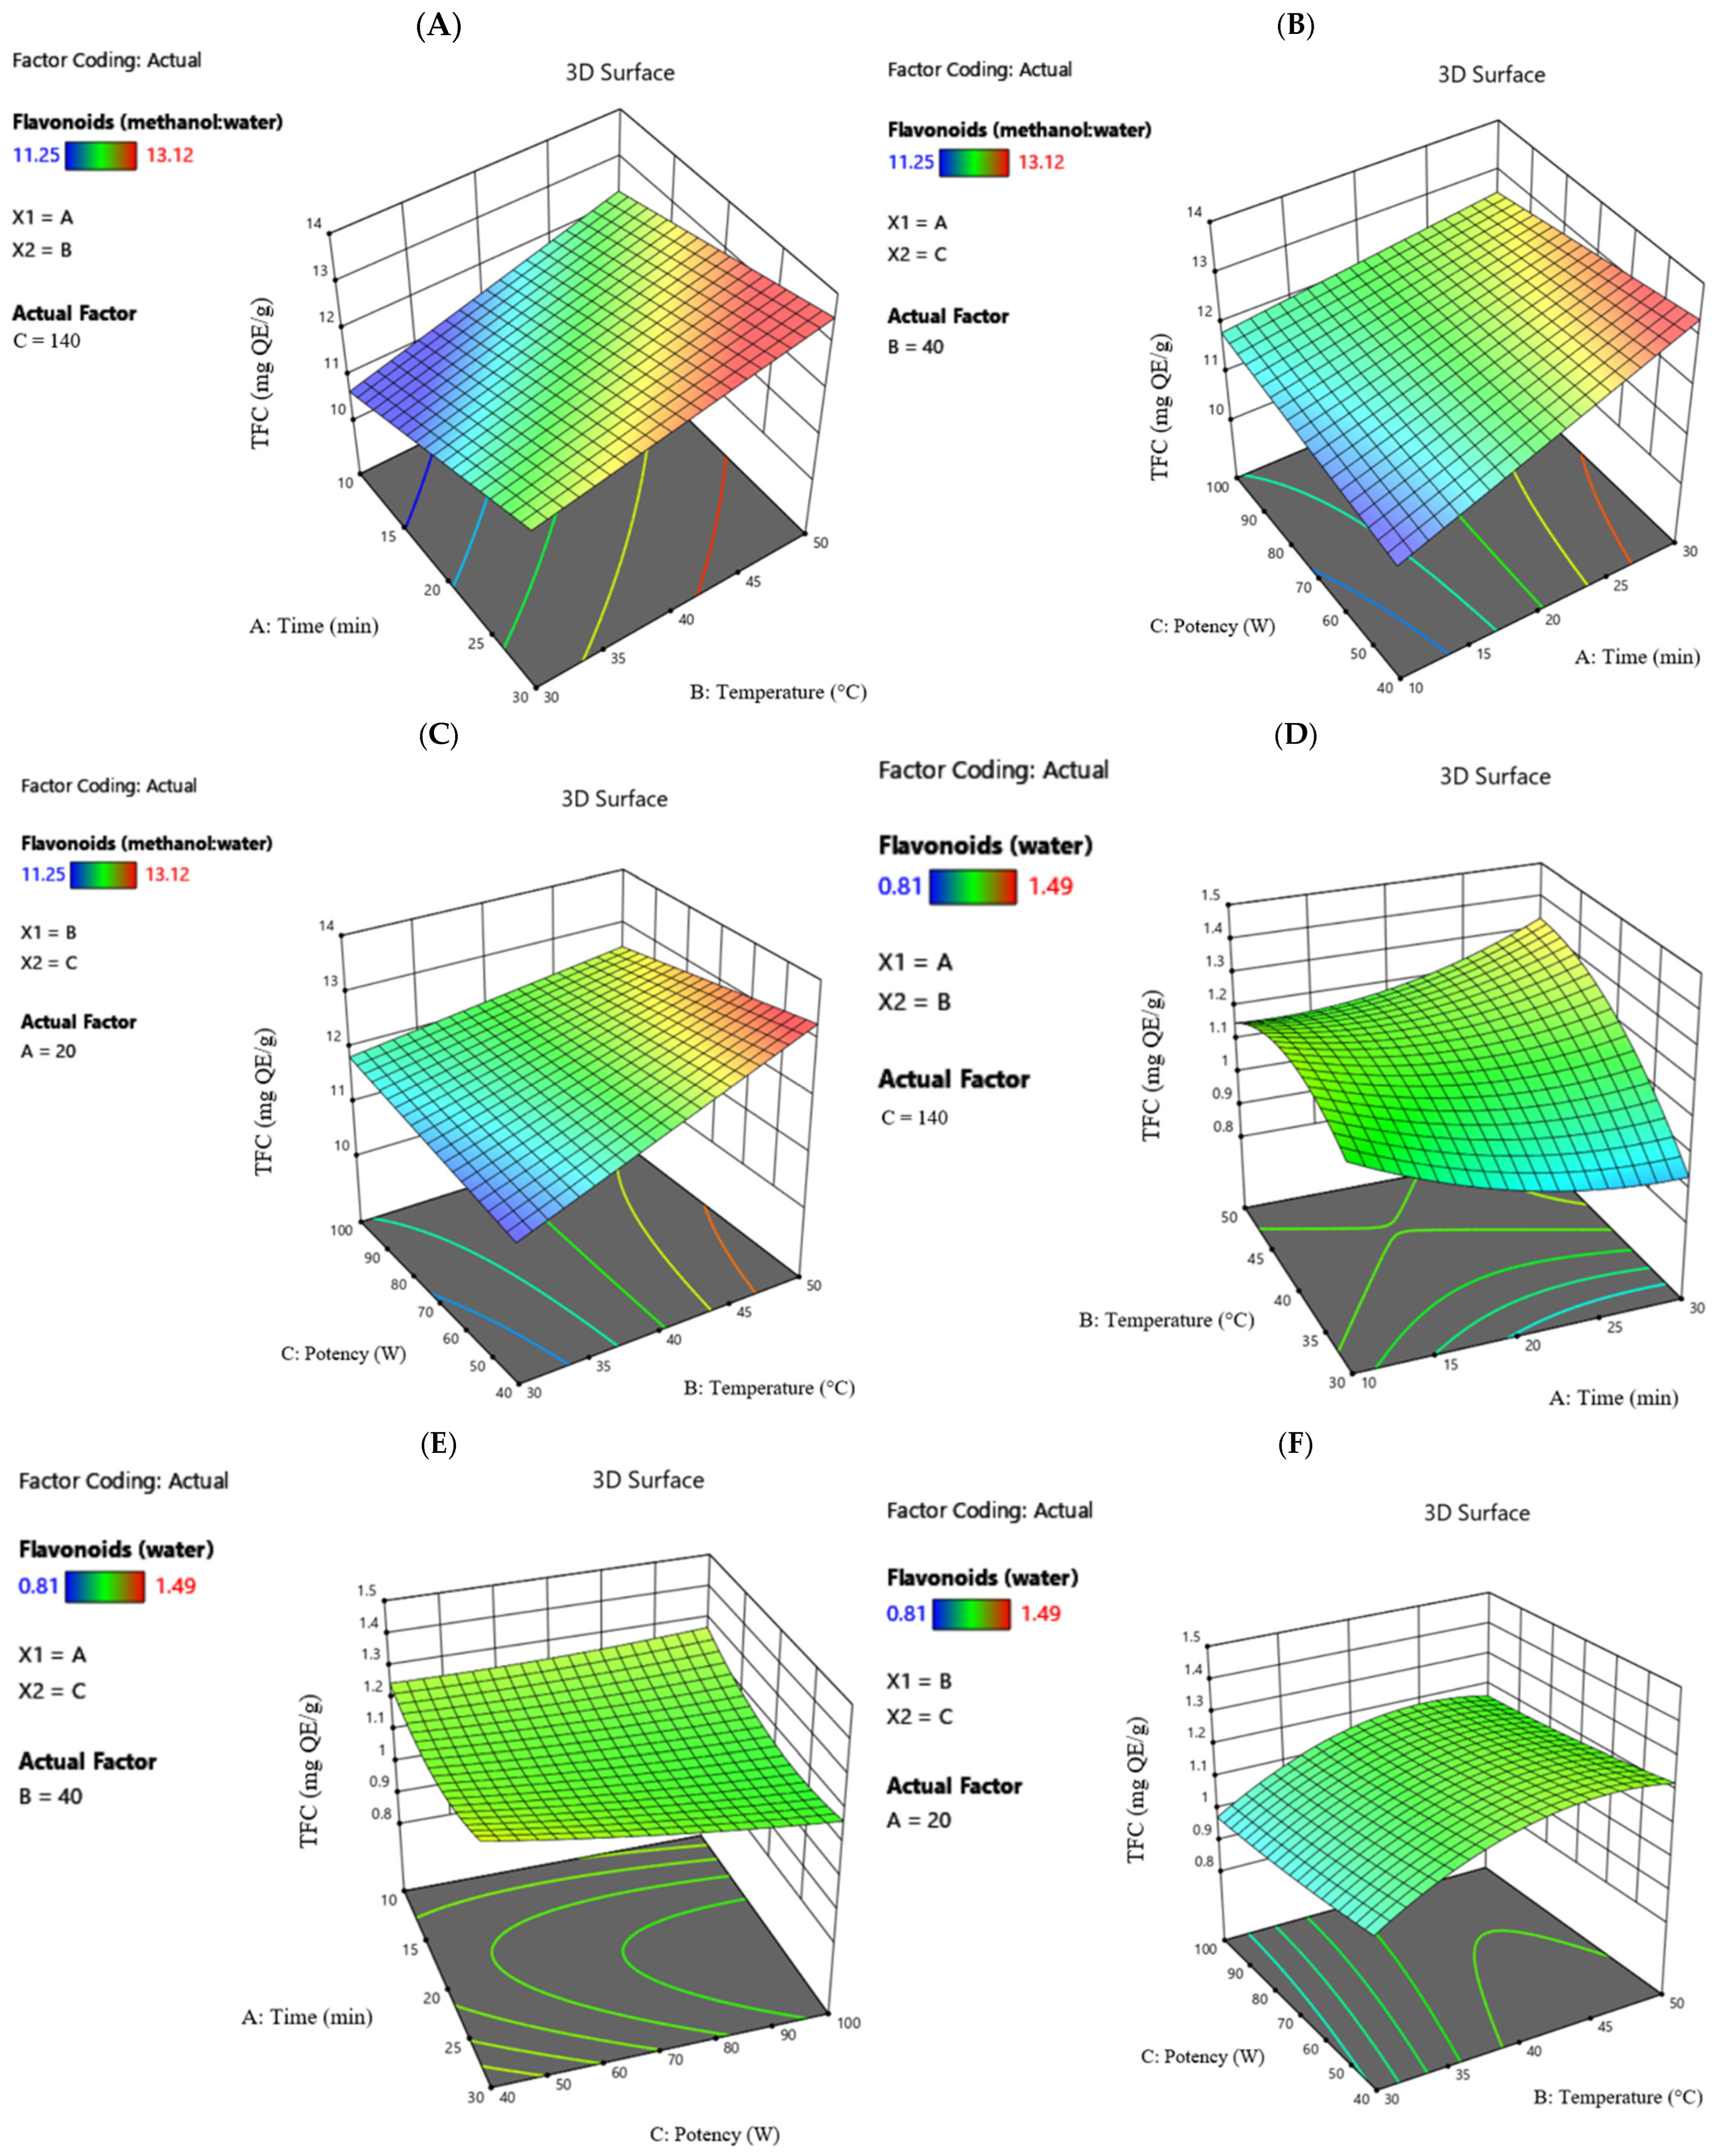
Figure 2 illustrates the influence of the parameters involved in the extraction process.
The highest flavonoid value was obtained using methanol–water (1:1, v/v), 13.12 mg QE/g, indicating greater efficiency in the extraction process compared to water, where the maximum flavonoid content recorded was 1.49 mg QE/g (the same trend for both solvents: 10 min, 40 °C, 200 W potency). The minimum values are 11.25 mg QE/g for the hydroalcoholic solvent (30 min, 40 °C, 200 W potency) and 0.81 mg QE/g for the extraction performed with water (30 min, 30 °C, 140 W potency).
3.3. Antioxidant Capacity
The antioxidant activity of plant extracts, manifested by their free radical scavenging capacity, is largely attributed to the presence of phenolic compounds [
23,
36,
37]. Horseradish is rich in antioxidants, such as polyphenols and flavonoids, which significantly contribute to the prevention and combat of conditions caused by oxidative stress and damage generated by free radicals [
26].
For the antioxidant capacity of the horseradish extracts studied, a significant statistical model was obtained (
p < 0.05) with a regression coefficient of
= 0.8953 for the hydroalcoholic extract variant and
= 0.8519 for the aqueous extraction. The mathematical model took the form of the coded Equations (7) and (8):
A = coded factor representing extraction time (min);
B = coded factor representing extraction temperature (°C);
C = coded factor representing potency (W);
AB, AC, BC = interaction effects between variables;
A2, B2, C2 = quadratic effects of each factor.
The coded equations allow for the evaluation of the influence of each factor on the antioxidant capacity by comparing their associated coefficients.
Equation (7) highlights the significant positive impact of the linear factor B (temperature), followed by the interaction between A and B (time and temperature) on the antioxidant capacity of the hydroalcoholic horseradish extract. In contrast, a significant negative effect is observed associated with factors such as the quadratic term and the interaction between factors B and C (temperature and potency).
In the case of the aqueous extract, Equation (8) shows that among the factors analyzed, the interaction between factors A and B (time and temperature) contributes the most to the increase in the response (antioxidant capacity), followed by the interaction between A and C (time and potency). In contrast, the most pronounced negative influence on the response is exerted by factor B (temperature), followed by the interaction between B and C (temperature and potency).
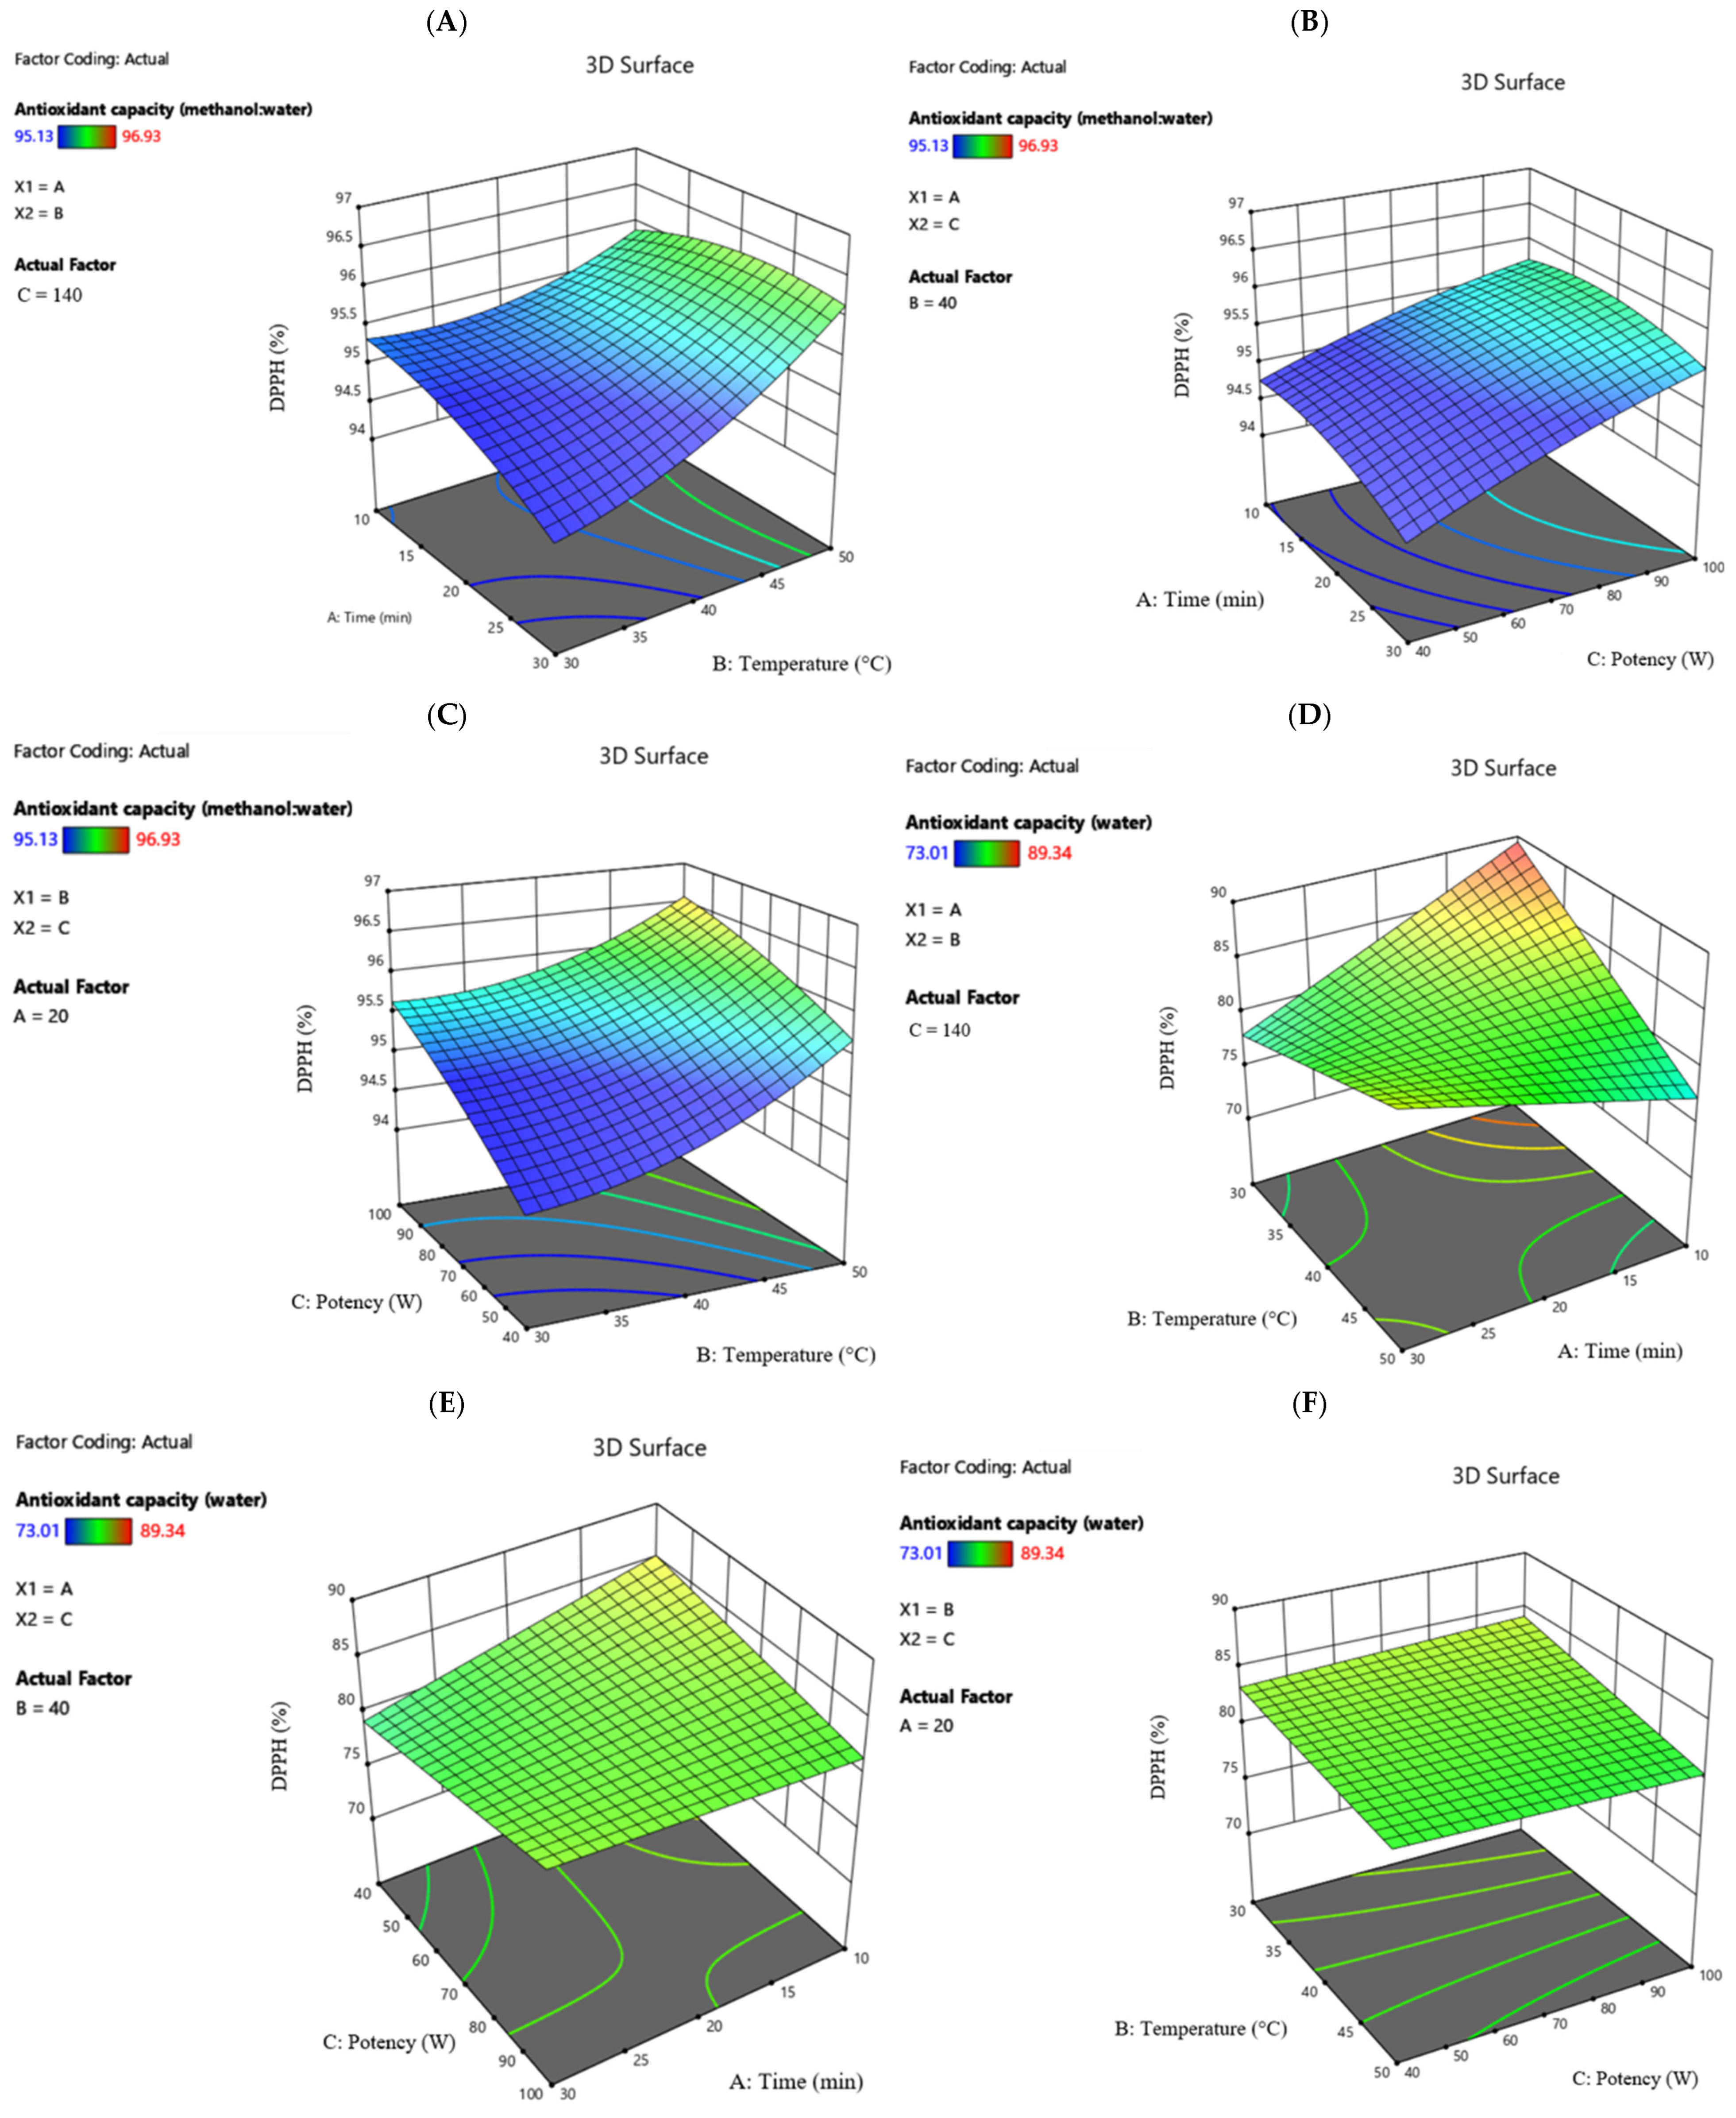
Furthermore, the 3D graphs in
Figure 3 provide a clearer visualization of the influence of time, temperature, and potency factors on the antioxidant capacity of the horseradish extracts.
The maximum antioxidant activity of 96.93% was recorded for the extraction with hydroalcoholic solvent at 30 min, 50 °C temperature, and 140 W potency. When water was used as the solvent, the maximum recorded value was 89.34% at 30 min, 40 °C temperature, and 200 W potency. The minimum values recorded were 95.13% for the hydroalcoholic solvent at 30 min, 40 °C temperature, respectively, 80 W potency, and 73.01% for the ultrapure water solvent at 10 min, 50 °C temperature, and 140 W potency.
3.4. Optimization of the Extraction Process
The statistical models obtained not only describe the relationships between the factors but also provide a framework for optimizing the experimental conditions in order to maximize the obtained values.
For each type of solvent used (methanol–water in a 1:1 ratio and ultrapure water), distinct optimal experimental conditions were determined using the Desirability function in Design Expert software (version 13), aiming to maximize the extraction of bioactive compounds.
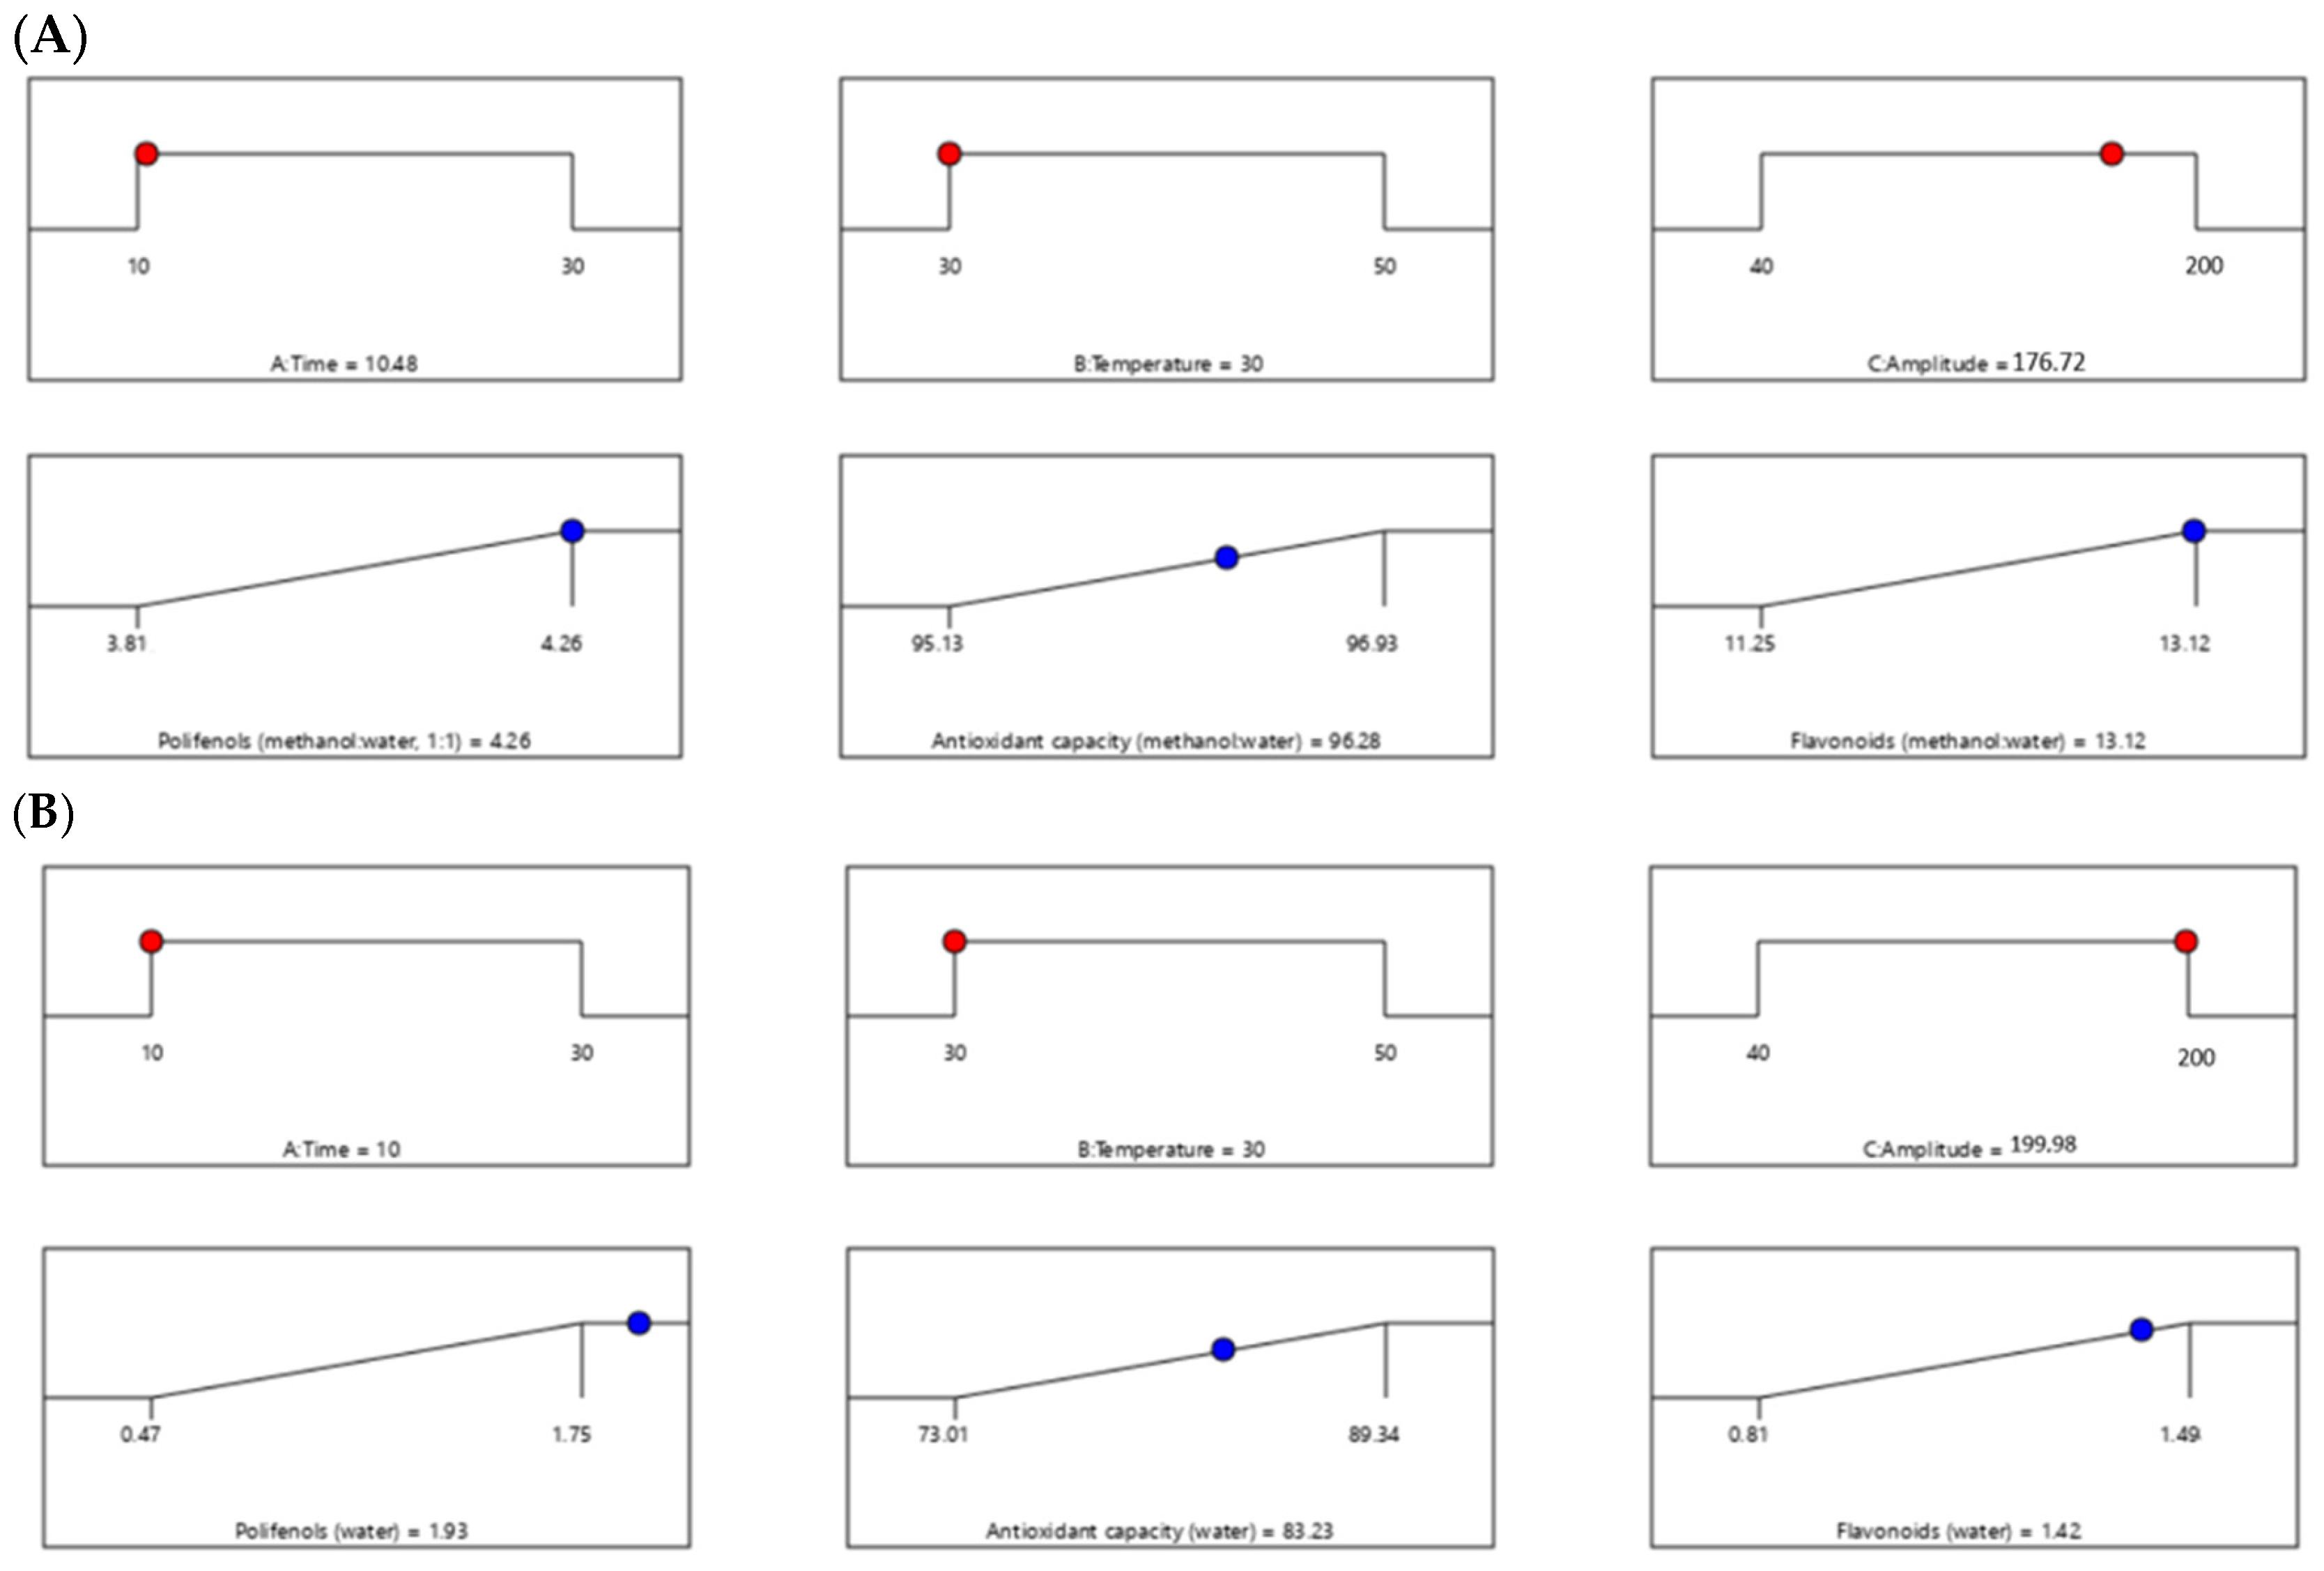
The ramp-type graphs presented in
Figure 4 illustrate the optimal parameters (time, temperature, potency) obtained for the optimization of the extraction process, along with the predicted values for TPC, TFC, and antioxidant activity.
The experimental parameters corresponding to the optimal point were subsequently applied in HPLC analysis, with the aim of characterizing the polyphenolic composition and determining the vitamin C content. For the methanol–water (1:1, v/v) extract, the ultrasonic parameters were a time of 10.48 min, a temperature of 30 °C, and a potency of 176.72 W, while for the aqueous extract, the time was 10 min, the temperature was 30 °C, and the potency was 199.98 W.
3.5. Polyphenolic Profile Analysis
Polyphenols have an extremely strong anti-allergic capacity [
6] and may contribute to the remission of allergies [
8]. The consumption of polyphenols can influence immune mechanisms involved in allergic reactions, reducing both the risk of sensitization to food allergens and the intensity of symptoms by modulating adaptive immune responses [
2].
Horseradish roots are notable for the richness of active phytochemicals they contain, including polyphenols, which have a strong radical-scavenging action [
34].
Flavonoids represent an important class of polyphenols found in horseradish. Due to their ability to inhibit histamine release, flavonoids, particularly luteolin, apigenin, and fisetin, exhibit significant anti-allergic potential, acting on basophils and mast cells [
38]. Kaempferol and quercetin are the main flavonoids in horseradish [
29], known for their anti-inflammatory properties [
22].
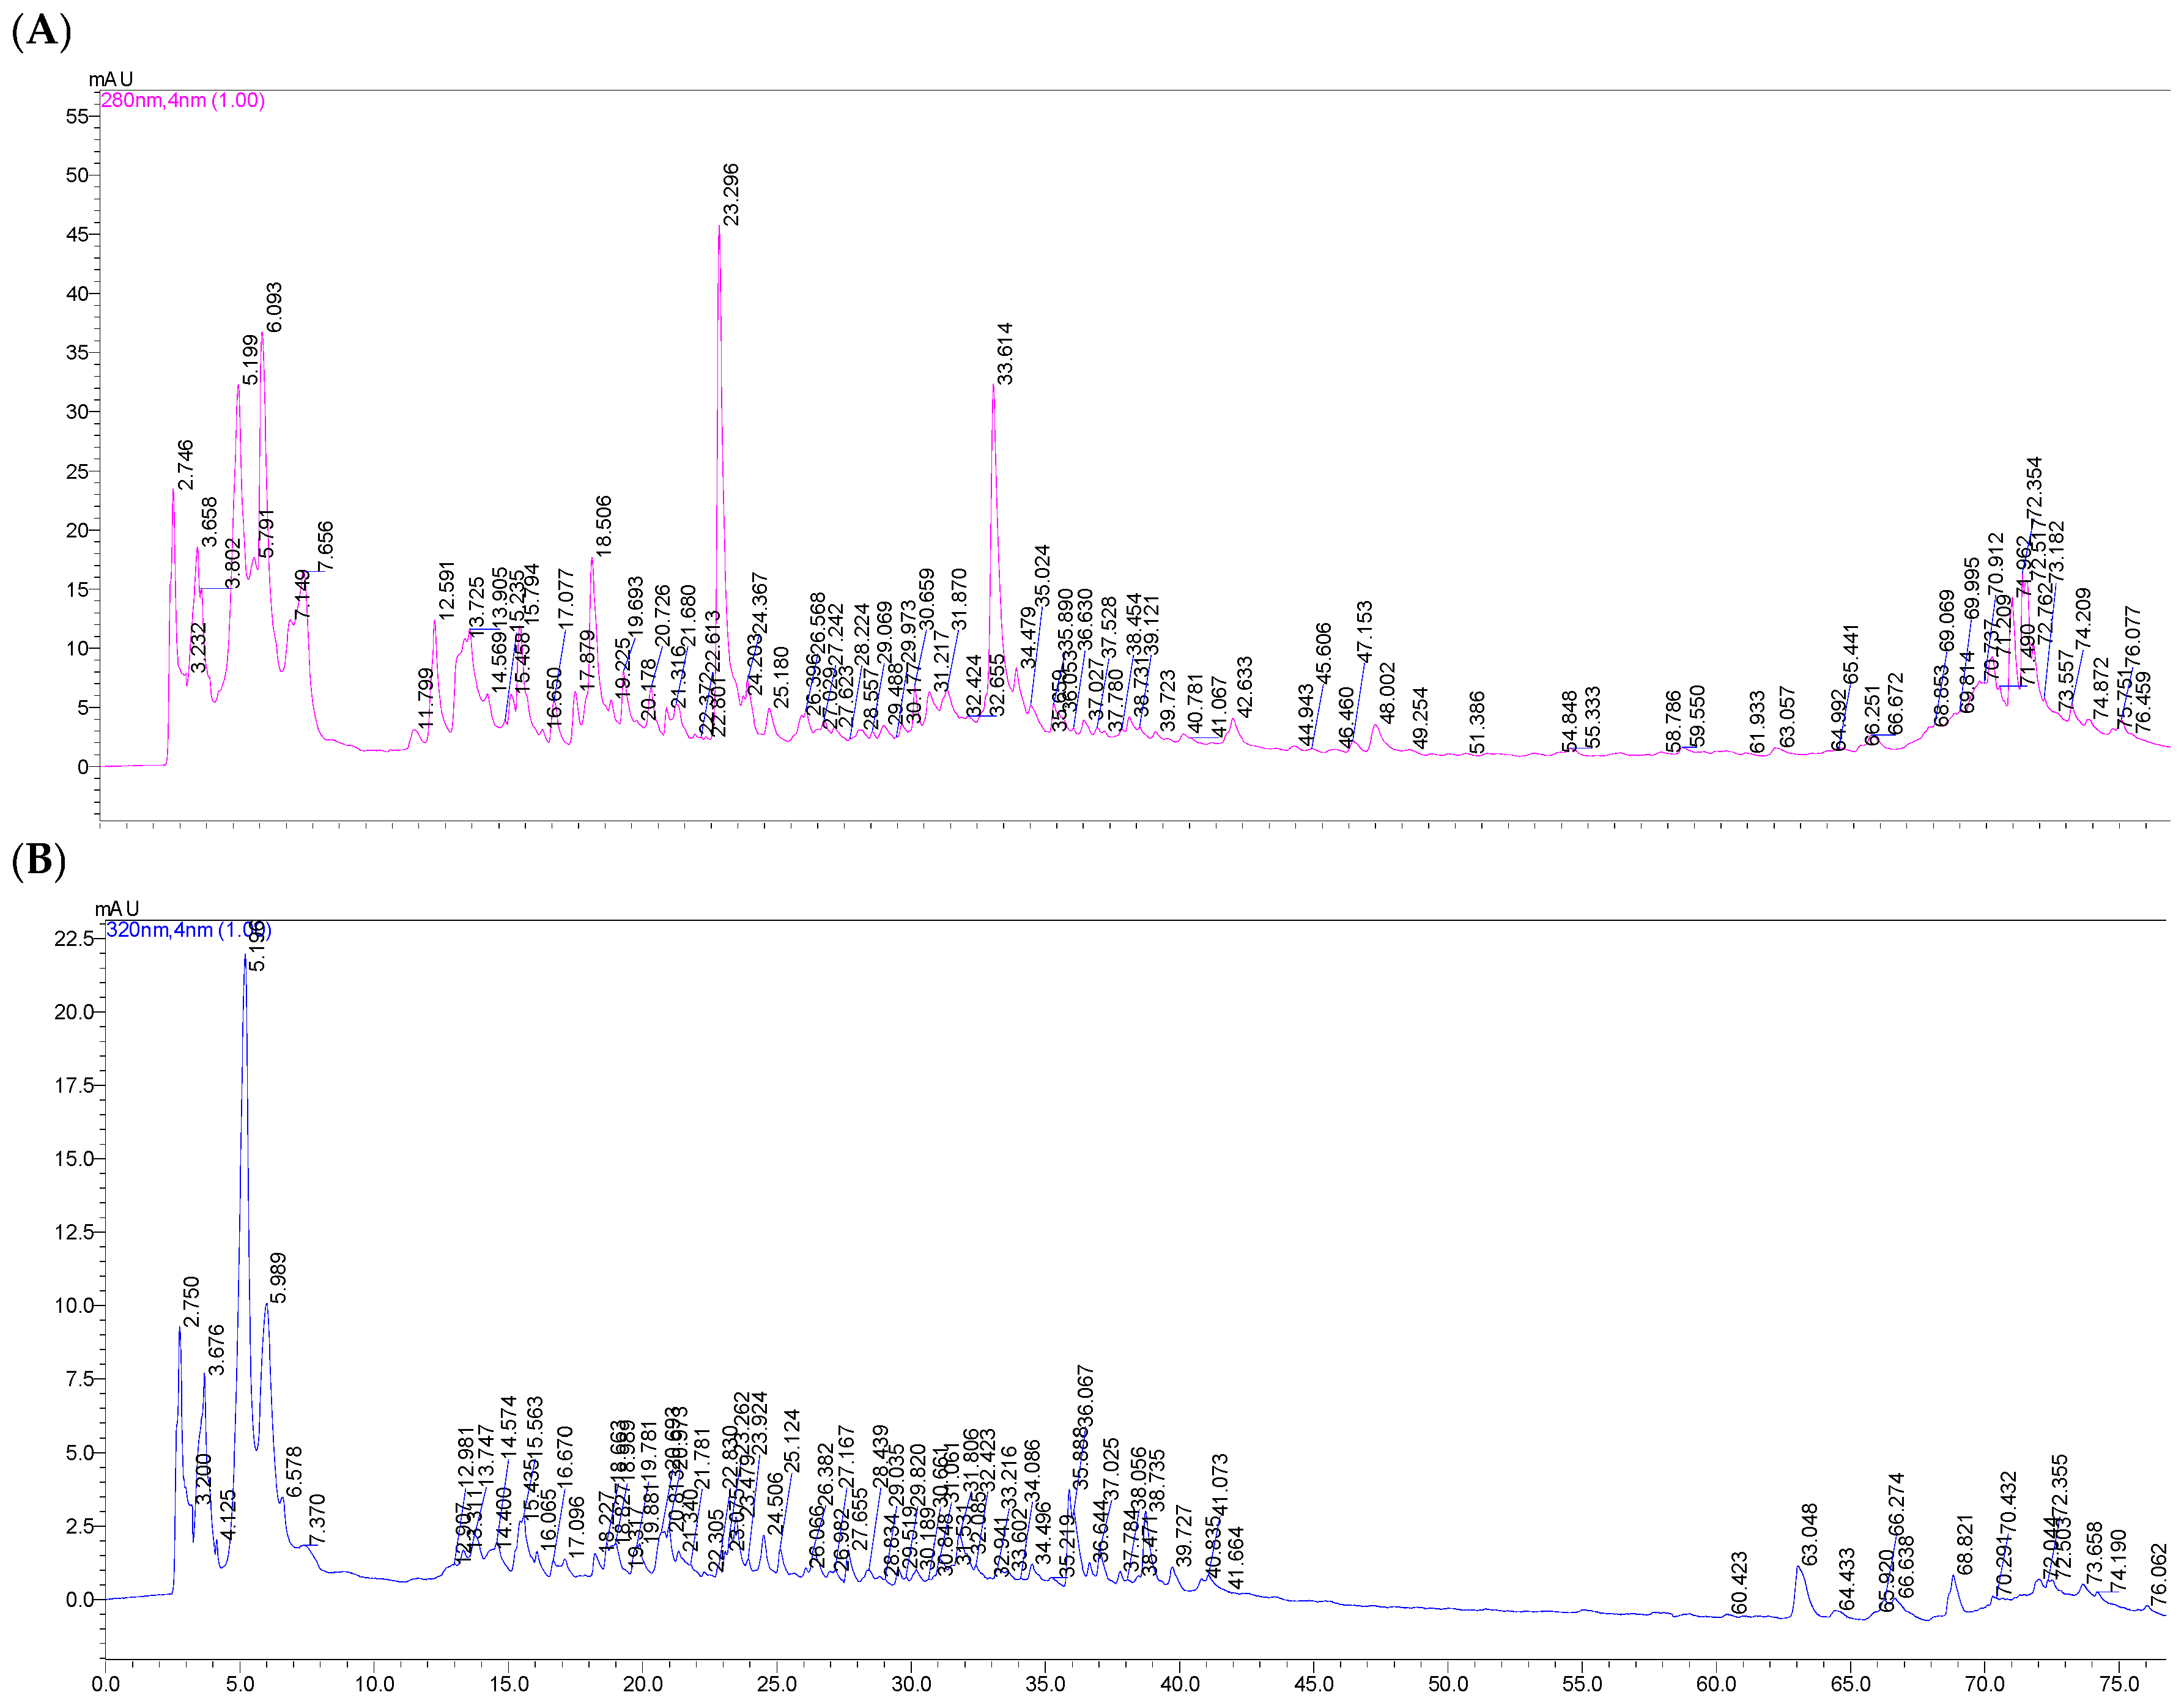
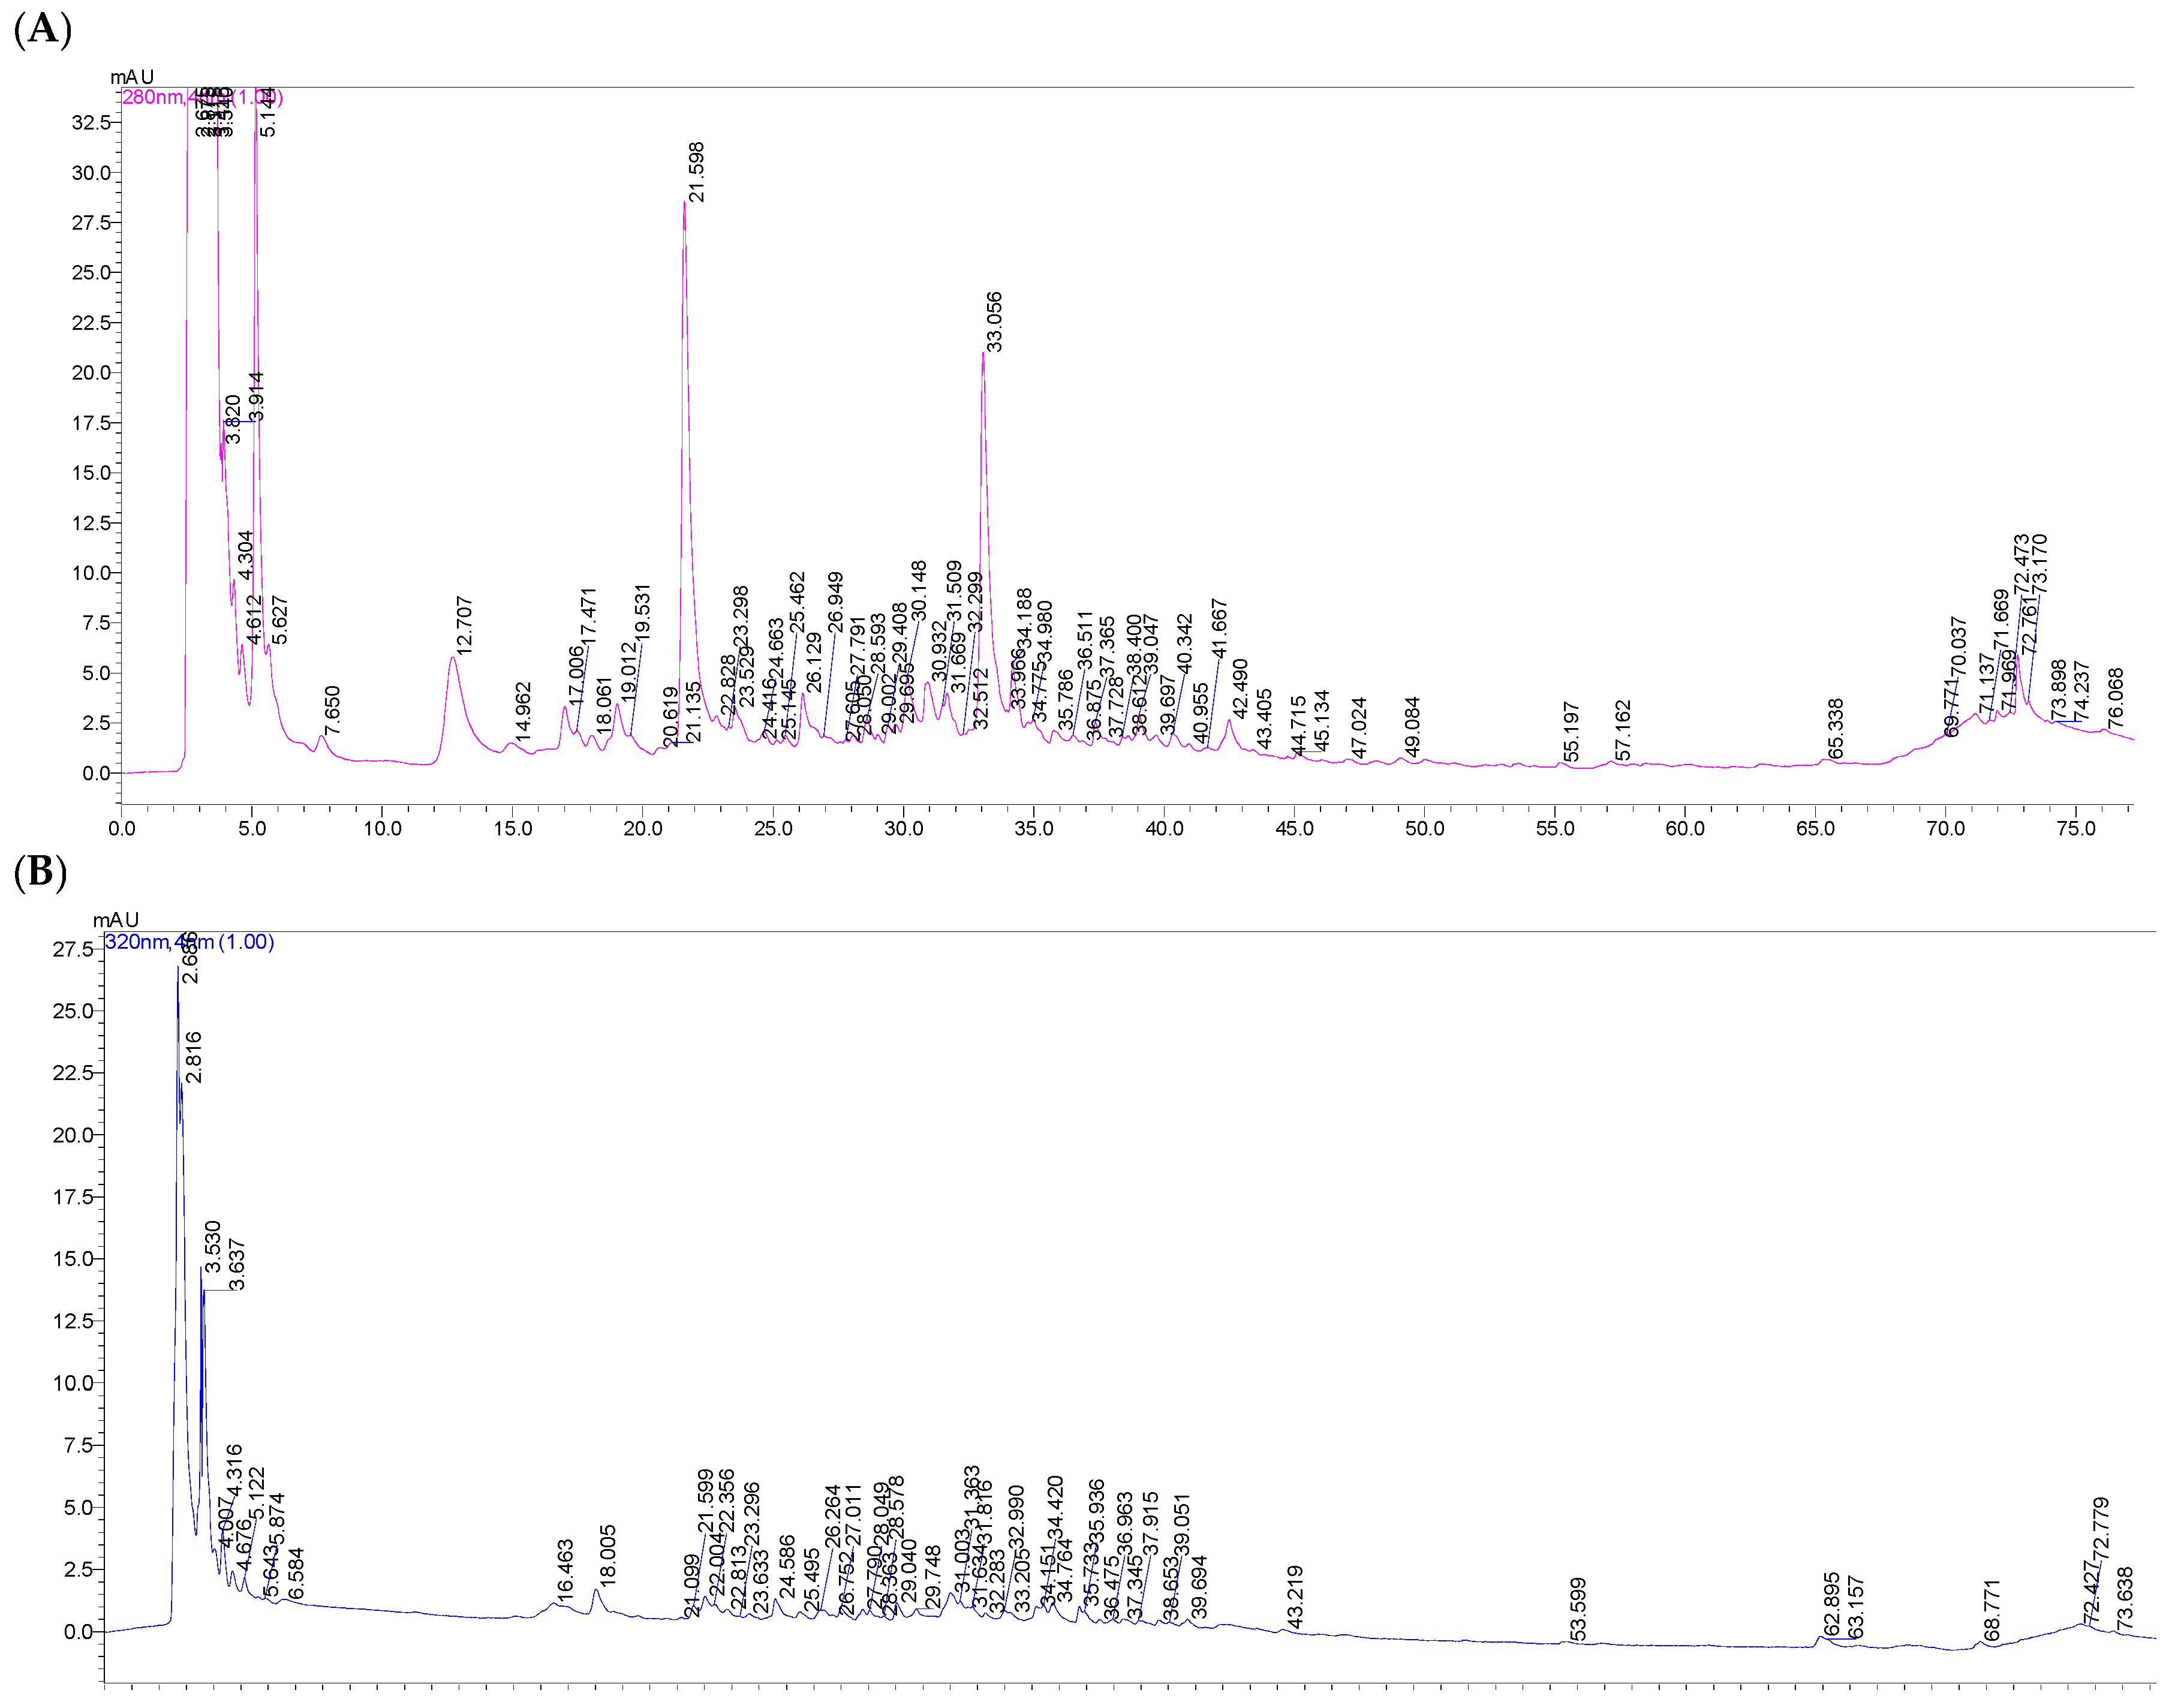
To characterize the phenolic composition of freeze-dried horseradish, extracts obtained under optimized conditions were analyzed using high-performance liquid chromatography (HPLC). The chromatograms recorded at 280 nm and 320 nm (
Figure 5 and
Figure 6) highlight the presence and distribution of phenolic compounds depending on the solvent used, providing a detailed view of the polyphenolic profile in the tested extracts.
Table 3 presents the polyphenolic composition of horseradish extracts obtained with the two extraction solvents (methanol–water in a 1:1 ratio and ultrapure water) under the optimal conditions resulting from the Design Expert program.
The values obtained by high-performance liquid chromatography (HPLC) were superior to the spectrophotometric analysis. Thus, the higher values obtained by HPLC reflect a more precise and selective detection of polyphenols in the freeze-dried horseradish extract, as it provides an individual separation and quantification of the compounds, highlighting even the polyphenols present in low concentrations, but with specific absorption.
A total of seven polyphenols were identified in the prepared extracts. The phenolic compounds extracted from horseradish root can be classified into two categories: hydroxybenzoic acids and hydroxycinnamic acids (
Table 3).
Following the analysis, protocatechuic acid, caffeic acid, chlorogenic acid, and rosmarinic acid were identified in both the extracts obtained with the hydroalcoholic solvent and those with the aqueous solvent, although significantly higher values were recorded in the extracts obtained with methanol–water (1:1, v/v). p-Hydroxybenzoic acid and vanillic acid were detected exclusively in the aqueous extracts; these compounds were not identified in the hydroalcoholic extracts, possibly due to differences in solubility or matrix interferences in the hydroalcoholic medium. p-Coumaric acid was identified only in the extract obtained with the hydroalcoholic mixture, suggesting a higher solubility in environments with intermediate polarity. Its absence in the aqueous extract indicates low solubility in pure water, while the presence of alcohol facilitates the extraction of this moderately polar phenolic compound.
Following the HPLC analysis, a total polyphenol content of 5.61 mg/g was identified in the horseradish extract obtained with the methanol–water (1:1, v/v) solvent, significantly higher than that obtained using ultrapure water, where the total polyphenol content was 1.26 mg/g. This demonstrates the higher solubility of the polyphenols found in horseradish in solvents with lower polarity.
In both types of solvent used for extraction, the most abundant polyphenolic compound was protocatechuic acid, representing 89.97% of the total percentage of polyphenols in the hydroalcoholic extract and 57.26% in the aqueous one. In the hydroalcoholic extract, it was followed by caffeic acid (4.16%), while in the aqueous extract, by p-hydroxybenzoic acid (17.49%).
3.6. Identification and Quantification of Vitamin C
Vitamin C belongs to the class of non-enzymatic antioxidants and exhibits an anti-allergic effect through the mechanism of prostaglandin inhibition [
39]. Vitamin C is the main water-soluble antioxidant [
39,
40] present in fruits and vegetables [
41,
42]. In addition to its antioxidant and anti-allergic properties, it also has anti-inflammatory characteristics [
3]. According to the literature, it is considered beneficial both in the prevention and treatment of allergic conditions [
3,
43]. The anti-allergic capacity of vitamin C is based on its antihistamine action, which results from its non-enzymatic reaction with histamine [
44], interfering with its chemical structure and breaking down the imidazole ring [
41].
In plants, the role of vitamin C is to protect against oxidative stress and regulate electron transport in the process of photosynthesis [
35], contributing to maintaining cell division and growth [
45]. In the human body, vitamin C provides protection against radicals and pollutants by donating electrons, helping to lower histamine levels in the blood [
46]. Vitamin C is involved in various reactions in the body, such as collagen and serotonin synthesis, acting as a cofactor for many essential enzymes [
47]. Incorporating fruits and vegetables rich in vitamin C into the diet is all the more important since the human body is unable to synthesize ascorbic acid [
39,
46], due to the lack of the enzyme gulonolactone oxidase [
43,
45]. Horseradish contains vitamin C in a high proportion [
16,
24,
28,
46], about three times more than citrus fruits [
48]. The high vitamin C content makes it useful in treating scurvy [
33,
48,
49].
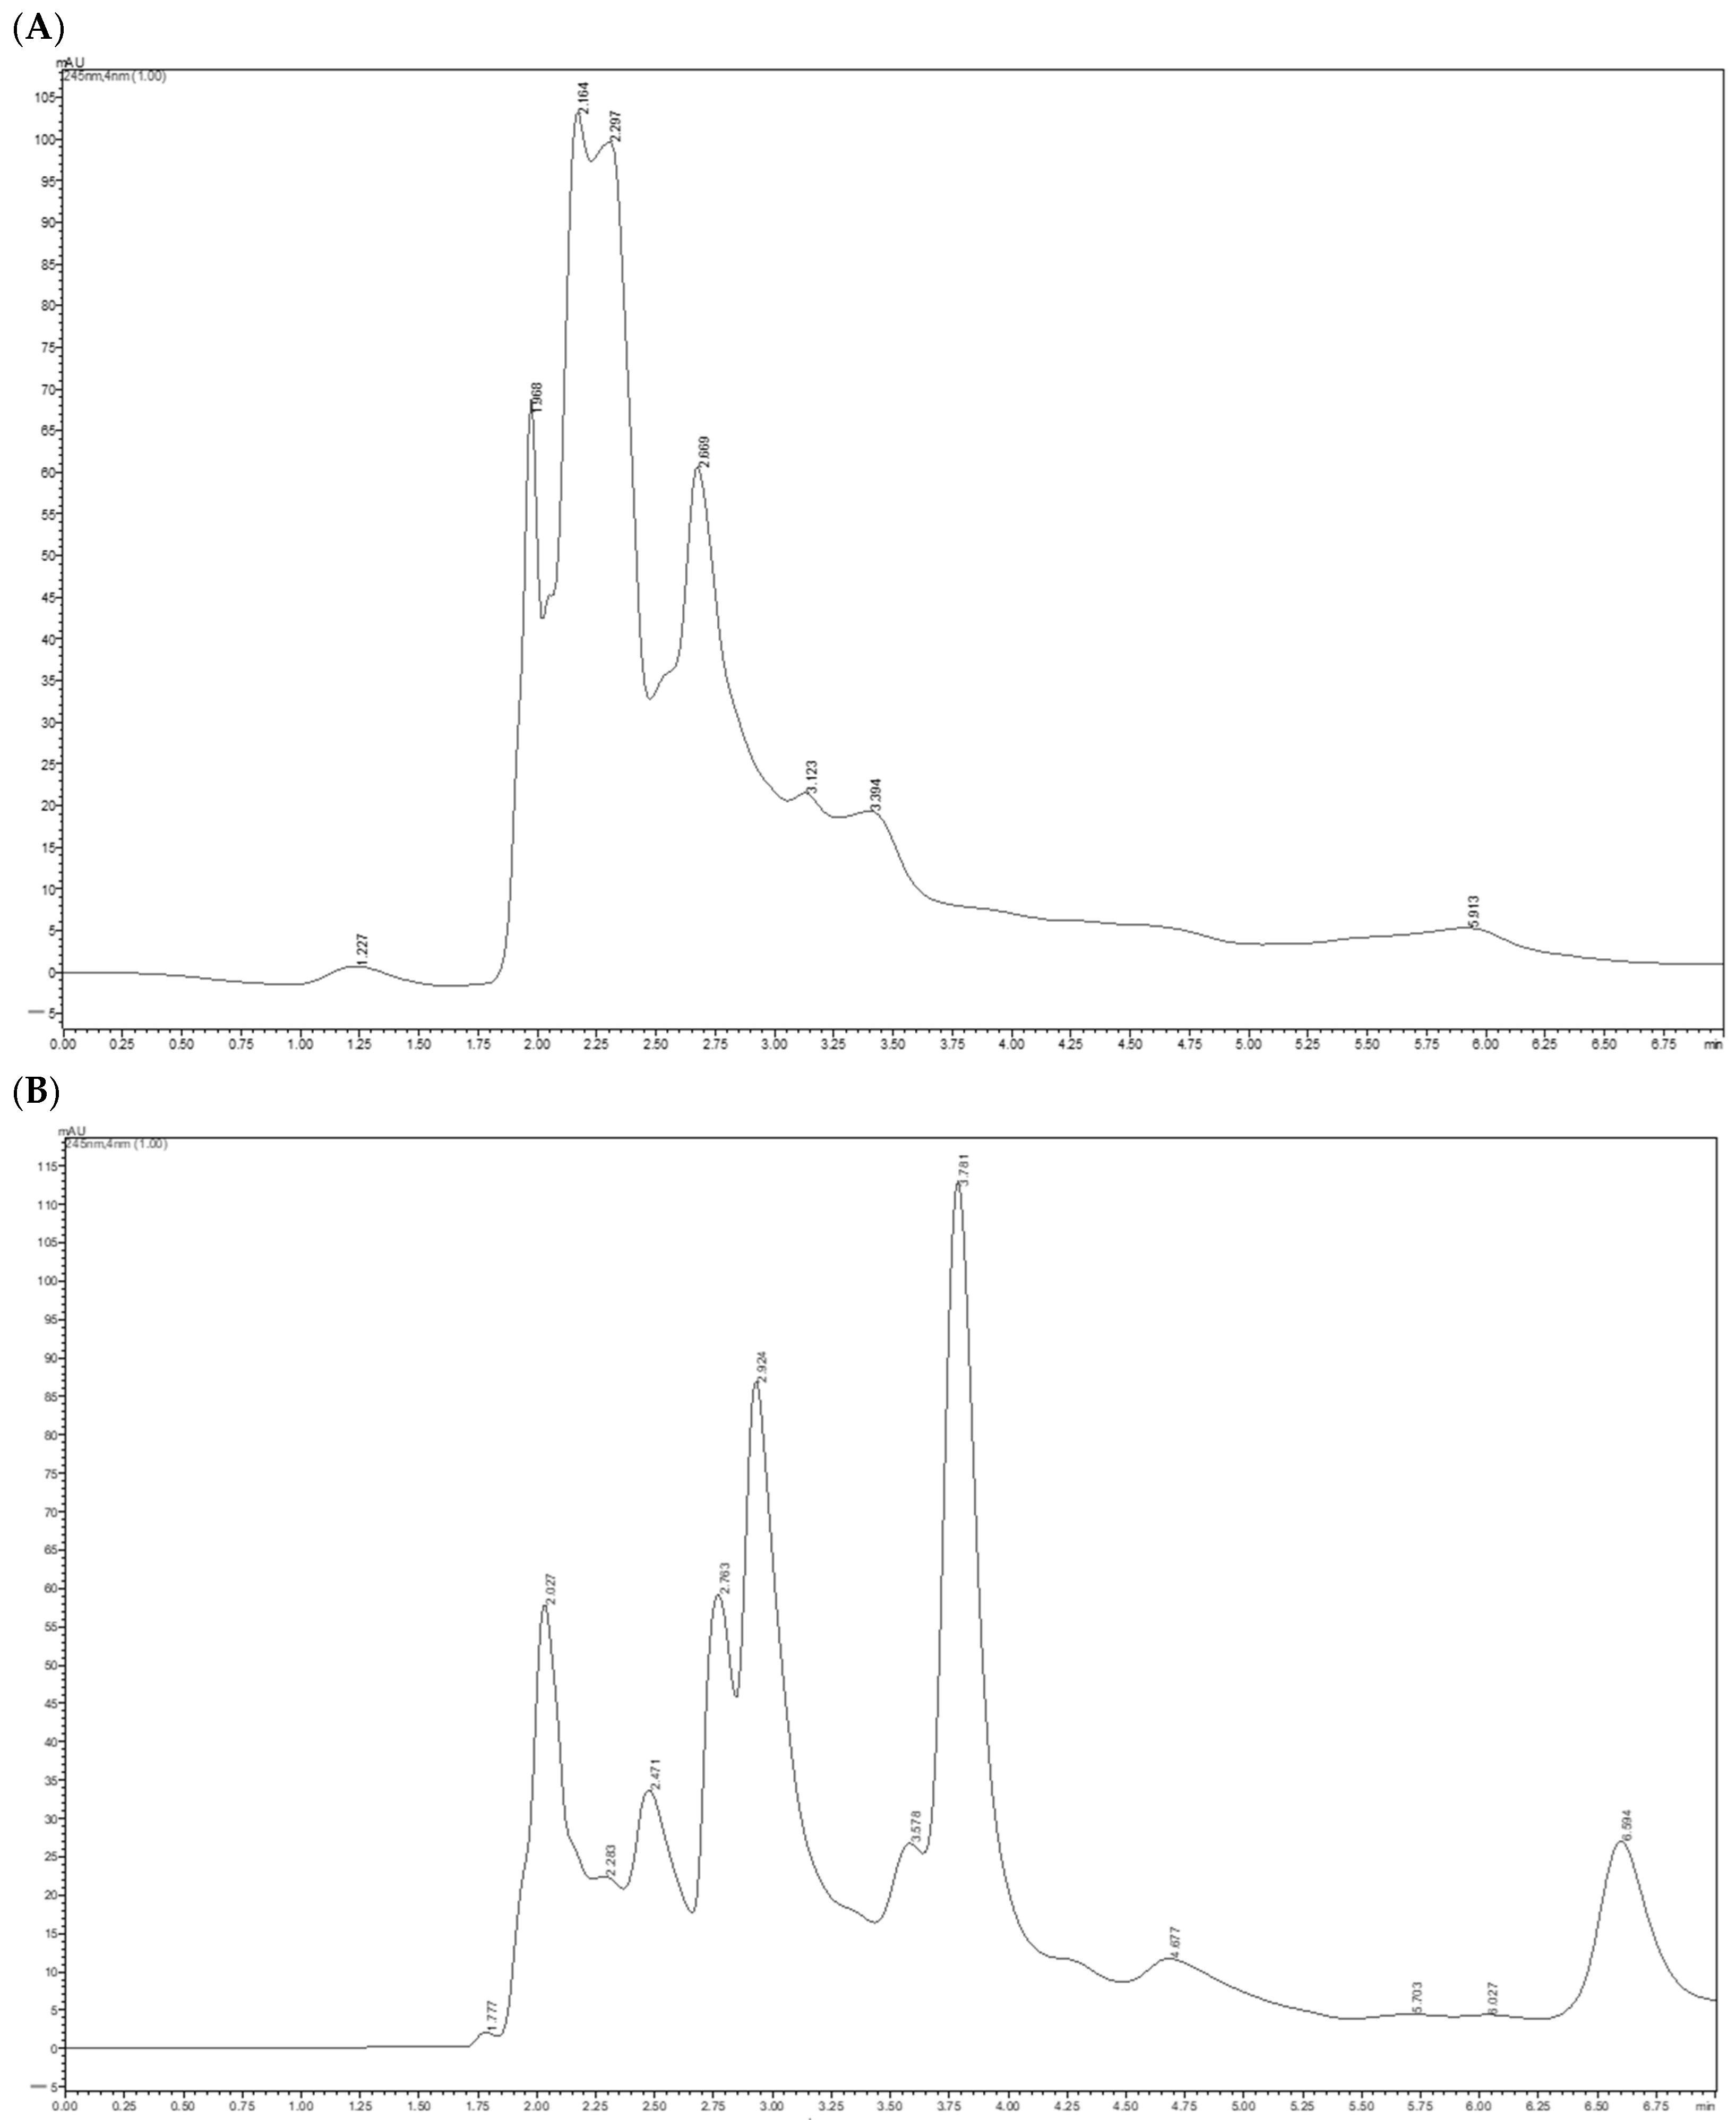
Figure 7 shows the chromatograms for vitamin C at a wavelength of 245 nm for the optimized horseradish root extracts obtained.
The vitamin C content was influenced by the type of solvent used in the extraction process. Thus, the hydroalcoholic extracts recorded a concentration of 105.32 mg/100 g of dry product, higher than that obtained from the aqueous extracts (90.35 mg/100 g of dry product), suggesting a higher efficiency of methanol in releasing and stabilizing ascorbic acid.
3.7. Fatty Acids Analysis
Gas chromatography coupled with mass spectrometry (GC-MS) is considered the primary method for analyzing fatty acids in various types of plant samples [
50]. Typically, fatty acids are not sufficiently volatile or stable to be directly analyzed by gas chromatography techniques, so they must be converted into fatty acid methyl esters (FAMEs) to improve their volatility and thermal stability [
50].
The scientific literature reports that long-chain polyunsaturated fatty acids (PUFAs) exhibit immunomodulatory effects [
51]. Omega-3 (W-3) fatty acids have been shown to support immune system function by increasing the levels of protective antibodies such as IgA, IgG, and IgM, while reducing the production of IgE, which is involved in allergic reactions [
52].
Horseradish has a very fine oil, and the antioxidant activity of oil extracted from horseradish roots has been reported to be superior to both natural antioxidants, such as α-tocopherol, and synthetic antioxidants, such as butylhydroxyanisole (BHA) and butylhydroxytoluene (BHT) [
23].
Figure 8 illustrates the fatty acid profile identified in freeze-dried horseradish, determined by gas chromatography coupled with mass spectrometry.
The fatty acid profile of the freeze-dried horseradish powder is presented in
Table 4.
Following the chromatographic analysis of fatty acids from the freeze-dried horseradish, both saturated fatty acids (SFAs) and mono- (MUFAs) and polyunsaturated fatty acids (PUFAs) were identified, with the latter predominating. Linolenic acid was identified in the highest proportion (30.68%), being a derivative of α-linolenic acid (ALA), which belongs to the omega-3 (n-3) fatty acid class. These essential fatty acids are known for their protective and beneficial role in allergic diseases [
51]. According to the scientific literature, this fatty acid is present in the highest amount in both the roots and leaves of horseradish [
52,
53,
54].
The second most abundant compound was oleic acid (C18:1) with 22.09% and linoleic acid (C18:2 trans) with 18.92% of the total. The total content of saturated fatty acids (SFA) was lower (16.19%), the most representative being palmitic acid (C16:0), with a percentage of 13.38% of the total fatty acids identified.
5. Conclusions
The present study highlights horseradish (Armoracia rusticana) as a promising natural source of bioactive compounds, which have been associated in previous research with antiallergenic properties. However, further studies are needed to confirm such potential in horseradish specifically. In this regard, spectrophotometric and chromatographic analyses were performed to highlight the complexity and diversity of the identified compounds. The extracts were obtained with two different solvents—methanol–water (1:1, v/v) and ultrapure water—and the specific parameters for ultrasonication (time, temperature, and potency) were varied to determine the optimal conditions, allowing maximum extraction of polyphenols and vitamin C, subsequently analyzed by HPLC. The content of fatty acids found in lyophilized horseradish was also analyzed by gas chromatography, compounds with properties that support its antiallergenic character.
During the extraction process, a significant sensitivity of horseradish compounds to process variables was highlighted, suggesting that they are directly influenced by all extraction parameters. The determinations performed revealed a better solubility of polyphenols, flavonoids, and antioxidant substances in the hydroalcoholic mixture compared to the aqueous one. Furthermore, results for total phenolic content (TPC), total flavonoid content (TFC), and DPPH radical scavenging activity demonstrated increased compound instability under prolonged exposure to elevated temperatures. However, it is important to note that the use of methanol, a non-food-grade solvent in the hydroalcoholic mixture, limits its direct applicability in food products. Therefore, while methanol facilitates efficient extraction and compound solubilization, further research should focus on optimizing food-grade solvents such as water, which—although less efficient—offer safer alternatives for potential food applications. On the other hand, higher potency during ultrasound-assisted extraction had a favorable impact, highlighting the importance of optimizing extraction conditions.
This study successfully identified and quantified key bioactive compounds such as polyphenols, vitamin C, and fatty acids in horseradish extracts. While the identified bioactive compounds are known for their antioxidant and potentially antiallergenic properties based on literature data, further investigations—including biological or clinical evaluations—would be valuable to both clarify their biological activities and to complement the current findings. Such additional studies could help substantiate potential functional properties, including antiallergenic effects, thereby providing a more complete understanding of the health-related benefits of horseradish extracts.
