1. Introduction
Climate change is one of the greatest current and future challenges facing humanity. Energy consumption, at the heart of the development of societies, is responsible for more than three quarters of greenhouse gas emissions [
1]. In the European Union (EU), the construction sector accounts for 50% of energy consumption and 36% of greenhouse gas emissions over the life cycle of a building [
2]. The building sector is therefore a key area for mitigating the effects of climate change [
3].
The energy required for the operation of dwellings is a variable that depends on multiple parameters, such as the characteristics of buildings, thermal envelopes, household consumption patterns and local climatic conditions. In the EU, air conditioning accounts for 64.1% of household energy expenditure, followed by water heating (14.9%), appliances and lighting (13.9%) and other uses (6.9%) [
4]. The energy efficiency of buildings is crucial to maintaining the thermal comfort of the building’s occupants at low energy consumption, thus reducing the environmental impact [
5].
In this context, the European Commission has already warned that 75% of the EU building stock is considered energy inefficient [
2]. Energy-inefficient buildings not only lead to higher energy consumption and greenhouse gas emissions but also increase the percentage of household income spent on energy bills and, at the same time, increase the likelihood of thermal discomfort for their occupants, leading to reductions in their quality of life [
6]. Suitable indoor thermal conditions in buildings are crucial to ensure the health and well-being of their occupants [
7,
8]. Previous studies proposed models for managing buildings and optimizing the thermal comfort [
9]. Indoor thermal environments with operative temperatures outside the thermal comfort thresholds can have adverse effects on the physical and mental health of their occupants [
10].
Those dwellings that are unable to afford to meet basic energy needs or spend an unreasonably high proportion of their income for this purpose are considered energy poor [
11,
12]. Energy poverty affects the most vulnerable households in Europe and its causes can be multidimensional, stemming from low household incomes, energy inefficiency and poor quality of dwellings [
12,
13]. The European Observatory on Energy Poverty suggests assessing this condition through indicators such as high share of energy expenditure in income (2M), the Low Absolute Energy Expenditure index (M/2 or also called Hidden energy poverty HEP), the percentage of population unable to keep home warm, and the percentage of population with arrears on energy bills [
14,
15].
Energy efficiency in dwellings is a key factor in the context of social equity, climate change mitigation and energy poverty. Numerous proposals and initiatives have been developed globally to mitigate its socio-economic effects. For example, the adoption of the 2030 Agenda for Sustainable Development Goals of the UN states in goal 7 ‘Ensure access to affordable, secure, sustainable and modern energy for all’ [
16]. The EU’s Climate and Energy Action Framework also sets out commitments to deliver a ‘sustainable, competitive and decarbonised energy system by 2050’, comprising short (2030), medium (2040) and long term (2050) targets for its member states [
17].
Recent changes to the European Directives [
18,
19] have raised the EU’s energy efficiency targets, including (1) intensifying energy savings obligations and emphasizing increased energy efficiency for consumers and residents of social housing; (2) achieving a fully decarbonised housing stock by 2050; (3) providing a stable environment for investment decisions; and (4) enabling consumers and businesses to make more informed choices to save money and energy. These ambitious goals pose significant challenges for the EU member states. In Spain, the Long-term Strategy for the Energy Rehabilitation of Buildings (ERESEE) [
20] sets out the actions, regulations [
21,
22] and procedures [
23] required to improve the energy efficiency of dwellings. The Energy Performance Certificates (EPC) set a common framework for the evaluation and comparison of the expected consumption of non-renewable energy and CO
2 emissions to the atmosphere. The EPC evaluate the energy efficiency and expected emissions of a building, using a numerical scale from “A” to “G”, with A being the most efficient and G the least [
23].
In terms of energy poverty, this has become a crucial issue on the public policy agenda in Spain. The “National Strategy against Energy Poverty 2019–2024” aims to combat energy poverty and ensure access to affordable, efficient and sustainable energy services [
24]. Costa-Campi et al. [
25] approached the analysis of this phenomenon in Spain from different perspectives, revealing its complexity and the need for multidimensional approaches. At the urban level, specific research on energy poverty has been carried out in cities such as Madrid, where the feminization of this phenomenon has also been studied. Through analyses based on statistical data and Geographic Information Systems (GIS), gender inequalities in energy access have been characterized, suggesting that women face differentiated deprivation conditions [
26]. Other approaches, such as the one proposed by Fabbri and Gaspari [
27] to analyse the city of Bologna, show the use of building energy performance to map energy poverty. The methodology used combines the assessment of energy costs and the calculation of energy poverty thresholds, allowing the creation of maps that can be used to design strategies at the city level.
As progress is made in understanding energy poverty and its determinants, it becomes clear that coordinated public policies adapted to local realities are required to mitigate energy poverty impact. EPCs and Energy Poverty Indices provide key information to analyse and compare the state of the building stock of a city. Although numerous studies have explored energy poverty at the city or district scale, they often overlook intra-district disparities. In the case of Seville, no study has yet addressed the analysis of energy efficiency and the vulnerability of families to energy poverty at the census tract level. This lack of detailed spatial assessment prevents the identification of high-risk areas where vulnerable dwellings are more likely to be affected by energy poverty. This article aims to address this research gap by providing a finer-scale analysis that can support more targeted and effective policy responses.
In this context, the objective of this study is to evaluate and identify, at the urban scale, the energy efficiency and vulnerability to energy poverty of the residential real estate stock in Seville, Spain. The analysis is carried out with a total of 45,908 residential real estate records, classified in two categories: Dwellings in Multi-family residential Buildings (DMB) and Single Family Dwellings (SFD). The results obtained make it possible to identify the current state of the residential building stock in the city of Seville, to quantify and locate the areas where energy-deficient buildings are concentrated, as well as to determine their extension and critical areas requiring intervention.
2. Materials and Methods
2.1. City Selected
Seville, the capital of the autonomous community of Andalusia, is located in southern Spain (coordinates 37.38863, −5.99534). Seville has a population of 693,229 inhabitants and is the fourth most populous city in Spain [
28] and the most populous city in Andalusia. This city is located on an alluvial plain formed by the Guadalquivir River [
29], which generates a relatively flat terrain at an average elevation of 5 masl [
30]. Seville has an area of 140.52 km
2 [
31] and is composed of 532 census tracts grouped into 11 districts (
Figure 1 and
Table 1). The distribution of the average annual income per household among the districts shows a marked socioeconomic heterogeneity in Seville. In this sense, the district of “Los Remedios” shows the highest average incomes, in contrast to the district of “Cerro-Amate,” which shows the lowest average incomes [
32].
Among the different districts, Cerro-Amate district is the second most densely populated district in the city [
28] and has a predominant residential area distributed in 69 census tracts [
31]. This is the 4th district of Seville and is located in the eastern part of the city, bordered by neighborhoods such as San Pablo-Santa Justa and Nervión, and to the south by the Alcalá de Guadaíra municipality. This district has been selected to carry out a specific assessment of energy efficiency and vulnerability at the census tract level due to its high representativeness in the sample selected with respect to other districts of Seville. The Cerro-Amate district has diverse socio-economic characteristics and a diverse building stock. The variability in building typology includes both individual block dwellings and single-family houses, built in different periods and in different states of preservation, which provides a context of high variability.
2.2. Methods
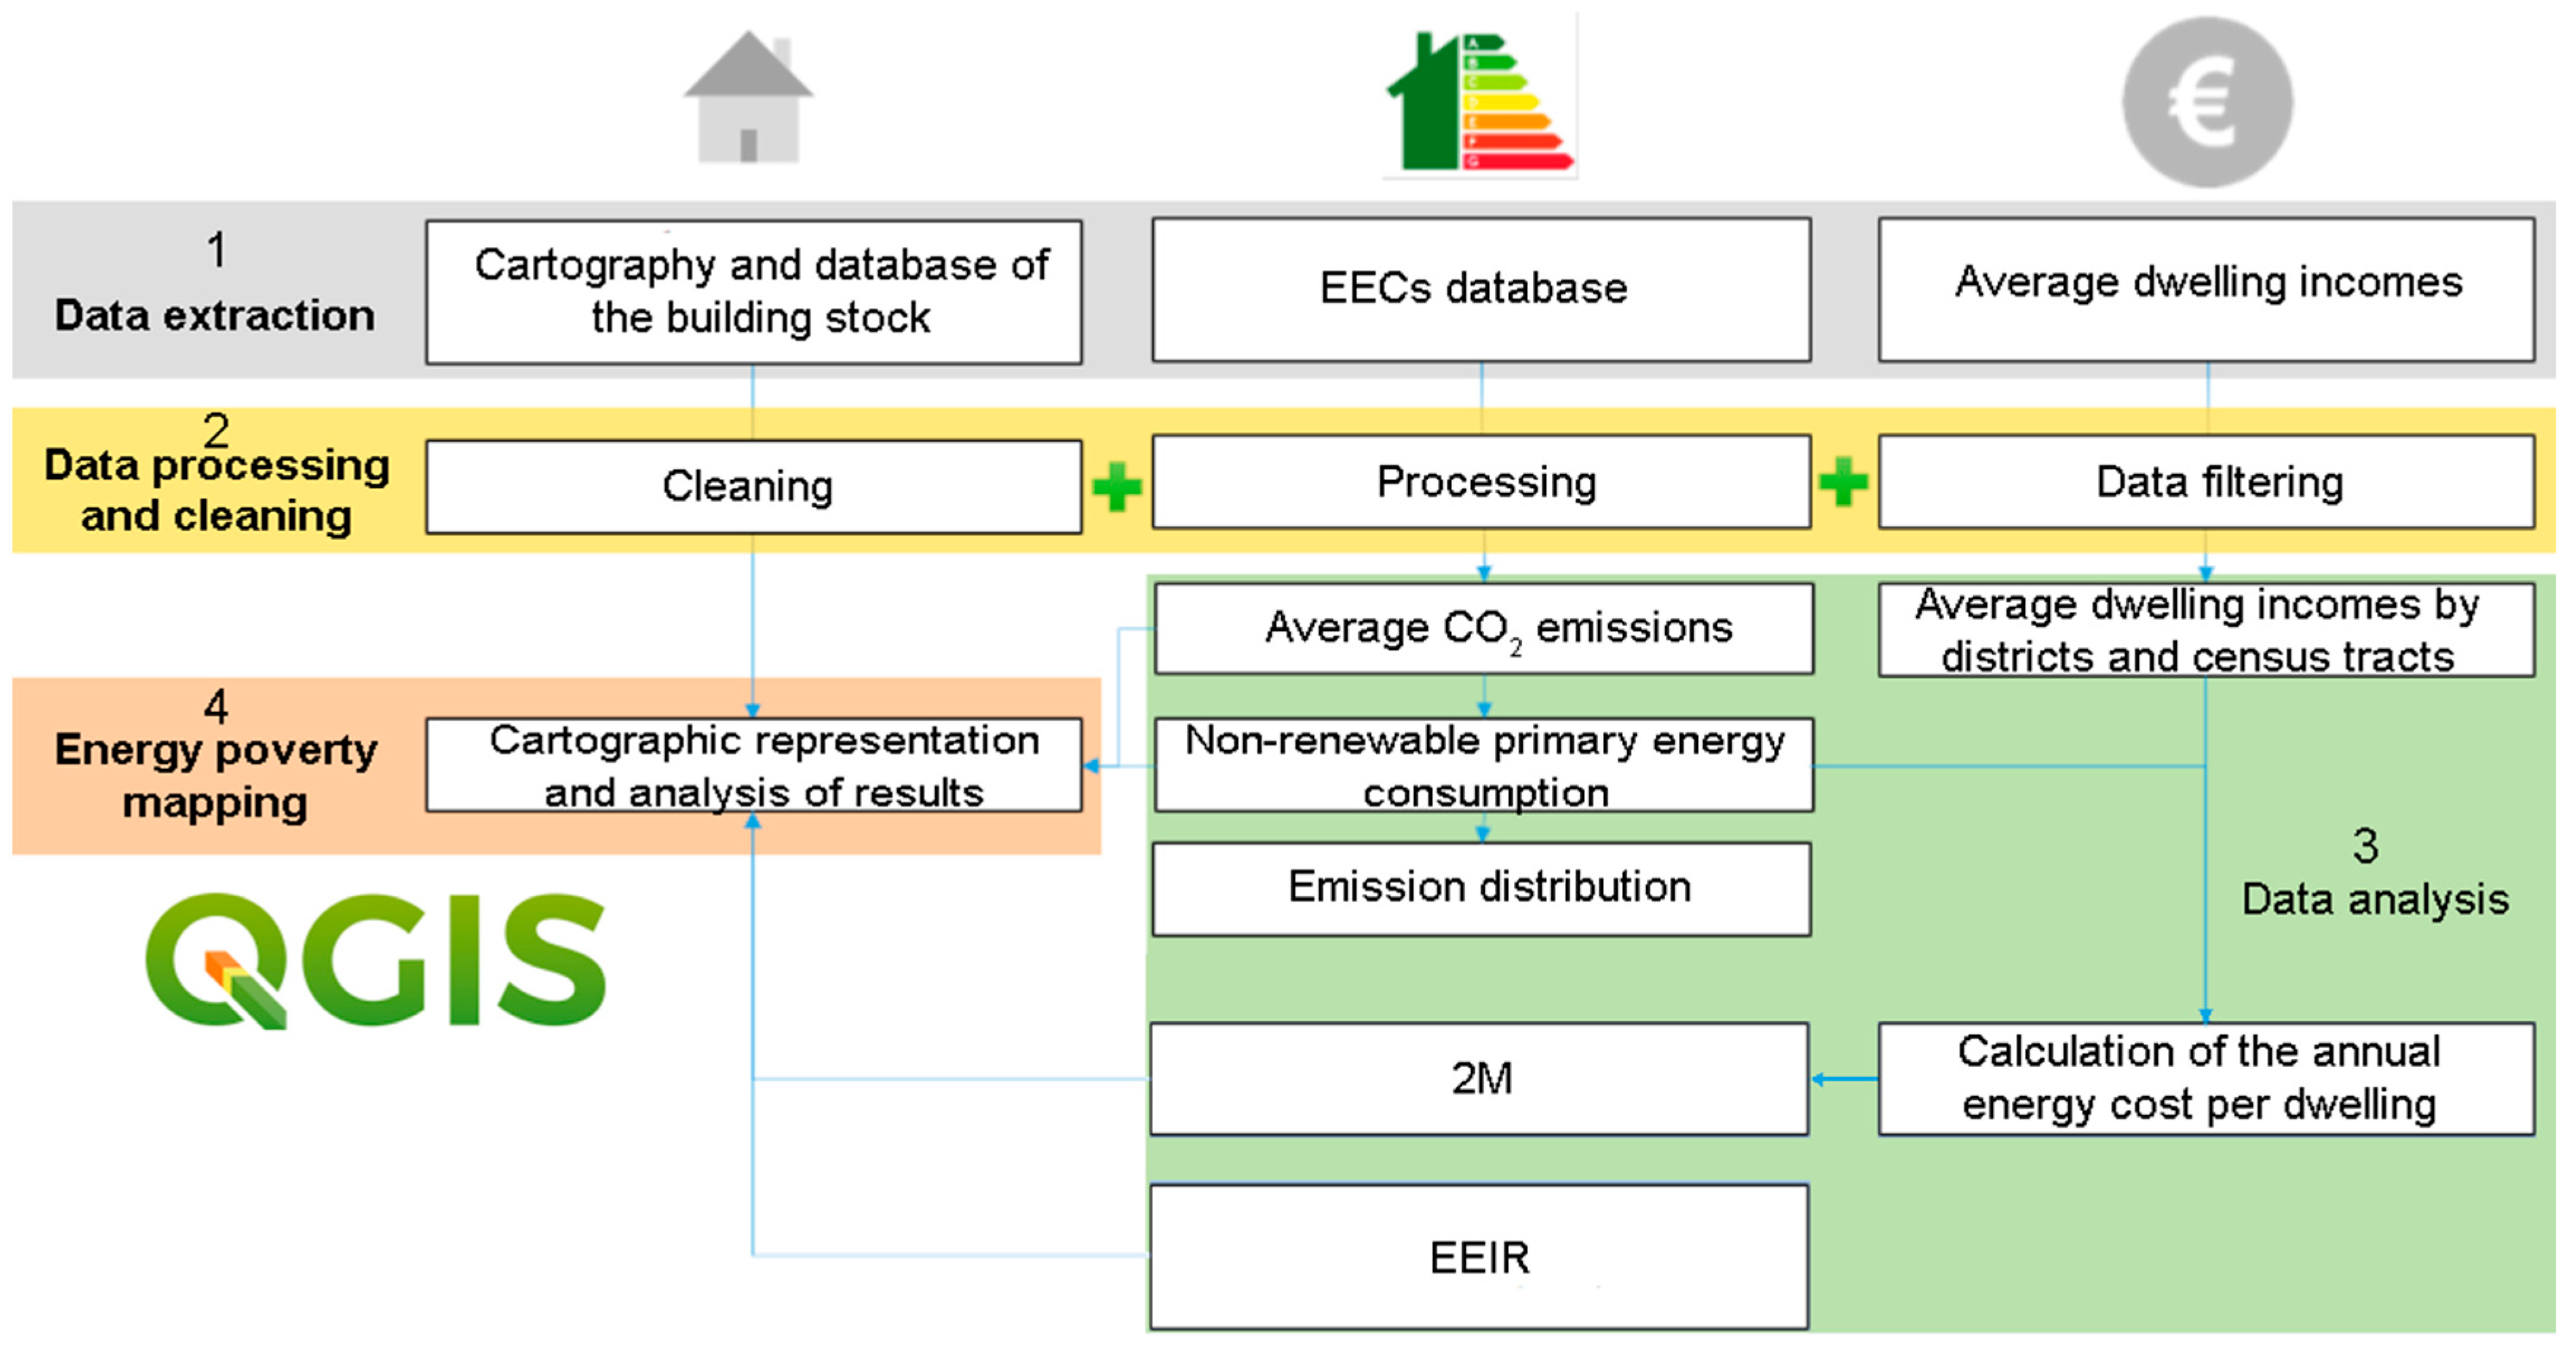
The methodology used in this study is based on 5 phases (
Figure 2): (1) Data extraction, (2) Data processing, (3) Data analysis and (4) Energy poverty mapping. Data processing and analysis are performed using Python 3.12 and QGIS 3.34.11 ‘Prizren’. Python is used for statistical analysis, while QGIS facilitates the visual representation of data on cartographic maps [
33].
2.2.1. Data Extraction
The study is based on information extracted from: (1) the EPC database [
34], (2) the Spanish cadastre database [
35], and (3) the Spanish National Statistics Institute (INE) [
31,
32].
Table 2 contains the variables extracted from the consulted databases. The dataset used in this study was retrieved from the open-access databases on 27 August 2024. It should be noted that the EPC database is continuously updated, and records added after this date were not considered in the present study.
2.2.2. Data Processing
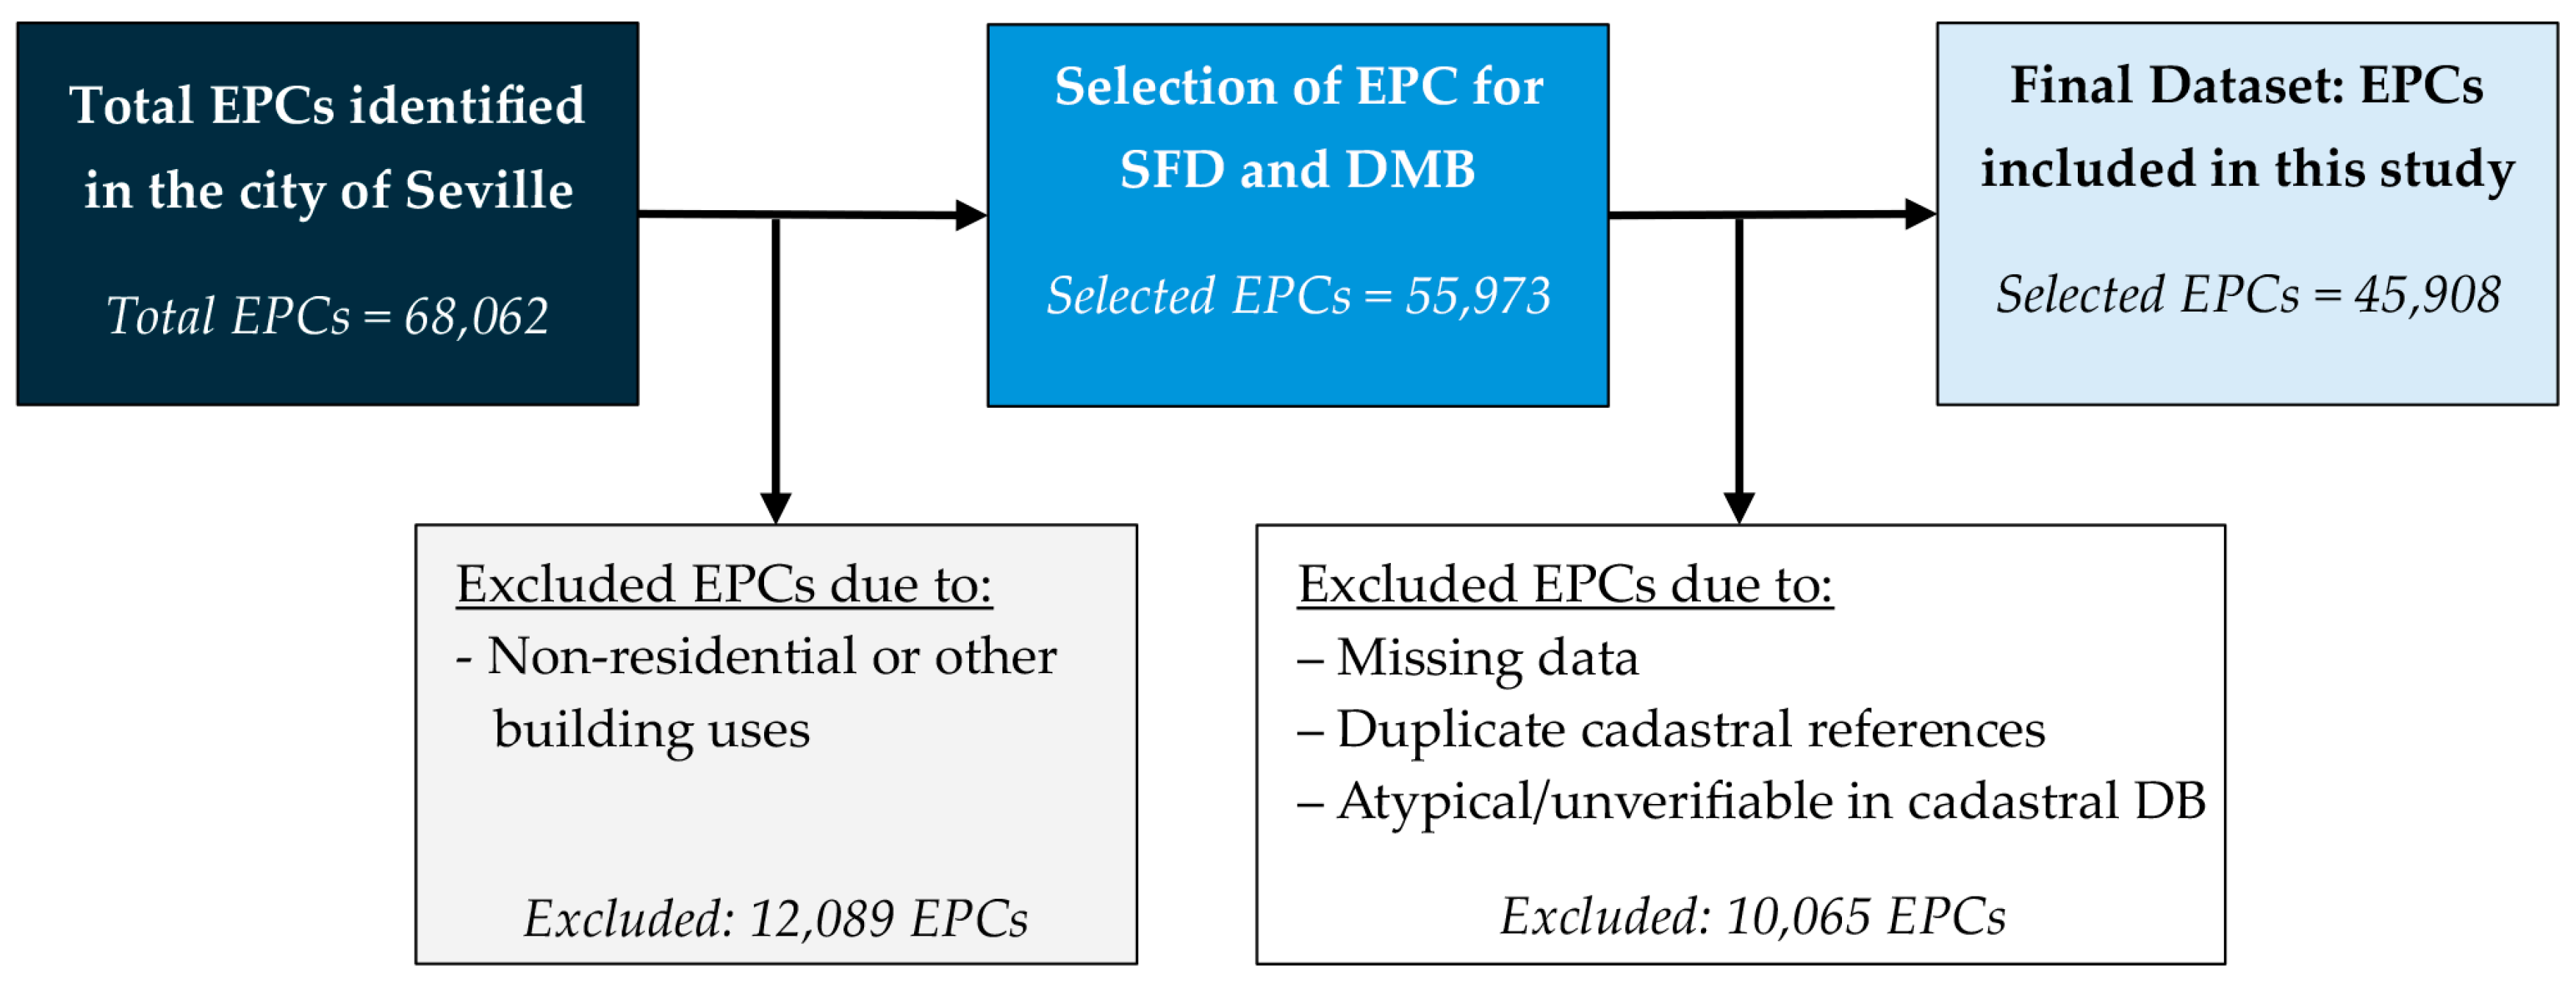
The procedure described below was applied to the database of EPCs (
Figure 3). The database initially contained 68,062 energy certificate records. The first step was to unify the format of the records according to the attributes: year of construction, building regulations, typology of the record and postcode. Subsequently, the records in the database were filtered according to their typology, selecting and separating only those corresponding to ‘Dwellings in Multi-family residential Buildings’ (DMB) and ‘Single-family dwellings’ (SFD). Afterwards, the cadastral references, which uniquely identify each property by means of 14–20 digits, were verified to ensure that they were correctly registered. Those data that did not meet this requirement were eliminated.
As a last step, registers with missing data, duplicate cadastral references, and those located outside Seville city were excluded. An analysis of the variables was carried out to identify and eliminate data with atypical and verifiable values in the cadastral database, such as year of construction and area of construction, in order to have more representative values in the sample. This step has resulted in a 32.5% reduction of the initial data, i.e., a total of 45,908 records have been used in this study (of which 40,676 (88.6%) are DMB and 5232 (11.4%) are SFD).
2.2.3. Data Analysis
The analysis of the energy efficiency of dwellings has been carried out at the building level. Since the database includes the cadastral records of each dwelling, the building energy efficiency calculation proposal of Conticelly et al. [
36] is used to find the weighted average consumption and CO
2 emissions of the building (Equations (1) and (2)).
where
is the average weighted non-renewable energy consumption of the building (kWh/m
2·year);
is the average CO
2 emissions of the building (kgCO
2/m
2·year);
is the area of dwelling
i (m
2);
is the average consumption of each dwelling (kWh/m
2·year);
is the average CO
2 emission of each dwelling (kgCO
2/m
2·year); and
is the number of dwellings assessed per building block.
The Energy Expenditure to Income Ratio (EEIR) is the monthly percentage of income used to pay for energy for air-conditioning in a dwelling. The EPC database contains the values of the expected energy demand of non-renewable energy consumption (
) for each dwelling. This value was used to calculate the currency value of the consumption. The currency value of the Energy Expenditure (EE) is obtained using the methodology proposed by Bienvenido-Huertas et al. [
37] (Equations (3) and (4)).
where VAT (Value Added Tax) corresponds to 1.21;
is the Special Tax on Electricity set at 3.8% [
38].
is the Energy Expenditure Before Taxes and is calculated by Equation (4).
is the expected energy consumption demand of non-renewable energy of each property;
is the net price of domestic electricity (which for 2021 is set at 0.162 €/kWh [
39]);
corresponds to the area of the dwelling
in m
2;
is the equipment rental (this fixed cost for a simple single-phase meter corresponds to 0.54 €/month [
40]);
is the cost associated with the contracted power and is calculated with Equation (5) (assuming a typical contracted power of 4.60 kW).
The EEIR indicator is used to assess energy vulnerability and is calculated using Equation (6).
where
is the energy expenditure of the dwelling
and
is the annual income per household of the dwelling
.
Based on the results obtained, the 2M indicator is calculated. This indicator is one of the 4 indicators proposed by the EU Energy Poverty Observatory and adopted by the ENPE 2019–2024 [
24] to estimate energy poverty. The 2M indicator measures a dwelling’s disproportionate expenditure on energy services. It is calculated as the percentage of dwellings whose energy expenditure is more than twice the national median [
24]. The calculation of the 2M indicator is derived from the EEIR. The reference value of 2M is twice the national median established annually. The 2M is a variable reference value and depends on the aggregated energy behavior of the country. In Spain, this value corresponds to 8.8–9% for 2021 [
41]. For the purposes of this study, the energy poverty threshold (2M) is set at 10%, and the energy poverty vulnerability threshold is set at 5% (i.e., energy poverty vulnerability arises when half of the value of the energy poverty threshold is reached). These values (
Table 3) are also adopted in other previous studies carried out in Madrid by Sánchez-Guevara et al. [
42].
2.2.4. Energy Poverty Mapping
Once the Energy Expenditure-to-Income Ratio (EEIR) index has been calculated, a GIS system is used to map it on the urban territory. The methodology involves mapping district-level EPC data using a city shapefile within the QGIS environment. The first step in the mapping process involves assessing the energy performance of buildings. The
consumption is mapped, as this spatial representation allows for the systematic identification of urban areas with the highest average weighted non-renewable energy consumption. Subsequently, the Energy poverty threshold (2M) value and the Energy poverty vulnerability threshold value (see
Table 3) are used to classify dwellings according to three levels of energy vulnerability: low vulnerability when EEIR is less than or equal to the energy poverty vulnerability threshold (EEIR ≤ 5%); moderate vulnerability when EEIR is between the energy poverty vulnerability threshold and the energy poverty threshold (5% < EEIR < 10%); and high vulnerability when EEIR is equal to or greater than the energy poverty threshold (EEIR ≥ 10%). This mapping process facilitates the identification of areas across the city where energy performance is notably poor, highlighting critical energy vulnerability zones for targeted interventions.
Based on the results obtained, an analysis of energy efficiency and vulnerability to energy poverty has been carried out. A spatial analysis is carried out to identify districts with the poorest energy performance, focusing on areas with the greatest potential for improvement. It should be noted the limitations of this study. Firstly, it does not consider vulnerability and hidden energy poverty, i.e., those households that reduce their consumption to the minimum in order to be able to afford their energy bills, which is not reflected in the analysis of the 2M indicator.
2.3. Statistical Analysis
A statistical comparison between districts was also carried out in this study. For this purpose, Kolmogorov-Smirnov tests were used to check for normality. If the data were normally distributed, an ANOVA test is used to determine the existence of statistically significant differences between districts, followed by a Tukey test for post-hoc pairwise comparisons. Otherwise, if the data were not normally distributed, the non-parametric Kruskal-Wallis test and the Dunn’s test for post-hoc pairwise comparisons are used instead. The Tukey and Dunn’s post-hoc tests are used to explore further, when differences between districts are statistically significant, which specific districts differ. To determine whether differences between pairs of districts are significant, a significance level of 0.05 is chosen as a threshold.
3. Results
3.1. Energy Performance Statistical Results
The database analyzed in this study includes 45,908 dwellings. The sample is characterized by the high variability of the parameters evaluated, where there are dwellings with years of construction from 1850 to 2023 and dwellings with floor areas ranging from 12 to 1160 m
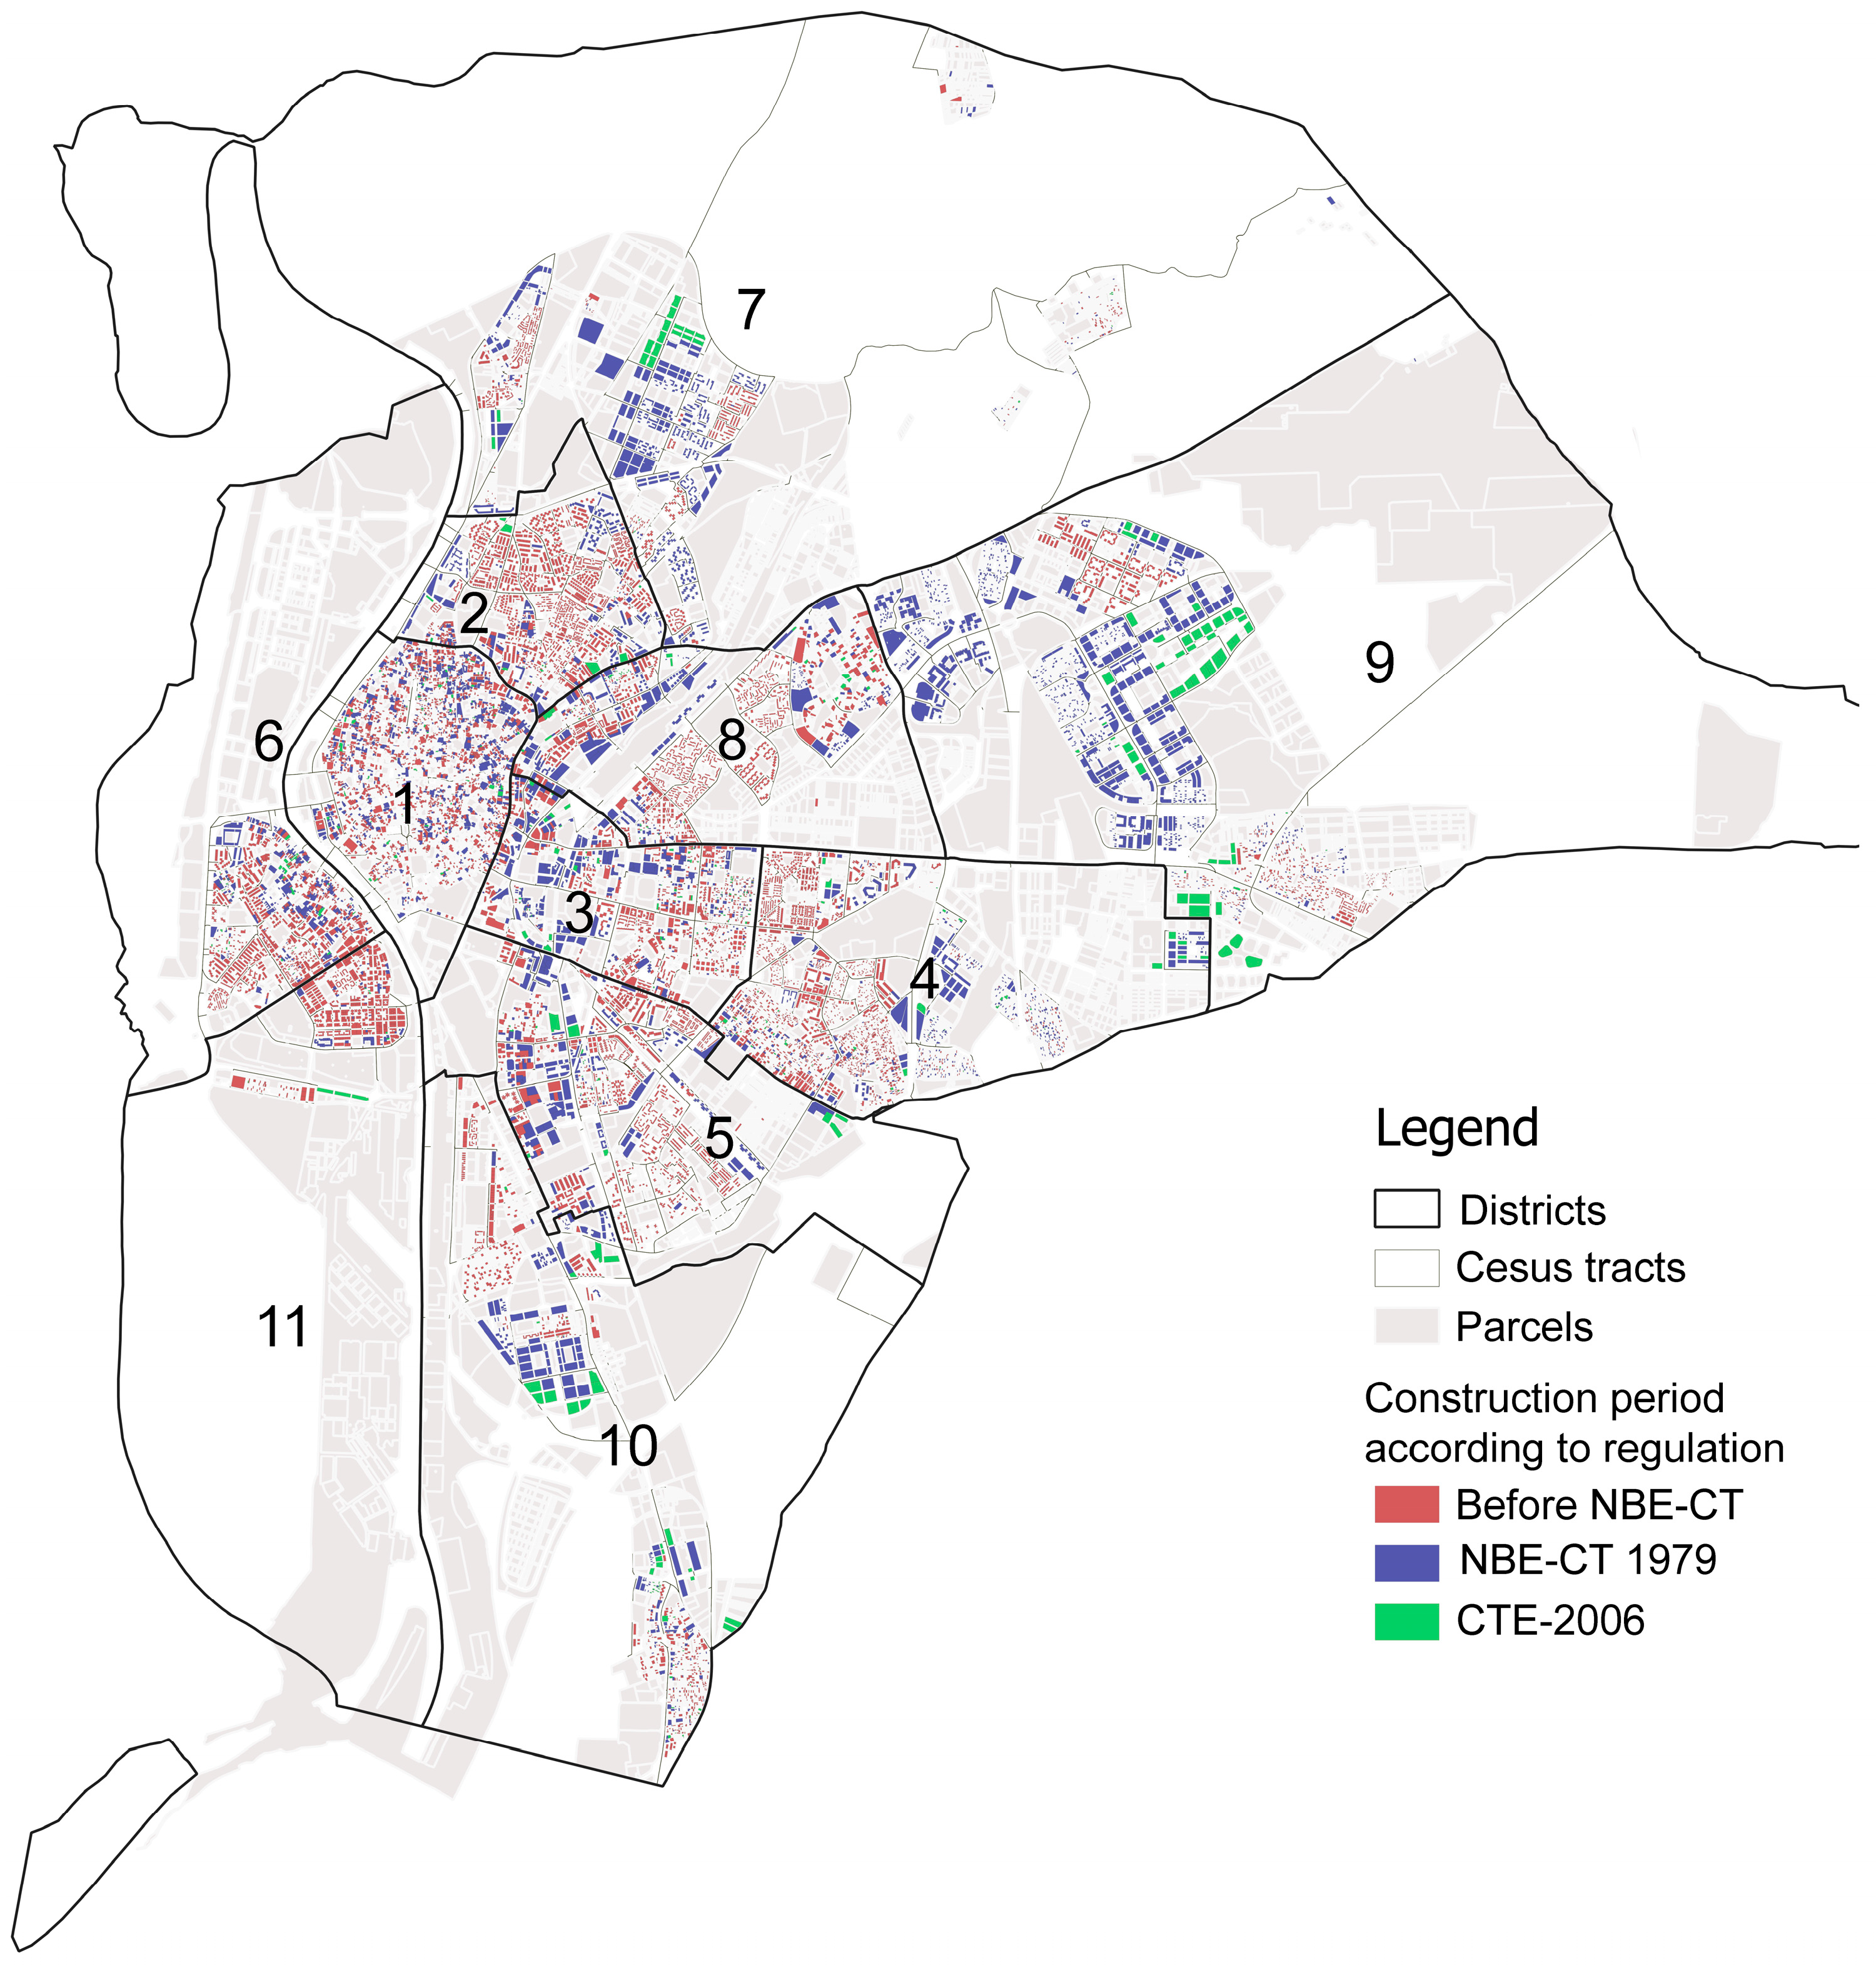
2. The results obtained show that 60% of the dwellings were built before the NBE CT-1979 standard [
43], 33% between the NBE CT-1979 standard and the CTE-2006 [
44] standard, and 7% after the entry into force of the CTE-2006 standard.
Figure 4 shows the distribution of dwellings according to the regulations in force when they were built. It can be seen that dwellings built to older standards are concentrated in the city center, while those built to more recent standards are on the outskirts.
Table 4 shows the distribution of SFDs and DMBs in Seville’s districts according to the results obtained from the database. DMBs in the sample represent 88.6% and SFDs 11.4%. The district with the highest number of records is Cerro-Amate, while the least representative is the Los Remedios district.5
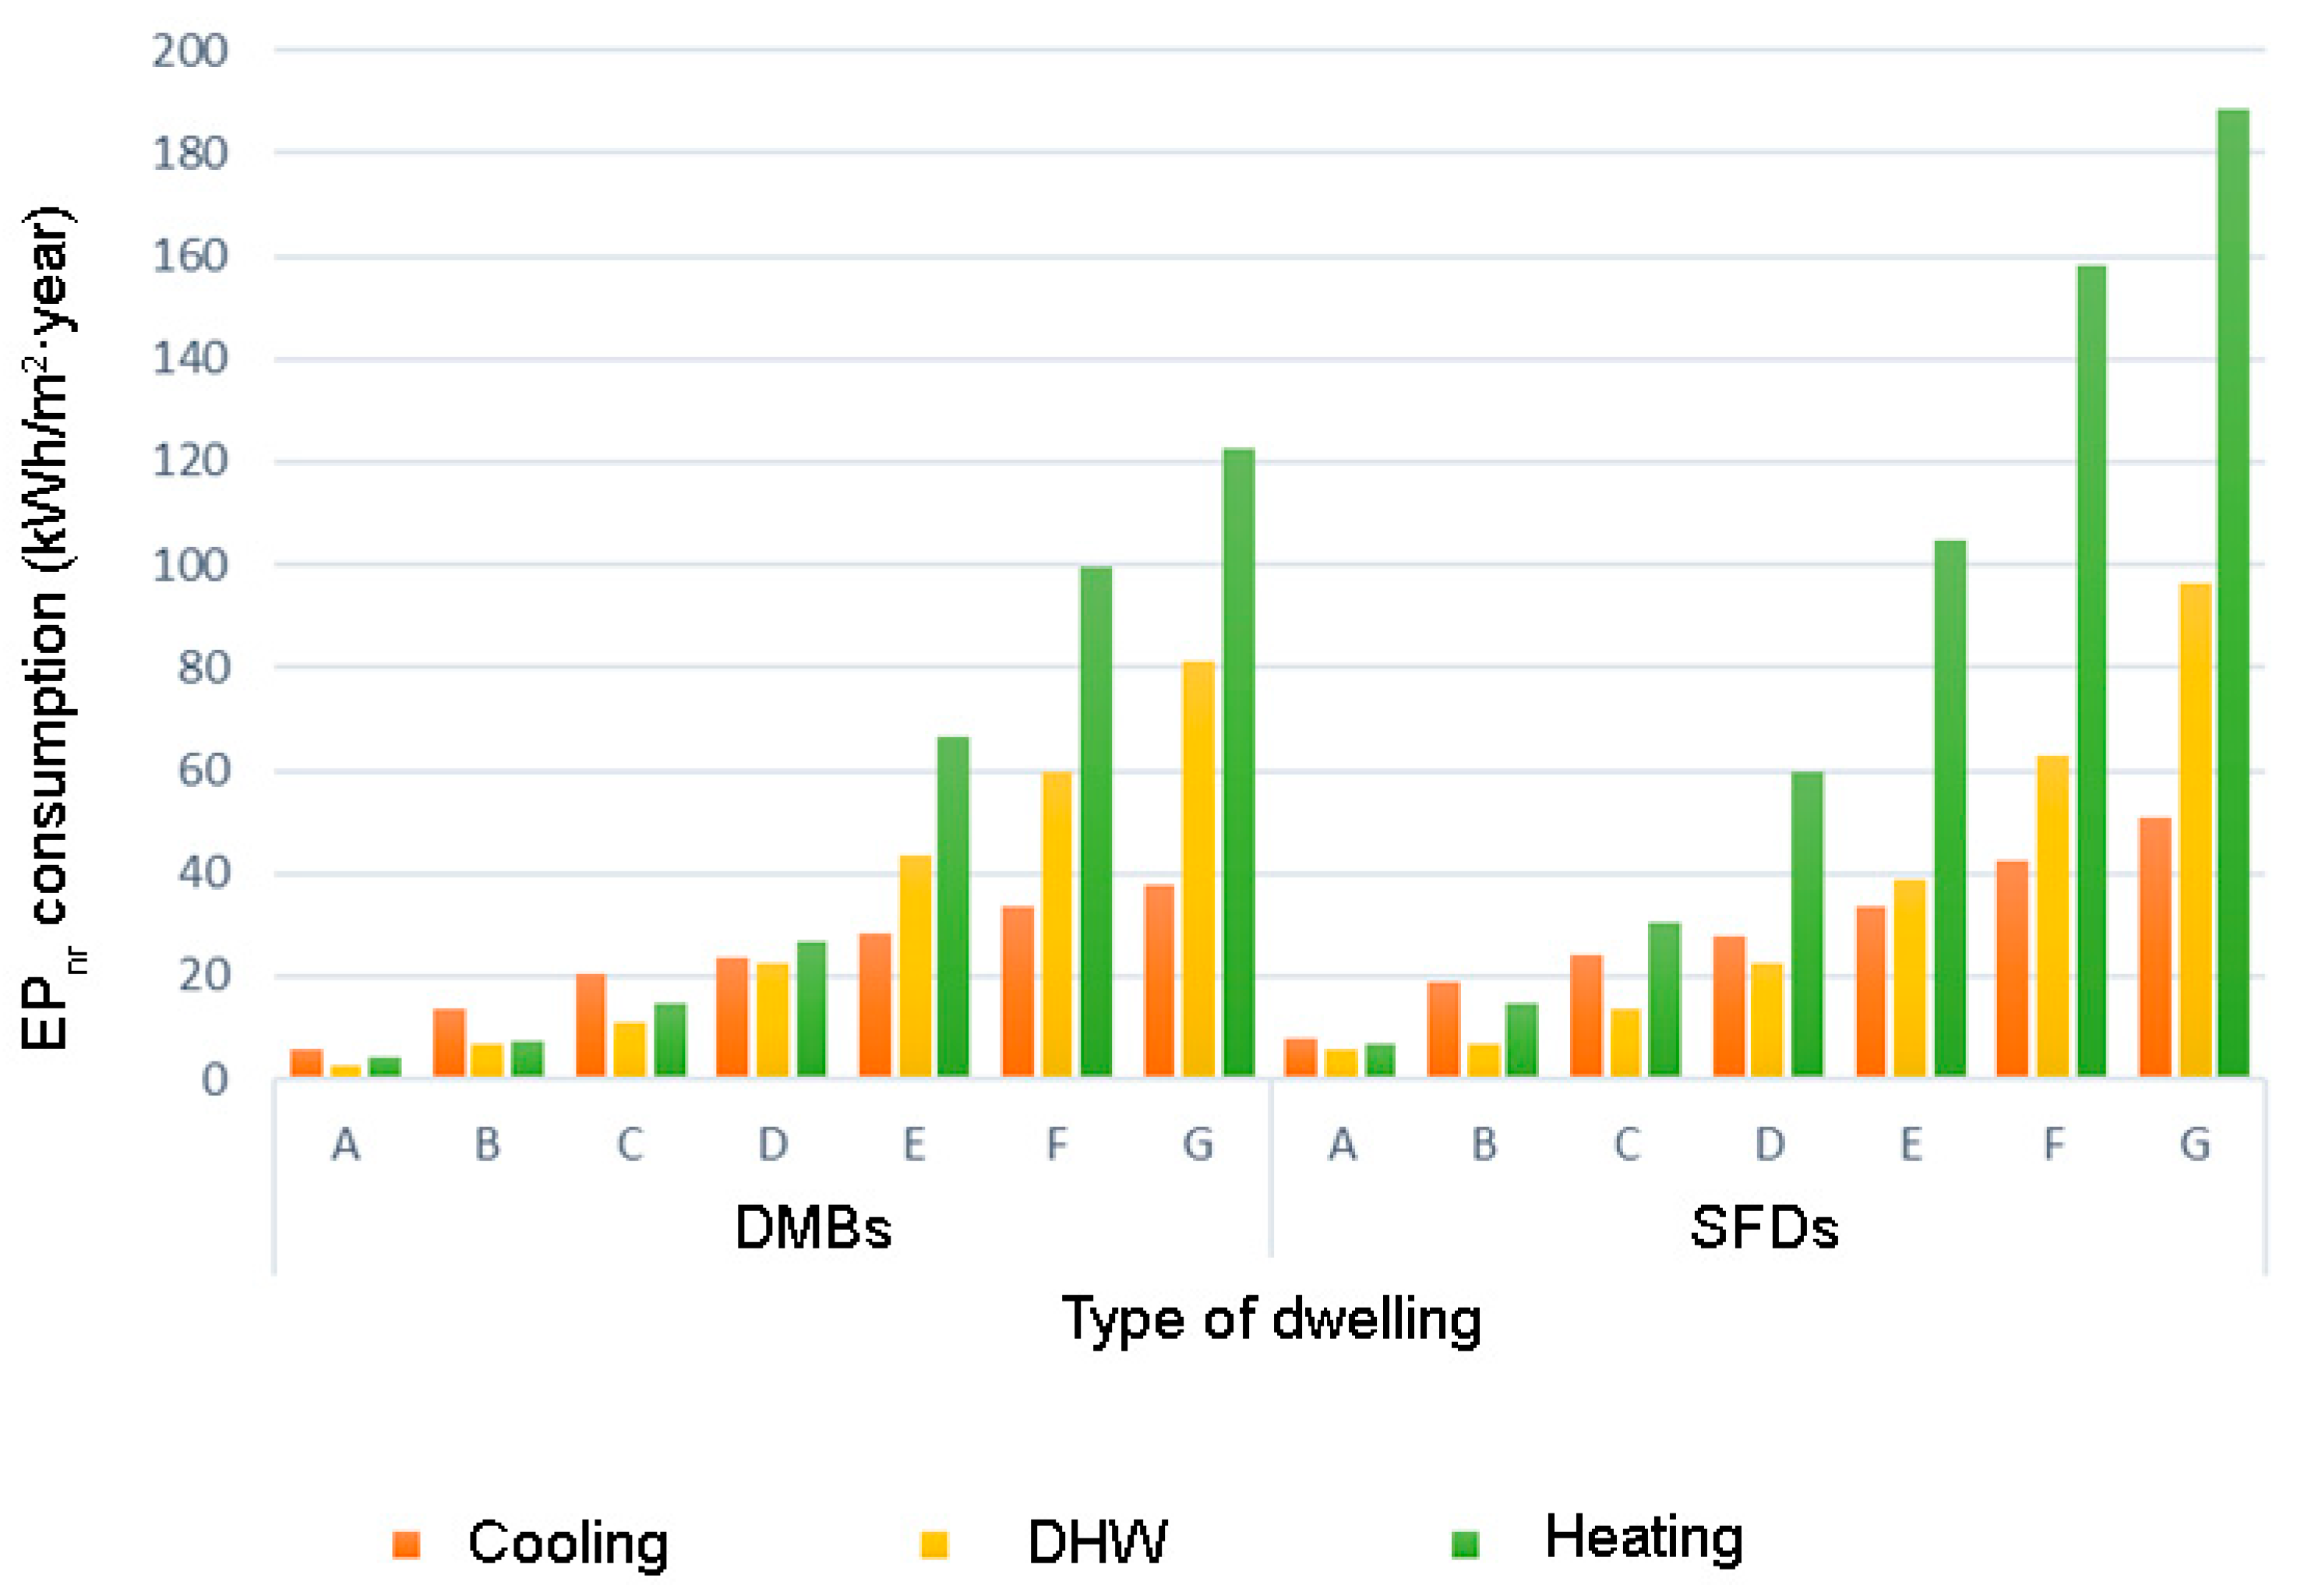
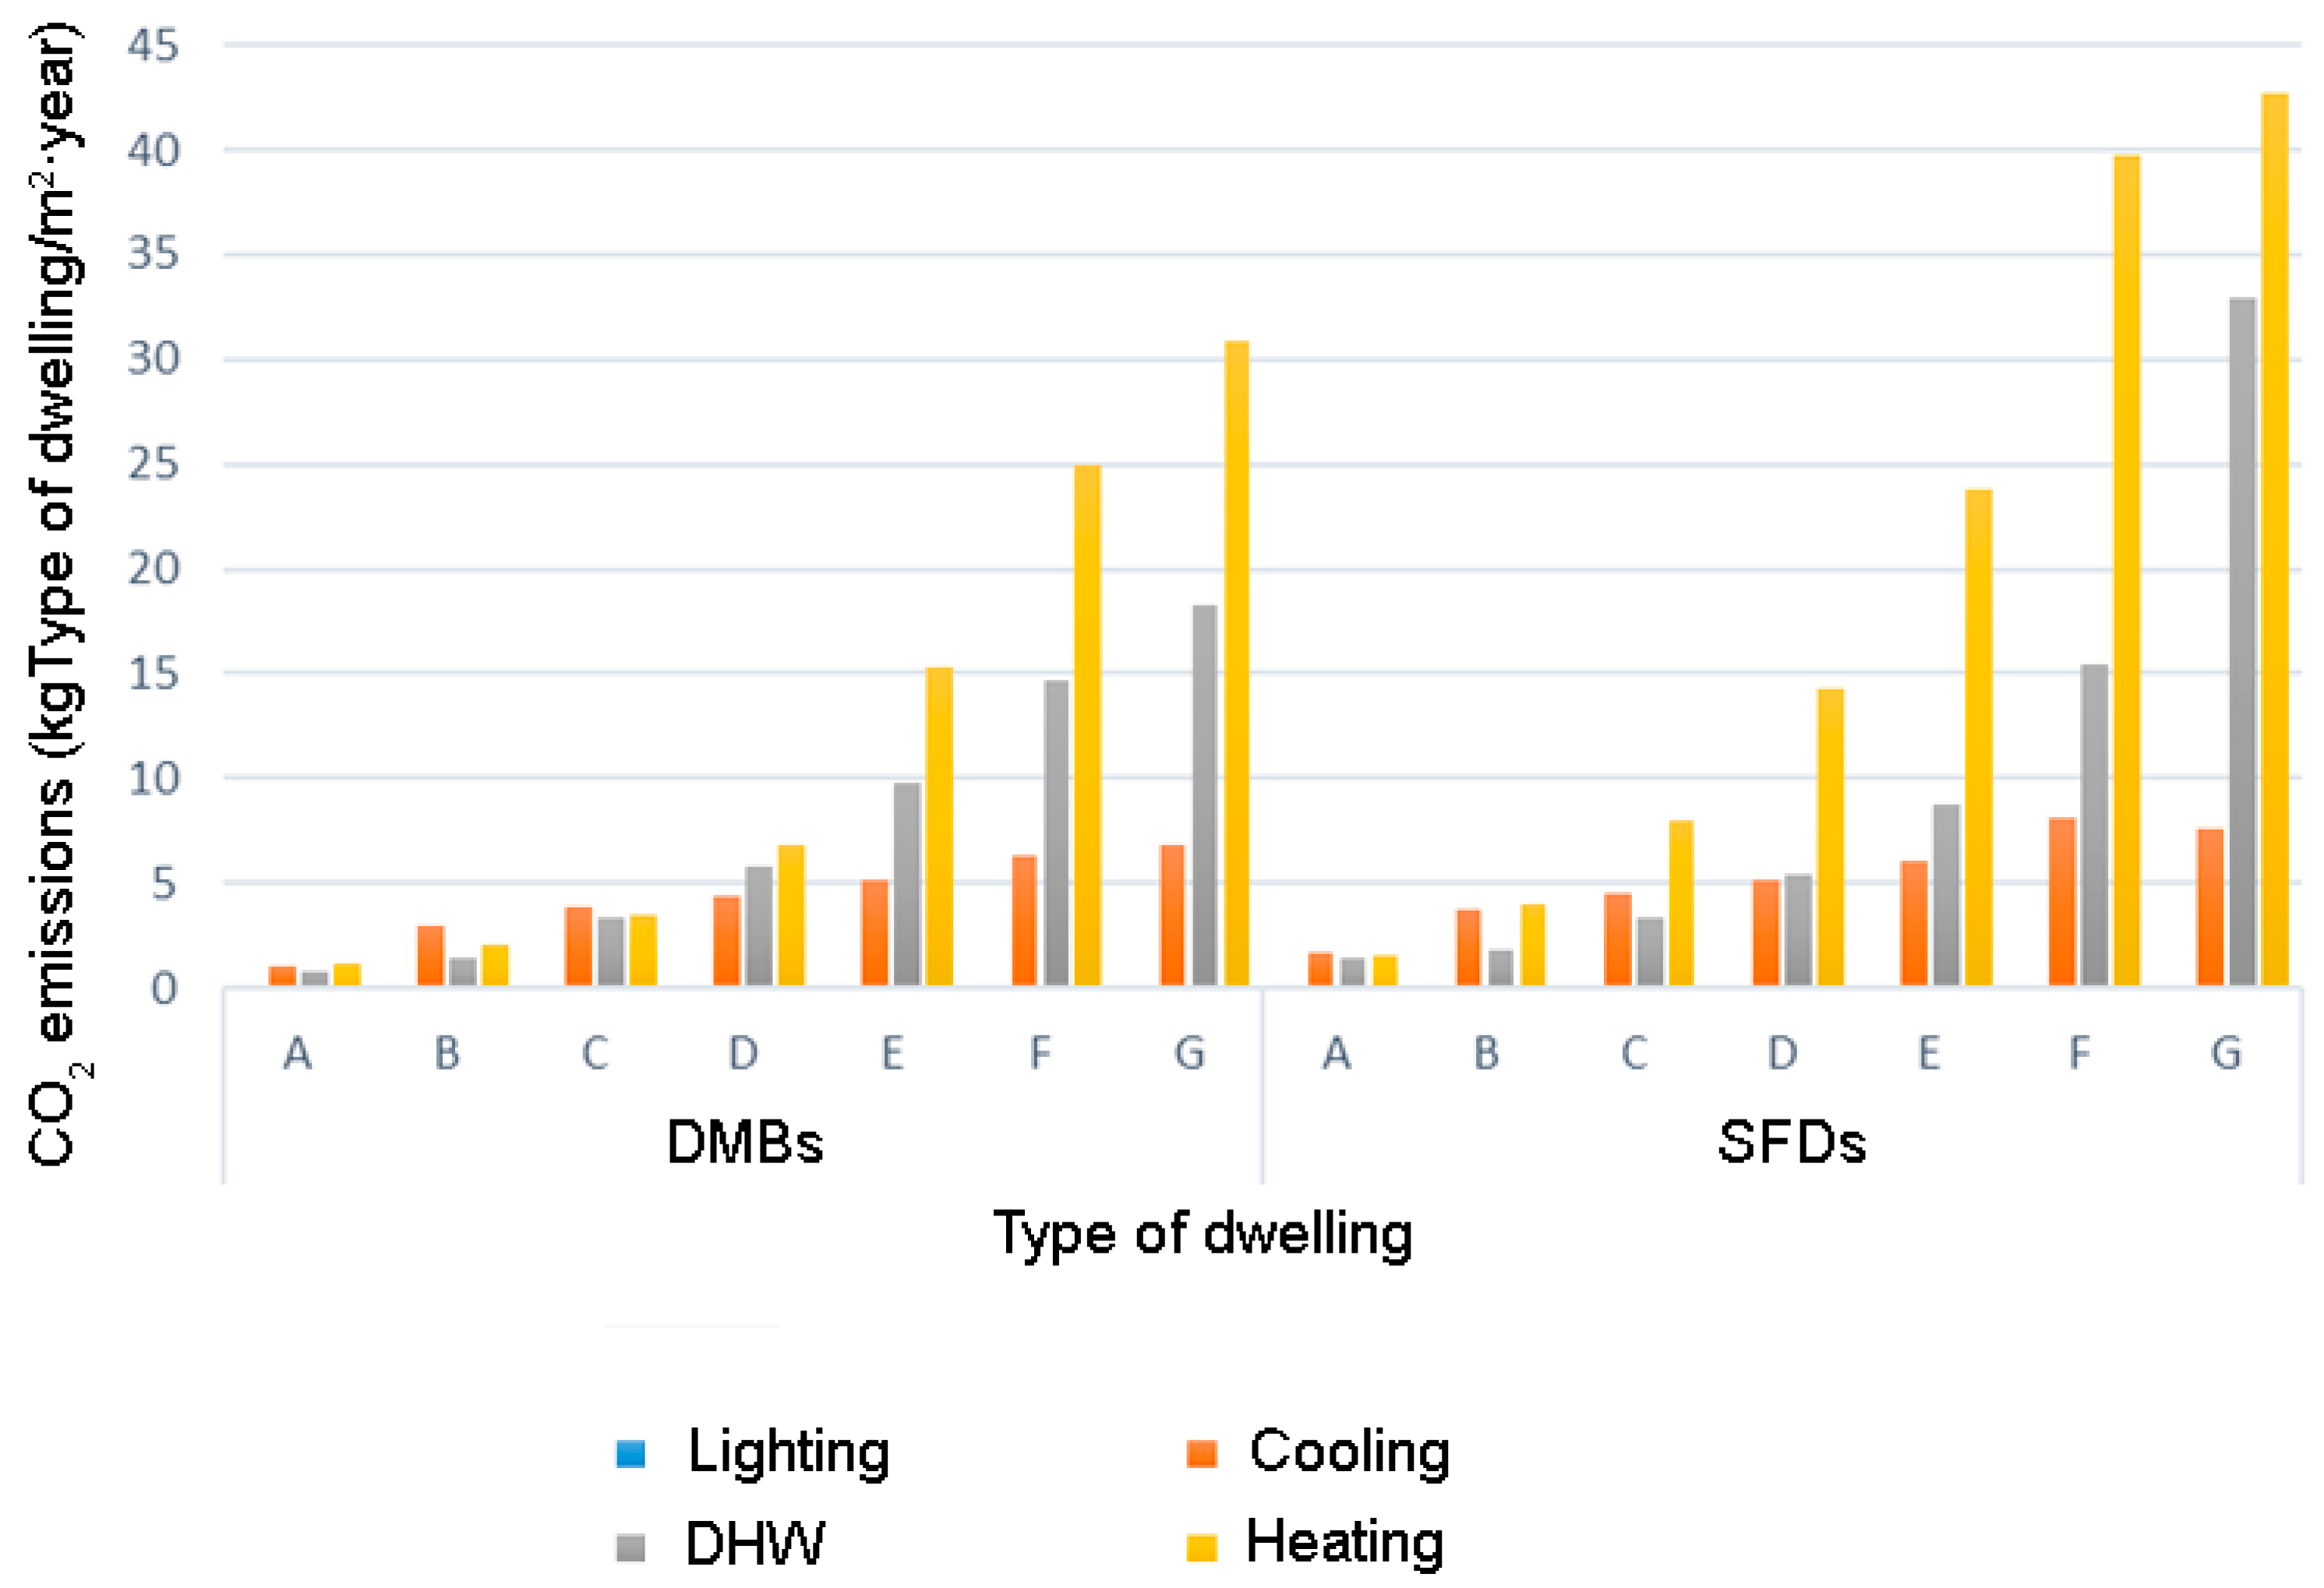
Figure 5 and
Figure 6 show, based on the results obtained from the EPC database, the distribution of EP
nr and CO
2 by dwelling typology and type of energy consumed. It is observed that the EP
nr consumption in SFDs is higher than in DMBs. In the less efficient dwellings (classification D, E, F and G), the main energy demand comes from heating, while in the more efficient dwellings it is due to cooling. This pattern is also reflected in CO
2 emissions (
Figure 5).
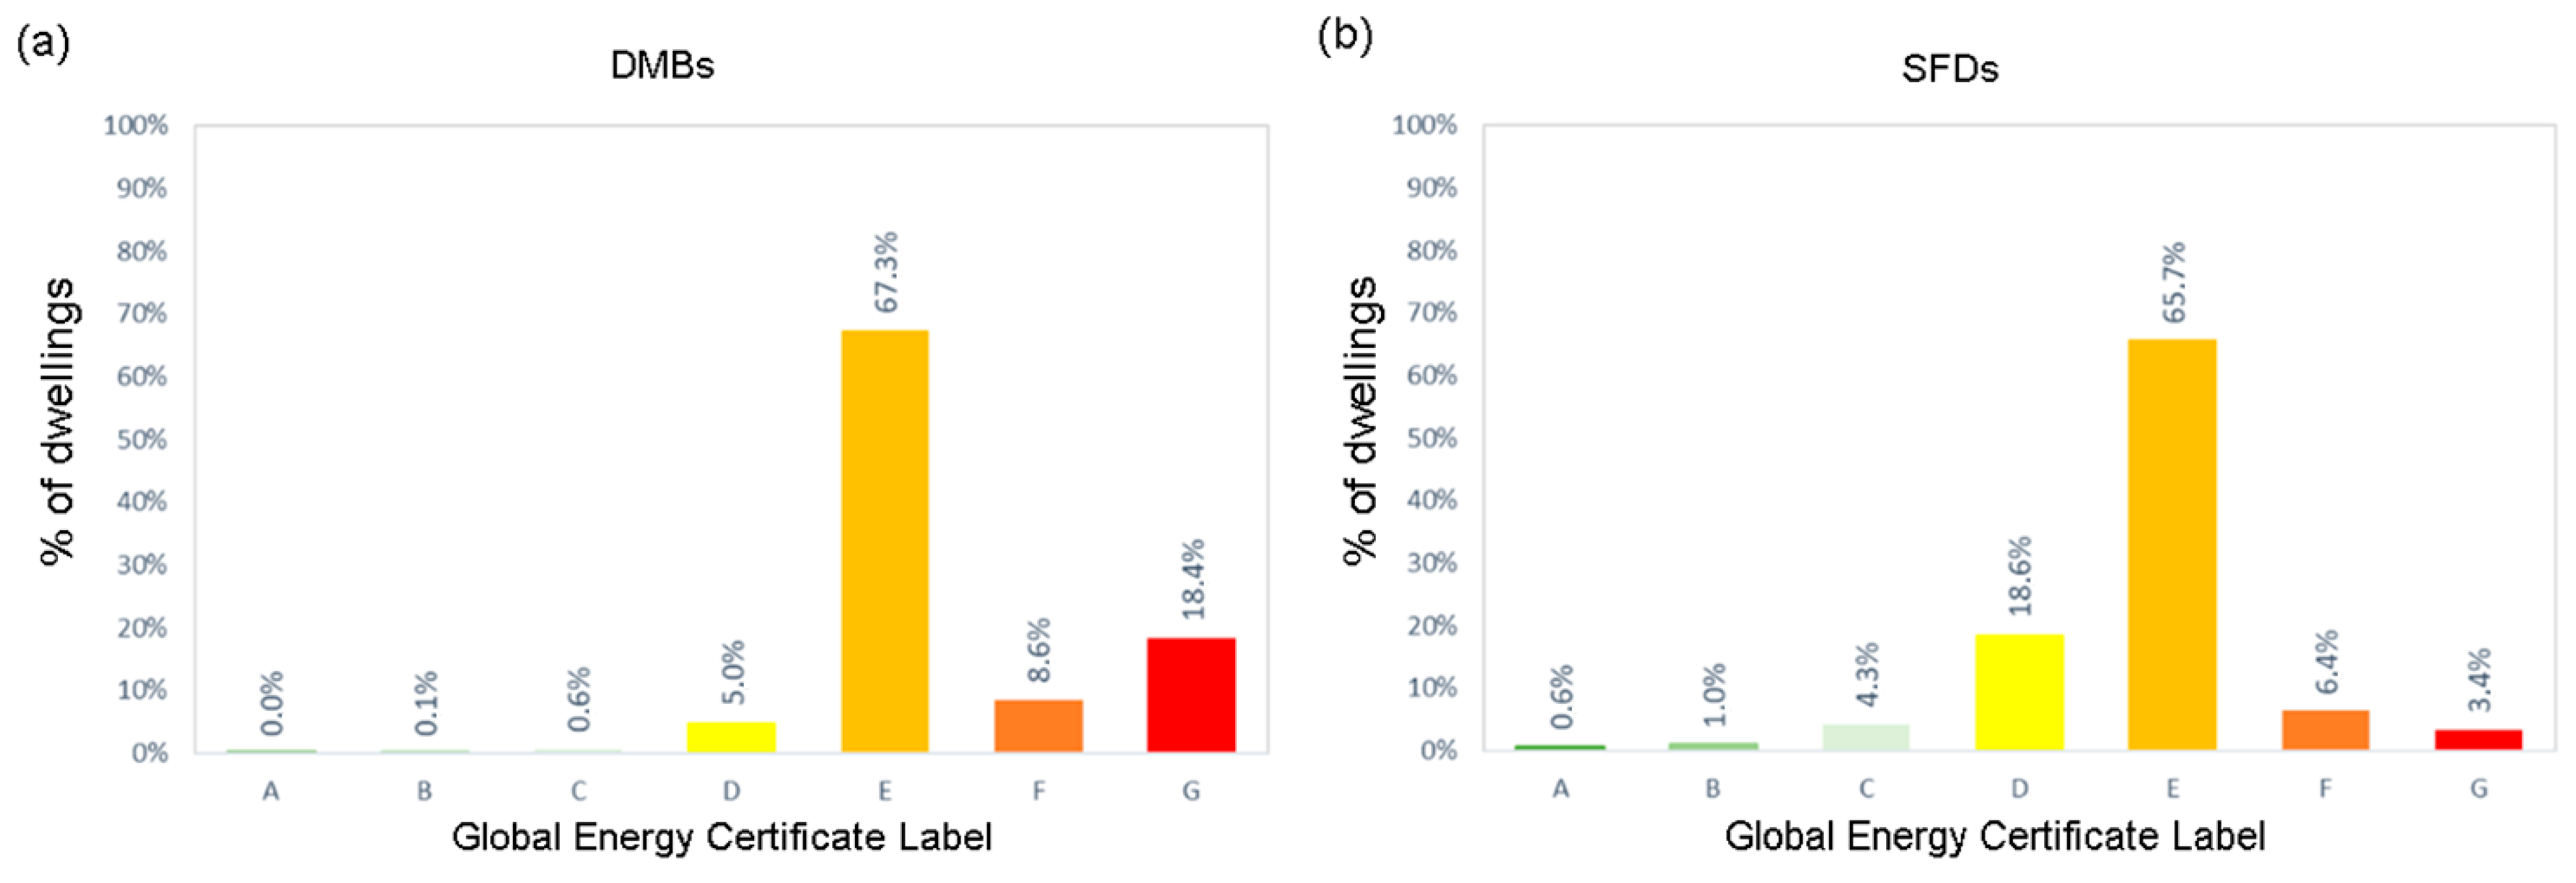
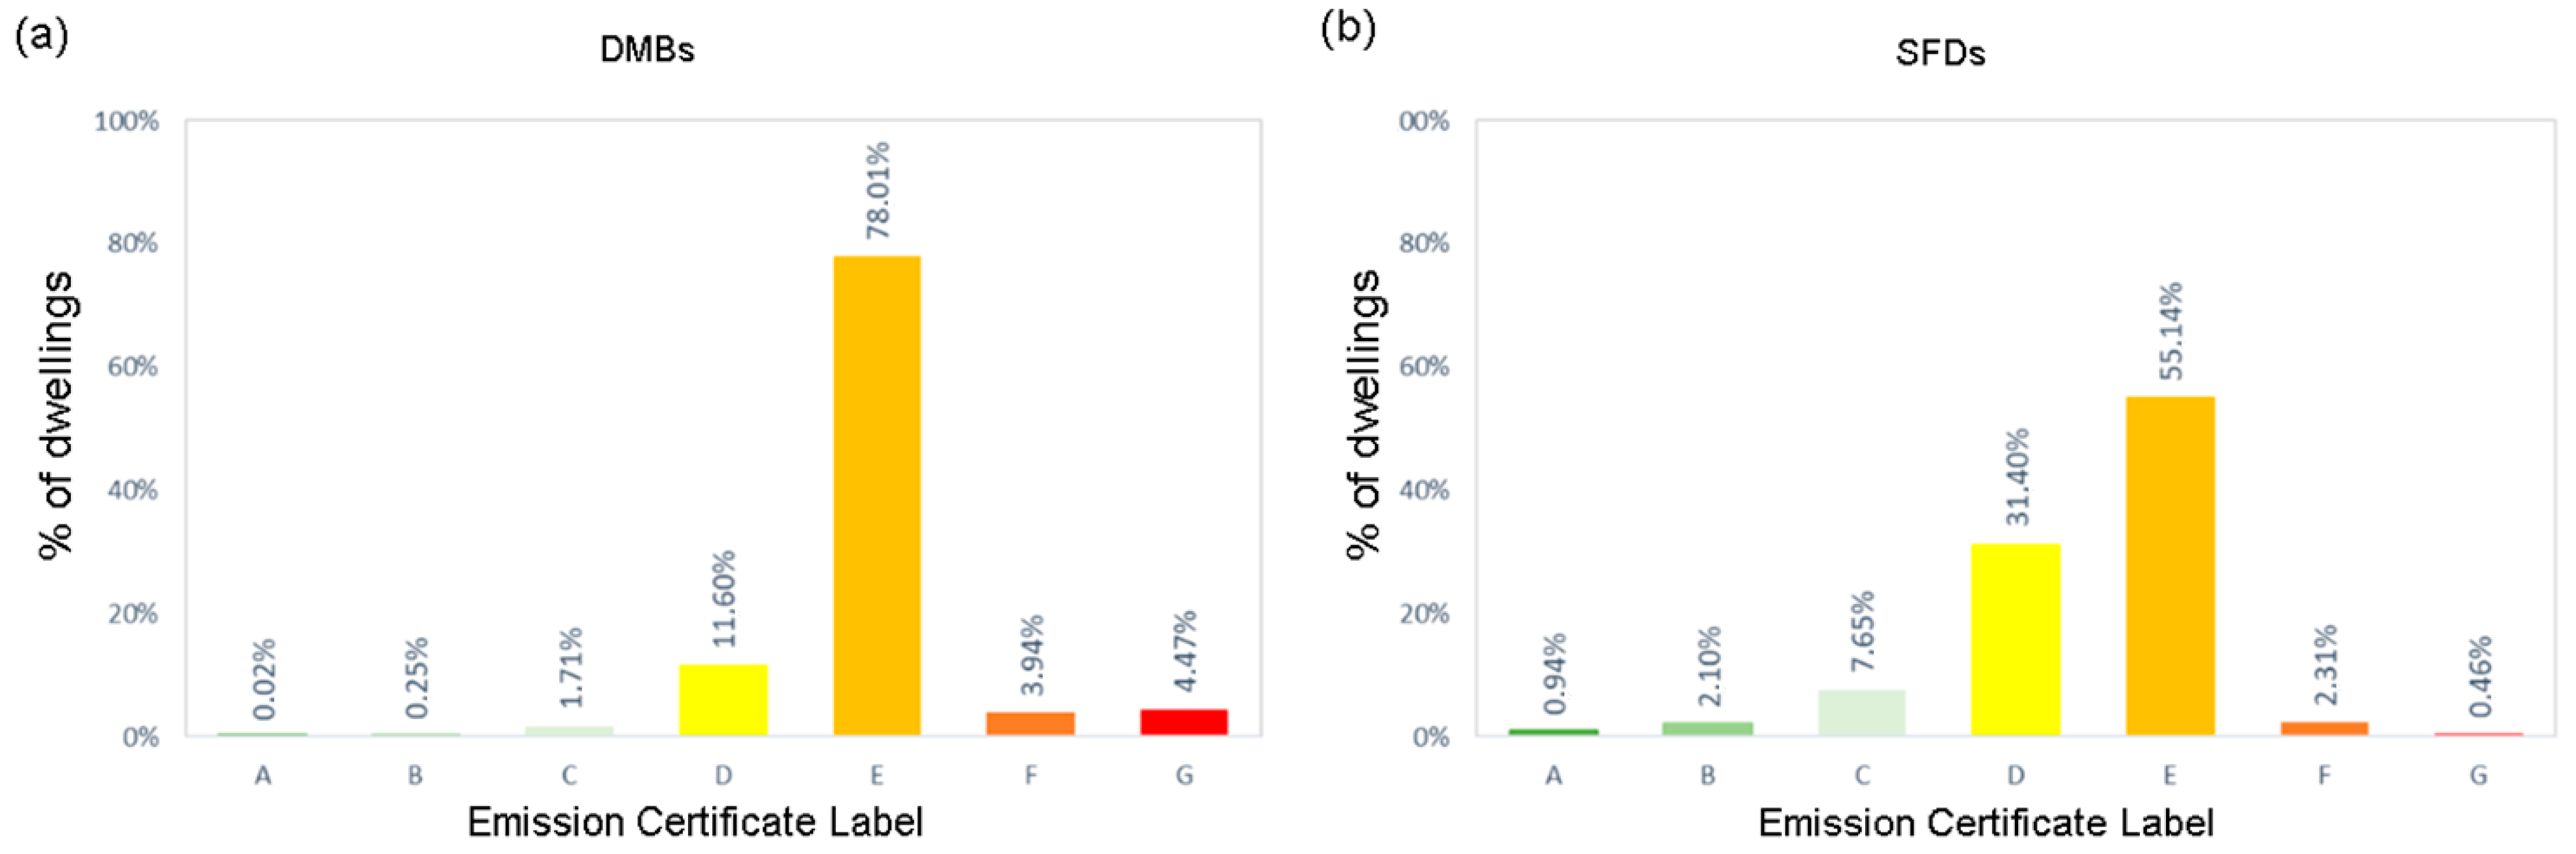
The distribution of energy certificate labels by energy consumption and CO
2 emissions according to dwelling typology is shown in
Figure 7 and
Figure 8. The graphs show that the most frequent energy classification is type ‘E’. Furthermore, it is observed that most of the dwellings are grouped in the medium efficiency labels (D and E), while the high performance labels (A, B and C) are scarce, representing only 0.7% of the SFDs and 5.9% of the DMBs. This suggests that the SFDs in Seville are more energy efficient than the DMBs according to their labelling.
Table 5 shows the average overall consumption and CO
2 emissions by energy type for each dwelling typology. SFDs show higher overall energy consumption (127.06 kWh/m
2·year) compared to DMBs (113.07 kWh/m
2·year), particularly in heating. In contrast, DHW consumption is higher in DMBs. Regarding CO
2 emissions, SFDs also have slightly higher values (32.31 kCO
2/m
2·year compared to 30.01 kCO
2/m
2·year in DMBs), reflecting increased energy use, especially for heating. However, differences in cooling emissions between both dwelling types are minimal.
Additionally, the higher standard deviation in SFDs indicates greater variability in both consumption and emissions. This variability suggests that while SFDs generally consume more energy, the specific characteristics of each dwelling significantly influence the results.
Table 6 shows the average consumptions by dwelling typology and building regulations. The results indicate that, in all evaluated cases, the highest energy demands come from heating (~50–60%), followed by domestic hot water (DHW) (~17–35%) and cooling (~18–28%). The evaluated regulations have been selected due to changes in the requirements of the thermal building envelopes. From these results it can be seen that each of these modifications generates significant savings in the expected annual consumption of the dwellings. Those dwellings built before the NBE-CT 1979 consume on average 31.3% more in the DMBs and 38.7% more in the SFDs than those built with the CTE-2006.
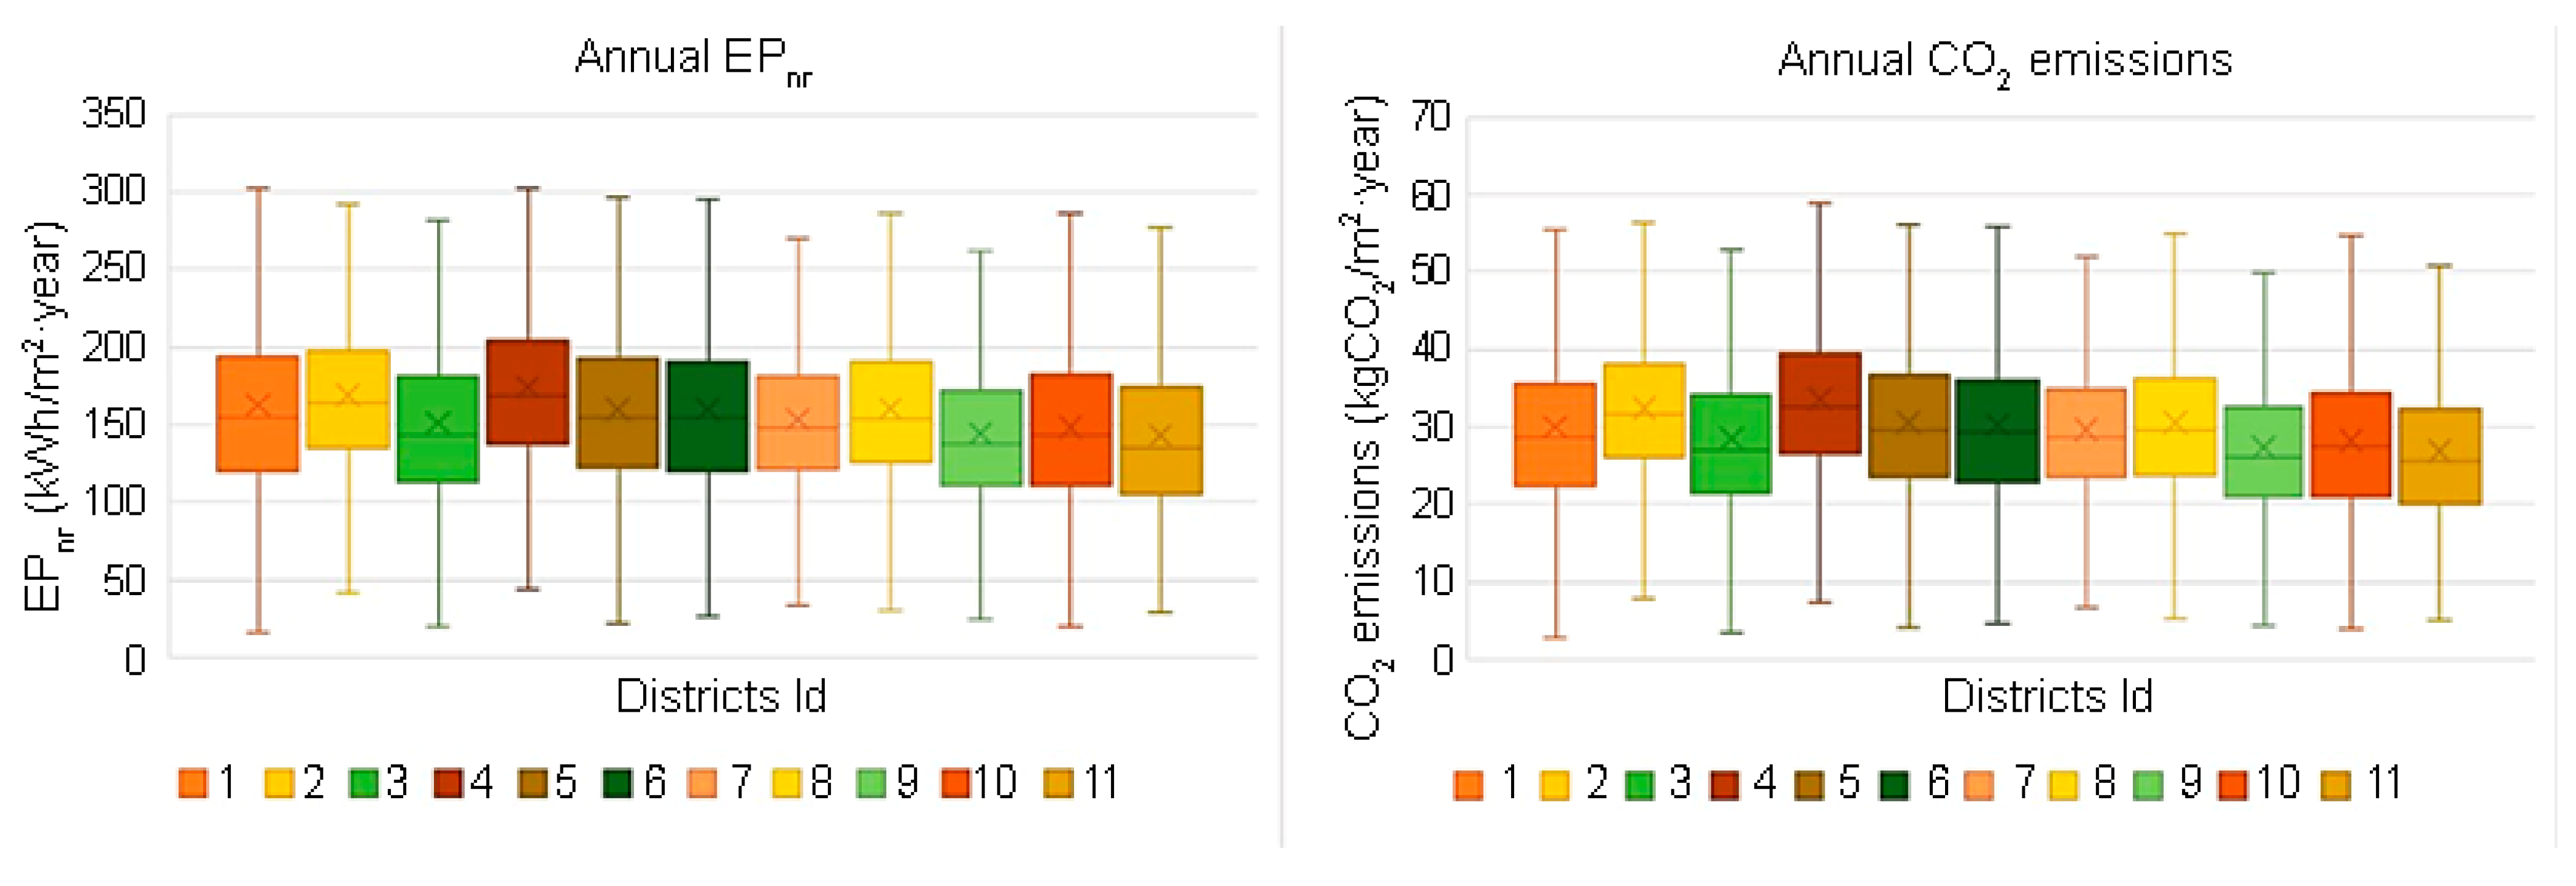
In addition, an analysis of the average annual EP
nr consumption and CO
2 emissions of the districts of Seville has been carried out. The results obtained show that the averages between consumption and emissions are similar in the districts, unlike the typical minimums and maximums which show greater variation between districts. The district with the highest energy consumption and CO
2 generation is Cerro-Amate, while the lowest is Los Remedios (
Figure 9).
3.2. Energy Vulnerability
This subsection shows the results obtained from the assessment of the energy vulnerability in Seville’s residential building stock. The energy vulnerability assessment is carried out based on the
index, as indicated in the materials and methods section, and is classified according to the 2M indicator in three ranges: Low (
≤ 5%), Moderate (5% <
≤ 10%) and High (
> 10%). Vulnerability is analyzed according to dwelling typology, the relationship between energy efficiency labelling and vulnerability, and the geographical distribution of the results obtained is presented.
Table 7 shows the mean EEIR index values of each district.
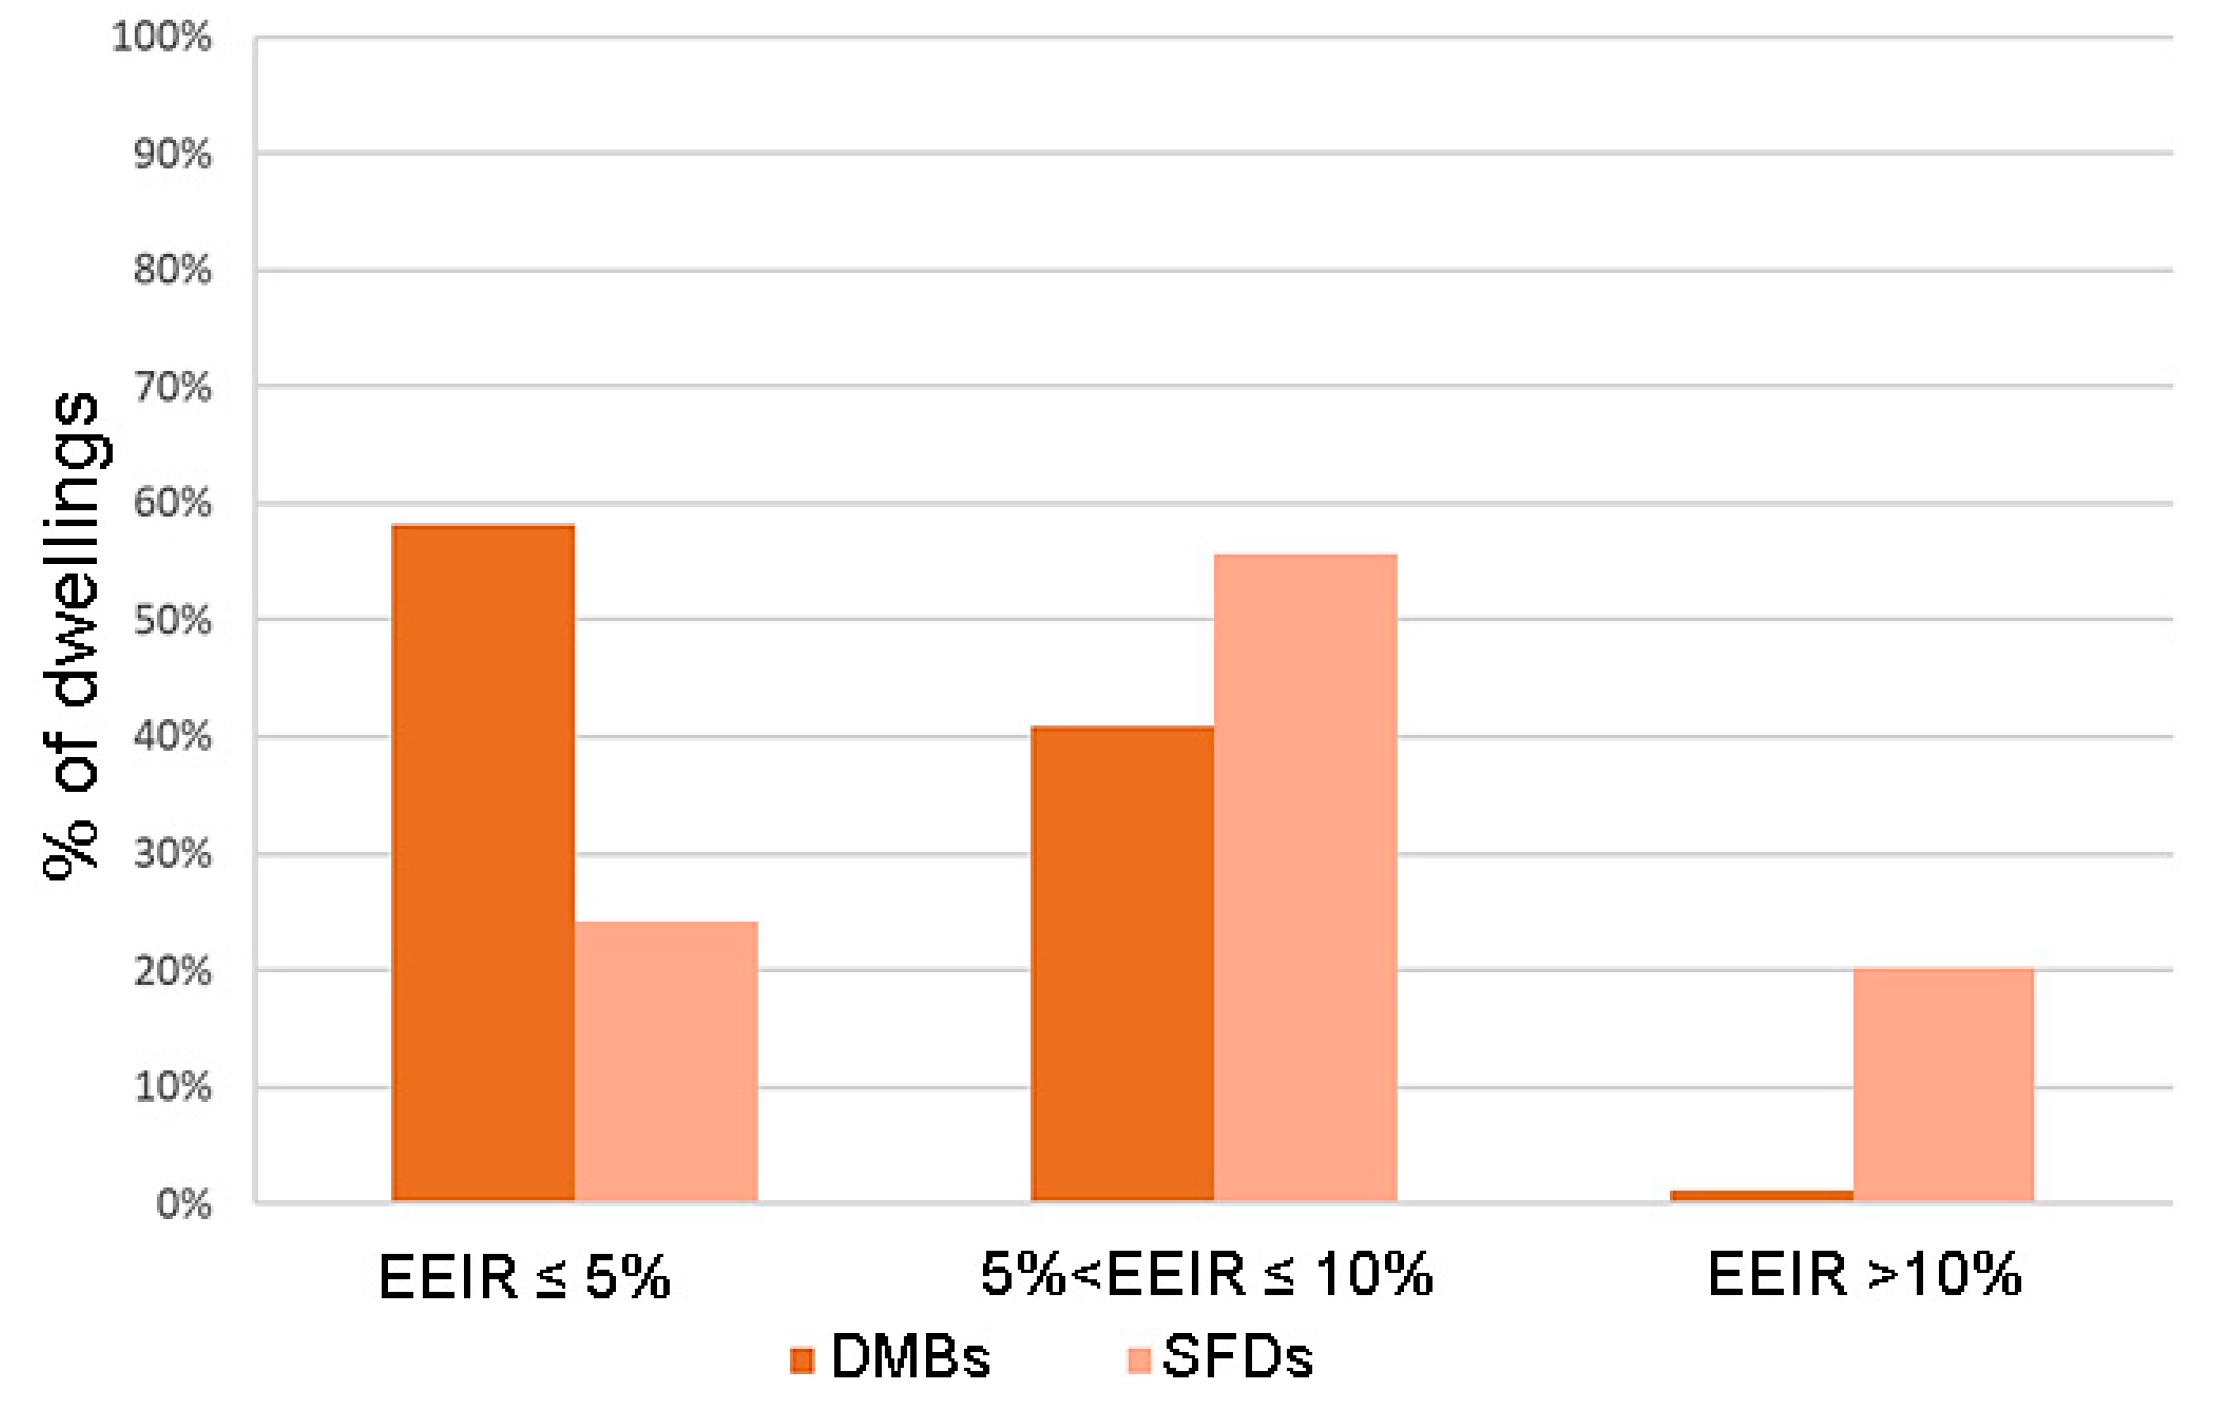
Figure 10 shows the distribution of dwellings by typology and energy vulnerability categories. The analysis reveals that DMBs have a lower percentage of vulnerability compared to SFDs. As the risk increases, the number of DMBs decreases, while the SFDs tend to be concentrated in the moderate risk range. According to the results obtained, 20% of the SFDs face energy vulnerability, while 99% of the DMBs have low or medium vulnerability.
Figure 11 shows the urban distribution of energy vulnerability according to the established classification. A high variability of risk can be observed within the city and among the different districts. In general terms, the city center exhibits a higher frequency of low vulnerability, while moderate risk is more commonly observed in the outskirts.
Additionally, a statistical comparison has been conducted between districts. Since the data did not meet the assumptions of normality and homogeneity of variances, the Kruskal-Wallis nonparametric test was applied to compare EEIR between the different districts. The results obtained from the analysis (
Table 8) show statistically significant differences between the districts (H = 9093.945,
p < 0.001). In order to identify in which pairs of districts these differences were found, a post-hoc Dunn’s analysis with correction for multiple comparisons was performed (see
Appendix A). The results showed significant differences in most of the analyzed pairs of districts (
p < 0.001), with the exception of the comparisons between districts 1–3, 3–11, 1–11, 6–10, 5–9, 5–8, and 9–8, where no statistically significant differences were found. Districts 2, 4 and 7 show statistically significant differences with the rest of the districts. These findings indicate that, in general terms, there are marked inequalities in the EEIR between districts, although certain districts present similar patterns.
In this context, District 4 was selected for a detailed analysis at the census tract level. This district was chosen not only because it shows significant differences compared to other districts, but also because it has the highest average EEIR value, indicating the greatest vulnerability to fuel poverty.
3.3. Evaluation at Section Tract Level: The Case Study of Cerro-Amate District
In order to carry out a more detailed study, in addition to the analysis of energy efficiency and energy vulnerability at the district level in Seville, district 4 (Cerro-Amate) was selected as a sample for analysis at the census tract level. This choice is justified by the need to establish an evaluation procedure that can be replicated in other districts and in the interest of exploring in depth a representative area in terms of dwelling typologies.
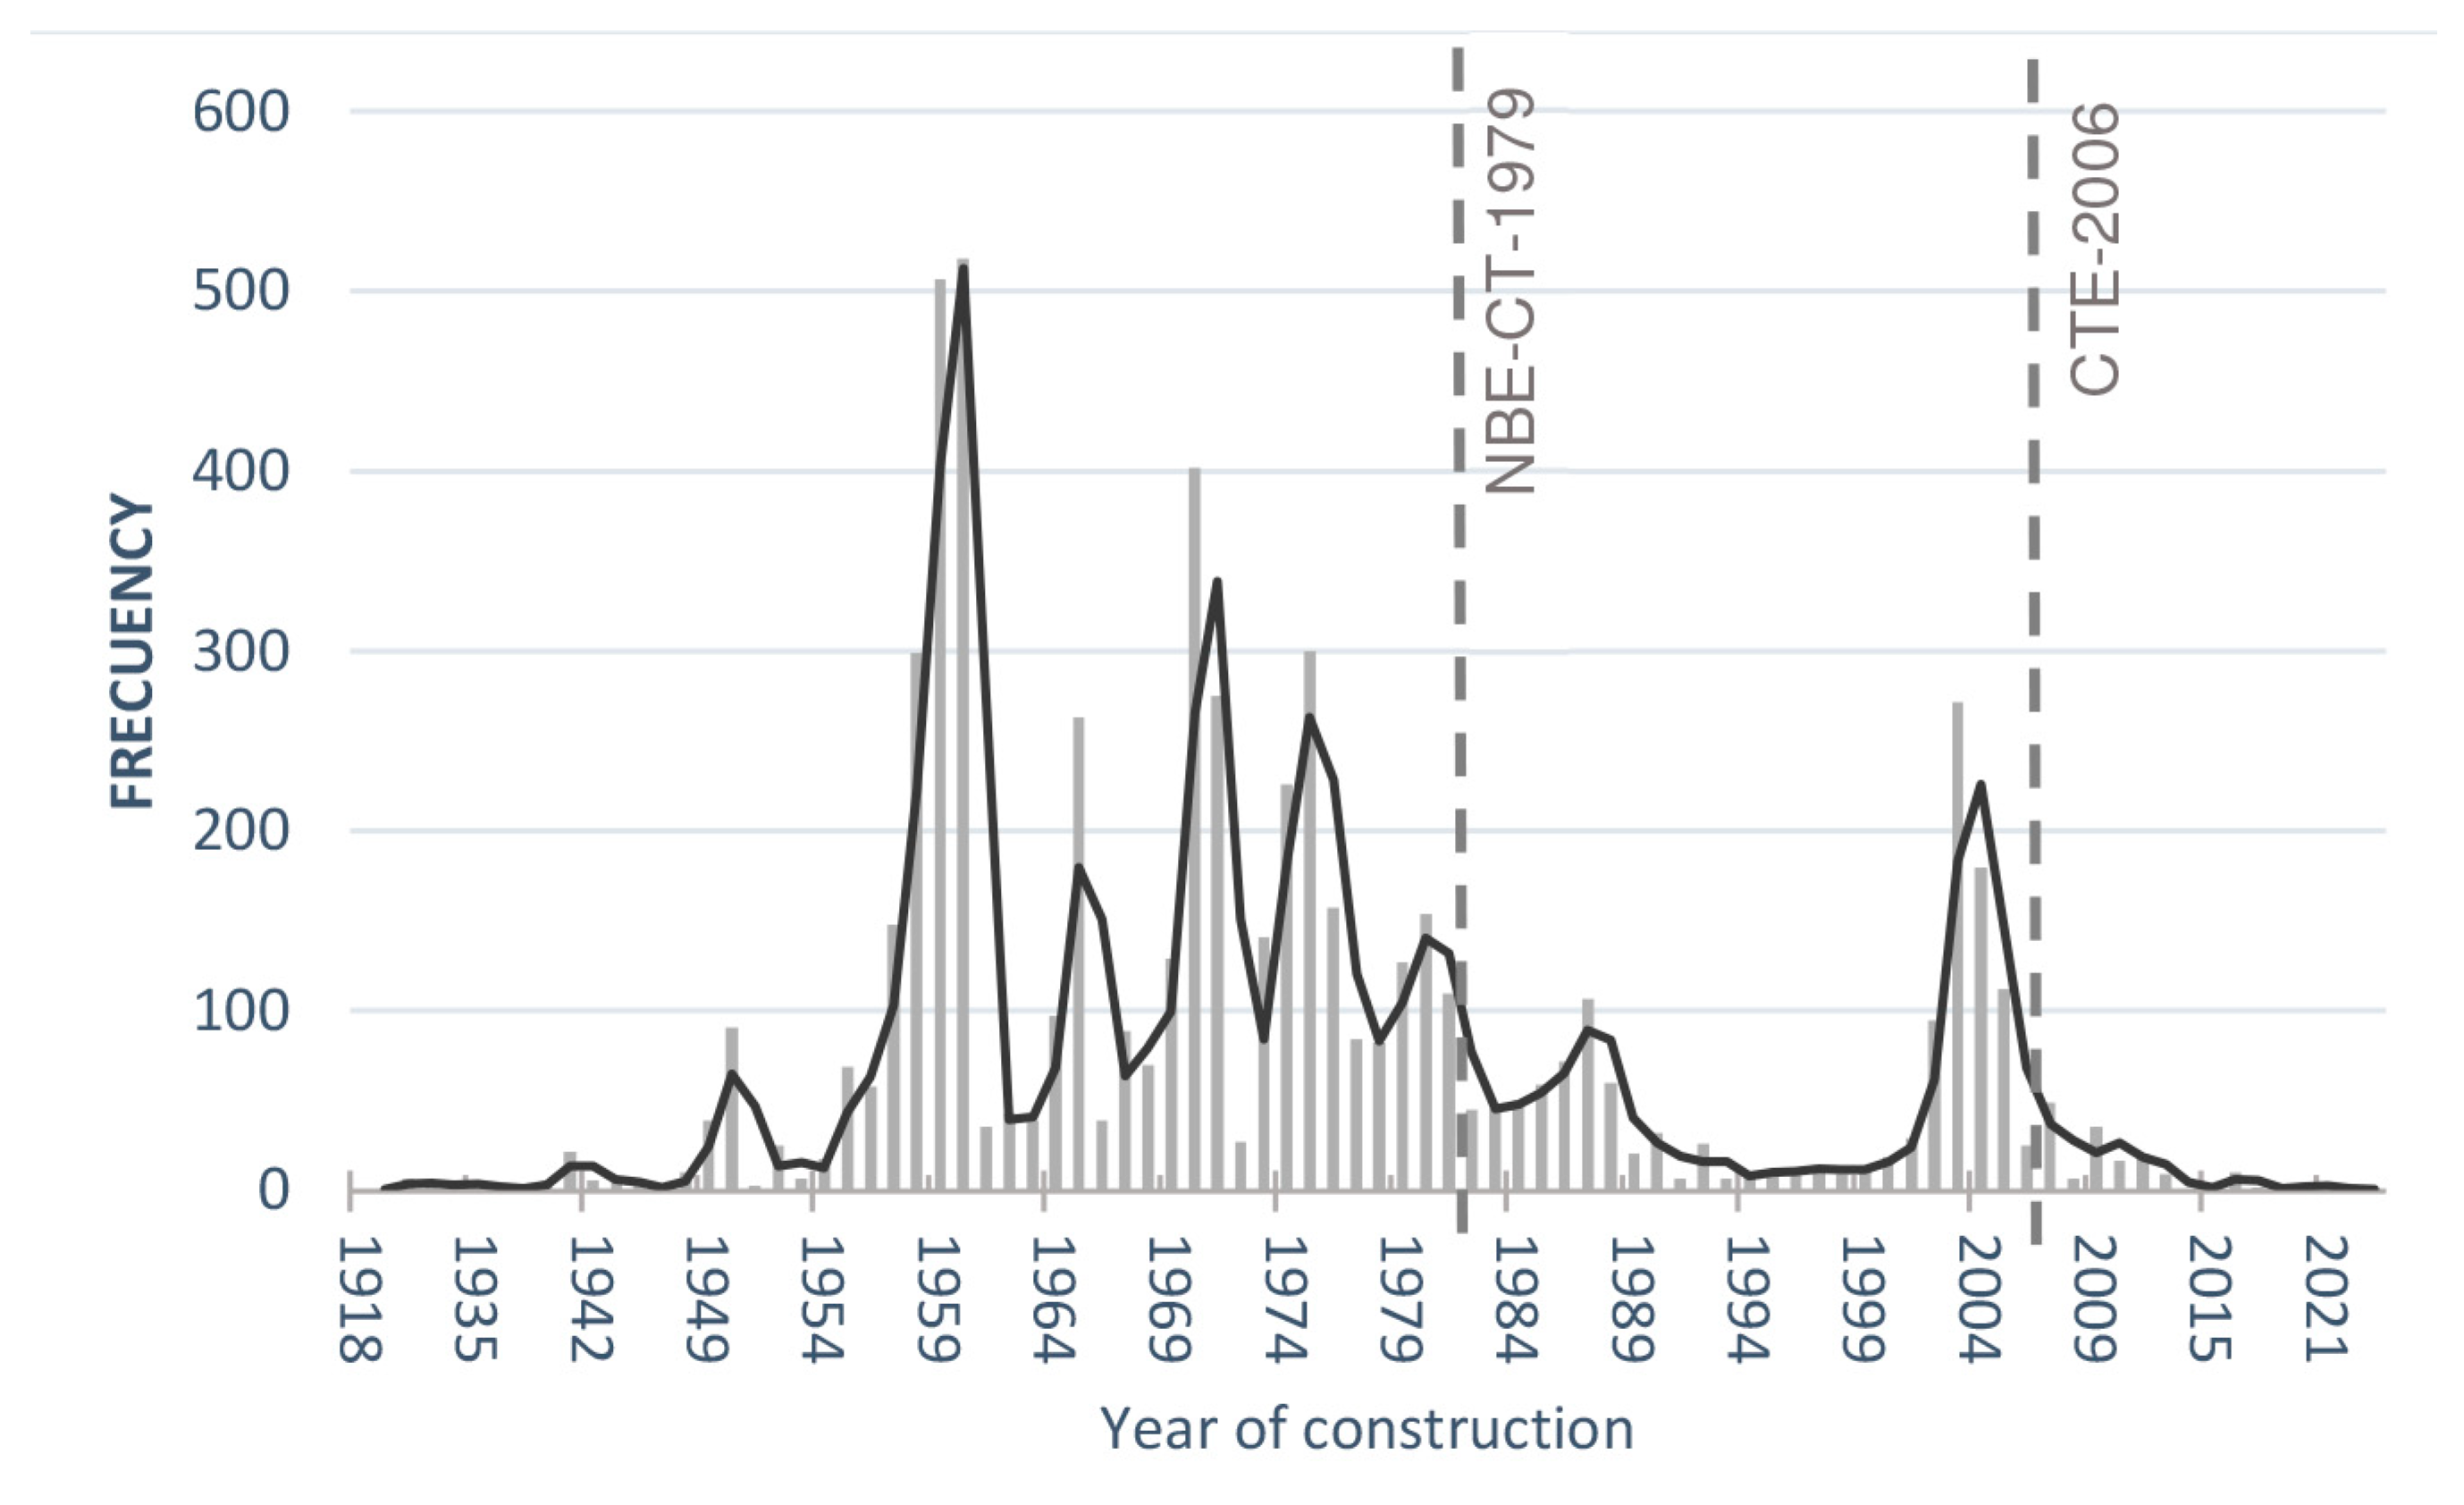
The Cerro-Amate district has 6244 dwellings registered in the EPC database, of which 77.4% are DMBs and 22.6% are SFDs. According to the database, the period of construction of these dwellings spans from 1918 to 2023 (
Figure 12), showing an evident increase in construction activity between 1918 and 1960, with a peak of 518 records in 1960. However, from that year until 1994, there is a progressive decrease in the number of buildings, with specific peaks in 1970, 1975, 1980 and 2003.
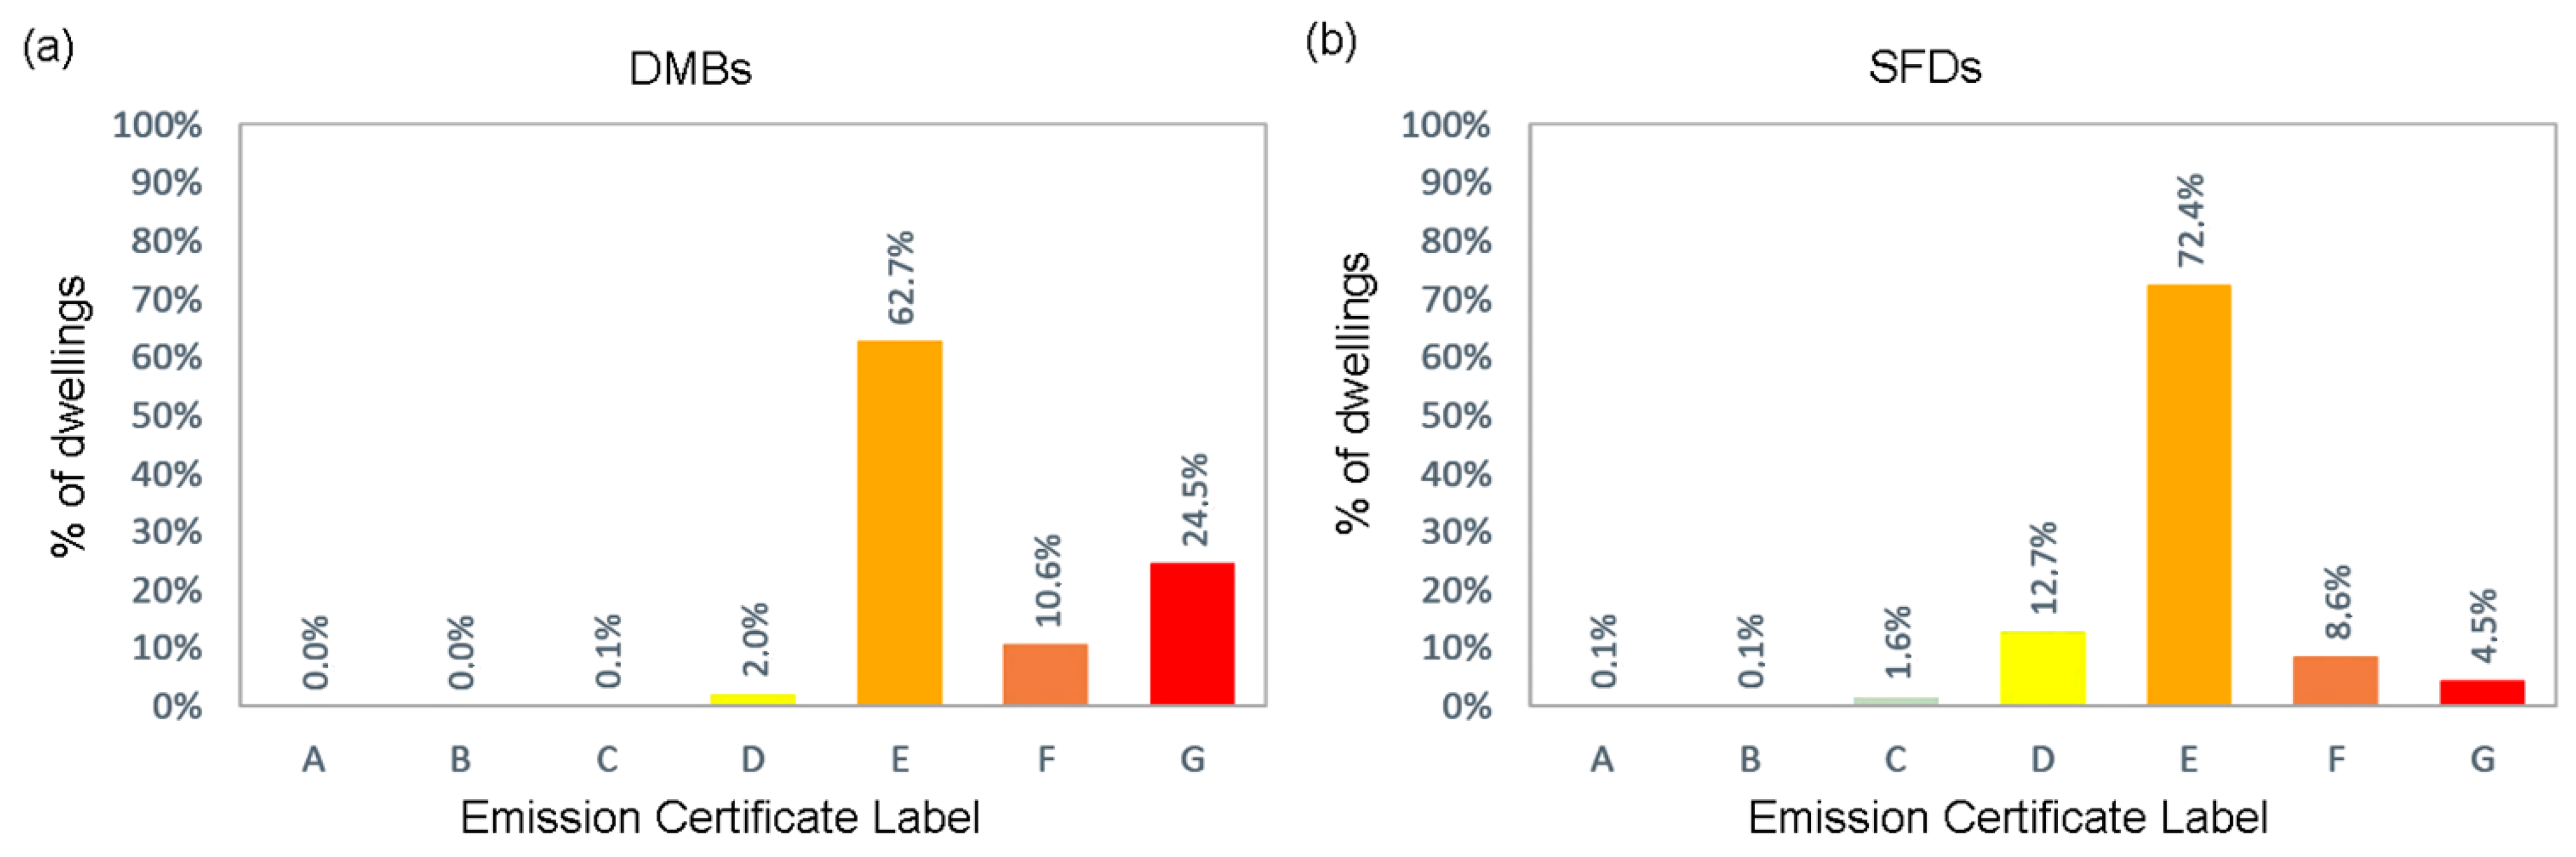
Figure 13 and
Figure 14 present the distribution of EPCs for the district by rating label and dwelling typology. The most common label in both typologies is “E” (81% of DMBs and 68% of Unis). However, SFDs show a better energy performance than DMBs, as 92.7% of DMBs present a low energy efficiency rating (“E” or lower), while this percentage decreases to 71.8% in SFDs. A similar behavior is observed in the classification by CO
2 emissions (
Figure 8), where DMBs maintain a lower efficiency compared to SFDs.
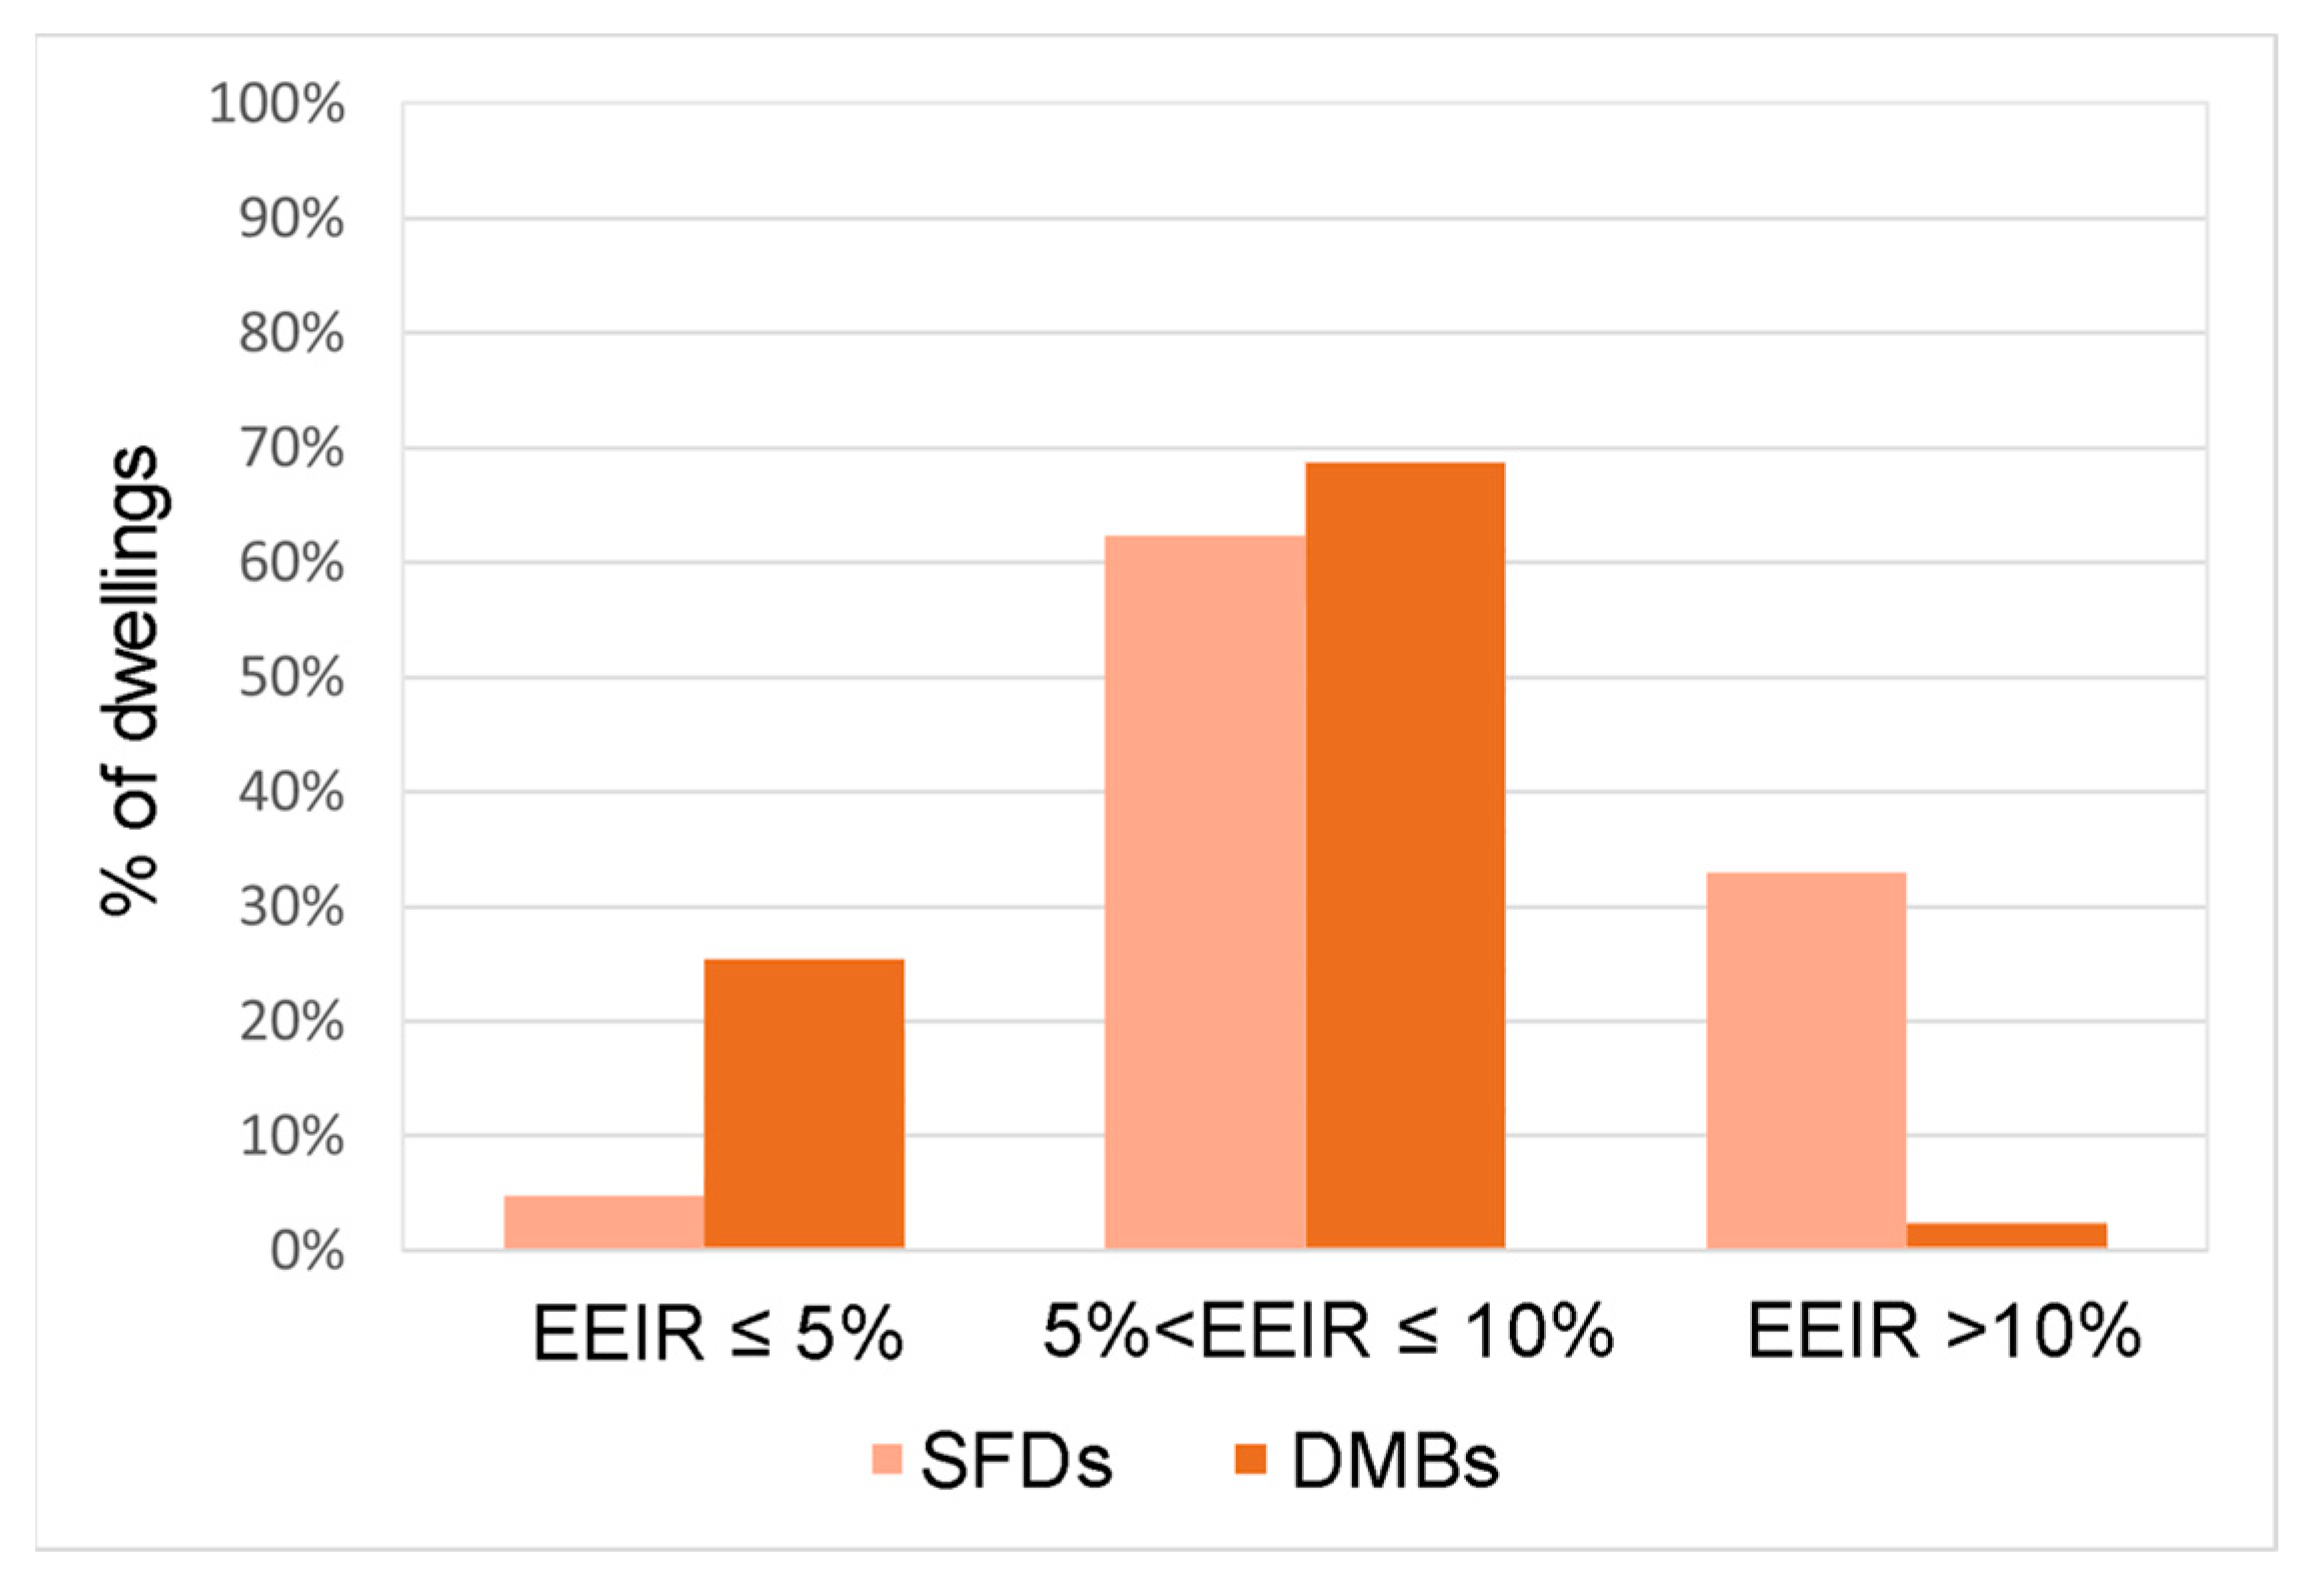
Figure 15 shows the distribution of dwellings by typology in the Cerro-Amate district according to energy poverty vulnerability categories. Both dwelling typologies concentrate more than 55% of the sample in the moderate energy vulnerability category. While in the range 5% < EEIR ≤ 10% the results indicate that the percentage of DMBs is slightly higher compared to SFDs, this difference increases considerably in the EEIR > 10% range.
Figure 16 and
Figure 17 show the distribution of overall consumption and the vulnerability to experiencing energy poverty according to their classifications, respectively. The study at the census tract level in the Cerro-Amate district provided results that show patterns similar to those of the general sample. Census tract 58 showed the lowest average EP
nr consumption and CO
2 emissions (131.31 kWh/m
2·year and 25.18 kgCO
2/m
2·year, respectively). In contrast to census tract 27, with expected average EP
nr consumption and CO
2 emissions of 213.49 kWh/m
2·year and 41.41 kgCO
2/m
2·year, respectively. In terms of energy vulnerability, the minimum average
were found in census section 15 (4.24%), and the maximum (10.62%) in section 52. These results allow us to identify those census tracts in a critical situation, which is key information for establishing measures to prioritize actions in these areas.
4. Discussion
Energy Performance Certificate (EPC) databases provide valuable information on energy efficiency and construction characteristics of buildings. The analysis of this information with an aggregated and geo-referenced approach allows the identification of spatial and typological patterns essential to understand the residential building stock and to guide more effective and targeted energy renovation strategies.
The results obtained from the analysis of the EPC data of the city of Seville reveal key trends about the residential building stock. First, most of the dwellings—both SFDs and DMBs—were built before the Spanish building code (CTE) came into force, which translates into higher energy consumption and worse ratings in the EPCs. More than 85% of the dwellings analyzed are concentrated in the E, F and G labels, which confirms a generalized low energy efficiency. SFDs show higher consumption and emissions than DMBs, which could be explained by their larger exposed surface area and lower compactness. In addition, a progressive improvement in energy consumption is observed as regulations progress: average EPnr values decrease significantly in dwellings built under NBE-CT and especially with the CTE. This fact supports the effectiveness of regulatory requirements in improving energy performance.
At the spatial level, the analysis by districts reveals significant differences in the energy performance of dwellings. Districts 2 (Macarena) and 4 (Cerro-Amate) show the highest average consumptions (with 169 and 174 kWh/m2-year respectively), which could be related to an older residential building stock, and therefore to more inefficient construction systems. At the opposite extreme, District 11 (Los Remedios) shows the lowest average consumption (143 kWh/m2/year), followed by District 10 (Bellavista-La Palmera) (148 kWh/m2/year). Moreover, the interquartile ranges are high in almost all districts, indicating a strong heterogeneity within each area, probably linked to typological and constructive variety. These internal differences are particularly relevant when planning public policies, as they could mask situations of energy vulnerability in districts that, in aggregate terms, do not seem to be a priority. In this sense, these disparities can be mapped with high accuracy using GIS tools, supporting a more informed and territorially focused decision-making process on the energy performance at the district scale. This reinforces the potential of open EPC databases as a diagnostic and planning tool.
With regard to statistical analysis, the Kruskal-Wallis test showed the existence of statistically significant differences between districts. The district with the highest mean EEIR index value was district 4 (Cerro-Amate). Despite the typological differences between SFDs and DMBs, the data reflect a generalized low energy performance in this district, with high average consumptions (185 and 171 kWh/m2/year, respectively). The distribution of EPC labels reinforces this observation: more than 70% of the dwellings are concentrated in labels E, F and G, with practically no highly efficient dwellings (A or B). In the case of DMBs, 80.8% are rated E, while this category accounts for 67.7% in SFDs. In terms of energy poverty, there is a remarkable contrast between the two dwelling typologies. One third of the SFDs in the district could be in a situation of overspending (above 10% of income), while the DMBs show a lower profile, with a majority in the intermediate range (between 5% and 10%).
In summary, the results obtained show that the EPC data, when integrated and spatially represented by GIS, allow not only to describe the energy status of the building stock, but also to visualize territorial inequalities in terms of energy efficiency and energy poverty. The elaboration of specific maps combining energy consumption, building age and energy poverty facilitates the identification of priority areas for intervention. This territorial diagnosis acquires special relevance in the context of public policies aimed at energy rehabilitation, since it allows more focused strategies to be designed, based on criteria of need and not only on technical or economic feasibility. For example, by identifying census tracts where residential buildings present both high energy consumption levels (e.g., EPnr > 200 kWh/m2) and EEIR values above the 2M threshold, it is possible to prioritize areas with greater energy vulnerability. Thus, mapping derived from EPCs should not be understood only as a technical instrument, but as an urban governance tool that can actively contribute to the implementation of more efficient, equitable and territorially sensitive measures in the framework of the energy transition.
It should be noted that the main focus of this study is the performance of the residential building stock at the district and census tract level. Under similar socioeconomic conditions, the physical characteristics of dwellings influence energy consumption and utility bills, and therefore, the risk of households falling into energy poverty. To ensure comparability, a total of 45,908 dwellings have been evaluated using a standardized assessment model that assumes identical occupancy and usage patterns. These assumptions are defined by the operational conditions established in the DB-HE section of the Spanish Building Code (CTE), which specify set point temperatures and usage profiles for residential buildings when calculating energy demand and EPC ratings. Although these standardized conditions may not reflect actual occupant behavior, the uniform framework established by Royal Decree 390/2021 allows for consistent comparison of energy efficiency across buildings and provides an initial diagnosis of their energy performance. In this sense, the use of EPCs as the main database in this study presents both advantages and limitations. The EP
nr consumption and CO
2 emissions values are estimated and derived from the construction characteristics of the dwelling (especially its thermal envelope) and HVAC equipment, which differs from the actual consumption patterns influenced by the occupants. The literature suggests that in dwellings with lower efficient classifications (F and G), actual consumption tends to be lower than estimated, whereas in more efficient categories (A and B) it tends to be higher [
46]. Future research could investigate these trends more thoroughly through empirical validation.
It should also be remarked that the GIS-based analysis carried out in this study provides valuable insights into the spatial distribution of energy efficiency and energy poverty at both district and census tract levels in the city of Seville. Nevertheless, the proposed approach could be further enhanced by integrating Building Information Modeling (BIM) methodology. BIM would allow for the inclusion of detailed geometric and non-geometric building-level information (e.g., such as construction systems, envelope materials, etc.), which is often absent in geospatial datasets. GIS/BIM integration has already been identified as a powerful tool for improving the management and digitization of the built environment, facilitating more accurate simulation and data interoperability [
47]. This combined approach could support future analyses aimed at refining energy efficiency and vulnerability assessments at urban level.
5. Conclusions
The energy efficiency of dwellings affects the quality of life of their occupants and influences the probability of falling into fuel poverty. This study has diagnosed the energy efficiency and vulnerability to energy poverty of 45,908 dwellings in Seville. This study considers different dwelling typologies (SFDs and DMBs) and covers constructions built between 1850 and 2023, with different built areas and construction standards. Most of the building stock (60%) in Seville was built before 1979, i.e., before the entry into force of the first energy efficiency regulations in Spain. Building regulations play a crucial role in the expected energy consumption and efficiency. The results obtained evidence that dwellings built before the NBE-CT-79 [
45] consume on average 31.3% more in the DMBs and 38.7% more in the SFDs than those built under the current building regulations (CTE-2006).
The results obtained show that the dwellings in Seville have a low performance in energy efficiency, with 83.2% of the evaluated dwellings having a label below “E” in EPnr consumption and 92.2% in CO2 emissions. The average EPnr consumption of the dwellings was 127.06 kWh/m2·year for SFDs and 113.07 kWh/m2·year for DMBs. The overall emissions averages were 32.31 and 30.01 kgCO2/m2·year for SFDs and DMBs, respectively, of which 50% are due to heating, 31% to DHW, and 19% to cooling demands.
Regarding the evaluation at the district level, the district with the lowest energy efficiency is Cerro-Amate, while the district with the best energy efficiency is Los Remedios. In parallel, these districts coincide in those with the highest and lowest energy vulnerability, respectively.
In summary, it should be noted that the evaluation of an entire residential stock under the same criteria allows an analysis based on the physical characteristics of the dwellings themselves, rather than the occupancy patterns, which are temporary and variable. In addition, the use of GIS provides significant advantages for this type of analysis. GIS allows for the integration of diverse datasets into a centralized database, facilitating detailed spatial analysis at different geographic levels, such as urban districts and census tracts. The constant updating of the EPC database, combined with GIS-based analysis, will allow for more accurate and representative assessments of Seville’s building stock over time.
The integration of mapping techniques in the assessment of energy poverty at the urban level proves to be a valuable approach for identifying vulnerable areas and informing strategic actions. By visualizing the spatial distribution of buildings that pose a higher risk of energy poverty, decision-makers gain a more nuanced understanding of the relationship between built environment characteristics and socio-economic challenges. This spatial perspective not only enhances the diagnostic accuracy but also facilitates more precise interventions aimed at reducing energy vulnerability.
Furthermore, mapping as an analytical tool significantly contributes to the formulation of evidence-based public policies. By highlighting critical areas requiring intervention, policymakers can better allocate resources and prioritize actions to enhance building performance and mitigate energy poverty. Therefore, incorporating spatial analysis into energy poverty studies enables the development of more targeted and sustainable urban strategies, ultimately fostering social resilience and promoting energy equity in urban environments. Future research should explore additional data sources that allow for more detailed and up-to-date analyses of energy efficiency and energy poverty conditions at local scale. Incorporating complementary datasets—such as real household energy consumption or smart metering data—could complement the estimations provided by EPCs. Demographic segmentation could also be incorporated into the spatial analysis of energy poverty at the census tract level in future research. While the present study focused on energy-related indicators derived from EPC data, cadastral data and annual net household income information, combining this approach with demographic variables (e.g., age, household size, etc.) could help to provide a deeper understanding of the populations most at risk. Moreover, combining the proposed spatial analysis with building energy simulations could provide a more accurate representation of EPnr consumption by accounting for different occupancy patterns than those assumed in standardized EPC methodology. Finally, the integration of Building Information Modeling (BIM) with GIS presents a promising avenue for future work. BIM/GIS could improve data interoperability and spatial resolution of analyses.


 ,
, 
