Article

Neural Network Method for Distance Prediction and Impedance Matching of a Wireless Power Transfer System

by
Lorenzo Sabino
*,†,
Davide Milillo
,
Fabio Crescimbini
and
Francesco Riganti Fulginei
Department of Industrial, Electronic and Mechanical Engineering, Roma Tre University, 00146 Rome, Italy
*
Author to whom correspondence should be addressed.
These authors contributed equally to this work.
Appl. Sci. 2025, 15(11), 6351; https://doi.org/10.3390/app15116351
Submission received: 23 February 2025 / Revised: 20 May 2025 / Accepted: 24 May 2025 / Published: 5 June 2025
(This article belongs to the Special Issue New Insights into Wireless Power Transmission Systems)

Abstract

:
This study introduces a novel and versatile application of neural networks (NNs) to enhance two distinct aspects of Wireless Power Transfer (WPT) systems. First, a compact NN architecture is presented for accurate distance estimation and automated impedance matching in a WPT system. Trained on either impedance measurements or scattering parameters acquired from the transmitter side, this NN effectively predicts the inter-coil distance and identifies optimal capacitance values for maximizing power transfer. Validation using both simulated and experimental data demonstrates consistently low prediction error rates. Second, a separate NN is employed to predict the optimal transmission frequency for minimizing the phase angle between voltage and current, thereby maximizing the power factor. This NN, validated on experimental data spanning various load conditions and inter-coil distances, achieves performance comparable to traditional PI control, but with significantly faster prediction speeds. This speed advantage is crucial for real-time applications and directly contributes to improved power efficiency. The results presented in this study, including the high accuracy of distance and capacitance prediction and the rapid determination of optimal frequencies for power factor maximization, showcase the significant potential of NNs for optimizing WPT systems. These findings open the way for more efficient, adaptable, and intelligent wireless energy transfer solutions, with potential applications ranging from dynamic charging of electric vehicles to real-time optimization of implantable medical devices.

1. Introduction

WPT systems present a complex characterization challenge due to their inherent nonlinear behavior [1,2,3,4,5]. Traditional analytical methods often struggle to accurately predict and optimize WPT system performance due to these nonlinearities [6,7,8,9,10,11,12]. Consequently, research efforts have increasingly focused on advanced computational techniques, including machine learning (ML) approaches, for WPT system modeling and optimization [13,14,15]. NNs have proven particularly effective in this domain [16]. Their capacity for high prediction accuracy, contingent on rigorous training and validation, is essential for capturing the intricate dynamics of WPT systems [17,18,19,20,21,22,23]. Furthermore, NNs offer considerable flexibility, adapting readily to diverse scenarios, such as variations in coil geometry or system configuration. Finally, NNs excel at modeling the complex nonlinearities inherent in WPT systems, often surpassing the capabilities of conventional analytical methods [24,25,26,27,28]. This study presents a compact NN architecture designed for efficient and practical implementation. The compact design facilitates potential deployment on microcontrollers, enabling real-time operation. This real-time capability is particularly advantageous for dynamically assessing inter-coil distance, implementing real-time impedance matching adjustments and real-time changes of frequency to increase the power factor [29,30,31,32,33,34]. By optimizing these parameters dynamically, the proposed method enhances overall system performance, specifically energy transfer efficiency and adaptability [25,35]. Furthermore, NNs can be employed to minimize the phase angle between voltage and current by adjusting the WPT system frequency [36,37,38]. Minimizing the phase means increasing the power factor, improving transfer efficiency. This application of NN tries to address some longstanding challenges associated with the characterization of WPT systems, trying to make a step forward in the development of more efficient and versatile wireless power solutions.

2. Materials and Methods

2.1. Neural Network

2.1.1. Neural Network Model on Impedance Dataset

An NN architecture was developed and trained using the Levenberg–Marquardt backpropagation algorithm, with Mean Squared Error (MSE) as the performance metric [39]. A key design principle was minimizing the NN’s complexity to mitigate overfitting and facilitate future implementation on a microcontroller. Consequently, a relatively small NN, comprising a single hidden layer of 10 neurons, was employed. This contrasts with the more complex architecture reported in [40], which utilized five hidden layers, each containing 15 neurons. For direct comparison with the results presented in [40], all code development for the present study was conducted within the MATLAB (R2024b) environment. However, the architecture’s simplicity is intended to enable future translation to C for embedded deployment. The data were normalized to the range [0, 1] through uniform scaling. The conversion factor was retained to denormalize predictions, facilitating comparison with the original data and enabling accurate graphical representation. Consistent with the methodology in [40], the dataset was partitioned into training and testing subsets, with a 70%–30% split. Two distinct input configurations were explored: the S-parameters or the Z-parameters. The NN’s output targets included the inter-coil distance, configuration parameters (describing coil alignment and rotation), and capacitance values ( C 1 , C 2 , and C 3 ) employed by the Adaptive Impedance Matching Network (AIMN) for impedance matching. This approach allows for the NN to predict both geometric and electrical characteristics of the WPT system. For the prediction of the capacitance values, a bigger NN was used, with two layers of 10 neurons each, instead of only one layer. This improved the accuracy without overfitting. All the NN parameters are reported for clarity in Table 1.

2.1.2. Neural Network Model on Phase Dataset

The neural network here has to substitute or improve the control system. For this reason, it has been chosen as the application prediction of the best frequency of the WPT system for which the phase angle between voltage and current is minimum (below 5 ). Having known the best frequency, the control system is no longer required, or it can be used to adjust the frequency for fine-tuning, resulting in faster control and better accuracy.
For each configuration of load condition (R) and distance between the two coils ( z 0 ), as an output parameter, as explained, the final frequency was taken; and as an input parameter, the starting frequency, the starting phase, R and z 0 , for a total of 18 points. Considering also the noise and errors on the dataset, it is not a simple task to train an NN with high accuracy.
For this reason, several simulations were carried out to refine the hyperparameters of the model, and a bigger NN was used respect the one used for the other dataset.
The model used is a classic neural network, with two hidden layers, with 20 and 10 neurons. The activation function used is the ReLU. The optimizer is ADAM, the loss is MSE, and the metric used is MAE. The 18 data points were divided into 12 for training and 6 for testing, with a validation slit of 0.2. The batch size = 4 and the epochs = 500. Again, the same normalization and denormalization technique was used. In Table 1, all NN parameters are reported.
This NN is trained to predict the best frequency that minimizes the phase from only one measurement point. This will considerably increase the speed of the control system since the measurements are generally the slowest process, and in this dataset, about 200 measurements were performed for each case.

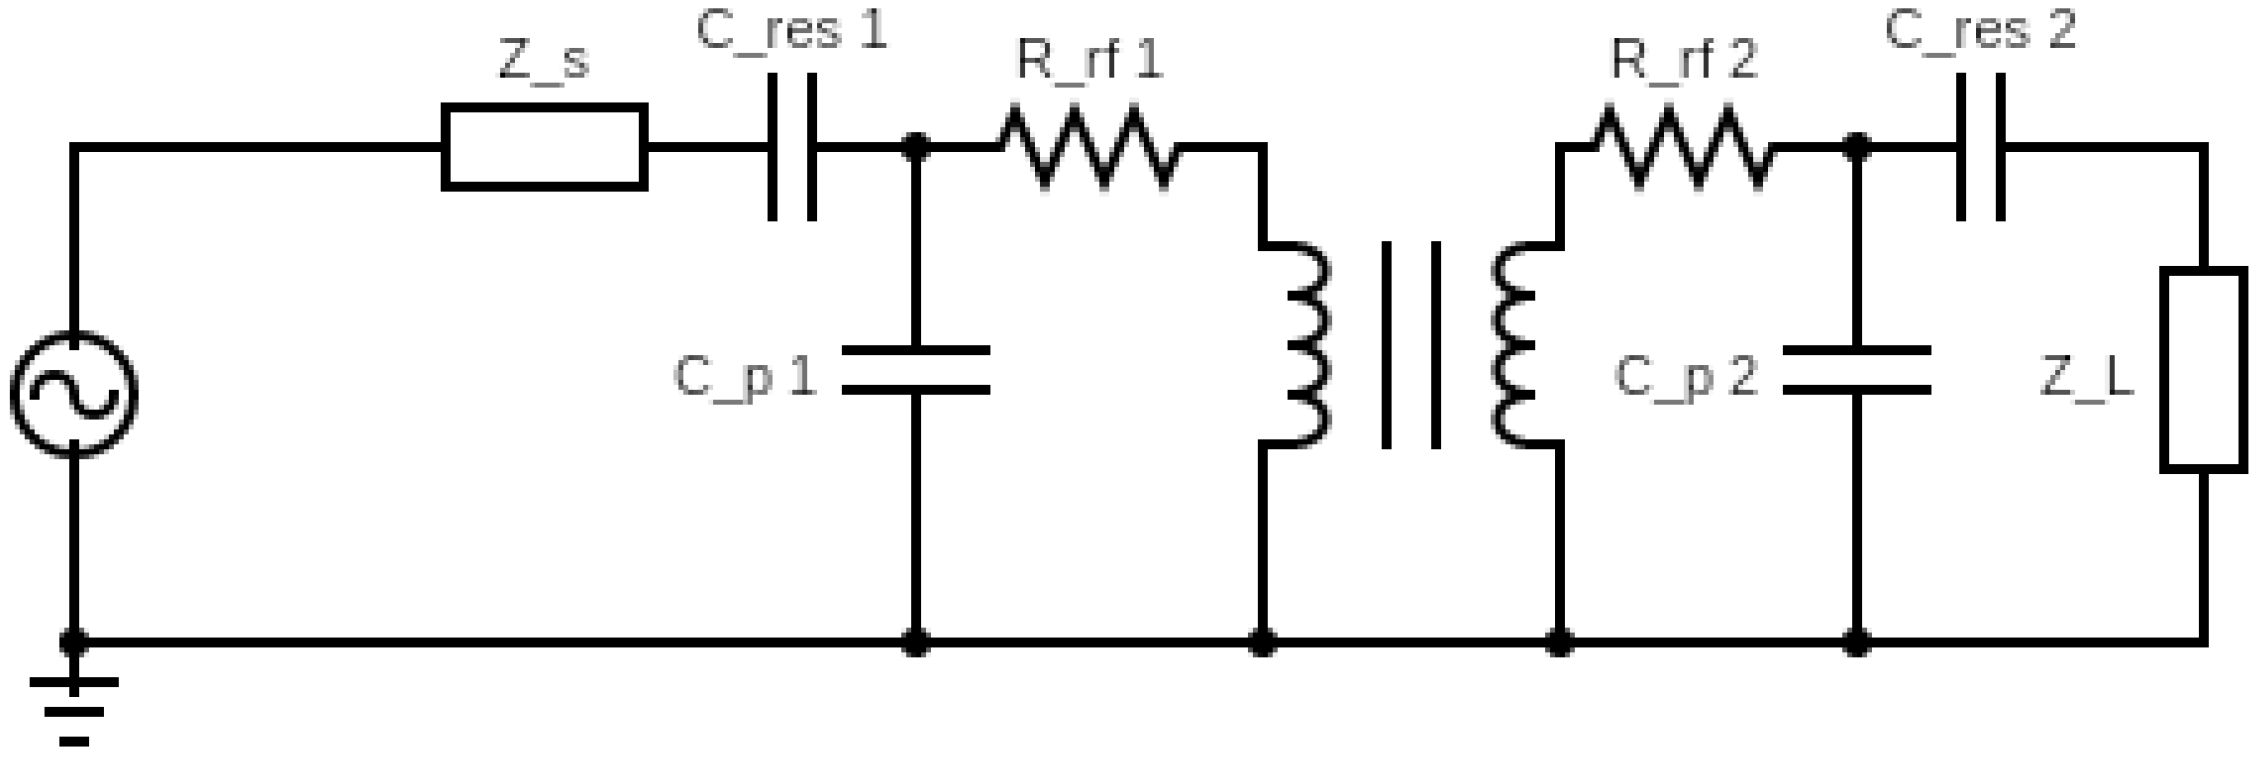
3. WPT System: Experimental and Simulated Data

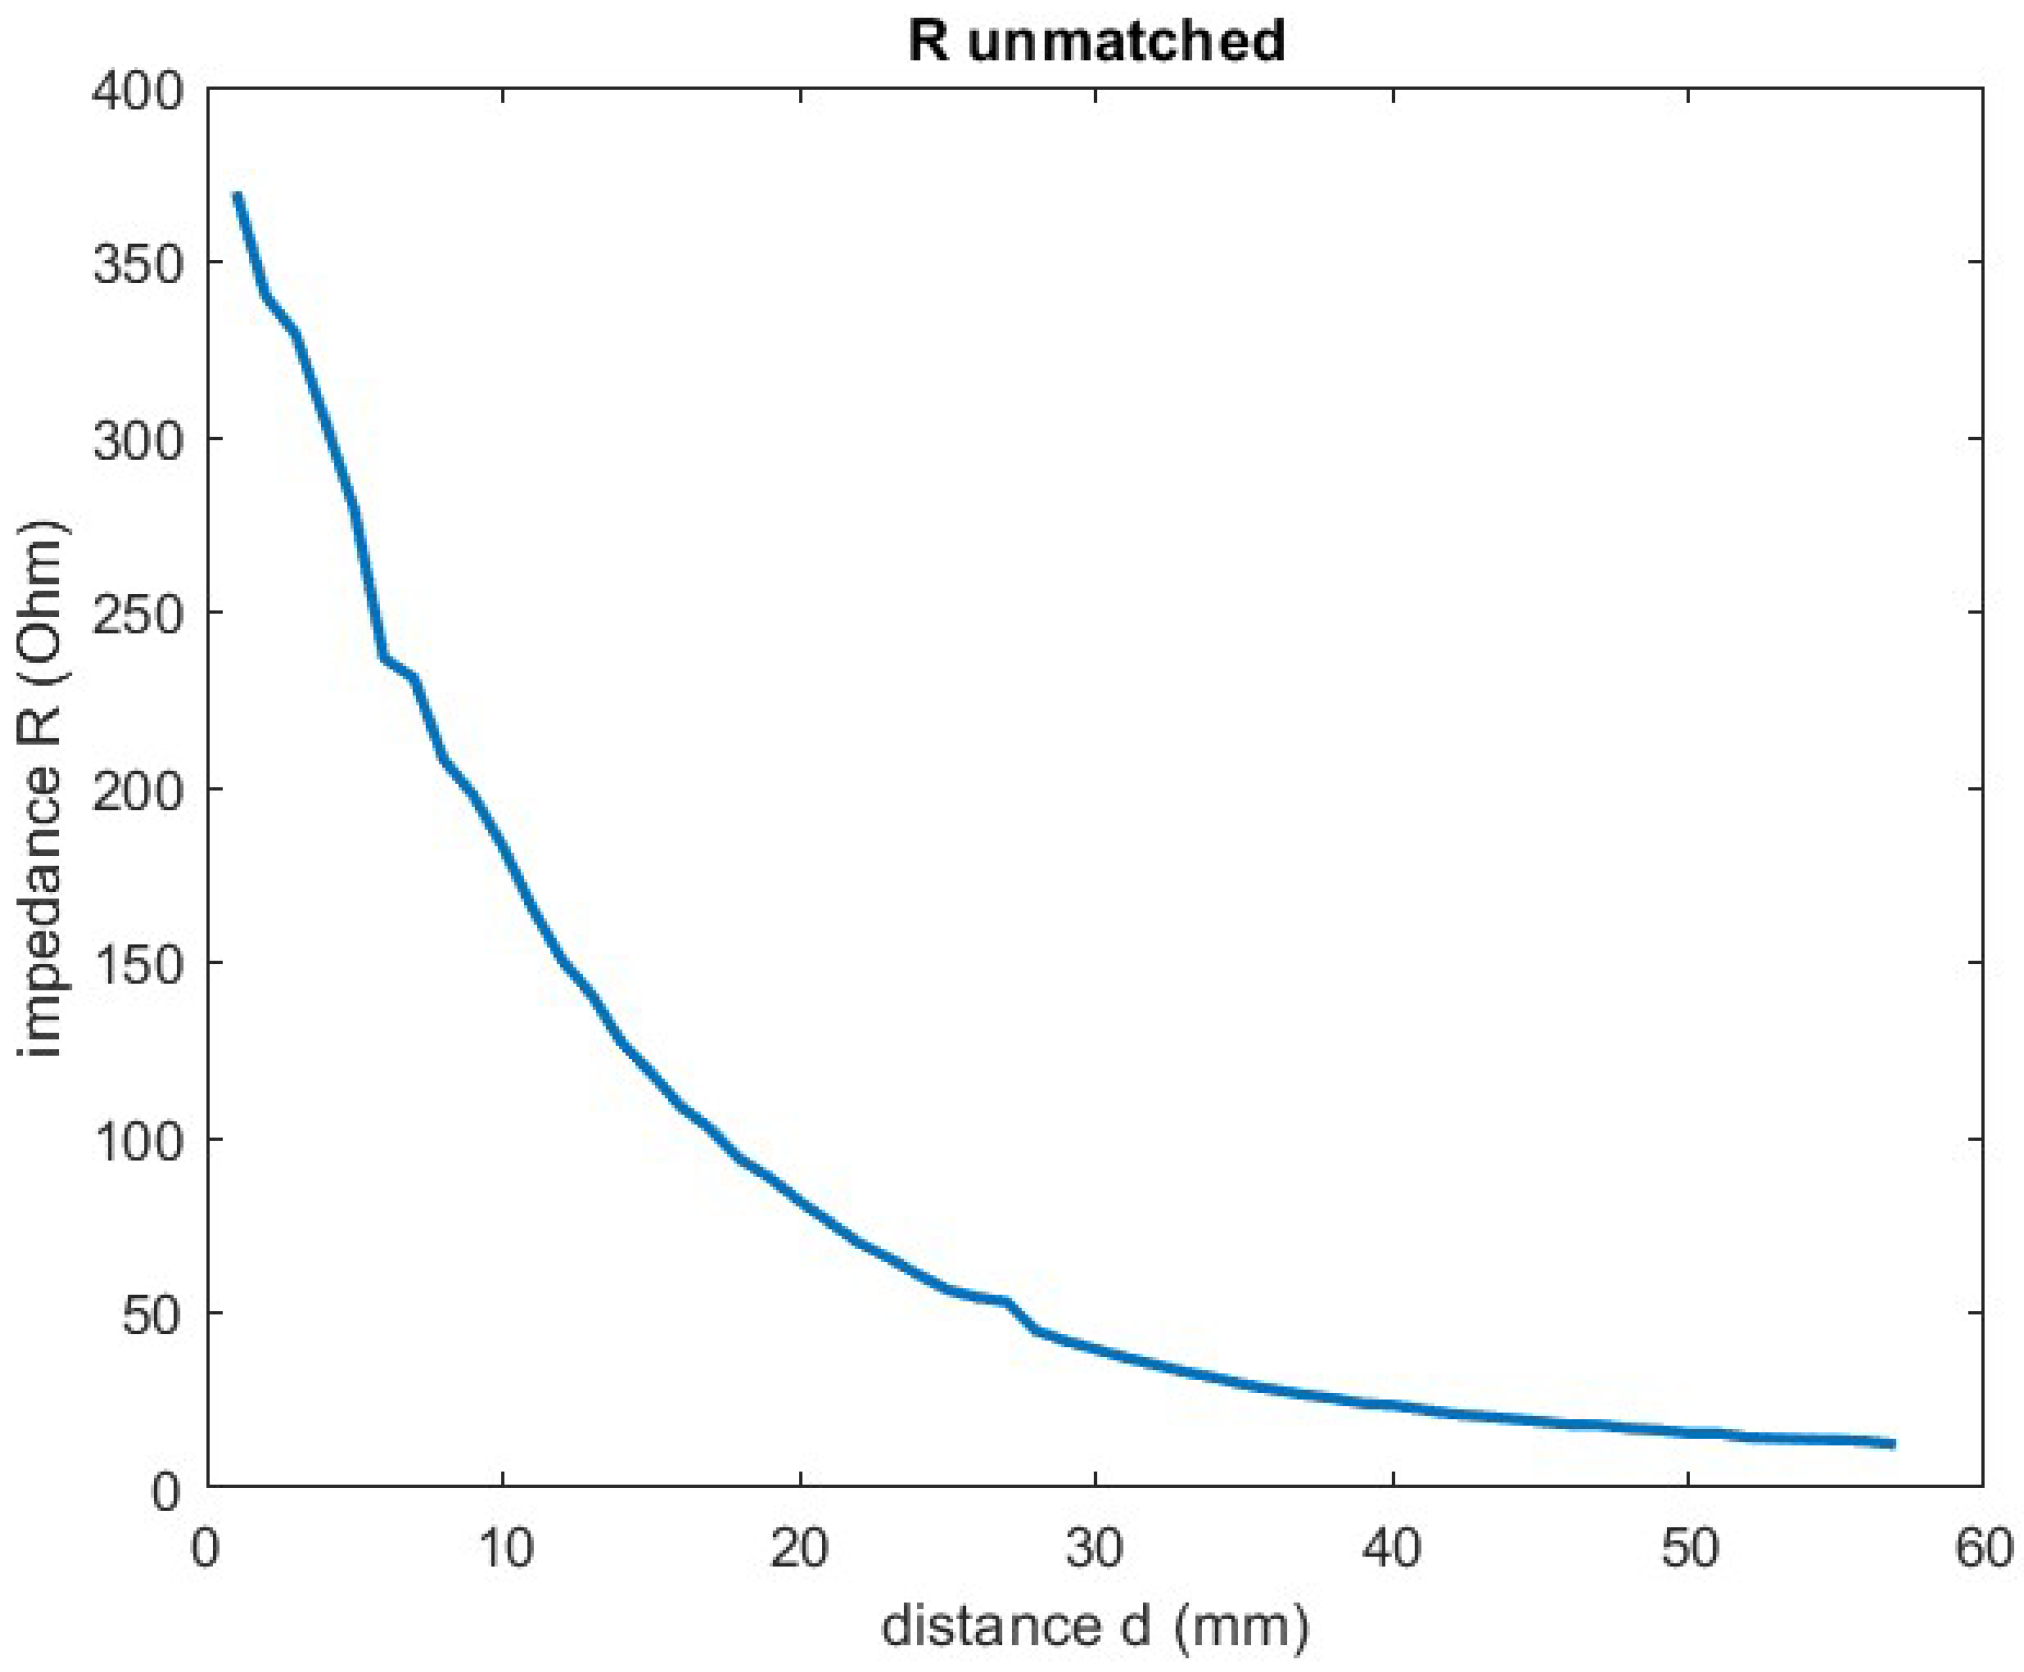
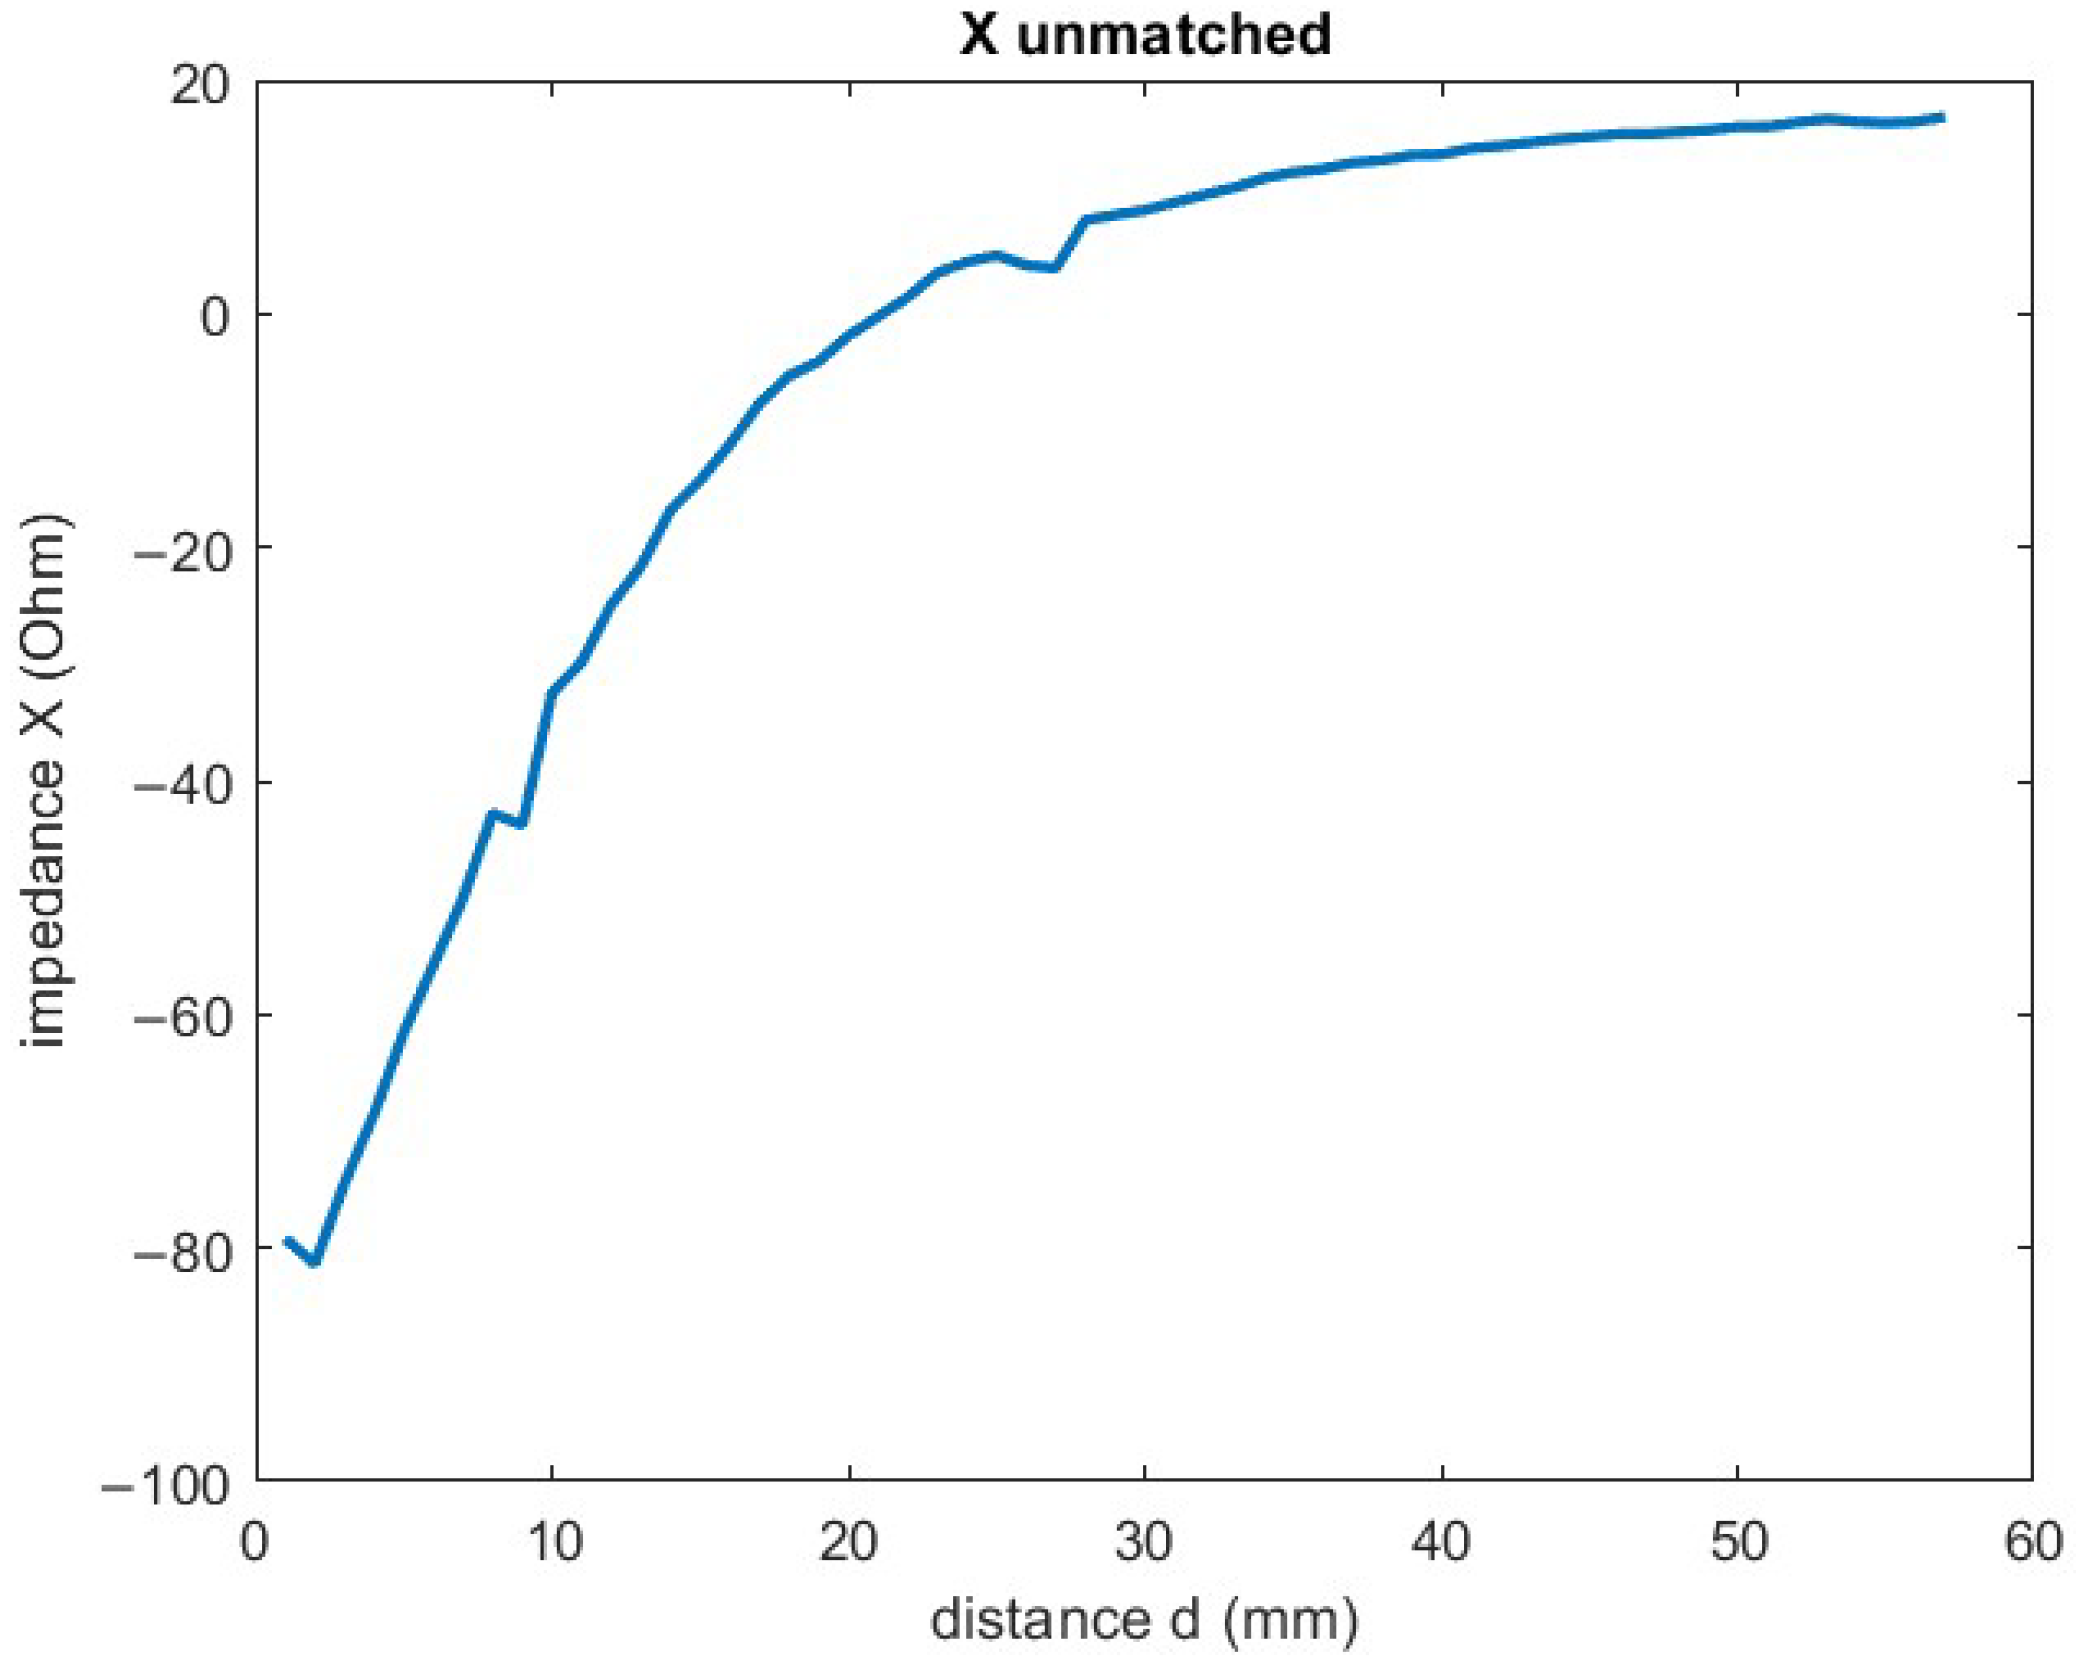
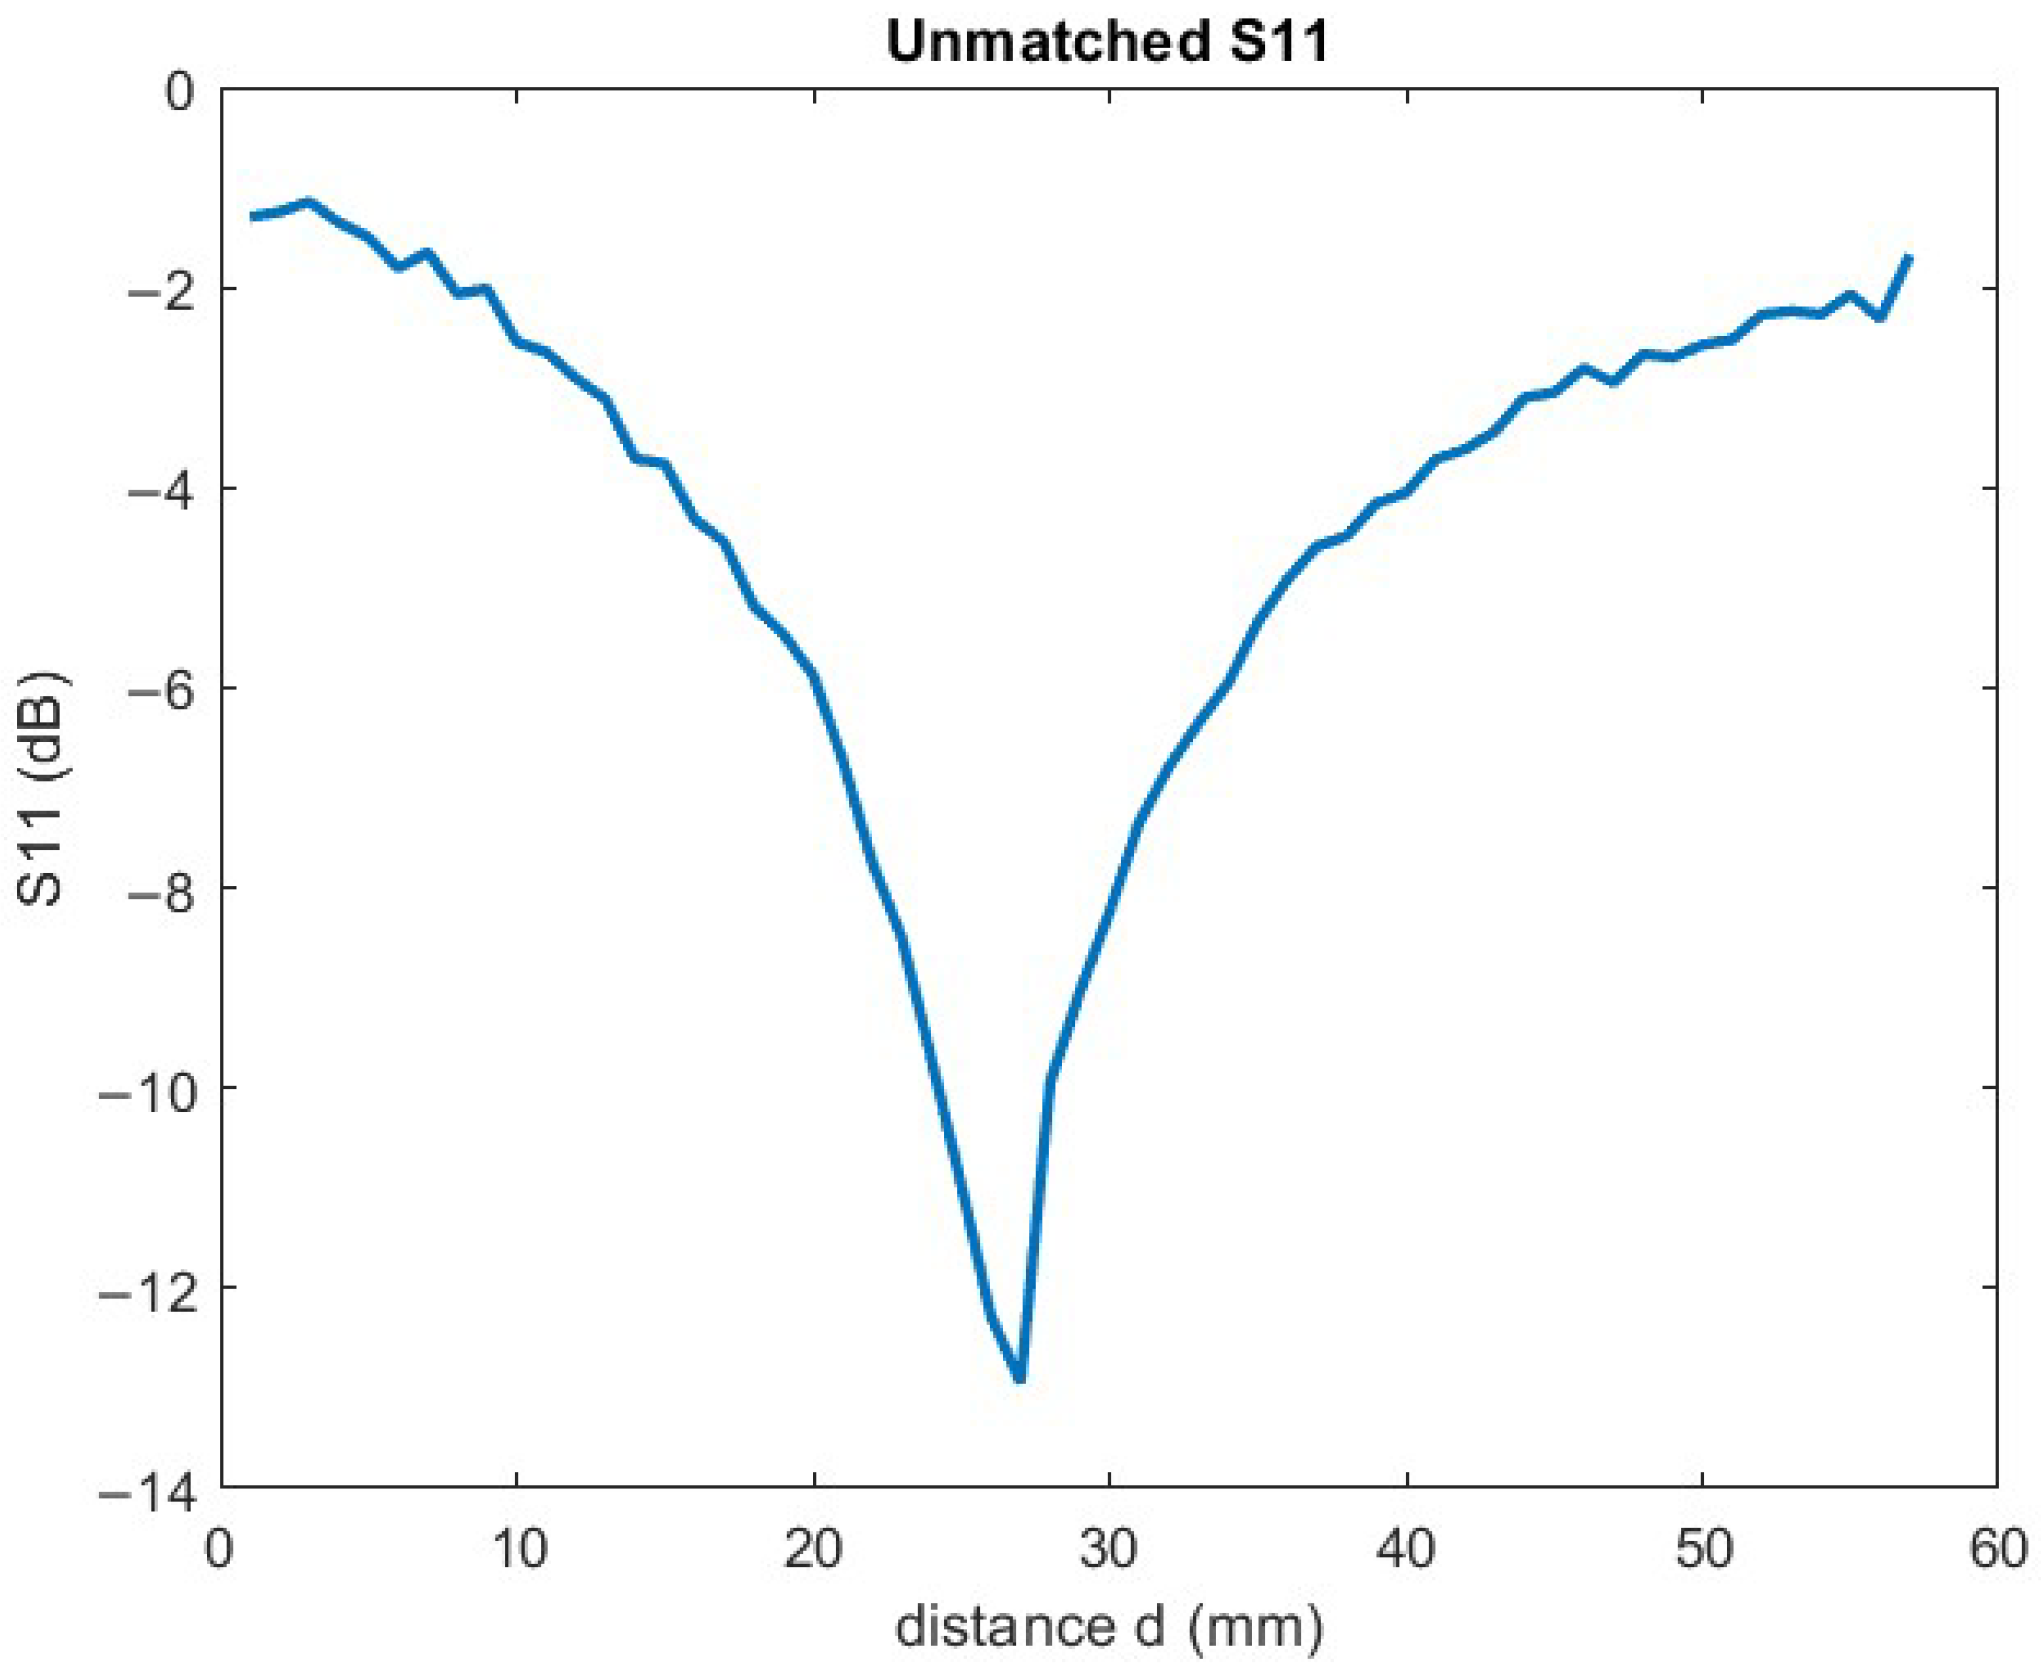
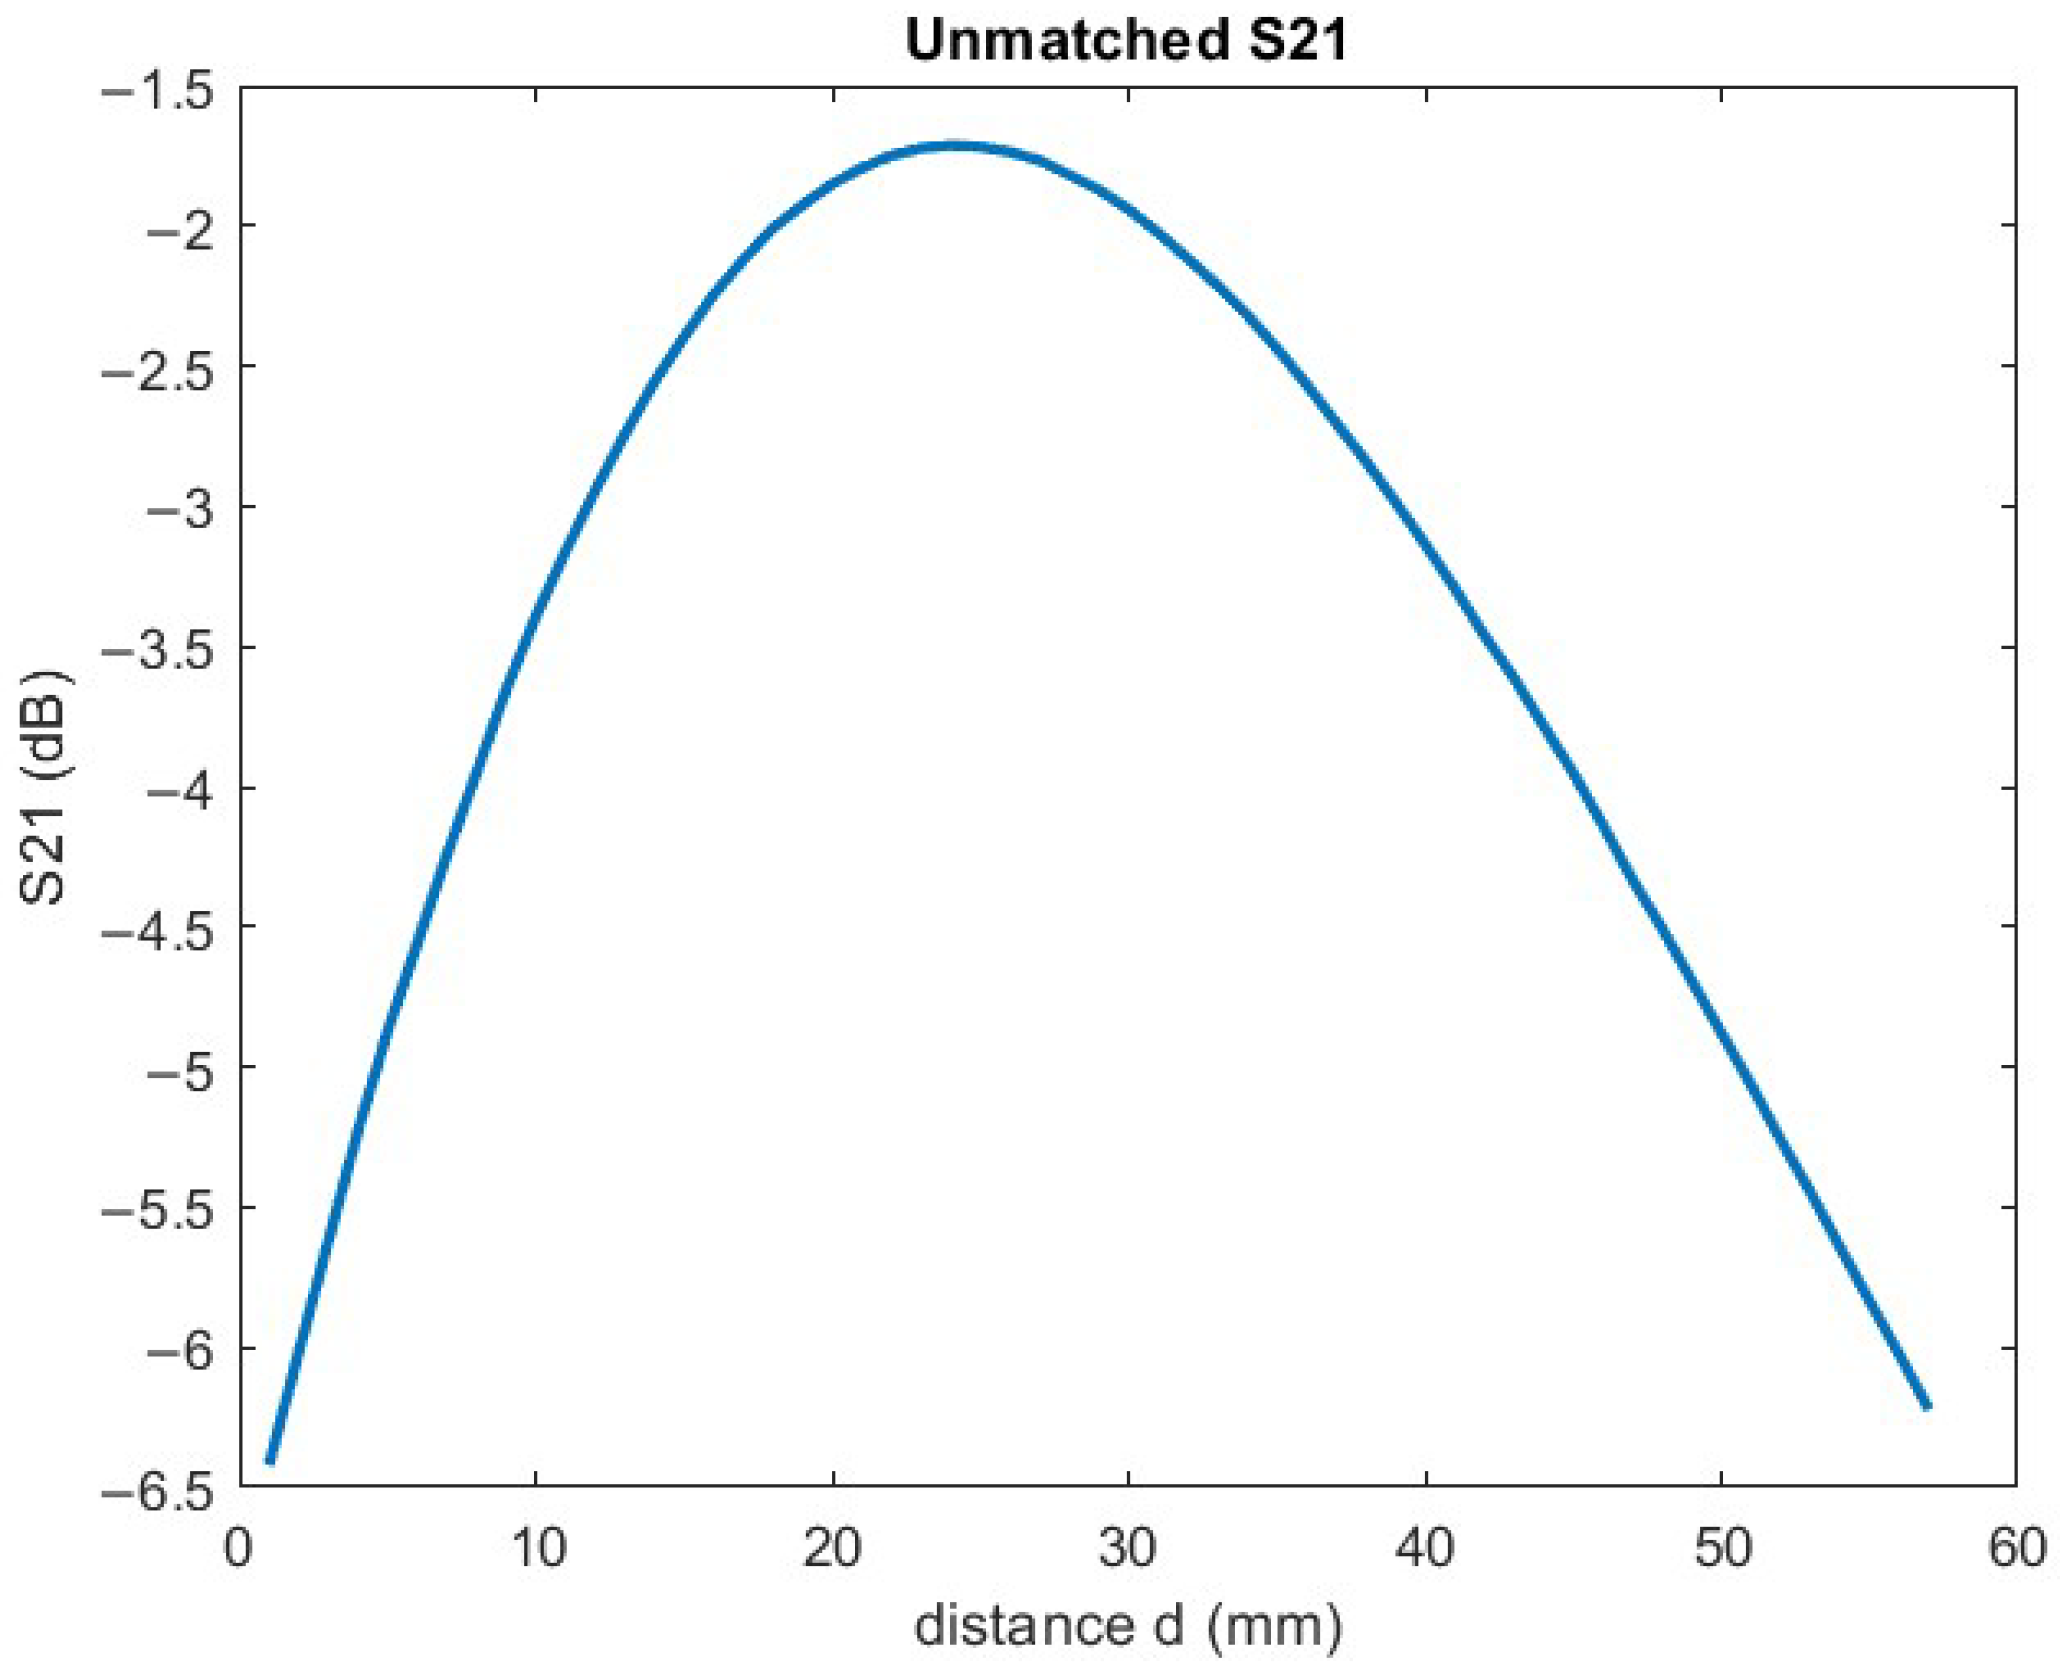
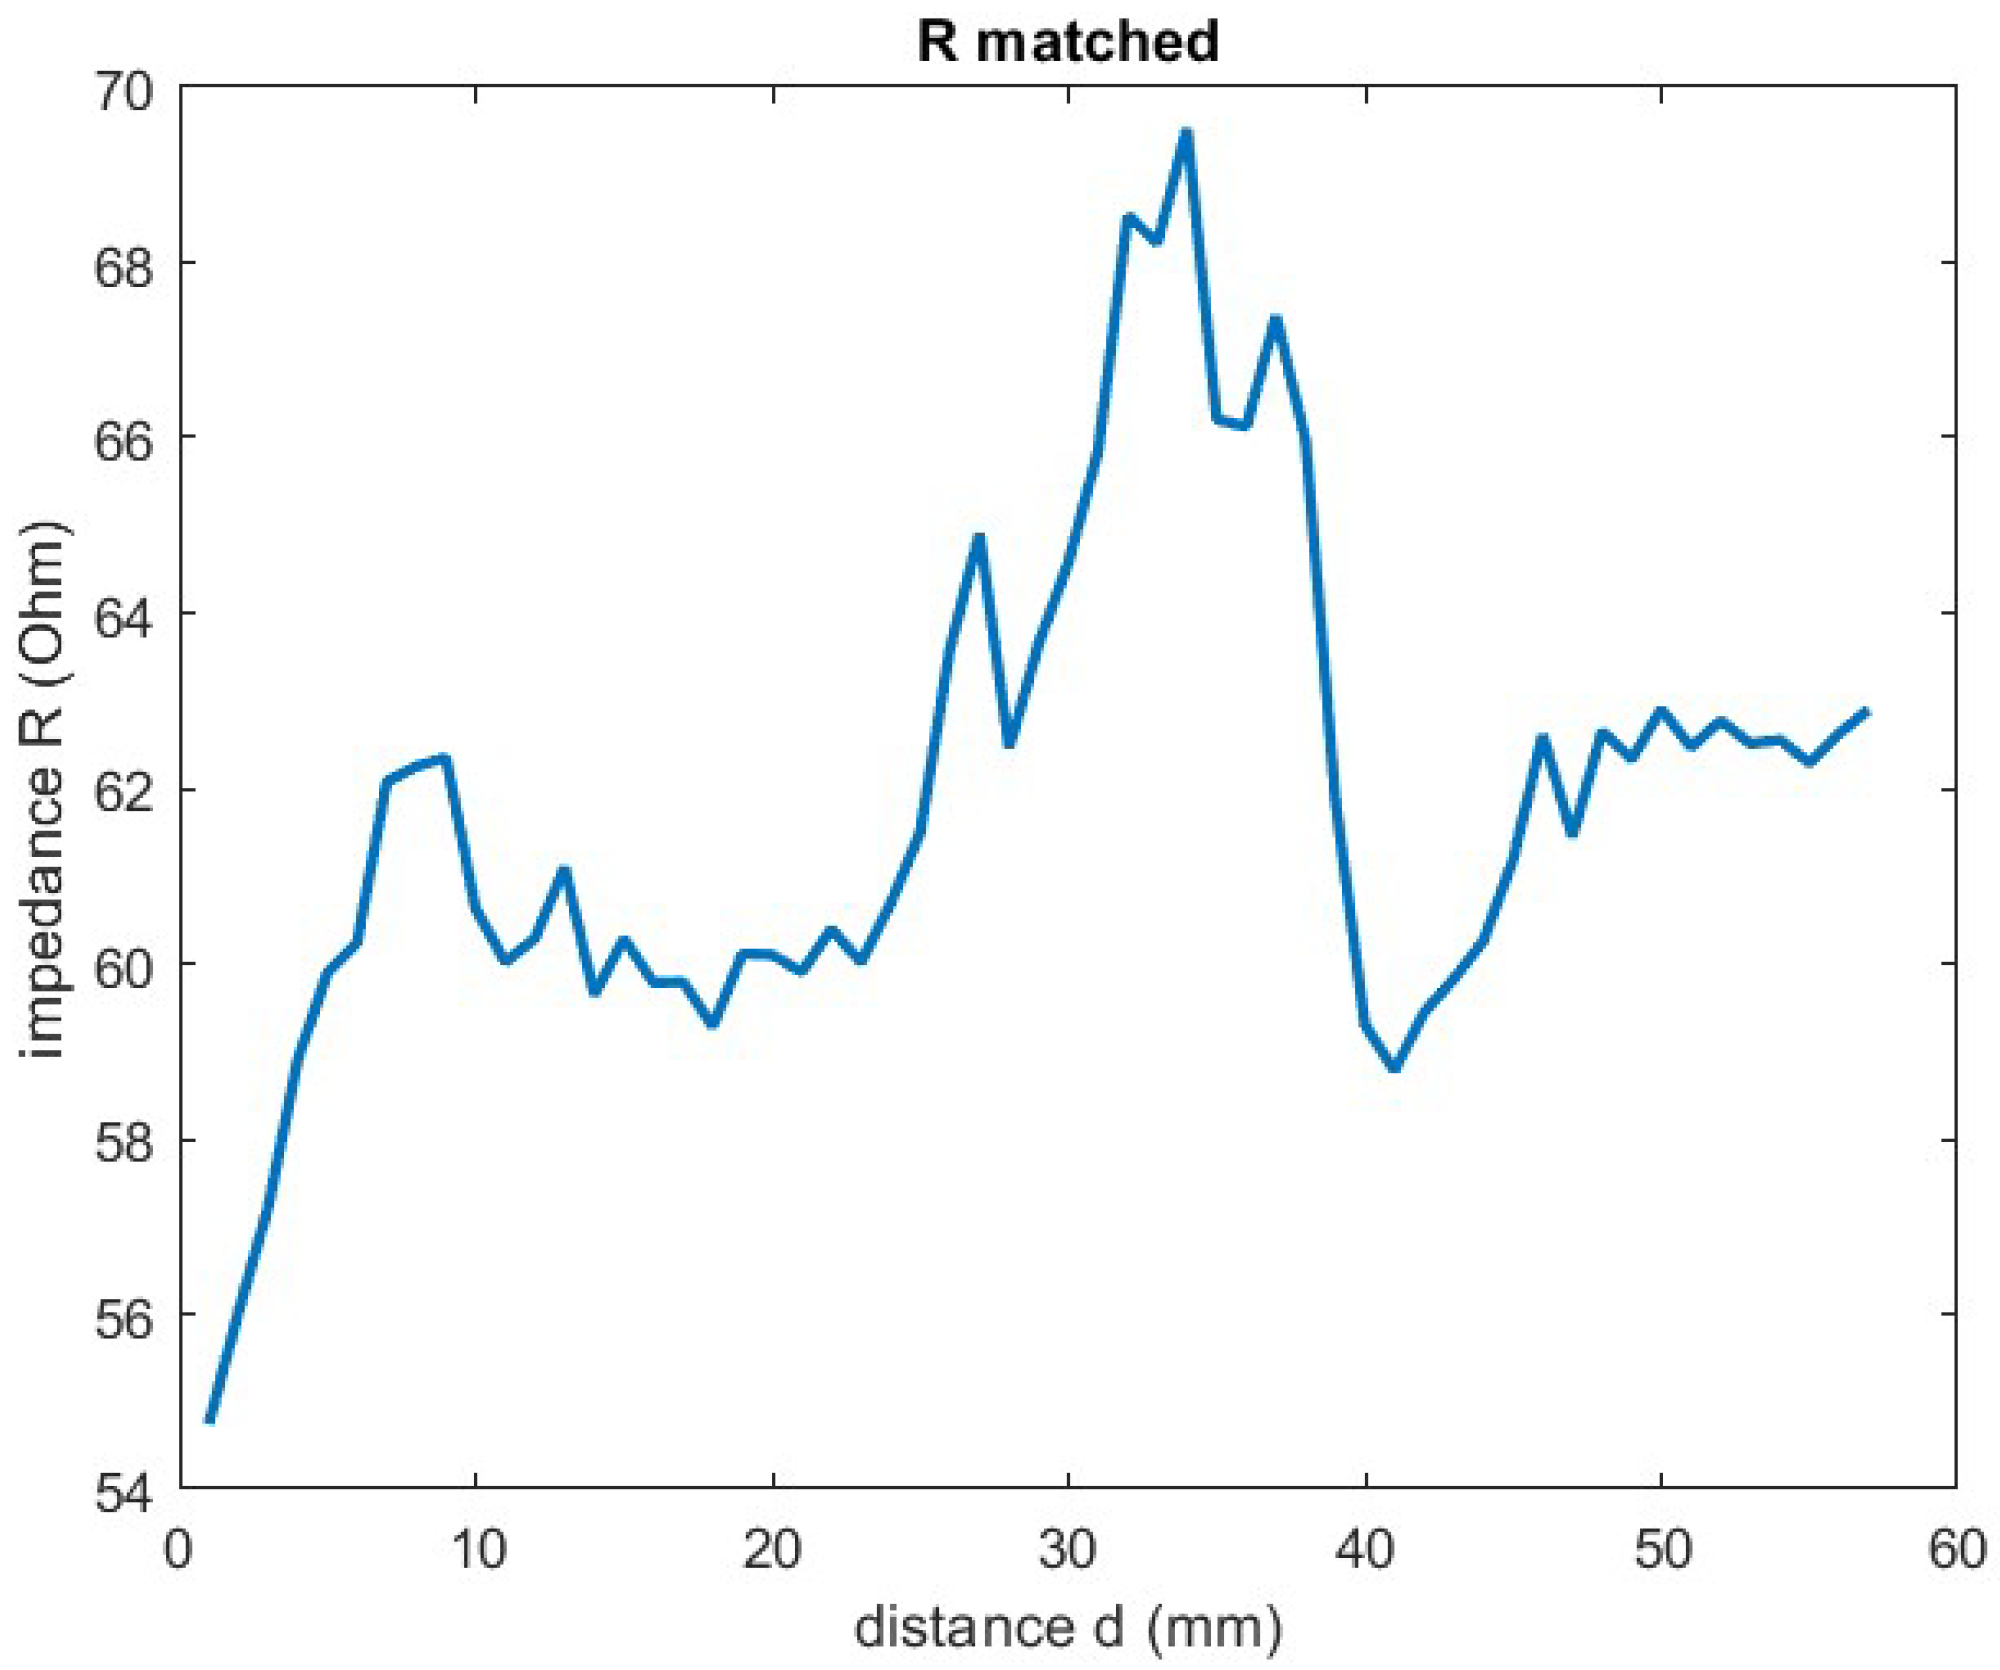
3.1. WPT System Impedance

The proposed method was evaluated using a near-field communication (NFC)-based WPT system operating at 13.56 MHz [40]. This system comprised two magnetically coupled planar resonators, facilitating power transfer between the transmitter and the receiver (Figure 1). A microcontroller, running a neural network (NN), adjusts the capacitance values of the circuit to achieve perfect impedance matching, thereby improving overall efficiency. The NN manages an AIMN made of an inductive–capacitance circuit consisting of three cascaded L-type lowpass stages in a series–series configuration (Figure 2). To obtain accurate impedance matching, the microcontroller adjusts three capacitance values of the ceramic capacitors labeled C 1 , C 2 , and C 3 . Based on those measurements, the microcontroller simultaneously measures the system’s input impedance ( Z i n ) and the scattering parameters (the complex S-matrix). In the Figure 3, Figure 4, Figure 5, and Figure 6 are shown, respectively, the impedance parameter, real and imaginary part, and scattering parameters for case 1.
The physical WPT is made of two circular coils, separated by a distance d and characterized by a mutual inductance k. Transverse misalignment ( Δ x ) and ( Δ y ) and receiver coil rotation ( θ ) were introduced to simulate realistic operating conditions. The receiver was connected to a fixed load, while the transmitter was connected to both the microcontroller and the AIMN. Maximum power transfer was achieved through impedance matching via the AIMN. However, to mitigate potential AIMN-induced losses, the microcontroller was also programmed to bypass the AIMN when its activation was deemed detrimental. Here is the plot after the impedance matching performed by the AIMN, for the real and imaginary part of the input impedance, in Figure 7 and Figure 8, respectively.
A huge amount of data was collected through both experimentation and Cadence AWR simulation, encompassing variations in coil distance, lateral misalignment, and rotation angle. Three primary experimental configurations are included in the dataset described in [41], each featuring θ = 0 and distinct values of Δ x = 0 mm, 20 mm, and 30 mm and Δ y = 0 mm, 20 mm, 25 mm. For each configuration, 57 data points were acquired by varying d from 14 mm to 70 mm in a 1 mm step. Each point was measured five times to minimize noise. The experimental dataset includes | S 11 | , | S 21 | , the input impedance, the complex value Z i n , and the reflection coefficient Γ along with the AIMN capacitance values before and after matching. Complementing the experimental data, simulation results were generated for the same three configurations and an additional 229 configurations with different Δ x , Δ y , and θ . In all simulated cases, data were acquired across 57 distances, and the complete complex S-parameter matrix was recorded for 1001 frequency points. In summary, the experimental dataset covers 3 configurations at 57 distances, while the simulation dataset consists of 229 configurations at 57 distances. The main goal of this article is to predict the distance and the best capacitance values of the system based on either the measured S parameters or the input impedance Z i n .

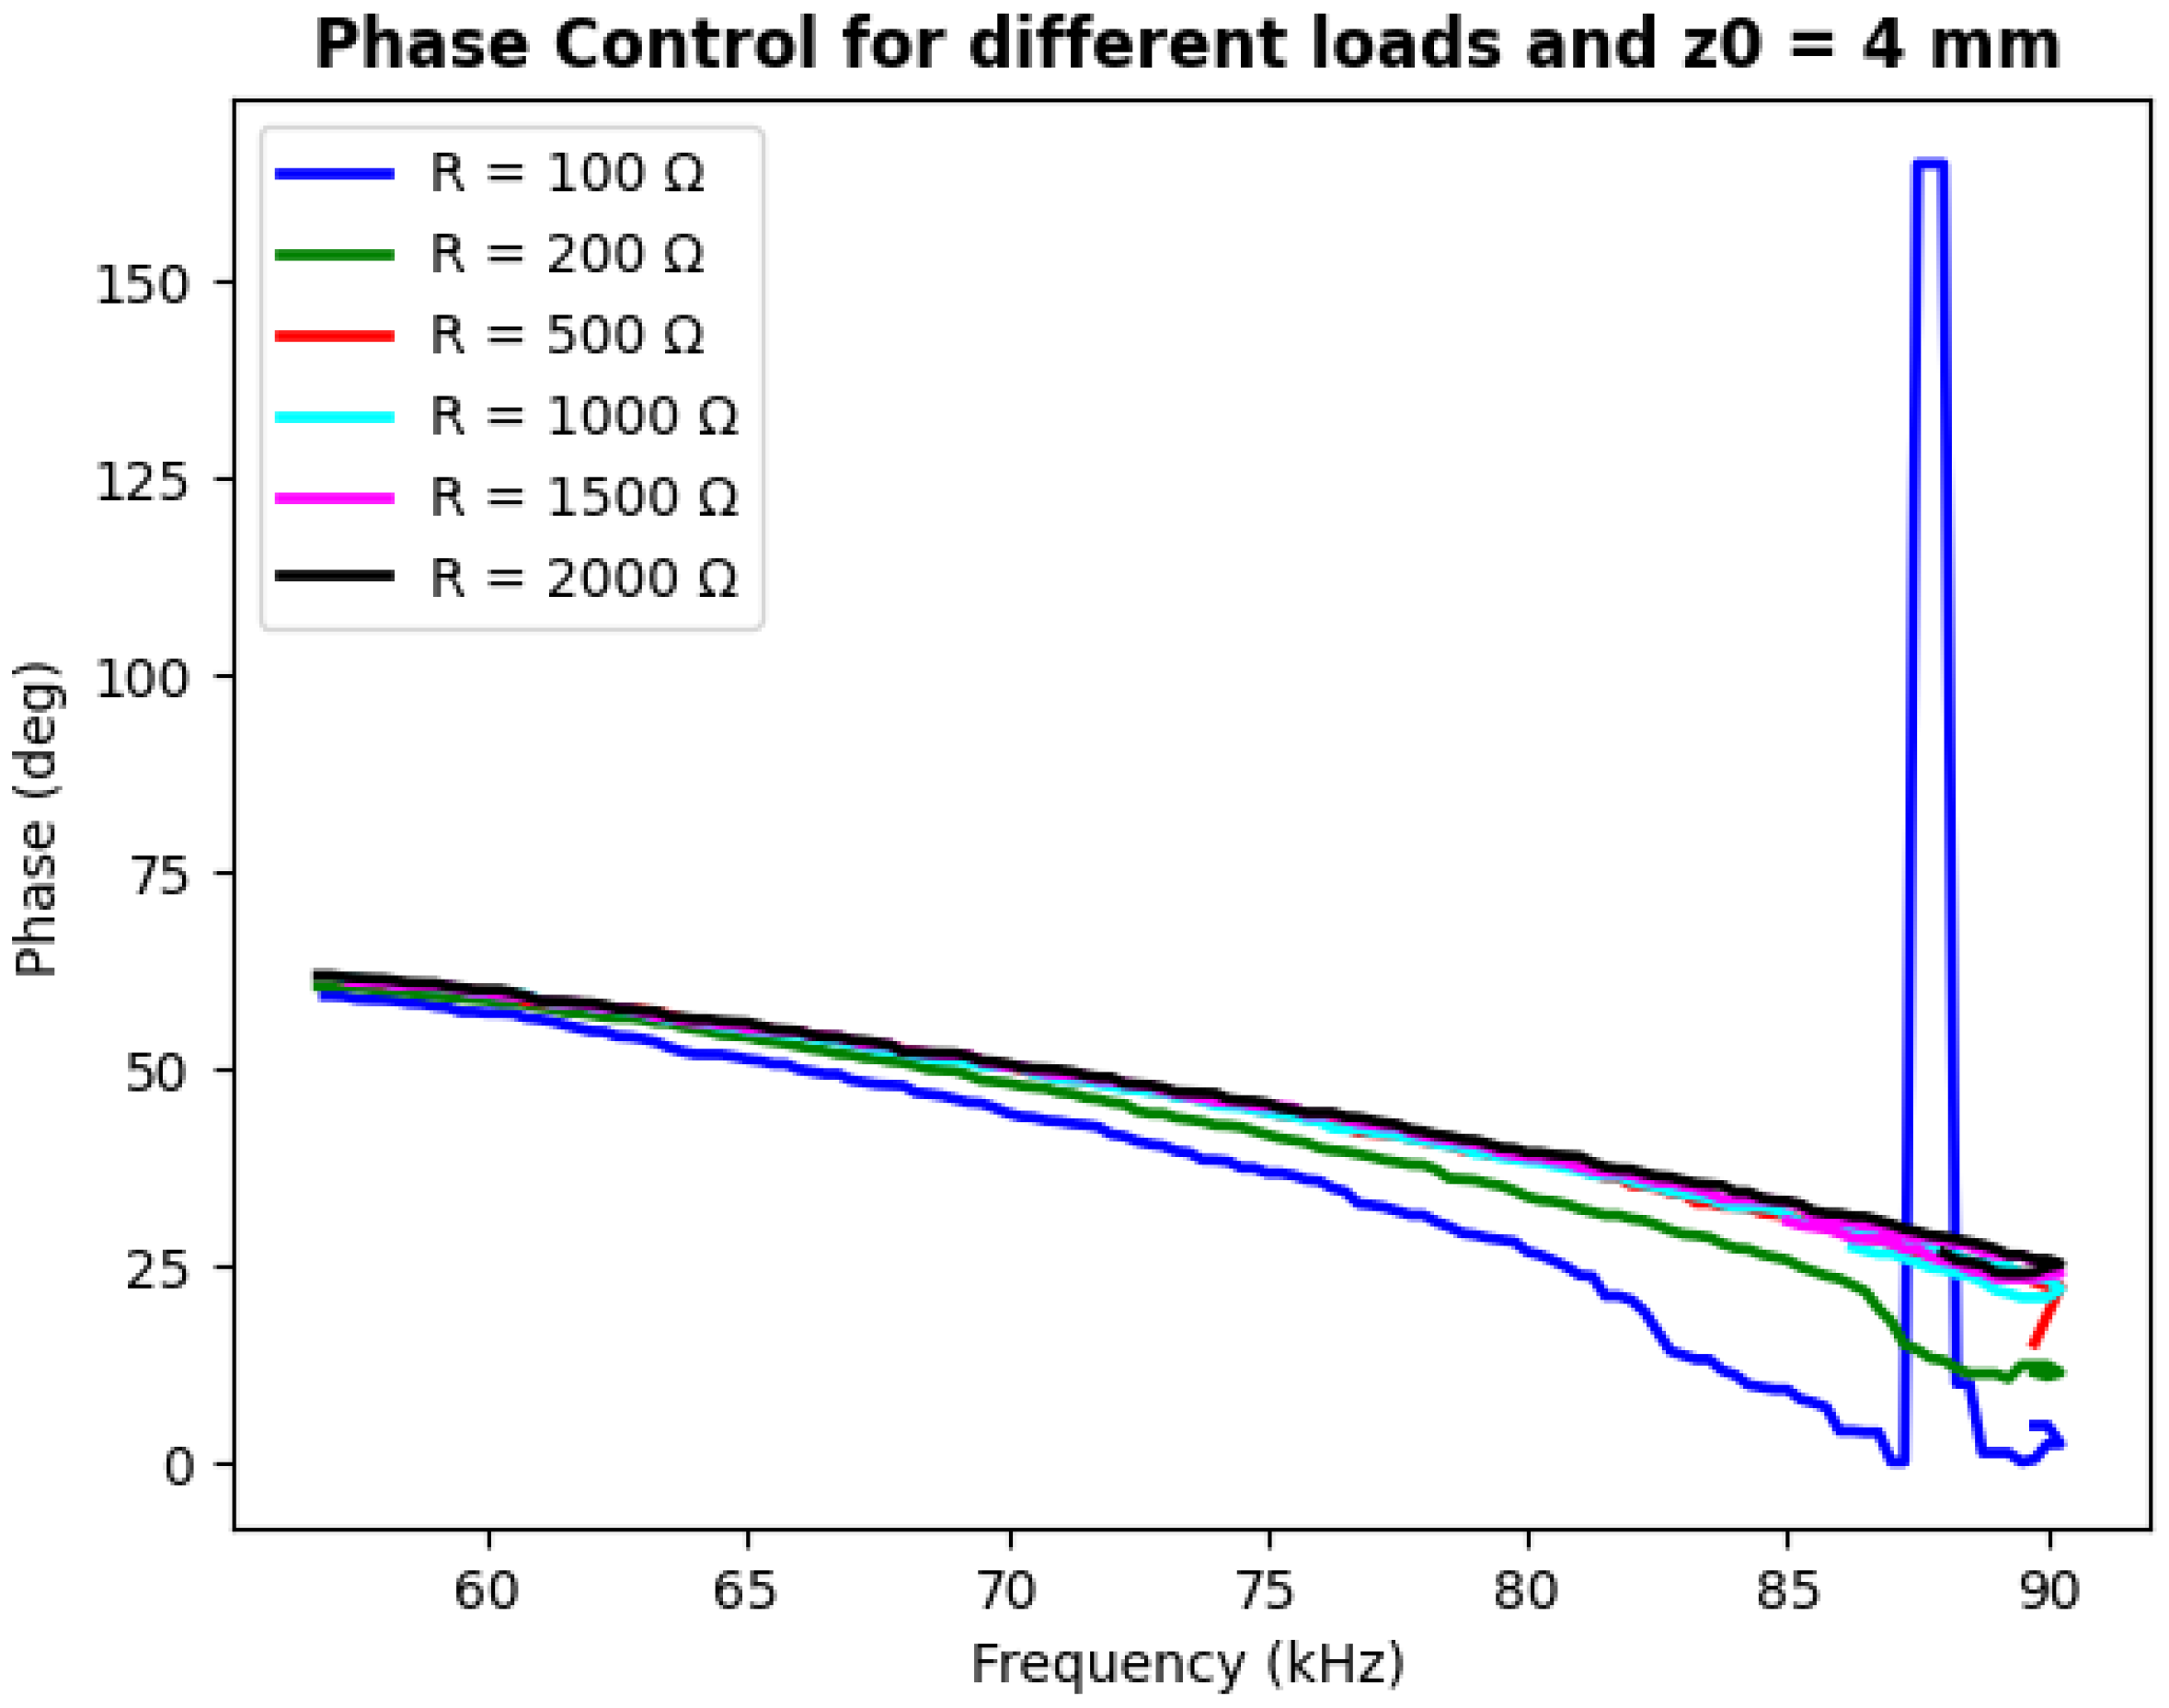
3.2. WPT System Phase

A second WPT system analyzed in this study, as described in [42], utilizes inductive coupling for receiver coil charging. This system operates with a variable frequency, necessitating a control mechanism to adapt to fluctuating load conditions and inter-coil distances. To evaluate this, the phase difference between the voltage and the current of the transmitter coil was measured. A proportional–integral (PI) controller, implemented on a microcontroller, was employed to adjust the WPT system’s frequency and thus improve the power factor, cos ϕ . The feedback control objective was to maintain a phase angle ϕ below 5 . The operating frequency range spanned 50 kHz to 90 kHz. The PI controller utilized fixed proportional and integral constants of 1 and 10, respectively. The phase difference served directly as the error signal since the target phase was 0 . the control loop is interrupted when the phase goes below 5 . The frequency of the WPT system was the variable that the control circuit controlled. As suggested in [42], the PI control scheme can be enhanced through the integration of an Adaptive Neuro-Fuzzy Inference System (ANFIS) for the dynamic adaptation of the PI constants, enabling a faster control response. In the experiments, a huge amount of data was acquired, but in this study, only four parameters are of interest: frequency, phase, load condition, and the distance between the two coils. Experiments were conducted 18 times, varying the load resistance, R, and the distances between the transmitter and the receiver, z 0 . Specifically, tests were performed with six load values, R = 100, 200, 500, 1000, 1500, and 2000 Ω , and three distance values, z 0 = 0, 4, and 8 mm. This dataset is publicly available in [43]. Analysis of this dataset reveals phase trends as a function of frequency and R, as shown in Figure 9, and z 0 , as depicted in Figure 10.
The measured data, presented in Figure 9 and Figure 10, exhibit significant noise and some data anomalies. Rather than employing regularization techniques, this dataset was intentionally used as a validation benchmark to assess the robustness of the proposed method. This approach acknowledges the inherent challenges of real-world measurements and tests the NN’s ability to perform effectively under less-than-ideal conditions. Furthermore, it is anticipated that the NN will be deployed in real-world scenarios where perfectly clean measurements are unlikely. Therefore, training and validation with this noisy dataset aim to ensure the NN’s resilience to such imperfections.

4. Results

4.1. Simulation Results

The initial application of this NN was on the simulated dataset. The input parameters consisted of the complex scattering matrix. To reduce dimensionality without compromising information, only the magnitudes of the reflection and transmission coefficients at port 1 were utilized, only at the resonant frequency f 0 = 13.56 M H z : | S 11 ( f 0 ) | and | S 21 ( f 0 ) | . The NN output was the distance value, an array of 57 elements. This NN was applied to each of the 229 configurations.
Figure 11 illustrates the training process for a representative configuration. The observed MSE of approximately 0.05 indicates near-perfect prediction performance on the testing dataset, with an error of approximately 1%. Figure 12 presents the same plot for the configuration exhibiting the worst prediction performance. Even in this case, the MSE = 0.199 and the mean error is about 1.34%, suggesting that, except for a few points, the prediction accuracy is high. The NN’s worst performance was consistently observed for non-zero tilt ( θ ) values. It is hypothesized that the angular misalignment between the coils introduces stronger nonlinearities or more complex system behavior, which are more challenging for the NN to model accurately.

4.2. Experimental Results

The same NN architecture was validated using experimental data. For each operating condition, five measurements were taken and subsequently averaged to minimize noise. The input to the NN consisted of the real and imaginary parts of the input impedance, R e ( Z i n ) and I m ( Z i n ) . The output remained the inter-coil distance, again represented by 57 distinct distance values. The same NN structure was also employed to predict the capacitance values ( C 1 , C 2 , and C 3 ) required for optimal AIMN performance. Optimal capacitance values were determined for each configuration and distance through simulation and subsequently validated experimentally, confirming matched performance in the experimental setup. These validated capacitance values served as the NN’s target output, using the same impedance inputs R e ( Z i n ) and I m ( Z i n ) . This process was repeated for all three experimentally measured configurations, each representing a different misalignment scenario. For the prediction of distance from R e ( Z i n ) and I m ( Z i n ) , the MSE on the test dataset is 1.85, 0.03, and 1.49 for configurations 1, 2, and 3, respectively. As shown in Figure 13, during the test of the NN, the prediction error is very low.
Additionally, the prediction of the capacitance value is very accurate, with MSE obtained on the test set, for cases 1, 2 and 3, respectively, as 0.31, 1.65, and 0.21. The low prediction error is reported in Figure 14 for C 1 , in Figure 15 for C 2 and in Figure 16 for C 3 .
The results obtained demonstrate high accuracy across all configurations for both distance and capacitance prediction. Building upon these initial findings, a further refinement was implemented using a two-stage NN approach. The first NN predicts the inter-coil distance, while the second NN leverages this predicted distance, along with impedance data, to determine the optimal capacitance values for impedance matching. This combined architecture, employing two smaller NNs, yielded even more accurate results compared with predicting capacitance directly from impedance alone. Specifically, the MSE was reduced to 0.18, demonstrating the benefit of incorporating distance information into the capacitance prediction process. Furthermore, this two-stage approach provides the additional advantage of explicitly predicting the inter-coil distance, a crucial parameter for adaptive WPT systems that adjust coil separation to maximize power transfer efficiency. The predicted results are visualized in Figure 17 for C 1 , in Figure 18 for C 2 , and in Figure 19 for C 3 .
These highly accurate results hold significant promise for the practical application of NNs in WPT systems. Compared with the NN architecture presented in [40], which employed five hidden layers with 15 neurons each, the compact NN developed in this study, with a single hidden layer of only 10 neurons, offers substantial advantages. Its smaller size translates to faster processing, reduced computational cost, and energy consumption, and importantly, facilitates straightforward implementation on a microcontroller. Furthermore, it is noteworthy that for capacitance value prediction, the smaller NN was trained using the optimized capacitance values derived from the larger simulation-trained NN described in [40]. This suggests that the smaller NN can be viewed as a result of data distillation from the original, more complex NN, effectively capturing the essential information for accurate capacitance prediction more efficiently.

4.3. Results on the Phase Dataset

Despite the challenges posed by noise, measurement errors within the dataset, and its limited size, the results obtained in this study are highly promising, strongly suggesting the practical utility of the proposed method in real-world WPT applications. The NN demonstrated a remarkable ability to generalize, evidenced by its excellent learning curve and consistently low prediction errors, even with the small dataset.
In more detail, the training and validation losses converged to approximately 0.02, while the mean absolute error (MAE) on both training and validation sets reached approximately 0.04 (Figure 20).
Finally, on the test dataset, the NN achieved a mean absolute error of just 1.65 %. Furthermore, a key strength of the proposed approach is the consistent reliability of its predictions: all predictions on the test set exhibited errors below 5 %, a crucial requirement for real-world control system implementations. This is because the frequency far away from the goal frequency produces a bigger phase angle, decreasing the power efficiency and current stress for the circuit. This level of accuracy ensures that the NN can be confidently integrated into a practical control loop. The detailed prediction results, showcasing this high level of performance, are presented in Figure 21. These findings highlight the potential of the proposed NN-based approach to significantly improve the performance and robustness of WPT systems in realistic operating environments.

5. Discussion

The results presented in this study highlight the significant potential of neural networks (NNs) in optimizing wireless power transfer (WPT) systems. The compact NN architecture developed for distance prediction and impedance matching demonstrates high accuracy and efficiency, making it suitable for real-time applications. The ability to predict inter-coil distance and optimal capacitance values with low error rates is a notable achievement, particularly given the complexity and nonlinearity inherent in WPT systems. One of the key advantages of the proposed NN architecture is its compactness, which facilitates potential deployment on microcontrollers. This is crucial for real-time operation, where computational efficiency and speed are paramount. The NN’s ability to generalize well, even with a relatively small dataset, further underscores its robustness and suitability for practical applications. The two-stage NN approach, which first predicts the inter-coil distance and then uses this information to determine optimal capacitance values, represents a significant improvement over direct capacitance prediction from impedance alone. This cascaded architecture not only enhances prediction accuracy but also provides explicit distance estimation, which is valuable for adaptive WPT systems that adjust coil separation to maximize power transfer efficiency. The NN’s performance on the phase dataset, despite the presence of noise and measurement errors, is particularly encouraging. The ability to predict the optimal frequency for minimizing the phase angle with errors consistently below 3% suggests that NNs can effectively replace or enhance traditional PI control methods. The significant reduction in the number of measurements required for frequency adjustment, from approximately 200 in conventional control systems to just 1 in the NN-based approach, offers a substantial advantage in terms of speed and computational efficiency. This makes real-time applications and enhanced WPT power efficiency achievable.

6. Conclusions

This study has demonstrated the efficacy of NNs for two critical aspects of WPT system optimization: distance prediction and phase angle minimization through frequency adjustment. A key contribution of this work lies in the development of a compact NN architecture for distance prediction, designed specifically for efficient computation and enhanced prediction accuracy. By minimizing the NN’s size, overfitting is mitigated, and unnecessary complexity is avoided, enabling potential deployment on a microcontroller. A compact NN structure was also successfully applied to predict the capacitance values required for optimal AIMN configurations. The high prediction accuracy achieved on both simulated and experimental datasets underscores the effectiveness of this approach. Furthermore, this study introduces a novel cascaded NN architecture, combining distance and capacitance prediction. The first NN predicts distance based on impedance values, while the second NN leverages the predicted distance and impedance values to determine the optimal capacitance settings for the AIMN. This cascaded approach not only improves system accuracy but also provides the added benefit of explicit distance estimation. A separate NN was developed to predict the optimal frequency for minimizing the phase angle. Despite the presence of noise and errors in the dataset, this NN achieved excellent results, with errors consistently below 3 % . This suggests that NNs can effectively replace or enhance traditional PI control methods for this task. Future studies on noise robustness can be conducted by adding noise to the simulated data and seeing how the accuracy varies with the noise threshold. Critically, the NN-based control offers significant advantages in terms of reduced computational cost and increased speed, requiring only a single measurement compared with the approximately 200 measurements typically needed for conventional control systems. This efficiency makes real-time applications and enhanced WPT power efficiency achievable. While this study primarily presents findings from offline neural network training and validation, the compact NN architectures (specifically designed with 10–20 neurons) were created for microcontroller deployment and future online adaptation. Given the low network complexity and noise tolerance demonstrated in simulations (MSE ≤ 0.199, tolerance to ±15 degrees phase errors), we anticipate similar performance to the offline validation results in real-time scenarios. Microcontroller-specific latency benchmarks and detailed online performance analysis will be included in future work once hardware integration is complete. The application of machine learning techniques to WPT systems, as demonstrated in this study, opens up new possibilities for WPT system automation. Illustrative examples include adaptive EV charging stations that optimize coil positioning for maximum efficiency and WPT systems capable of real-time impedance matching adjustments, even under varying load and misalignment conditions, through microcontroller-based capacitance control. These advancements pave the way for more intelligent and adaptable wireless power solutions.

Author Contributions

Conceptualization, L.S., D.M., F.C. and F.R.F.; methodology, L.S., D.M., F.C. and F.R.F.; validation, L.S., D.M., F.C. and F.R.F.; writing—original draft preparation, L.S., D.M., F.C. and F.R.F.; writing—review and editing, L.S., D.M., F.C. and F.R.F.; supervision, F.C and F.R.F. All authors have read and agreed to the published version of the manuscript.

Funding

This research received no external funding.

Institutional Review Board Statement

Not applicable.

Informed Consent Statement

Not applicable.

Data Availability Statement

The raw data supporting the conclusions of this article will be made available by the authors upon request.

Conflicts of Interest

The authors declare no conflicts of interest.

References

  1. Wu, Y.; Zhao, D.; Jiang, Y.; Li, Y.; Yu, X.; Wang, S.; Wu, M.; Wang, X.; Tang, Y. Precise Coil Inductance Prediction with Transfer Learning Improved Deep Neural Networks in WPT Systems. In Proceedings of the 2024 IEEE Energy Conversion Congress and Exposition (ECCE), Phoenix, AZ, USA, 20–24 October 2024; pp. 2092–2098. [Google Scholar]
  2. Allotta, B.; Pugi, L.; Reatti, A.; Corti, F. Wireless power recharge for underwater robotics. In Proceedings of the 2017 IEEE International Conference on Environment and Electrical Engineering and 2017 IEEE Industrial and Commercial Power Systems Europe (EEEIC/I&CPS Europe), Milan, Italy, 6–9 June 2017; pp. 1–6. [Google Scholar]
  3. Romano, D.; Angelo, L.D.; Kovacevic-Badstubner, I.; Grossner, U.; Parise, M.; Antonini, G. Efficient Partial Elements Computation for the Non-Orthogonal PEEC Method Including Conductive, Dielectrics, and Magnetic Materials. IEEE Trans. Magn. 2022, 58, 7000611. [Google Scholar] [CrossRef]
  4. Santoro, L.; Quercio, M.; Canova, A.; Sesana, R. Measuring thermal and electrical performances of additively manufactured magnetic shielding material: An active thermography approach. Nondestruct. Test. Eval. 2024, 39, 2692–2715. [Google Scholar] [CrossRef]
  5. Corti, F.; Bertolini, V.; Faba, A.; Cardelli, E.; Reatti, A. Design procedures for series-series wpt systems: A comparative analysis. Comput. Electr. Eng. 2024, 119, 109511. [Google Scholar] [CrossRef]
  6. Pugi, L.; Reatti, A.; Corti, F. Application of modal analysis methods to the design of wireless power transfer systems. Meccanica 2019, 54, 321–331. [Google Scholar] [CrossRef]
  7. Parise, M.; Quercio, M.; Laudani, A. Efficient Analytical Evaluation of Inductive Coupling Strength in Wireless Power Transfer Systems. IEEE Access 2024, 12, 143263–143271. [Google Scholar] [CrossRef]
  8. Lazzeroni, P.; Mariuzzo, I.; Quercio, M.; Repetto, M. Economic, Energy, and Environmental Analysis of PV with Battery Storage for Italian Households. Electronics 2021, 10, 146. [Google Scholar] [CrossRef]
  9. Canova, A.; Gruosso, G.; Quercio, M. Characterization of Electromagnetic Device by Means of Spice Models. Int. J. Emerg. Technol. Adv. Eng. 2021, 11, 12–22. [Google Scholar] [CrossRef]
  10. Parise, M.; Loreto, F. Quasi-Static Explicit Expression for the Flux Linkage Between Noncoplanar Coils in Wireless Power Transfer Systems Above a Lossy Ground. IEEE Trans. Electromagn. Compat. 2023, 65, 1857–1867. [Google Scholar] [CrossRef]
  11. Parise, M.; Loreto, F.; Romano, D.; Antonini, G.; Ekman, J. Accurate computation of mutual inductance of non coaxial pancake coils. Energies 2021, 14, 4907. [Google Scholar] [CrossRef]
  12. Parise, M.; Antonini, G.; Romano, D. On the Flux Linkage between Pancake Coils in Resonance-Type Wireless Power Transfer Systems. Int. J. Antennas Propag. 2020, 2020. [Google Scholar] [CrossRef]
  13. Canova, A.; Corti, F.; Laudani, A.; Lozito, G.M.; Quercio, M. Innovative shielding technique for wireless power transfer systems. IET Power Electron. 2023, 17, 962–969. [Google Scholar] [CrossRef]
  14. Canova, A.; Quercio, M. A Shielding System Proposal for the Cabling of Electric Glass Melters. IEEE Open J. Ind. Appl. 2023, 4, 1–10. [Google Scholar] [CrossRef]
  15. Alzahrani, A. Neural Networks Frequency Control for Static Wireless Power Transfer Systems. In Proceedings of the 2024 10th International Conference on Applied System Innovation (ICASI), Kyoto, Japan, 17–21 April 2024; pp. 122–124. [Google Scholar]
  16. Lozito, G.M.; Quercio, M.; Sabino, L.; Laudani, A. A Comparative Analysis on Different Deep Neural Network Models for Magnetic Hysteresis with Distorted Excitation Waveforms. In Proceedings of the 2024 International Conference on Electrical Machines (ICEM), Torino, Italy, 1–4 September 2024; pp. 1–6. [Google Scholar]
  17. Parise, M. On the Voltage Response of Homogeneous Earth Models in Central Loop Electromagnetic Sounding. Int. J. Antennas Propag. 2022, 2022. [Google Scholar] [CrossRef]
  18. Bertolini, V.; Corti, F.; Cardelli, E. Effects of Misalignment on Output Voltage Stability in SS Controlled Wireless Power Transfer Systems with Different Control Strategies. In Proceedings of the 2024 International Wireless Communications and Mobile Computing (IWCMC), Ayia Napa, Cyprus, 27–31 May 2024; pp. 1074–1079. [Google Scholar]
  19. Intravaia, M.; Becchi, L.; Bindi, M.; Corti, F.; Lozito, G.M.; Alfonso, C.G.; Luchetta, A.; Reatti, A. LCC-S Compensated Wireless Power Transfer: System Optimization Using Genetic Algorithms. In Proceedings of the 2024 International Conference on Electrical Machines (ICEM), Torino, Italy, 1–4 September 2024; pp. 1–7. [Google Scholar]
  20. Parise, M. Evaluation of the Inductive Coupling between Coplanar Concentric Coils in the Presence of the Ground. Int. J. Antennas Propag. 2024, 2024. [Google Scholar] [CrossRef]
  21. Quercio, M.; Lozito, G.M.; Corti, F.; Fulginei, F.R.; Laudani, A. Recent Results in Shielding Technologies for Wireless Electric Vehicle Charging Systems. IEEE Access 2024, 12, 16728–16740. [Google Scholar] [CrossRef]
  22. Intravaia, M.; Lozito, G.M.; Becchi, L.; Corti, F.; Luchetta, A.; Reatti, A. Failure Prevention Based on Principal Component Analysis and Machine Learning for Wireless Power Transfer Systems. In Proceedings of the 2024 IEEE 22nd Mediterranean Electrotechnical Conference (MELECON), Porto, Portugal, 25–27 June 2024; pp. 213–218. [Google Scholar]
  23. Quercio, M.; Galbusera, F.; Canova, A.; Demir, A.G.; Gruosso, G.; Previtali, B. Electromagnetic shielding properties of LPBF produced Fe2.9wt.%Si alloy. J. Phys. Energy 2023, 5, 045003. [Google Scholar] [CrossRef]
  24. Franco, F.L.; Ricco, M.; Cirimele, V.; Apicella, V.; Carambia, B.; Grandi, G. Electric Vehicle Charging Hub Power Forecasting: A Statistical and Machine Learning Based Approach. Energies 2023, 16, 2076. [Google Scholar] [CrossRef]
  25. Quercio, M.; Galbusera, F.; Posković, E.; Franchini, F.; Ferraris, L.; Canova, A.; Gruosso, G.; Demir, A.G.; Previtali, B. Characterization of LPBF Produced Fe2.9wt.%Si for Electromagnetic Actuator. IEEE Access 2023, 11, 134822–134833. [Google Scholar] [CrossRef]
  26. Palermo, M.; Forconi, F.; Belloni, E.; Quercio, M.; Lozito, G.M.; Fulginei, F.R. Optimization of a feedforward neural network’s architecture for an HVAC system problem. In Proceedings of the 2023 3rd International Conference on Electrical, Computer, Communications and Mechatronics Engineering (ICECCME), Tenerife, Canary Islands, Spain, 19–21 July 2023; pp. 1–6. [Google Scholar]
  27. Parise, M.; Tamburrelli, V.; Antonini, G. Mutual impedance of thin-wire circular loops in near-surface applications. IEEE Trans. Electromagn. Compat. 2019, 61, 558–563. [Google Scholar] [CrossRef]
  28. Parise, M.; Antonini, G.; Di Paola, L. A Rigorous Explicit Expression for the Mutual Inductance of Two Co-Axial Thin-Wire Coil Antennas Placed above a Layered Ground. Energies 2023, 16, 7586. [Google Scholar] [CrossRef]
  29. Canova, A.; Giaccone, L.; Quercio, M. A proposal for performance evaluation of low frequency shielding efficiency. In Proceedings of the CIRED 2021—The 26th International Conference and Exhibition on Electricity Distribution, Online, 20–23 September 2021; Volume 2021, pp. 935–939. [Google Scholar]
  30. Quercio, M.; Campanelli, F.; Canova, A. Passive loop optimisation for HV Joint zone. In Proceedings of the IEEE EUROCON 2023—20th International Conference on Smart Technologies, Torino, Italy, 6–8 July 2023; pp. 343–348. [Google Scholar]
  31. Stella, M.; Faba, A.; Fulginei, F.R.; Quercio, M.; Scorretti, R.; Bertolini, V.; Sabino, L.; Tiismus, H.; Kallaste, A.; Cardelli, E. Experimental measurements and numerical modelling of additively manufactured Fe-Si cores. J. Magn. Magn. Mater. 2024, 591, 171752. [Google Scholar] [CrossRef]
  32. Santoro, L.; Sesana, R.; Diller, J.; Radlbeck, C.; Mensinger, M. Dissipative and thermal aspects in cyclic loading of additive manufactured AISI 316L. Eng. Fail. Anal. 2024, 163, 108446. [Google Scholar] [CrossRef]
  33. Santoro, L.; Razza, V.; Maddis, M.D. Nugget and corona bond size measurement through active thermography and transfer learning model. Int. J. Adv. Manuf. Technol. 2024, 133, 5883–5896. [Google Scholar] [CrossRef]
  34. Quercio, M.; del Pino Lopez, J.C.; Grasso, S.; Canova, A. Numerical and experimental analysis of thermal behaviour of high voltage power cable in unfilled ducts. Sci. Rep. 2024, 14, 20599. [Google Scholar] [CrossRef]
  35. Quercio, M.; Barlassina, L.; Canova, A. Characterization of the shielding properties of a power transformer enclosure. In Proceedings of the IEEE EUROCON 2023—20th International Conference on Smart Technologies, Torino, Italy, 6–8 July 2023; pp. 349–353. [Google Scholar]
  36. Laudani, A.; Fulginei, F.R.; Palermo, M.; Quercio, M.; Corti, F.; Lozito, G.M. On the Identification of One diode PV model by reduced forms and different metrics. In Proceedings of the 2023 3rd International Conference on Electrical, Computer, Communications and Mechatronics Engineering (ICECCME), Tenerife, Canary Islands, Spain, 19–21 July 2023; pp. 1–7. [Google Scholar]
  37. Asghar, R.; Fulginei, F.R.; Quercio, M.; Mahrouch, A. Artificial Neural Networks for Photovoltaic Power Forecasting: A Review of Five Promising Models. IEEE Access 2024, 12, 90461–90485. [Google Scholar] [CrossRef]
  38. Risi, B.G.; Riganti-Fulginei, F.; Laudani, A.; Quercio, M. Compensation Admittance Load Flow: A Computational Tool for the Sustainability of the Electrical Grid. Sustainability 2023, 15, 14427. [Google Scholar] [CrossRef]
  39. Yue, K.; Liu, Y.; Zhang, X.; He, R.; Fu, M. Identifying Complete Set of Parameters Using Transmitter Side Information for Multi-transmitter Wireless Power Transfer Systems. In Proceedings of the 2022 IEEE Applied Power Electronics Conference and Exposition (APEC), Houston, TX, USA, 20–24 March 2022; pp. 1128–1132. [Google Scholar]
  40. Lopera, J.R.; Fischbacher, R.; Pestros, R.; Pommerenke, D.; Auinger, B.; Grosinger, J. Adaptive NFC WPT System Implementing Neural Network-Based Impedance Matching with Bypass Functionality. In Proceedings of the 2023 IEEE/MTT-S International Microwave Symposium—IMS 2023, San Diego, CA, USA, 11–16 June 2023; pp. 879–882. [Google Scholar] [CrossRef]
  41. Romero Lopera, J.; Grosinger, J. S-Parameter Measurements of an AI-Enhanced Adaptive Wireless Power Transfer System. IEEE Dataport 2023. [Google Scholar] [CrossRef]
  42. Martínez, A.; González, C.; Jaramillo, A.; Cárdenas, D.; Chong, A.V. Low-cost, microcontroller-based phase shift measurement system for a wireless power transfer prototype. HardwareX 2022, 11, e00311. [Google Scholar] [CrossRef]
  43. Martínez, A.; González, C.; Jaramillo, A.; Cárdenas, D.; Chong, A.V. Experimental data validating the optimization of a wireless power transfer prototype employing a novel phase shift measurement system and frequency control. Data Brief 2022, 45, 108675. [Google Scholar] [CrossRef]
Figure 1. Circuit diagram of the WPT system.
Applsci 15 06351 g001
Figure 2. Circuit of the AIMN proposed in [40]. The circuit is composed by three cascaded L-type lowpass stages in a series–series configuration with variable capacitances to allow the dynamic impedance matching.
Applsci 15 06351 g002
Figure 3. Real part of impedance parameter with distance between the two coils, measured in case 1, for no misalignment between the two coils: ( Δ x ) , ( Δ y ) , and ( θ ) are zero. These measurements are taken for the WPT–NFC system from the side of the transmitter coil, before the impedance matching performed by the AIMN.
Applsci 15 06351 g003
Figure 4. Imaginary part of impedance parameter with distance between the two coils, measured in the case 1, for no-misalignment between the two coils: ( Δ x ) , ( Δ y ) and ( θ ) are zero. These measurements are taken for the WPT–NFC system from the side of the transmitter coil, before the impedance matching performed by the AIMN.
Applsci 15 06351 g004
Figure 5. Reflection scattering parameter, port1–port1 measured from the transmitter side. Measurements are shown for different values of the distance between the two WPT coils, in the case 1 configurations, with ( Δ x ) , ( Δ y ) , and ( θ ) equal to zero. These values are measured before the AIMN intervention for impedance matching.
Applsci 15 06351 g005
Figure 6. Transmission scattering parameter, port2–port1 measured from the transmitter side of the WPT system. Measurements are shown for different values of the distance between the two WPT coils, in the case 1 configurations, with ( Δ x ) , ( Δ y ) , and ( θ ) equal to zero. These values are measured before the AIMN intervention for impedance matching.
Applsci 15 06351 g006
Figure 7. Real part of impedance parameter with distance between the two coils, measured in case 1, for no misalignment between the two coils: ( Δ x ) , ( Δ y ) , and ( θ ) are zero. Measurements shown are taken from the transmitter side of the WPT–NFC system after the intervention of the AIMN for the impedance adaptation, which tried to adapt the impedance to 60 Ohm.
Applsci 15 06351 g007
Figure 8. Imaginary part of impedance parameter with distance between the two coils, measured in case 1, for no misalignment between the two coils: ( Δ x ) , ( Δ y ) , and ( θ ) are zero. Measurements shown are taken from the transmitter side of the WPT–NFC system after the intervention of the AIMN for the impedance adaptation, which tried to minimize the imaginary part of the impedance.
Applsci 15 06351 g008
Figure 9. Data measured at fixed load condition of R = 100 Ω , for three different distance coil conditions, with z 0 0, 4 and 8 mm. Data regularization is needed due to measurement error.
Applsci 15 06351 g009
Figure 10. Data measured at a fixed coil distance of z 0 = 4 mm for six different load conditions. Data regularization is needed due to measurement error.
Applsci 15 06351 g010
Figure 11. Training of the NN to predict the distance value from the scattering parameters for the configuration 20: θ = 0 , Δ x = 20 mm, Δ y = 15 mm. Output and prediction values of the distance. The plot seems random because, for more generalizability, the input and output data were randomized and fed to random order to the NN.
Applsci 15 06351 g011
Figure 12. Training of the NN to predict the distance value from the scattering parameters for the configuration 210: θ = 60 deg, Δ x = 30 mm, Δ y = 20 mm. Output and prediction values of the distance. The plot seems random because, for more generalizability, the input and output data were randomized and fed to random order to the NN.
Applsci 15 06351 g012
Figure 13. Predicted and original values of the distance from the impedance parameters. This test is performed on configuration 2, with Δ x = 20 mm and Δ y = 20 mm. The NN reaches an MSE of 0.03.
Applsci 15 06351 g013
Figure 14. Prediction of the capacitance value C 1 from the impedance parameters. Test performed on case 1, with Δ x = 0 mm and Δ y = 0 mm. The MSE on the test set is 0.31.
Applsci 15 06351 g014
Figure 15. Prediction of the capacitance value C 2 from the impedance parameters. Test performed on case 1, with Δ x = 0 mm and Δ y = 0 mm. The MSE on the test set is 0.31.
Applsci 15 06351 g015
Figure 16. Prediction of the capacitance value C 3 from the impedance parameters. Test performed on case 1, with Δ x = 0 mm and Δ y = 0 mm. The MSE on the test set is 0.31.
Applsci 15 06351 g016
Figure 17. Prediction of the capacitance value C 1 compared with original ones. The error is very low, with an MSE = 0.18. The output of the neural network was the capacitance value; the inputs were the impedance value and the distance between two coils of the WPT system.
Applsci 15 06351 g017
Figure 18. Prediction of the capacitance value C 2 compared with original ones. The error is very low, with a MSE = 0.18. The output of the neural network was the capacitance value; the inputs were the impedance value and the distance between two coils of the WPT system.
Applsci 15 06351 g018
Figure 19. Prediction of the capacitance value C 3 compared with original ones. The error is very low, with an MSE = 0.18. The output of the neural network was the capacitance value; the inputs were the impedance value and the distance between two coils of the WPT system.
Applsci 15 06351 g019
Figure 20. Training history of the NN for the prediction of the best frequency that minimizes the phase.
Applsci 15 06351 g020
Figure 21. Prediction results of the frequency in red, in blue the measured original results. Near each point, there is the relative error reported.
Applsci 15 06351 g021
Table 1. Neural network parameter summary. This table presents the key parameters employed in the experimental setups, facilitating reproducibility. Due to variations in implementation (MATLAB R2024b for Experiment 1; Python 3.11.11 for Experiment 2) and iterative model refinement, precise replication of all simulation results may be challenging. However, the listed parameters represent the foundational configurations. Experiment 1 utilized the trainlm optimizer, a backpropagation algorithm employing the Levenberg–Marquardt method. f g o a l denotes the frequency at which the phase response falls below 5 degrees.
NN ParametersdCC from dFrequency–Phase
INPUT dataS or ZS or ZS or Z and dphase(0), f(0), R, z 0
OUTPUT dataDistanceCapacitanceCapacitance f g o a l
Dataset size57575718
Layers1222
Neurons1010, 1010, 1020, 10
Epochs10010001000500
OptimizertrainlmtrainlmtrainlmADAM
Activation functionsigmoidsigmoidsigmoidReLU
Metrics and lossMSEMSEMSEMSE and MAE
Learning rate0.10.050.10.001
Goal3 × 10−52 × 10−72 × 10−70
Min grad1 × 10−71 × 10−71 × 10−7Not specified
Batch sizeNot usedNot usedNot used4
ValidationNot usedNot usedNot used0.2
Disclaimer/Publisher’s Note: The statements, opinions and data contained in all publications are solely those of the individual author(s) and contributor(s) and not of MDPI and/or the editor(s). MDPI and/or the editor(s) disclaim responsibility for any injury to people or property resulting from any ideas, methods, instructions or products referred to in the content.

