1. Introduction
Table tennis is a complex sport, categorized within the family of racket sports and more specifically as a net game, according to the definition provided by
Hughes & Bartlett [
1]. In this sport, players need to manage multiple factors to perform well, just like in other racket sports [
2]. Different performance indicators rely on biomechanical, technical, or even tactical skills. Tactical skills involve mastering a wide variety of strokes and using them at the right moment to take over an opponent.
What makes those shots unique is the ability of a player to put spin on the ball during a short time of contact between the racket and the ball. Mastering this brief period of contact to induce spin is crucial to fully using different strokes to win a point, especially as spin is one of the key performance indicators of a player, along with placement, ball speed, technique, and precision [
3]. Therefore, it is crucial to measure performance. Spin has been largely studied from a fluid mechanics perspective [
4,
5,
6,
7,
8], which has mainly observed the influence of rotation on a ball’s trajectory or determined the complex physics behind the flying time of the ball. However, spin measurement is difficult to perform under real match conditions because the ball’s linear speed is high, as is the rotation (around 127 RPS for high spin) [
9]. Spin measurement techniques are various and could use the racket combined with inertial measurement units to estimate ball kinetic parameters [
10]. However, the main measurement system is still computer vision, which is based on image sensor technologies such as CCD (Charge Coupled Device) and nowadays mostly CMOS (Complementary Metal Oxide Semiconductor) sensors. Many studies use high-speed cameras or motion capture cameras with reflective markers and image-processing algorithms to estimate spin with pixel displacement [
11,
12,
13,
14].
A common misconception among table tennis practitioners posits that players can control ball speed and rotation independently. This study aims to address this issue by introducing a different methodology for measuring spin, which is determined by observing light reflection on the surface of the balls. This is realized using a montage of a low-level component inside image sensors: a photodiode. The primary objective of this research is to establish a correlation between the linear speed of the ball and its spin through experimental testing in controlled conditions. Additionally, we hypothesize that the type of stroke and the incoming type of ball don’t influence the ratio between the ball’s rotation and linear speed.
2. Materials and Methods
2.1. Linear Speed Measurement
To measure the ball’s linear speed (m.s
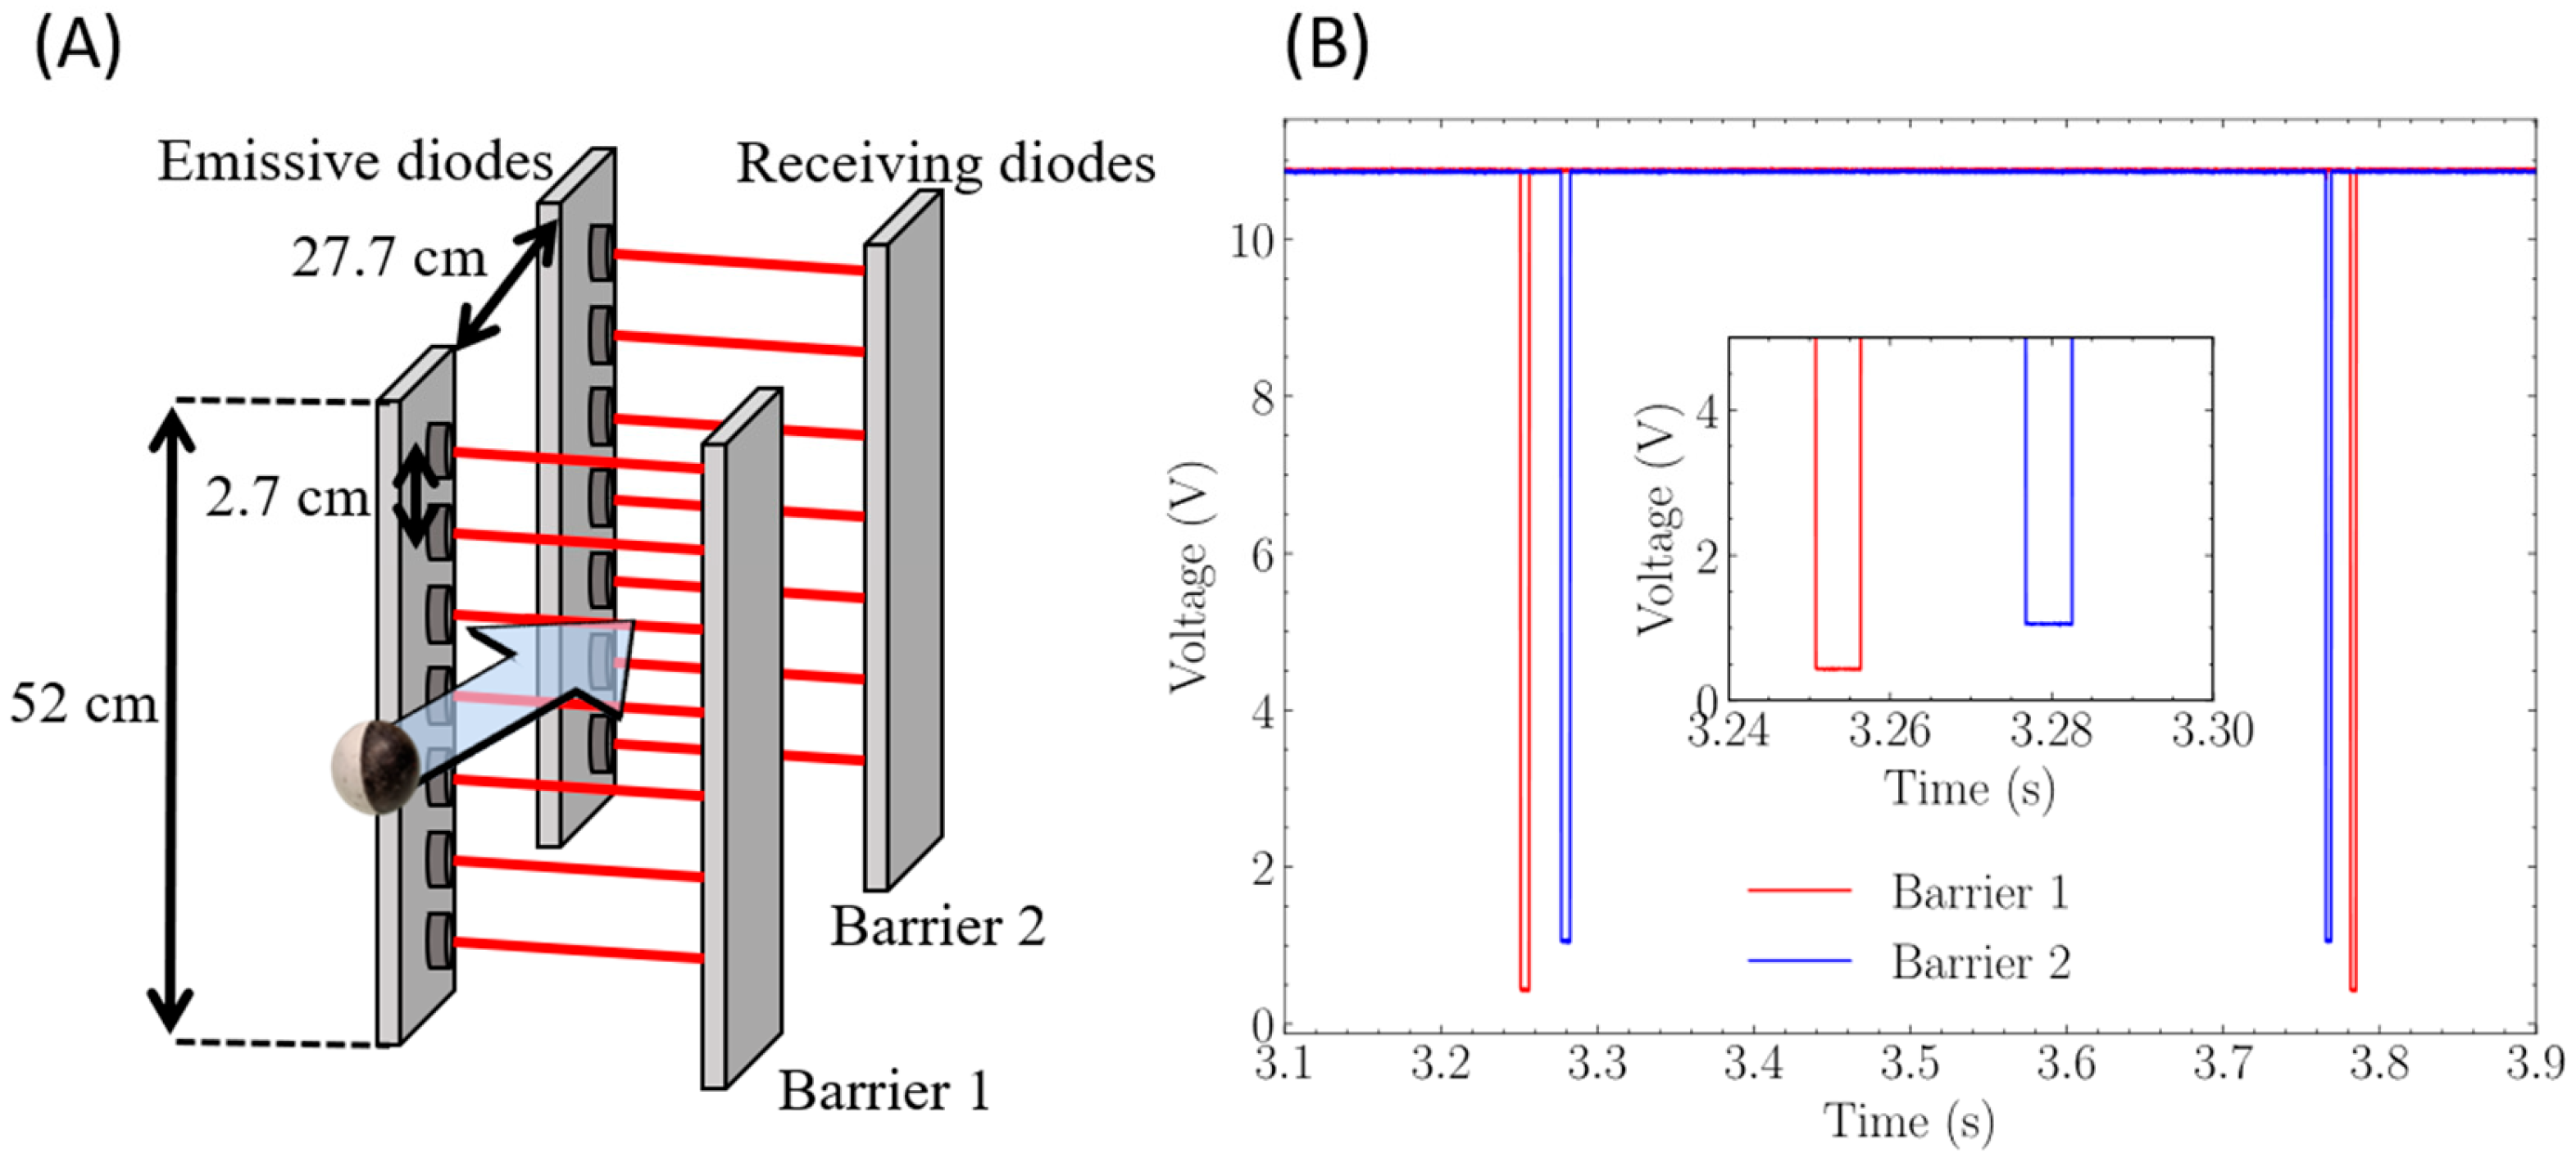
−1), we developed a laser diode barrier composed of an emission barrier and a reception barrier to detect the passage of a table tennis ball. The system and the acquisition signals are visible in
Figure 1. It consists of two measurements, the first capturing the entry of the ball into the field of vision around the net and the second capturing the exit (
Figure 1A). Each laser diode is vertically spaced 27 mm apart so that the ball always crosses at least one beam, as the ball diameter is 40 mm. The speed barrier was placed on either side of the net at around ten centimeters from the table.
The linear speed of the object can be computed by calculating the distance between the falling edges recorded (
Figure 1B). The ball crosses the first ray (red falling edge), then the second ray (blue falling edge), finally, the player can hit the ball and make it come back in the opposite order (blue then red). The signals are shown in
Figure 1B. The obtained speed value is affected by the incident angle of the ball when crossing the barriers.
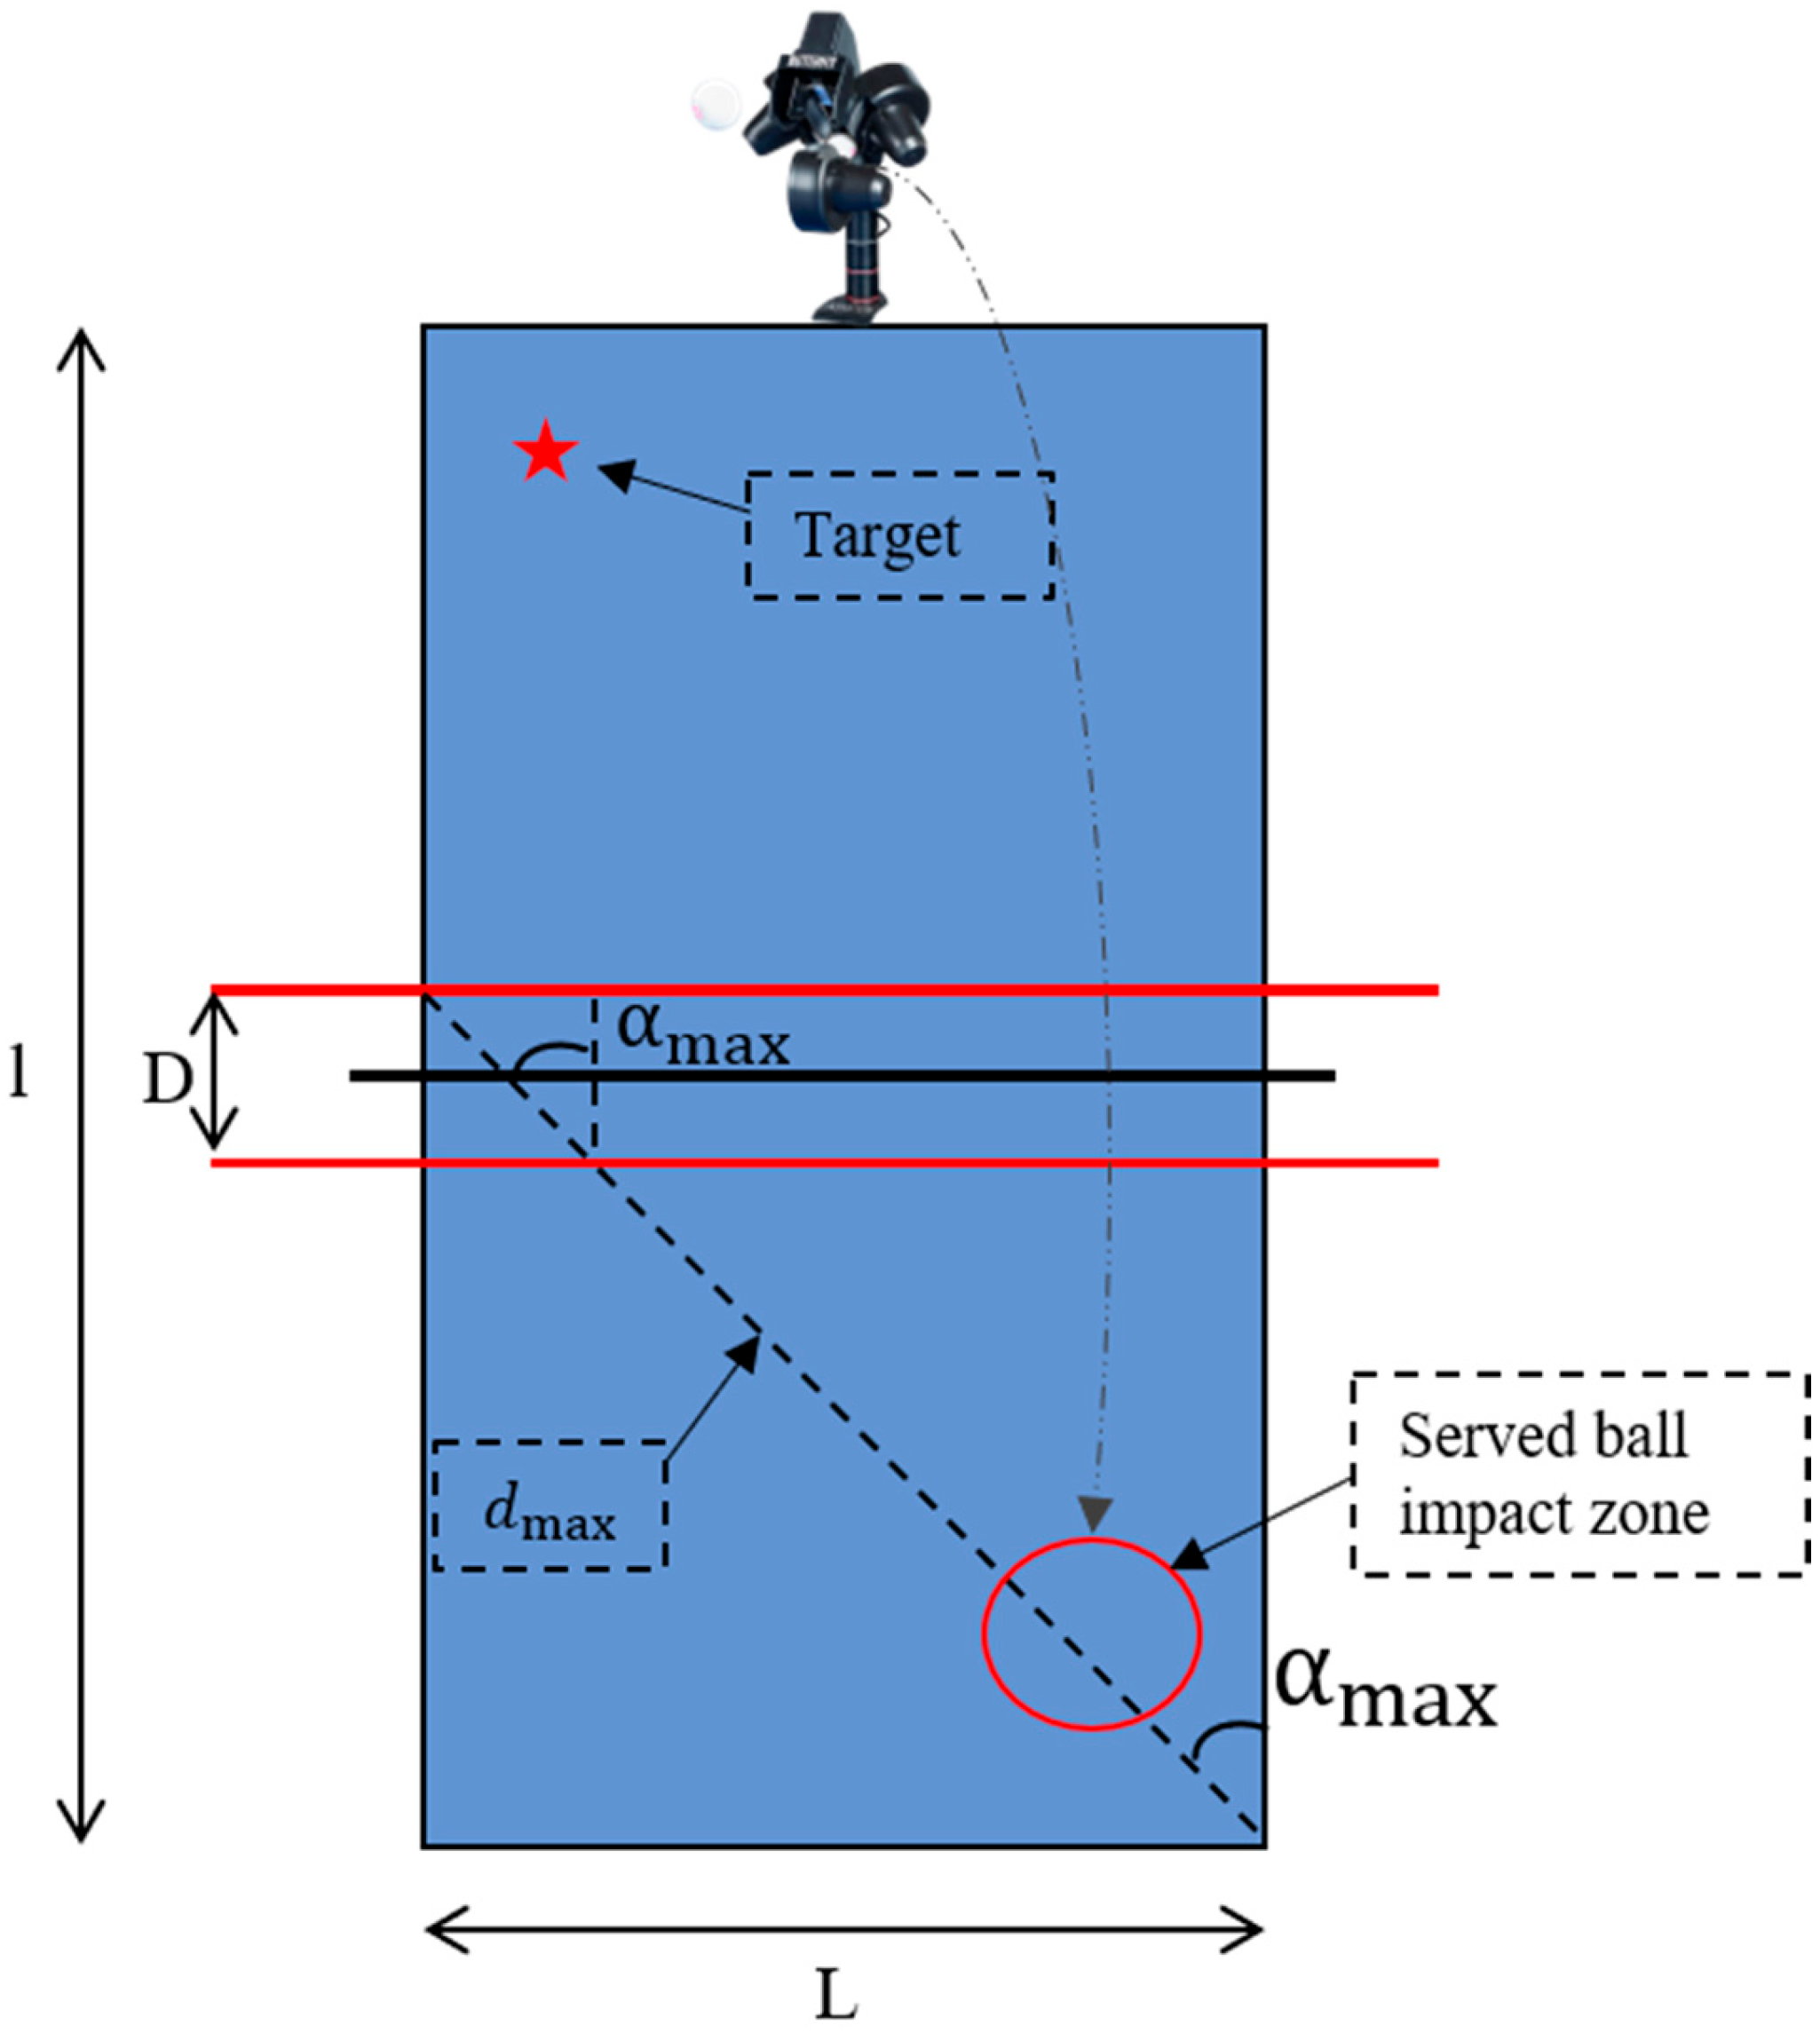
The maximum possible linear speed measurement error with our player, ball, and target placement constraints (given in
Figure 2) gives us a maximum angle defined as (1). The relative error can be computed using (2).
The maximum relative error for is 33%. The relative error was estimated for a realistic angle corresponding to the hit angle from the players (e.g., for a measurement of an angle error of 30°, there is a 2.74 m.s−1 variation of speed measurement).
2.2. Ball Spin Measurement
We also developed a rotation meter for spin measurement (rad/s), an optical system based on a patent of Shaw et al. [
15], which is shown in
Figure 3A, and an inner view in
Figure 3B. This system was originally designed to observe the periodic light reflection effect produced by an insect’s wings. This effect was identified as a discriminant factor for insect classification, called the frequency of wing beat [
16,
17]. Although this approach may not be novel, it appears effective for frequency determination in our case study. This rotation meter has been duplicated to cover both parts of the table, so we had information on rotation before and after the net.
Based on a large photodiode (model
S1227 from
Hamamatsu) as a receiver (
Figure 3B), we observed the scattered light reflected from spinning balls (
Figure 3C). We used a slightly modified version of Shaw et al.’s [
15] system by using 2 external white LEDs from High-Speed Vision (40 W/80,000 lux) instead of an internal light source to illuminate the area of interest. In addition, bicolored balls (black and white) were used to accentuate the light reflection on the spinning surface, as the simple brand of the ball was not sufficient by itself (white/black balls are used). The balls were 3 stars NITTAKU NSD 40 +.
This creates a controlled environment to measure ball rotation, especially to limit the effect of natural light or insufficient switching rotation between black-and-white patterns. We added a stretched black sheet on the background to accentuate the light contrast between the black-and-white patterns of the ball.
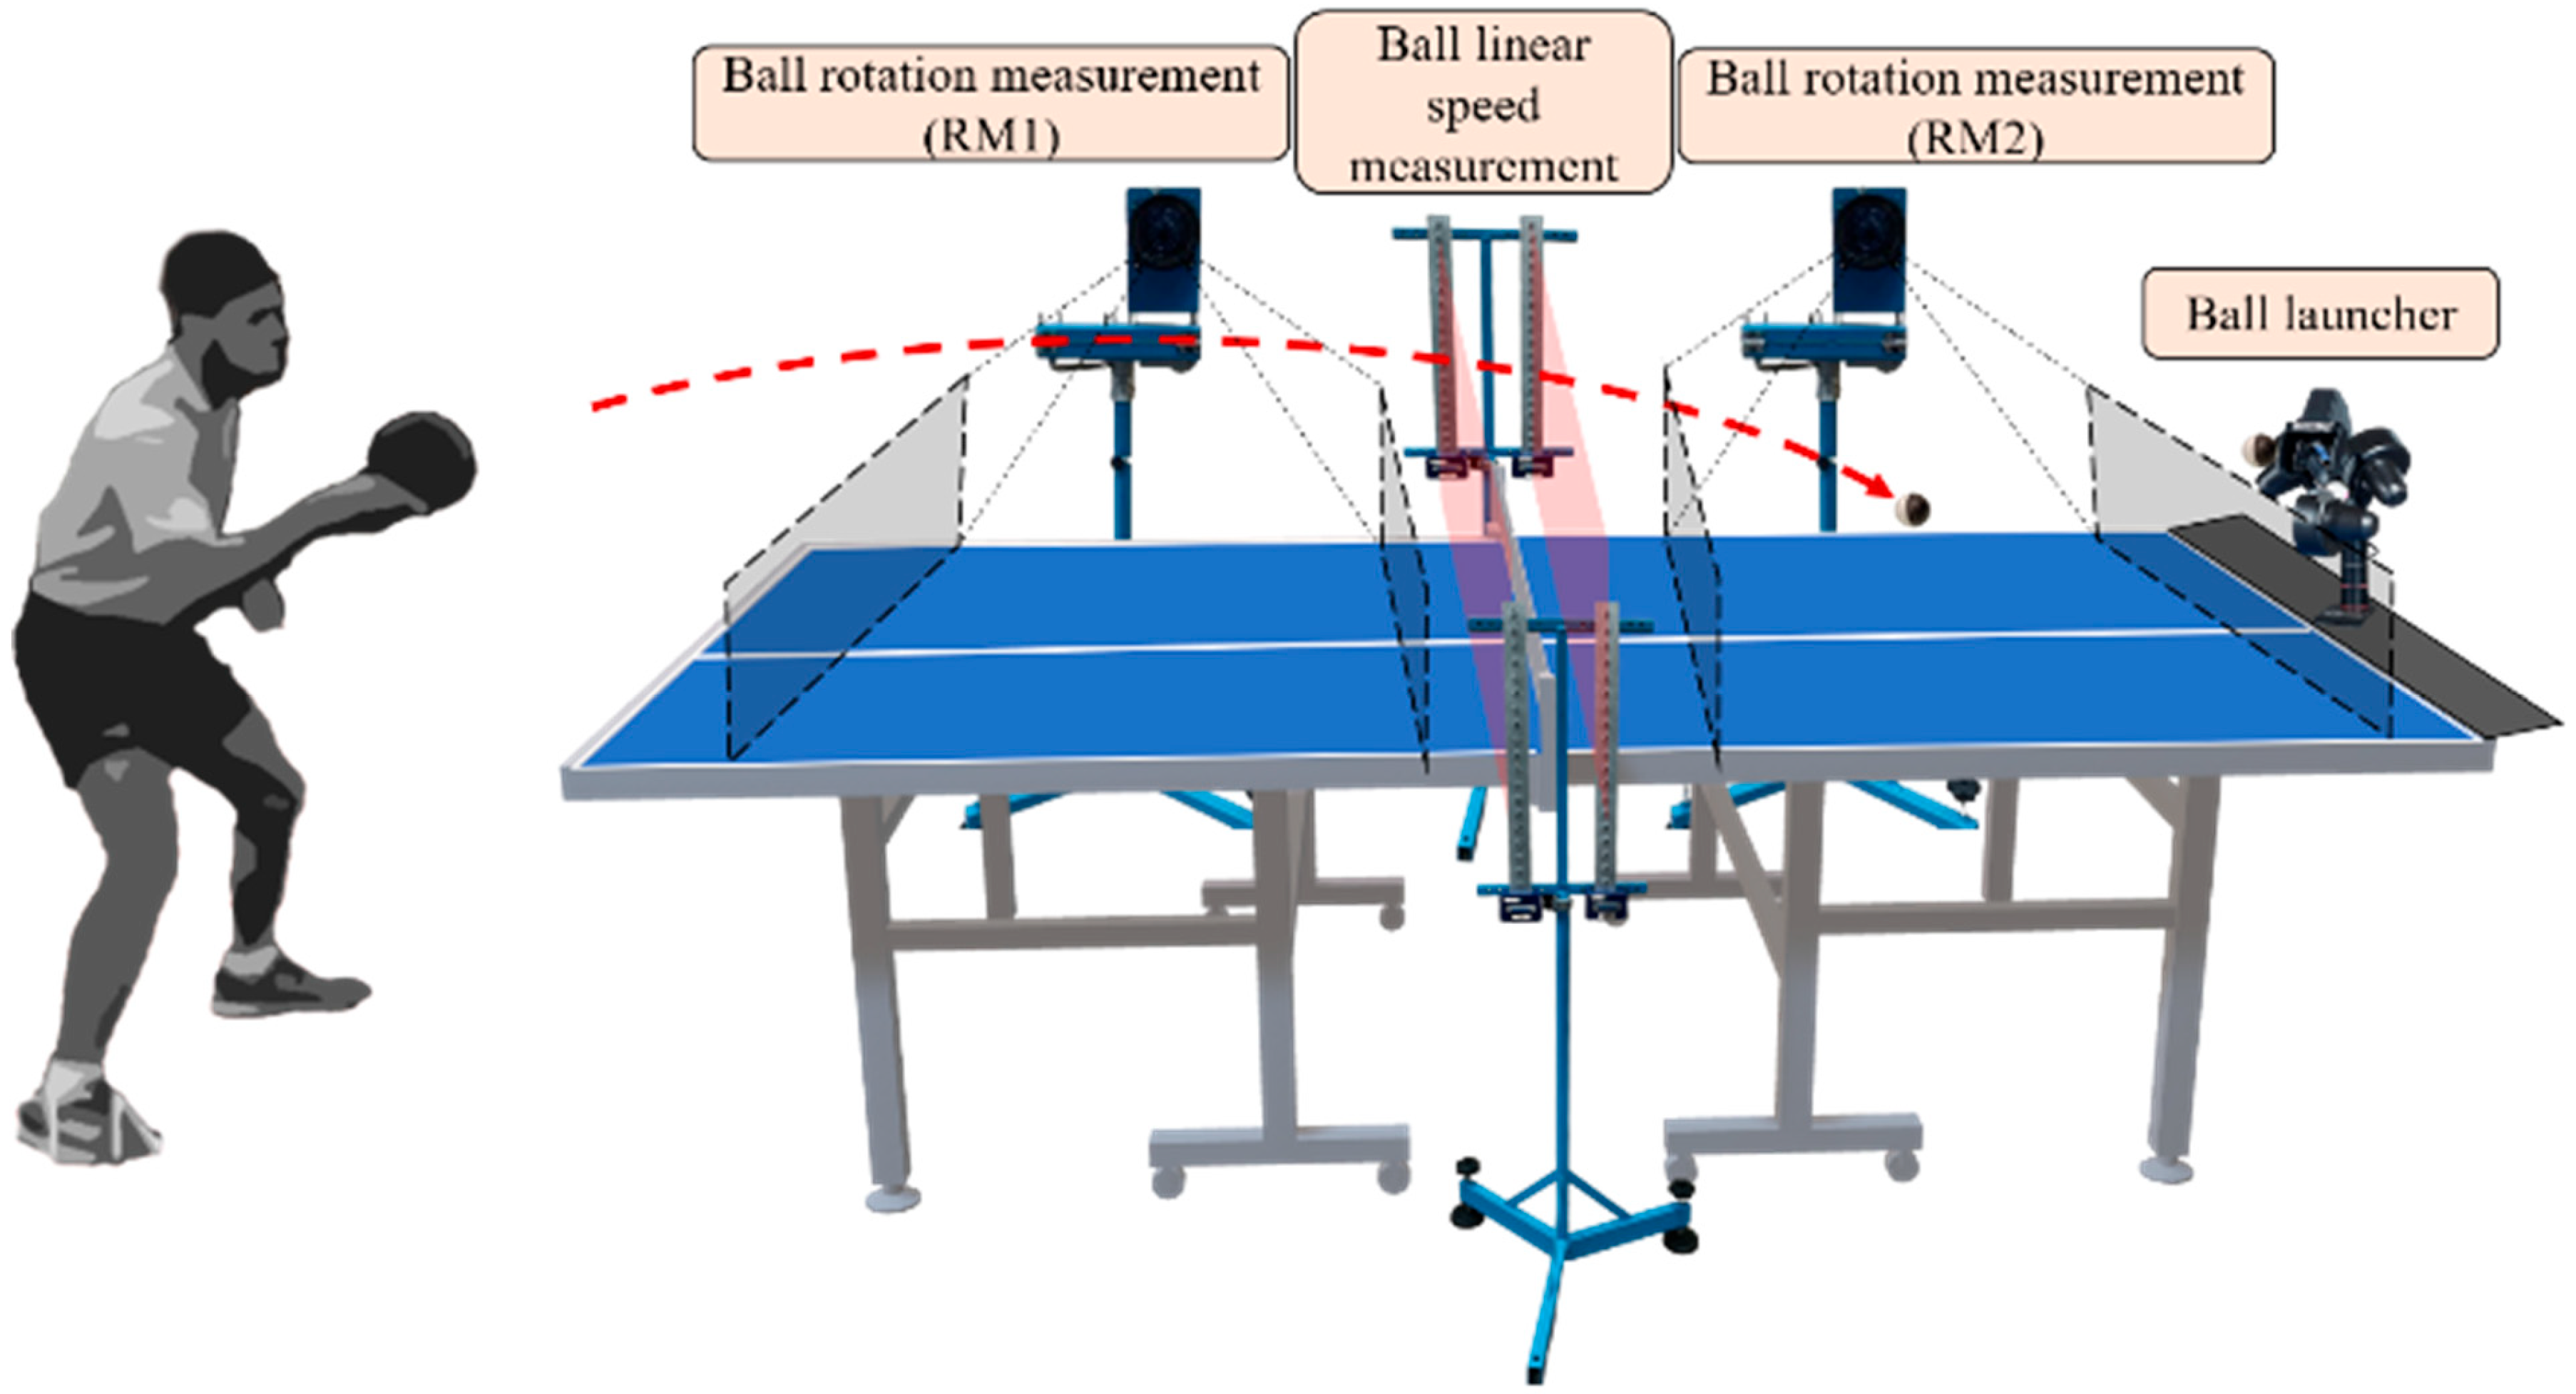
Both rotation meters were placed 3 m to the side table. The area of interest was defined by adjusting optical parameters and covers the first half of the table. The field of view height is set at approximately 15 cm, corresponding to the net height, to maximize signal strength in the area of interest. The position of all measurement systems is given in
Figure 4.
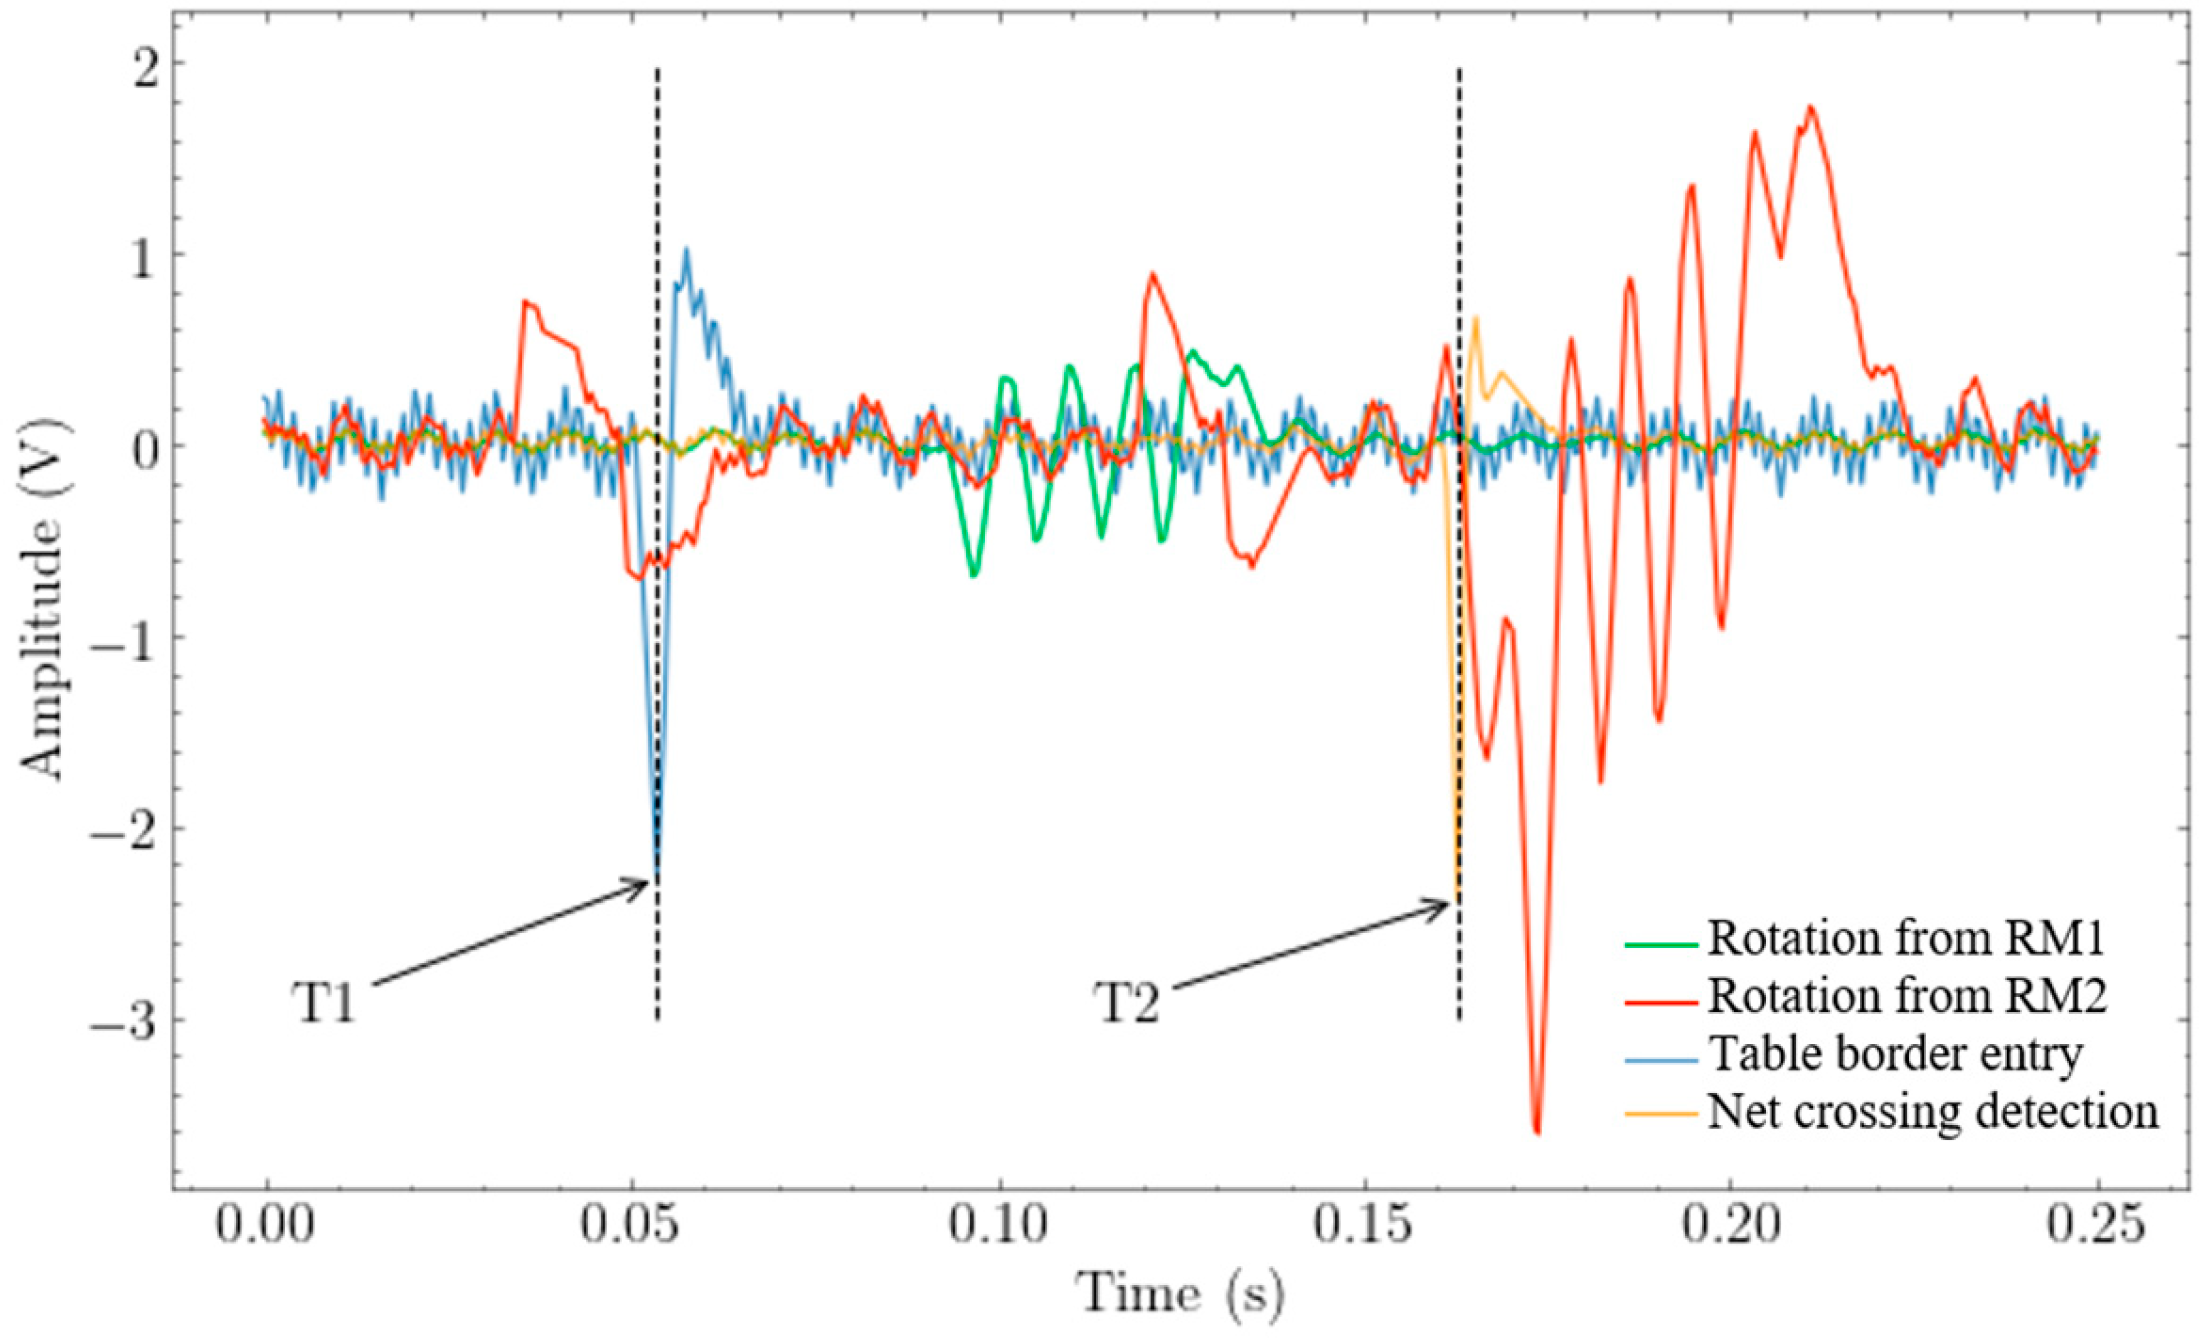
Rotation meter 1 (RM1) was assigned to the half-table on the player’s side, and RM2 to the opposite half-table (on the ball launcher’s side). A complete example of the signals of the rotation measurement system and their chronology is presented in
Figure 5.
Time markers T1 and T2 indicate the entry and exit of the ball on the player-side half-table, respectively. The green signal is the rotation measured before the ball crosses the net between T1 and T2. The red signal is the rotation measured after the net has been crossed on the opponent’s half-table. This configuration enables the observation of the ball’s kinetic parameters at one specific point of its trajectory.
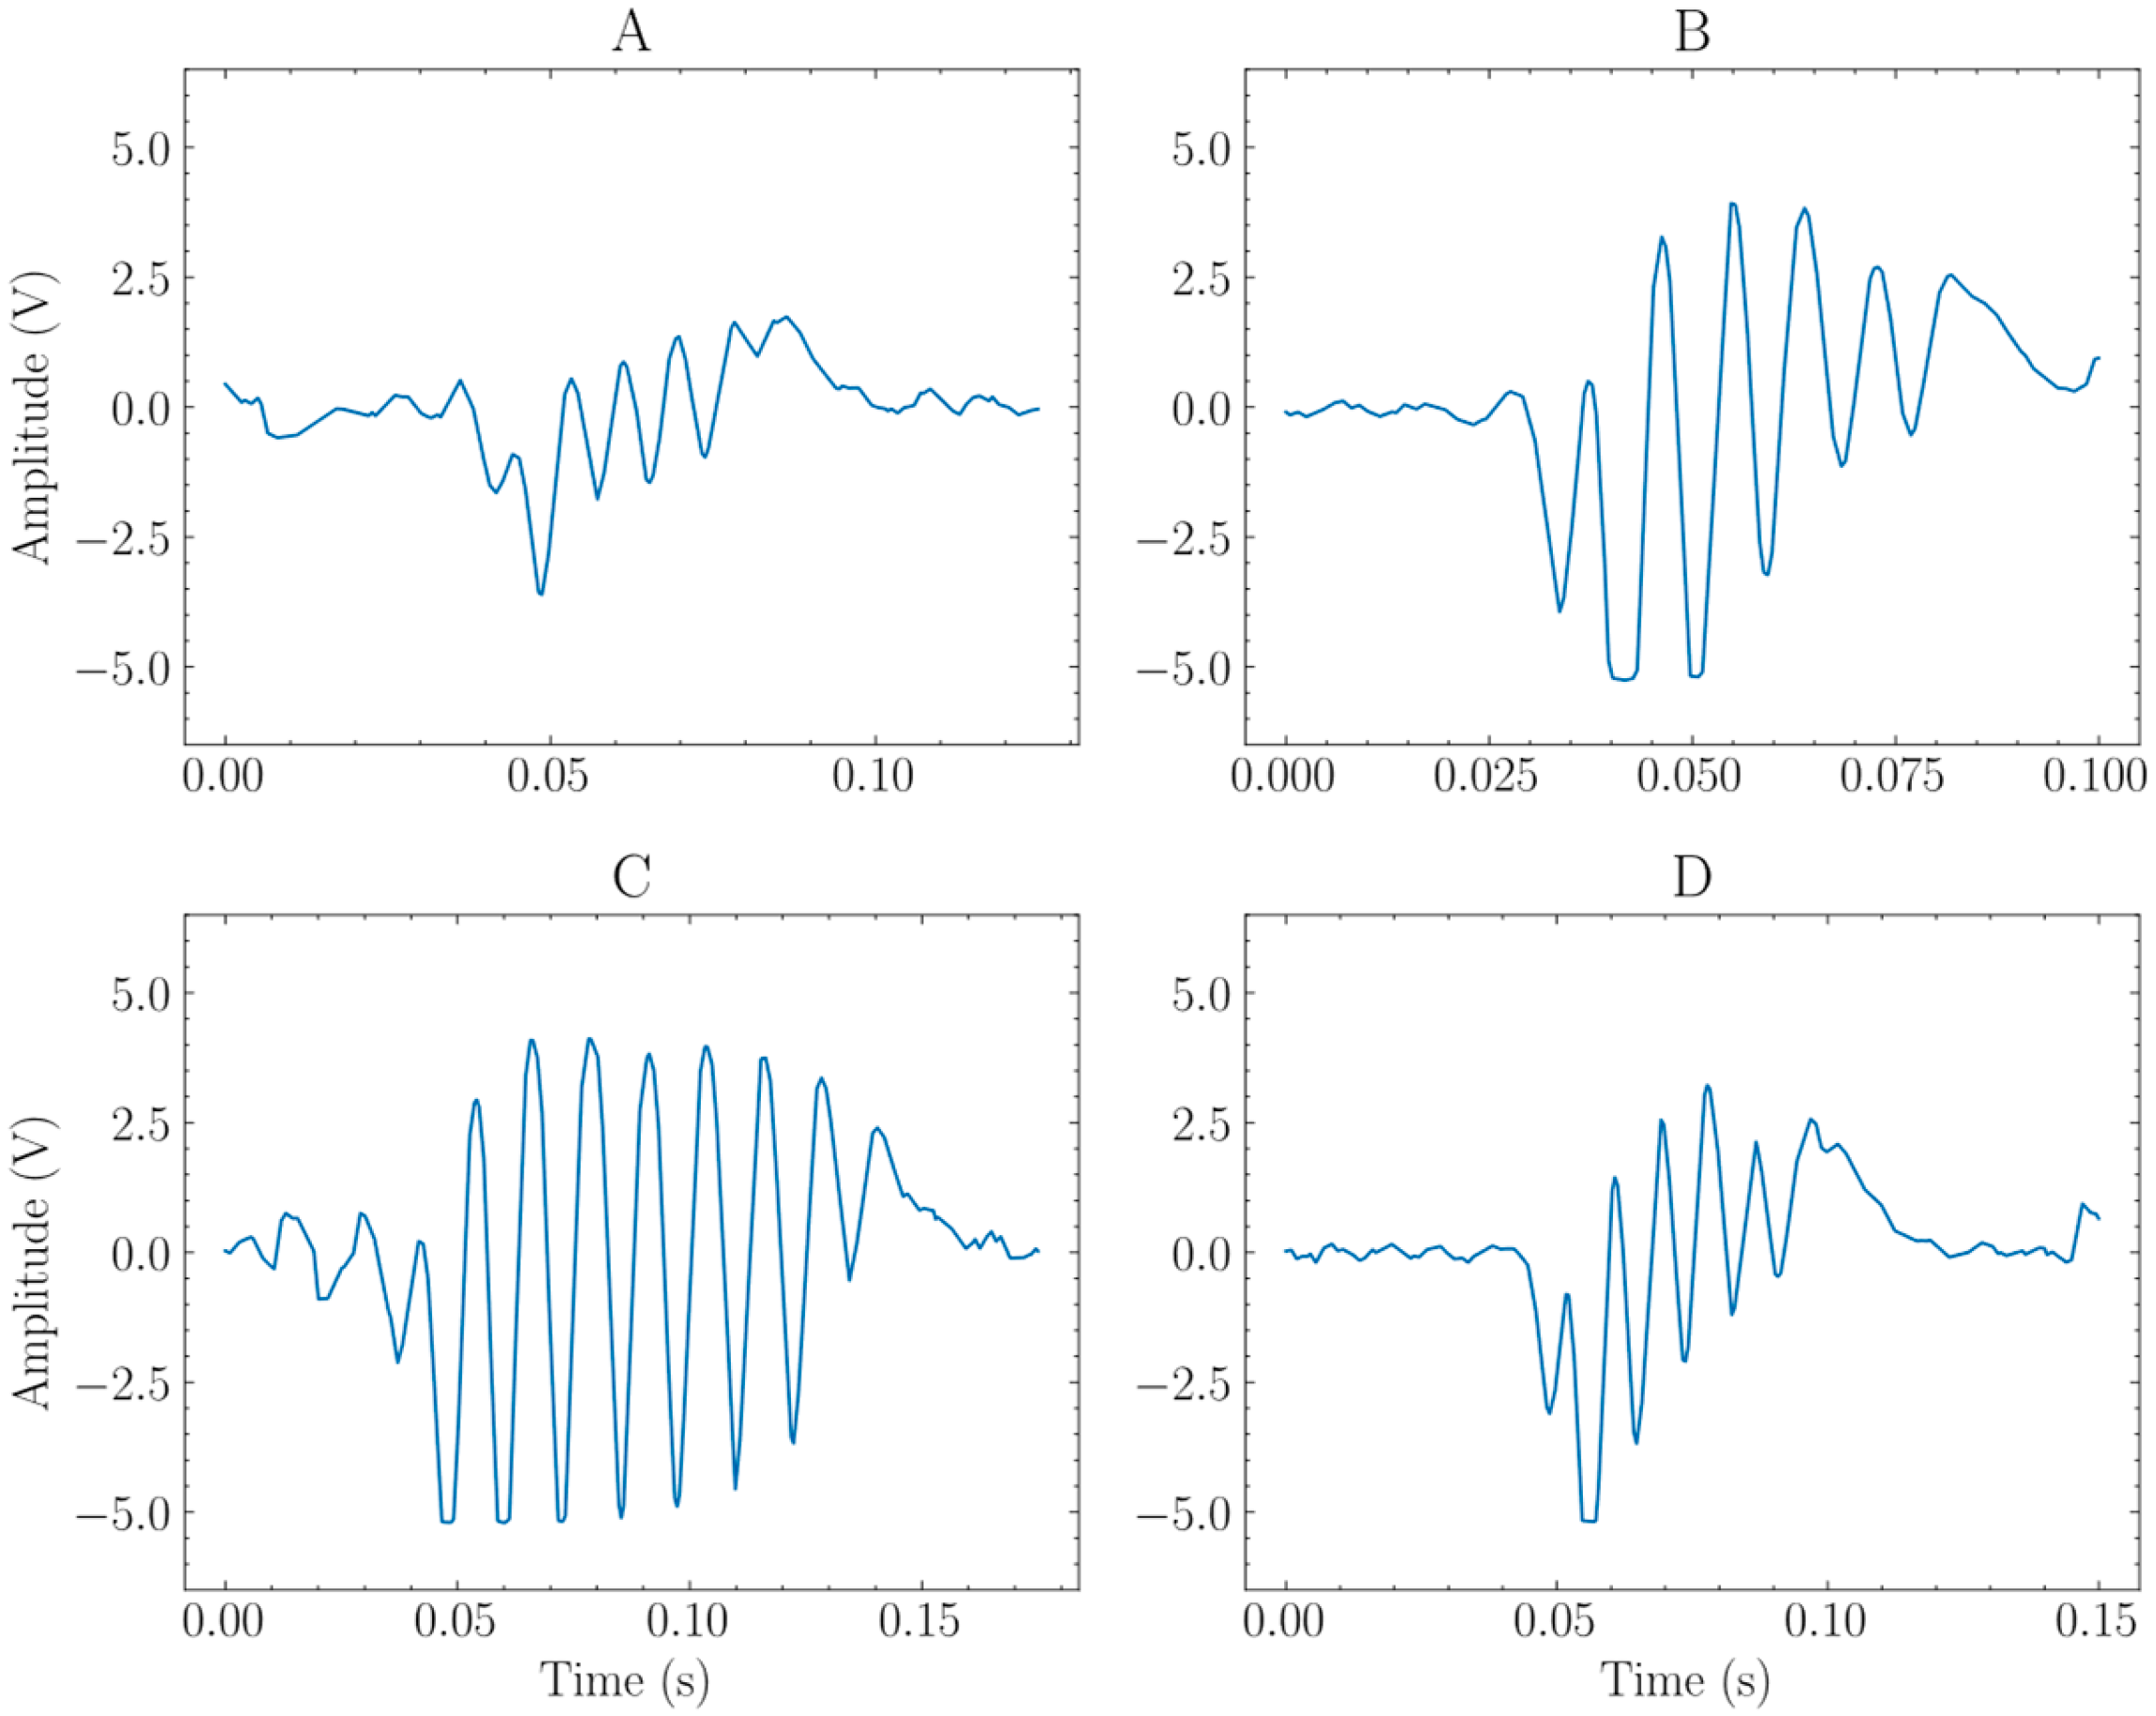
Rotation signals over time are similar to a sine wave due to the alternate light reflection over the black and white surfaces; some of them are shown in
Figure 6. We choose to use the rotation after the net because it is more representative of a ball that the player will have to return. (
Figure 6B–D), especially because it is just before bouncing.
It is possible to retrieve the ball’s spin in the time domain by determining the inverse of the oscillation period between two consecutive spikes, but also in the frequency domain using the numerical Welch power spectrum density (PSD) [
18]. The light-reflected signal is assumed to be stationary and of length
N. The length varies between 200 and 500 sample data points recorded at a 2 kHz sampling rate. The signal is divided into segments of duration ~
with 50% overlapping. Segments are defined as follows:
with
K as the number of segments. The selected window is the flat top cosine [
19] and will be defined as
For each segment, the estimated PSD is given by (3):
with
as the periodogram,
as the segment of the signal,
the window and
f the frequency. The Welch PSD estimation is the average over the
K segments. The frequency we want to retrieve is the maximum power peak on the spectrum.
2.3. Spin Error Estimation
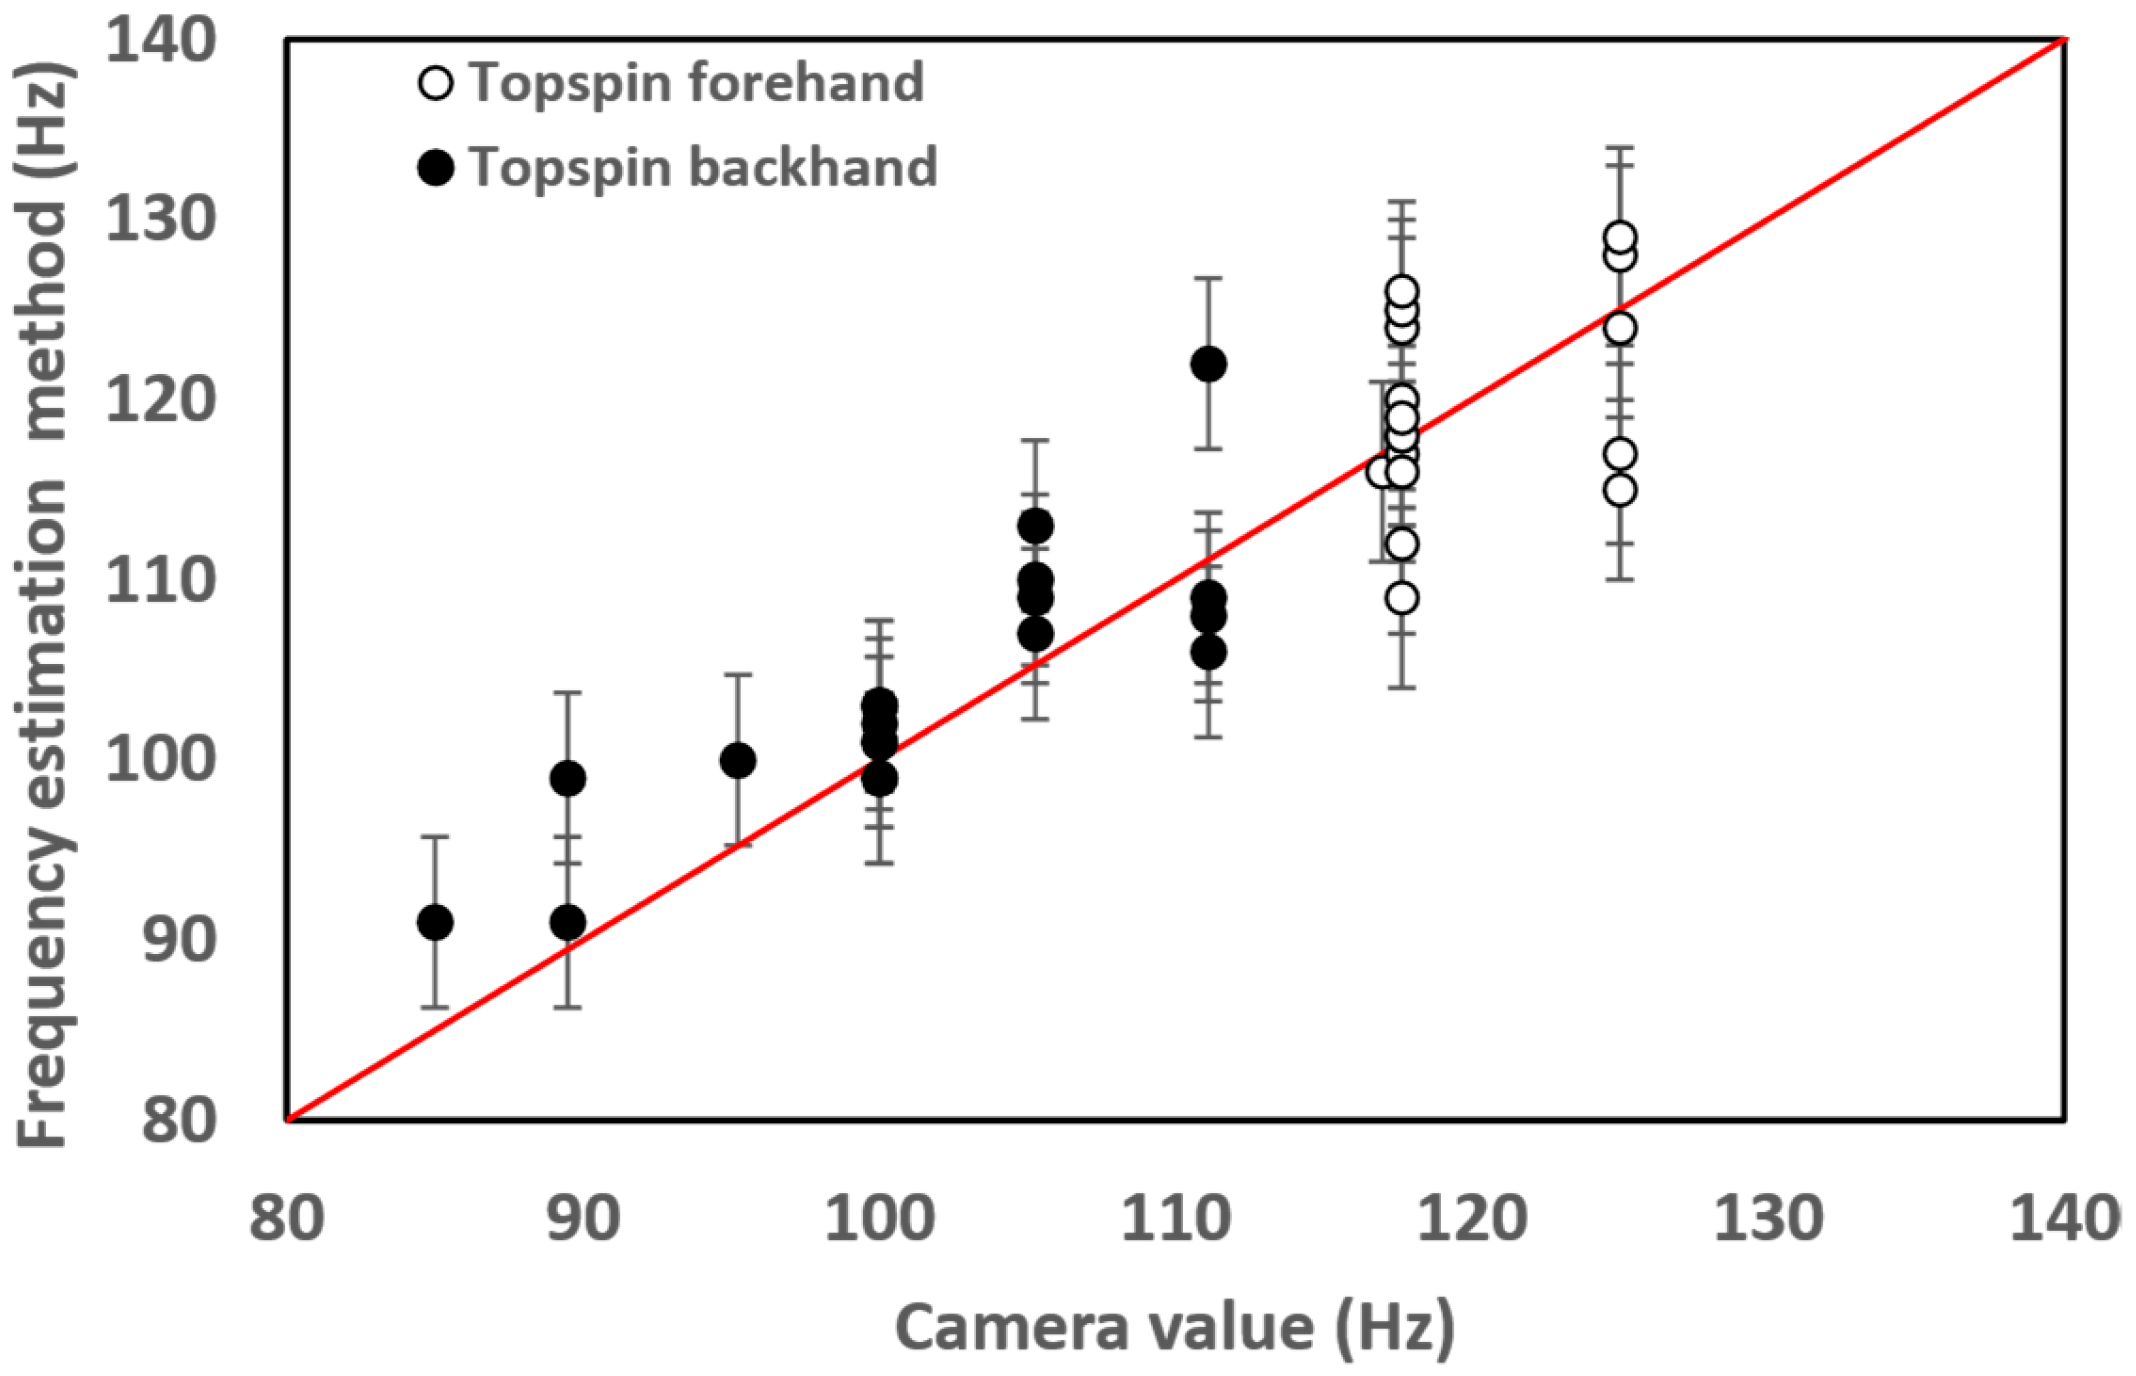
The computed value of rotation was compared with a high-speed camera, Miro C210 from Phantom, to determine the measurement error. Spin estimation with the camera was obtained through frame-by-frame analysis, while our system expresses spin by the method presented in the frequency domain. The camera frame rate was set at 2000 frames per second with a resolution of 768 × 768 pixels, and the sampling interval was fixed at 500 µs.
Figure 7 shows some topspin backhand and forehand shots and the predicted values compared to the real values obtained by the camera.
Root-mean-square error (RMSE) was computed for both types of strokes (forehand and backhand topspin). RMSE was plotted as error bars in
Figure 7 and shows a 5 Hz error for both types of strokes.
2.4. Participants
Nine young elite male players (aged 15 ± 1.5 years) from the French Table Tennis National Center were asked to perform different strokes in front of our system. The panel of players is composed of right- and left-handed players in almost equal proportions (5 right-handed and 4 left-handed). All the players had a similar level of experience, although they were of different ages.
All participants have an offensive play style with a shake-hand grip style. Players had to play with the same racket with similar coatings on both sides of the racket to avoid measurement bias linked to the use of a personal racket.
The players were informed about the nature of the different tests they had to perform, and each player’s verbal agreement was obtained after the instructions were given. Players were included in the study if they were part of the Pôle Espoir or Pôle France table tennis center from Nantes and were available for the scheduled test periods. Players with health problems or unavailable during the test periods were excluded from the study.
This work was conducted in accordance with the Declaration of Helsinki and its latest amendments. The local ethics committee for non-interventional research at Nantes University (n°IRB: IORG0011023) has approved the following procedures (approval n°02062023).
2.5. Table Tennis Test Protocol
Participants were asked to perform four different stroke conditions (labeled “exercises” in the following sections) in front of the measurement systems. Players had to hit the ball as they would in a competitive match. The ball must be hit cross-court to aim at a defined target on either the left or right side of the table. In this current study, precision indicators were not used and reported.
To counteract the order effect, the players were instructed to perform the exercise condition in a counterbalanced order between participants. For each individual, the order was kept identical for the series. Exercises were identically standardized for all participants; a ball launcher, Amicus expert from Butterfly, was used to throw a series of thirty balls for each stroke condition. Players had 10–20 warm-up balls to adjust their positioning before the test. A 2-min pause was given to the players between each stroke condition. The overall test took 10–15 min per player. The strokes asked to the players to perform were a forehand topspin on topspin ball (Exercise 3), a backhand topspin on topspin ball (Exercise 4), a forehand topspin on backspin ball (Exercise 1), and a backhand topspin on backspin ball (Exercise 2). The incoming ball kinetic parameters were measured and are displayed in
Table 1.
Players had to perform 6 series per exercise on different dates and spaced unevenly for each player. A total of 720 balls were hit by each player (4 exercises × 6 series × 30 balls per series). A total of 216 series were recorded (9 players × 4 exercise conditions × 6 series), but 13 were removed due to a high number of faults on the series (at least 50% of balls were faulted), corresponding to 6% of missing series. In total, 6480 balls were hit by the players. For each player series (6 in total), we averaged ball linear speed and spin to get one data point for each series, like Equations (4) and (5):
with
the linear speed of the ball in m.s
−1,
the rotation speed (RPS),
the ball index,
the number of hit balls,
the player,
the exercise (from 1 to 4),
j the indices of the played series (from 1 to 6), and
the number of balls in the series (
).
2.6. Data and Statistical Analysis
Data distributions consistently passed the Shapiro-Wilk normality test, and thus all data are reported as means ± standard deviation. To examine the relationships between the linear speed of the ball and its spin for all exercise conditions (i.e., N = 144 (x, y)), Pearson correlation analysis was performed. To check whether significant differences exist in ball speed as a function of exercise condition, a one-way ANOVA was performed with ball linear speed as the dependent variable. The level of significance was set at
p = 0.05. For all analyses, effect sizes were quantified as eta squares (η
2), with medium and large effects considered for η
2 = 0.06 and η
2 = 0.14, respectively [
20]. Bonferroni post hoc tests were performed following significant main effects (adjusted
p values are reported).
All statistical analyses were conducted using the open-source software
JASP (version 0.18.3.0). at
https://jasp-stats.org/ (accessed on 1 April 2024) [
21].
4. Discussion
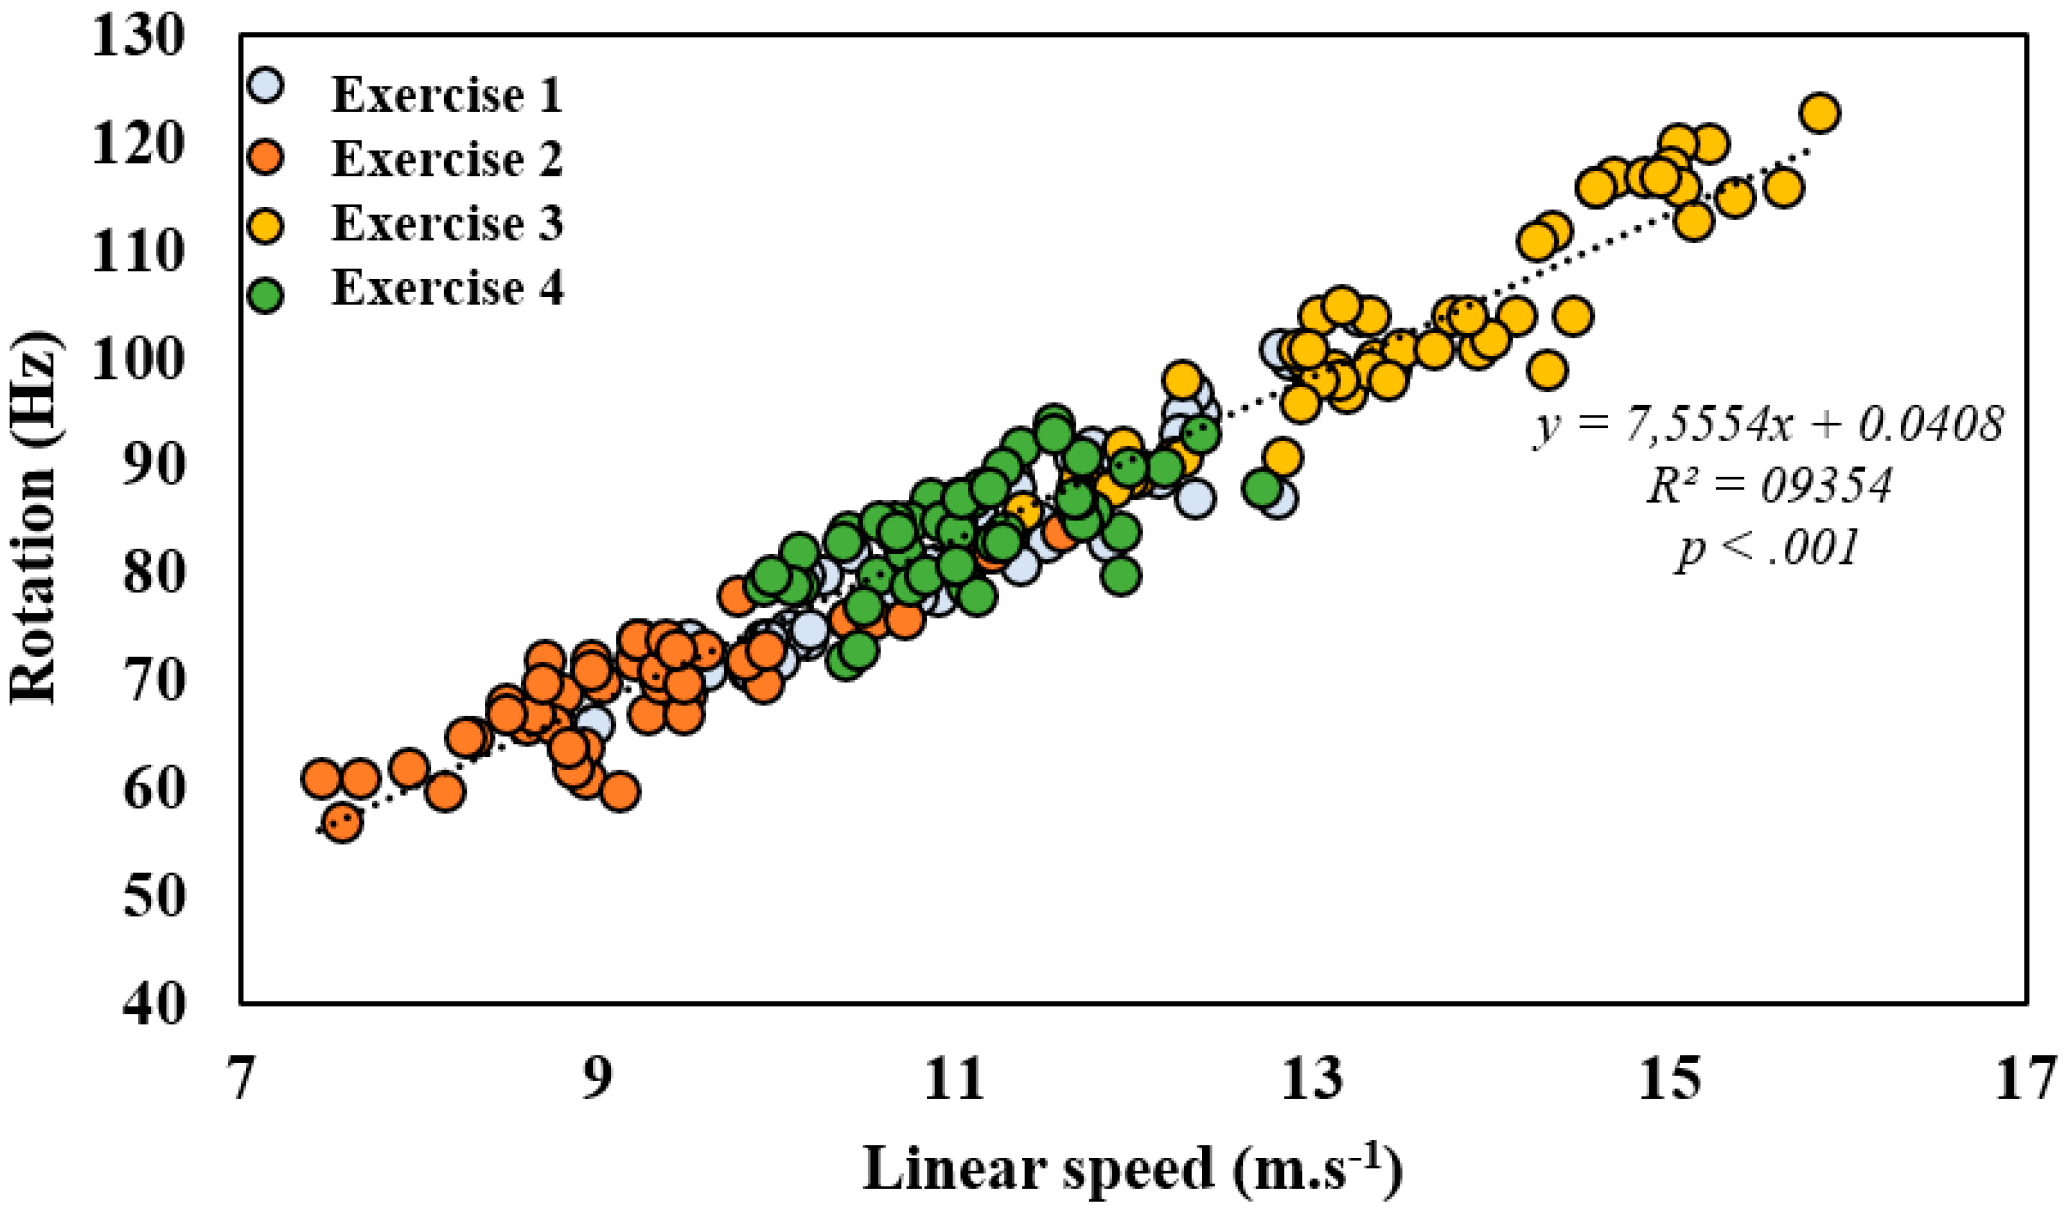
The primary objective of this study was to demonstrate the presence of a correlation between linear speed and ball spin. This study allowed us to confirm the presence of a strong positive correlation between ball spin and linear speed in four-stroke conditions. The first observation showed that the player’s mean linear speed ranges from 7 to 17 m.s
−1 and 60 to 120 RPS for rotation. These results are consistent with observed values in the existing literature, such as
Le Manse, Blank, and Lee’s work, who have found similar speed and spin values [
4,
10,
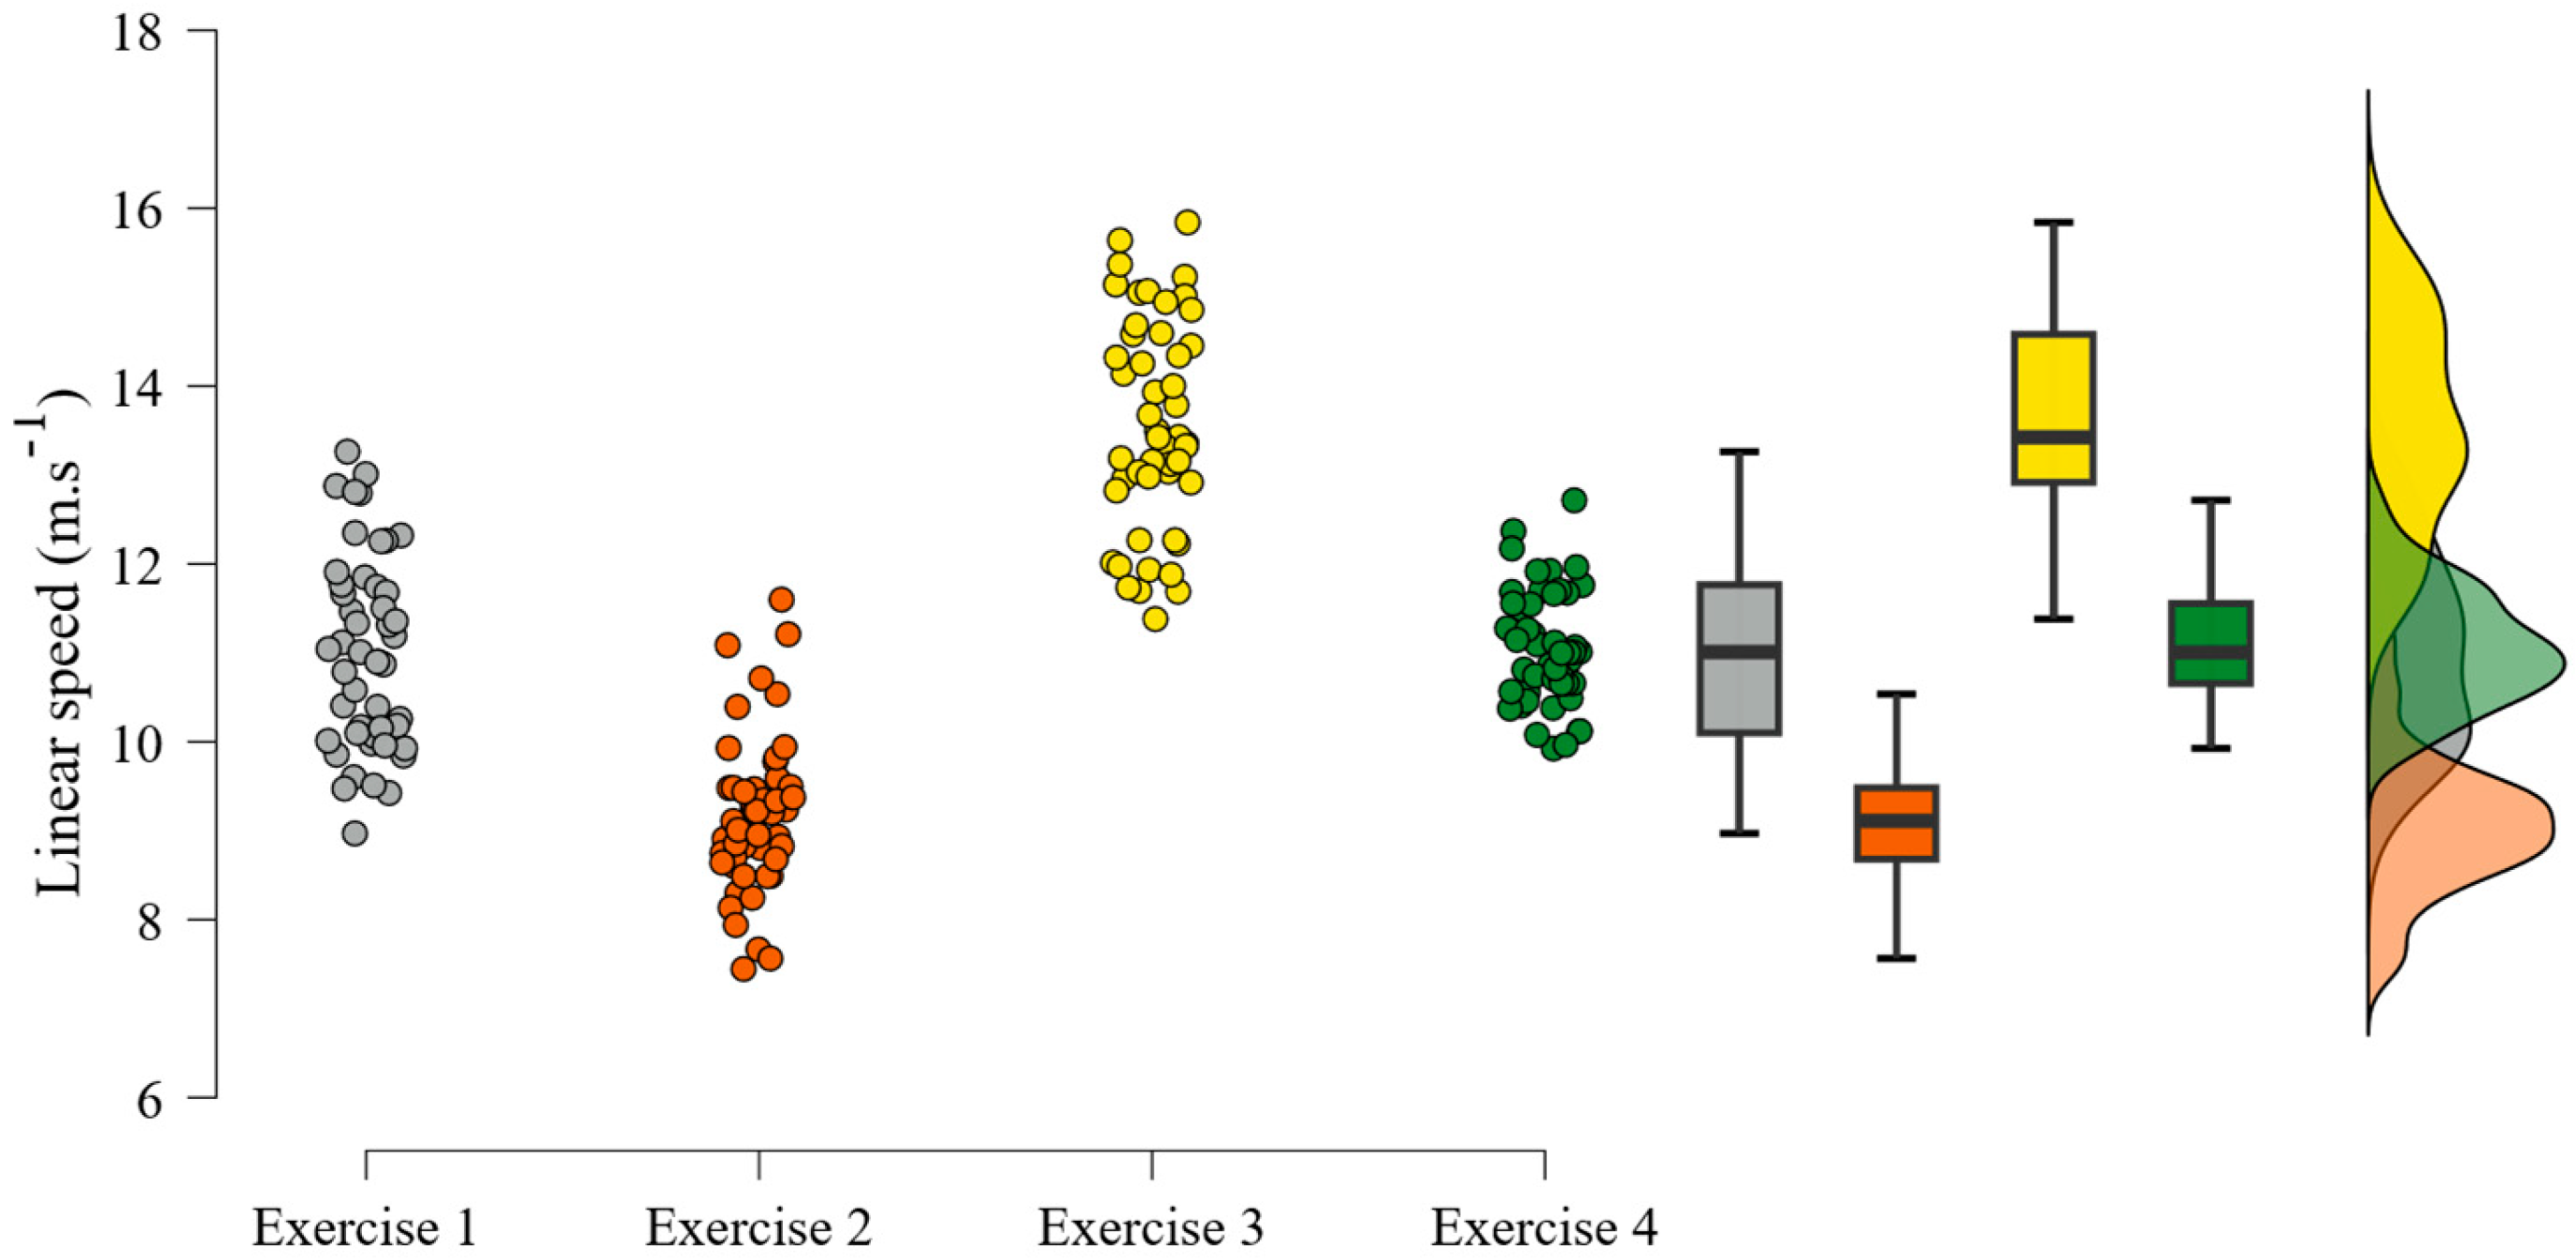
22] It is noticeable that the topspin forehand on topspin balls (exercise 3) clearly shows higher spin and speed compared to the remaining exercises due to the nature of the movement. The backhand strokes (exercises 2 and 4) display a lower speed and spin range than the forehand strokes (exercises 1 and 3). This could be due to the nature of the stroke; exercises 2 and 4 need more control to strike the ball back, whereas exercises 1 and 3 need more physical engagement from the player. This difference in ball speed depending on the stroke type was already observed in the literature, where racket velocity has been observed to be faster for forehand strokes than backhand strokes [
10,
23,
24].
The protocol was designed to observe the behavior of ball speed/spin on the most used offensive strokes in table tennis, but not for defensive stroke observation (e.g., the block).
However, more extreme conditions, such as a no-spin ball with high linear speed or a no-speed ball with a lot of spin, would not follow this rule and are physically possible, but probably won’t hit the table in a real match condition.
The linear relationship between ball speed and spin is probably due to the constraint of hitting the table with the ball (ball precision), known as the speed-accuracy trade-off in arm movement [
25]. This relationship could also appear due to the Magnus effect, admitted to affect spinning objects in a gas (air) and change the path of this object. A higher spin induced by the player will affect this trajectory and allow the ball to drop quickly due to the lift force created by the topspin. However, it seems effective to develop a large spin, as it will decrease the flying time of the ball and reduce the reaction time of your opponent [
26]. However, the results presented in our work are taken from a static measure (single measurement points); therefore, these results were not considered in the present study but should be used for match conditions studies.
It is important to underline that this strong linear correlation is not affected by the stroke condition (stroke realized and incoming spin), even if linear speed has shown significant differences between stroke conditions as hypothesized in the introduction.
Such tests have already been conducted with different test populations. In the study of Le Mansec et al. [
22], the test population had a mean age of 28.4 years, with different practice levels among adults. Our test population is younger (14.6 years mean age for men) and is geared towards young players in training. Working with young players, some have already finished developing their adult bodies, while others are still in growth. However, the ranking range is large enough to have advanced to expert players, in growth or not. To our knowledge, there are few studies doing comparisons between younger and older players on different aspects of performance, thus independently of their practice level.
Such results should be interpreted with caution due to the nature of the test group. Future studies should involve a wider range of participants by including gender parity, various practice-level groups, or even age differences.


 ,
, 

