Article

Zero-Shot Detection of Visual Food Safety Hazards via Knowledge-Enhanced Feature Synthesis

1
The Department of Food Science and Human Nutrition, University of Illinois Urbana-Champaign, Champaign, IL 61801, USA
2
Department of Chemical Engineering and Materials Science, Stevens Institute of Technology, Hoboken, NJ 07030, USA
3
School of Computer Science, Carnegie Mellon University, Pittsburgh, PA 15213, USA
4
Department of Computer Science, Worcester Polytechnic Institute, Worcester, MA 01609, USA
*
Author to whom correspondence should be addressed.
Appl. Sci. 2025, 15(11), 6338; https://doi.org/10.3390/app15116338
Submission received: 5 May 2025 / Revised: 29 May 2025 / Accepted: 3 June 2025 / Published: 5 June 2025
(This article belongs to the Special Issue Recent Advances in the Improvement of Food Quality and Safety)

Abstract

Automated food safety inspection systems rely heavily on the visual detection of contamination, spoilage, and foreign objects in food products. Current approaches typically require extensive labeled training data for each specific hazard type, limiting generalizability to novel or rare safety issues. We propose a zero-shot detection framework for visual food safety hazards that enables the identification of previously unseen contamination types without requiring explicit training examples. Our approach adapts and extends the Knowledge-Enhanced Feature Synthesizer (KEFS) methodology to the food safety domain by constructing a specialized knowledge graph that encodes visual safety attributes and their correlations with food categories. We introduce a Food Safety Knowledge Graph (FSKG) that models the relationships between 26 food categories and 48 visual safety attributes (e.g., discoloration, mold patterns, foreign material characteristics) extracted from food safety databases and expert knowledge. Using this graph as the prior knowledge, our system synthesizes discriminative visual features for unseen hazard classes through a multi-source graph fusion module and region feature diffusion model. Experiments on our newly constructed Food Safety Visual Hazards (FSVH) dataset demonstrate that our approach achieves 63.7% mAP in zero-shot hazard detection, outperforming state-of-the-art general zero-shot detection methods by 6.9%. Furthermore, our framework demonstrates robust generalization to fine-grained novel hazard categories while maintaining high detection performance (59.8% harmonic mean) in generalized zero-shot scenarios where both seen and unseen hazards may occur simultaneously. This work represents a significant advancement toward automated, generalizable food safety inspection systems capable of adapting to emerging visual hazards without a costly retraining process.

1. Introduction

Food safety presents a critical global challenge with significant health and economic implications. The World Health Organization estimates that unsafe food causes 600 million cases of foodborne diseases annually, resulting in 420,000 deaths worldwide [1]. Visual inspection remains a cornerstone of food safety assessment, with trained personnel examining food products for visible signs of spoilage, contamination, or foreign objects [2]. However, despite technological advances, manual inspection remains labor-intensive, subjective, and limited in scalability [3].
Recent progress in computer vision and deep learning has enabled automated visual food inspection systems that can detect various safety hazards with high accuracy [4,5]. These systems typically rely on supervised learning approaches that require extensive labeled training data for each specific hazard type they aim to detect. While effective for known hazards with abundant training examples, these approaches face significant limitations when encountering novel or rare safety issues that are not represented in the training data. In real-world food production and distribution chains, new types of contamination, adulteration, or spoilage patterns constantly emerge, necessitating systems that can generalize beyond their training distribution [6].
Zero-shot learning (ZSL) offers a promising paradigm to address this challenge by enabling models to recognize categories not seen during training [7]. In particular, Zero-Shot Detection (ZSD) extends this concept to simultaneously localize and classify objects from novel categories [8]. ZSD achieves this ability by learning a mapping between visual features and semantic descriptions, allowing the model to detect instances of previously unseen classes based on their semantic attributes. While ZSD has shown success in general object detection domains [9,10], its application to fine-grained food safety hazard detection presents unique challenges.
Food safety hazards often manifest as subtle visual cues (such as discoloration, texture anomalies, and foreign materials) that share common visual patterns across different food categories. For example, mold contamination may appear differently on bread versus fruit, yet shares underlying visual attributes that should enable generalization [11]. However, the inter-class similarity among different types of hazards (e.g., various forms of microbial contamination) and the complexity of food attributes create additional challenges for zero-shot approaches. Traditional ZSD methods that rely solely on word embeddings or simple attribute vectors struggle to capture these nuanced relationships, resulting in poor generalization to unseen hazard categories [12].
To address these challenges, we propose a novel framework for the Zero-Shot Detection of Food Safety Hazards that adapts and extends the Knowledge-Enhanced Feature Synthesizer (KEFS) methodology [12] to the food safety domain. Our approach leverages structured domain knowledge about the relationships between food categories and visual safety attributes to synthesize discriminative features for unseen hazard classes. At the core of our framework is a specialized Food Safety Knowledge Graph (FSKG) that encodes the correlations between 26 food categories and 48 visual safety attributes extracted from food safety databases and expert knowledge.
This knowledge graph serves as prior information for our Multi-Source Graph Fusion (MSGF) module, which learns to combine knowledge from multiple sources (ingredient correlations, hyperclass relationships, and attribute co-occurrences) to generate robust semantic representations. These representations condition a Region Feature Diffusion Model (RFDM) that synthesizes realistic visual features for novel hazard categories. The synthesized features enable our model to detect previously unseen food safety hazards without requiring explicit training examples.
The contributions of our work are threefold:
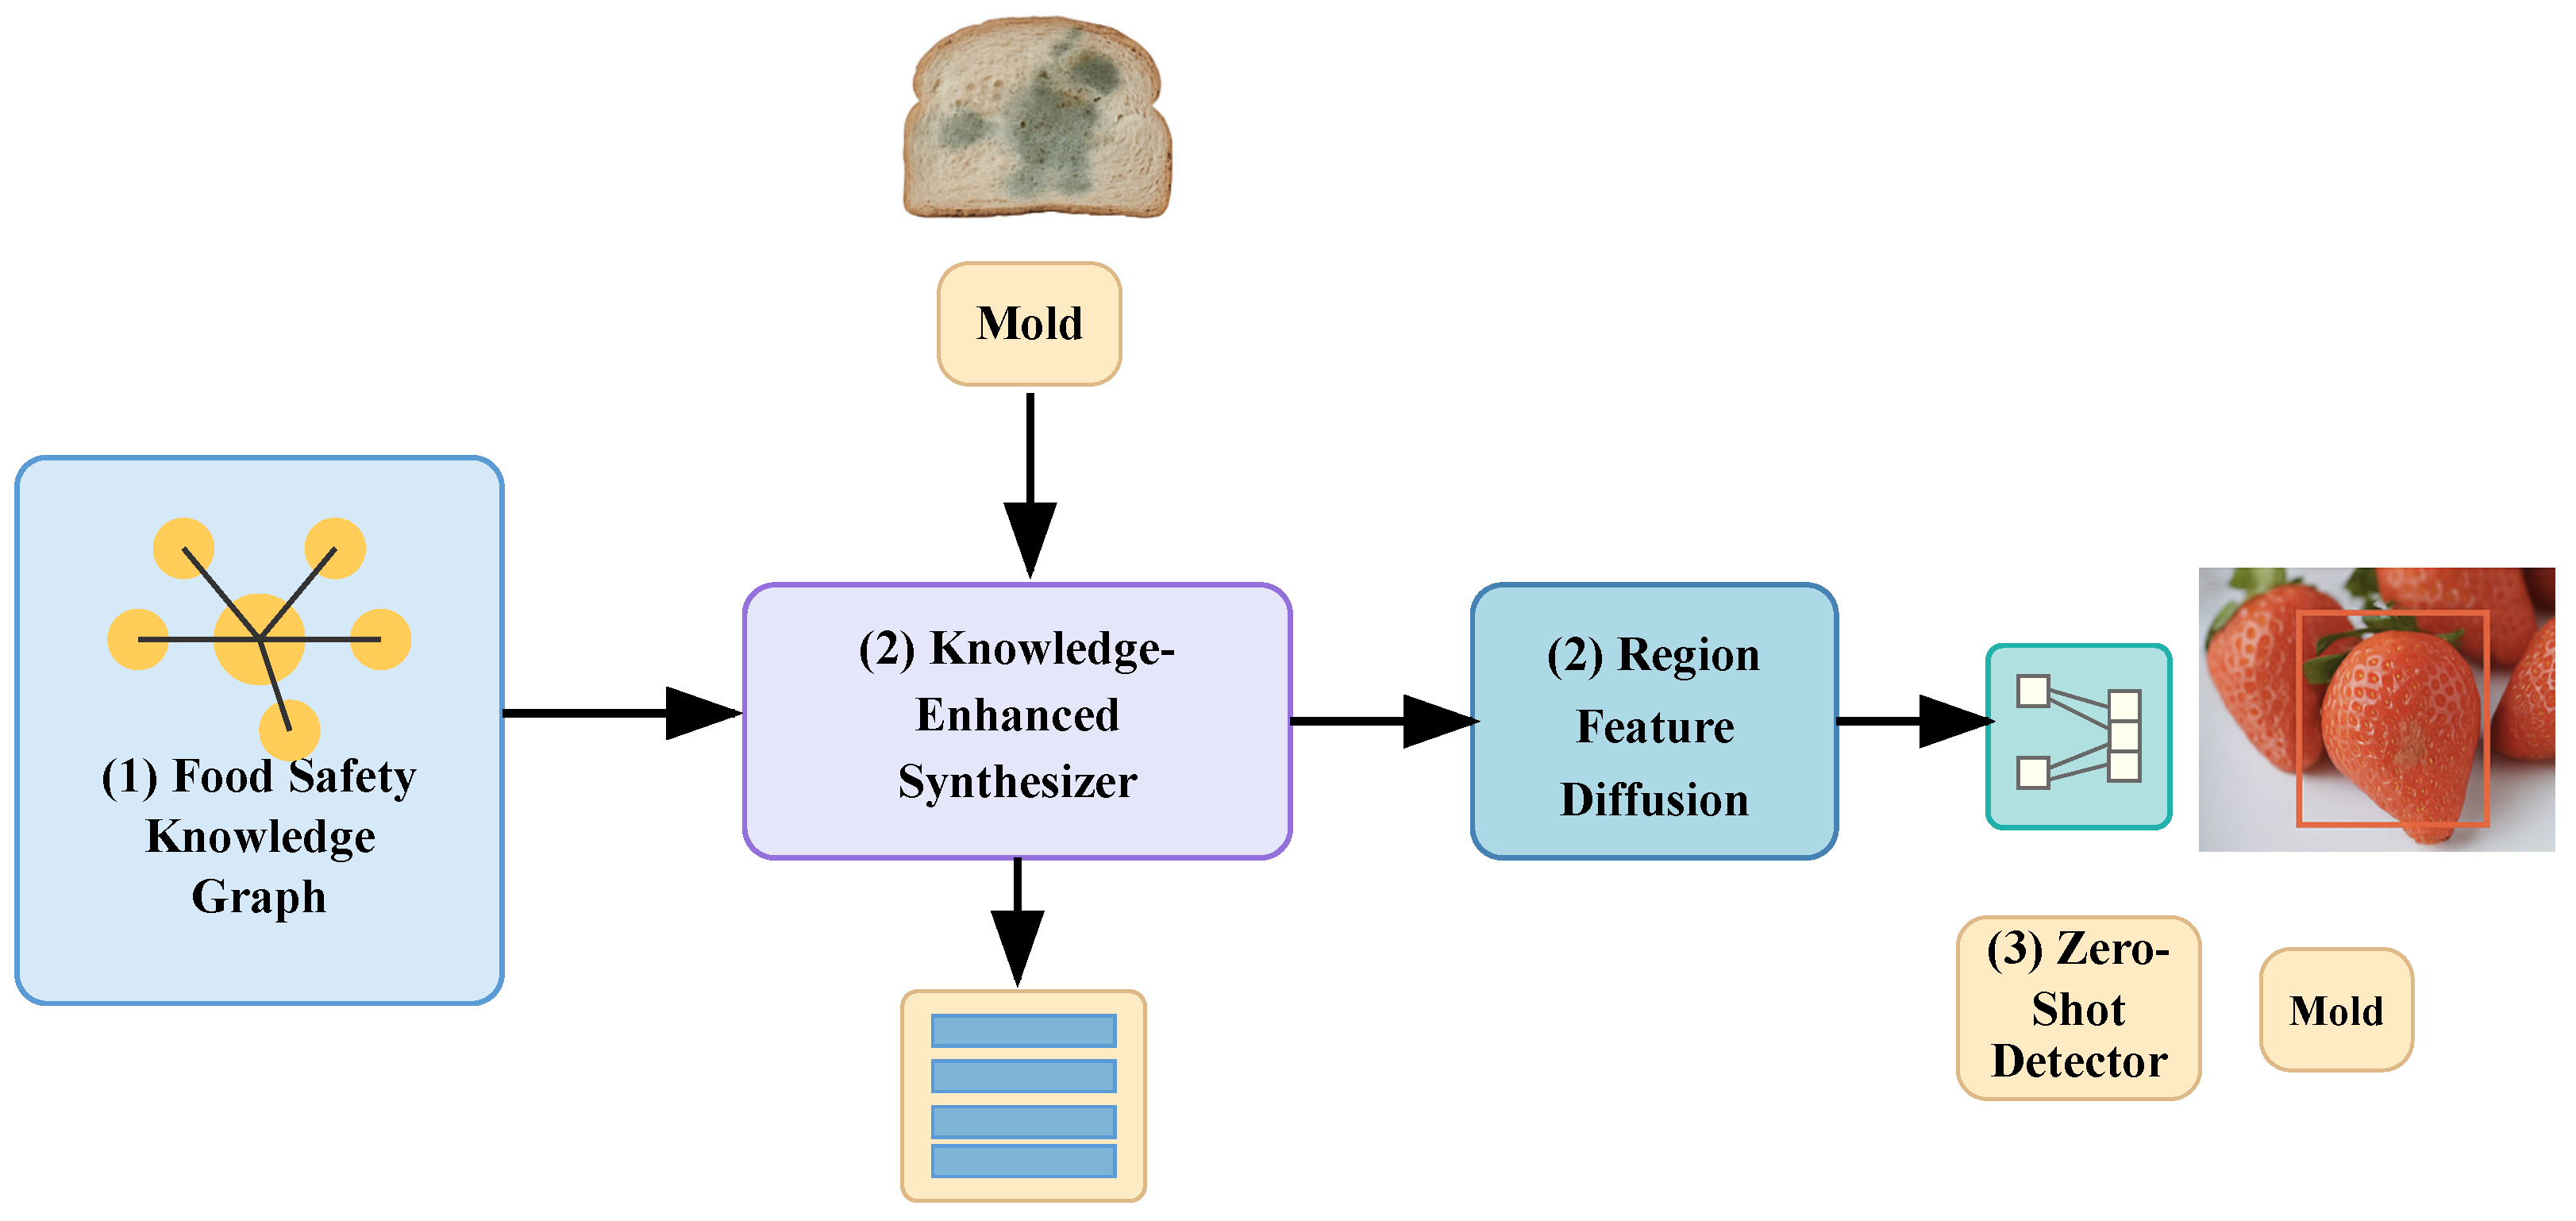
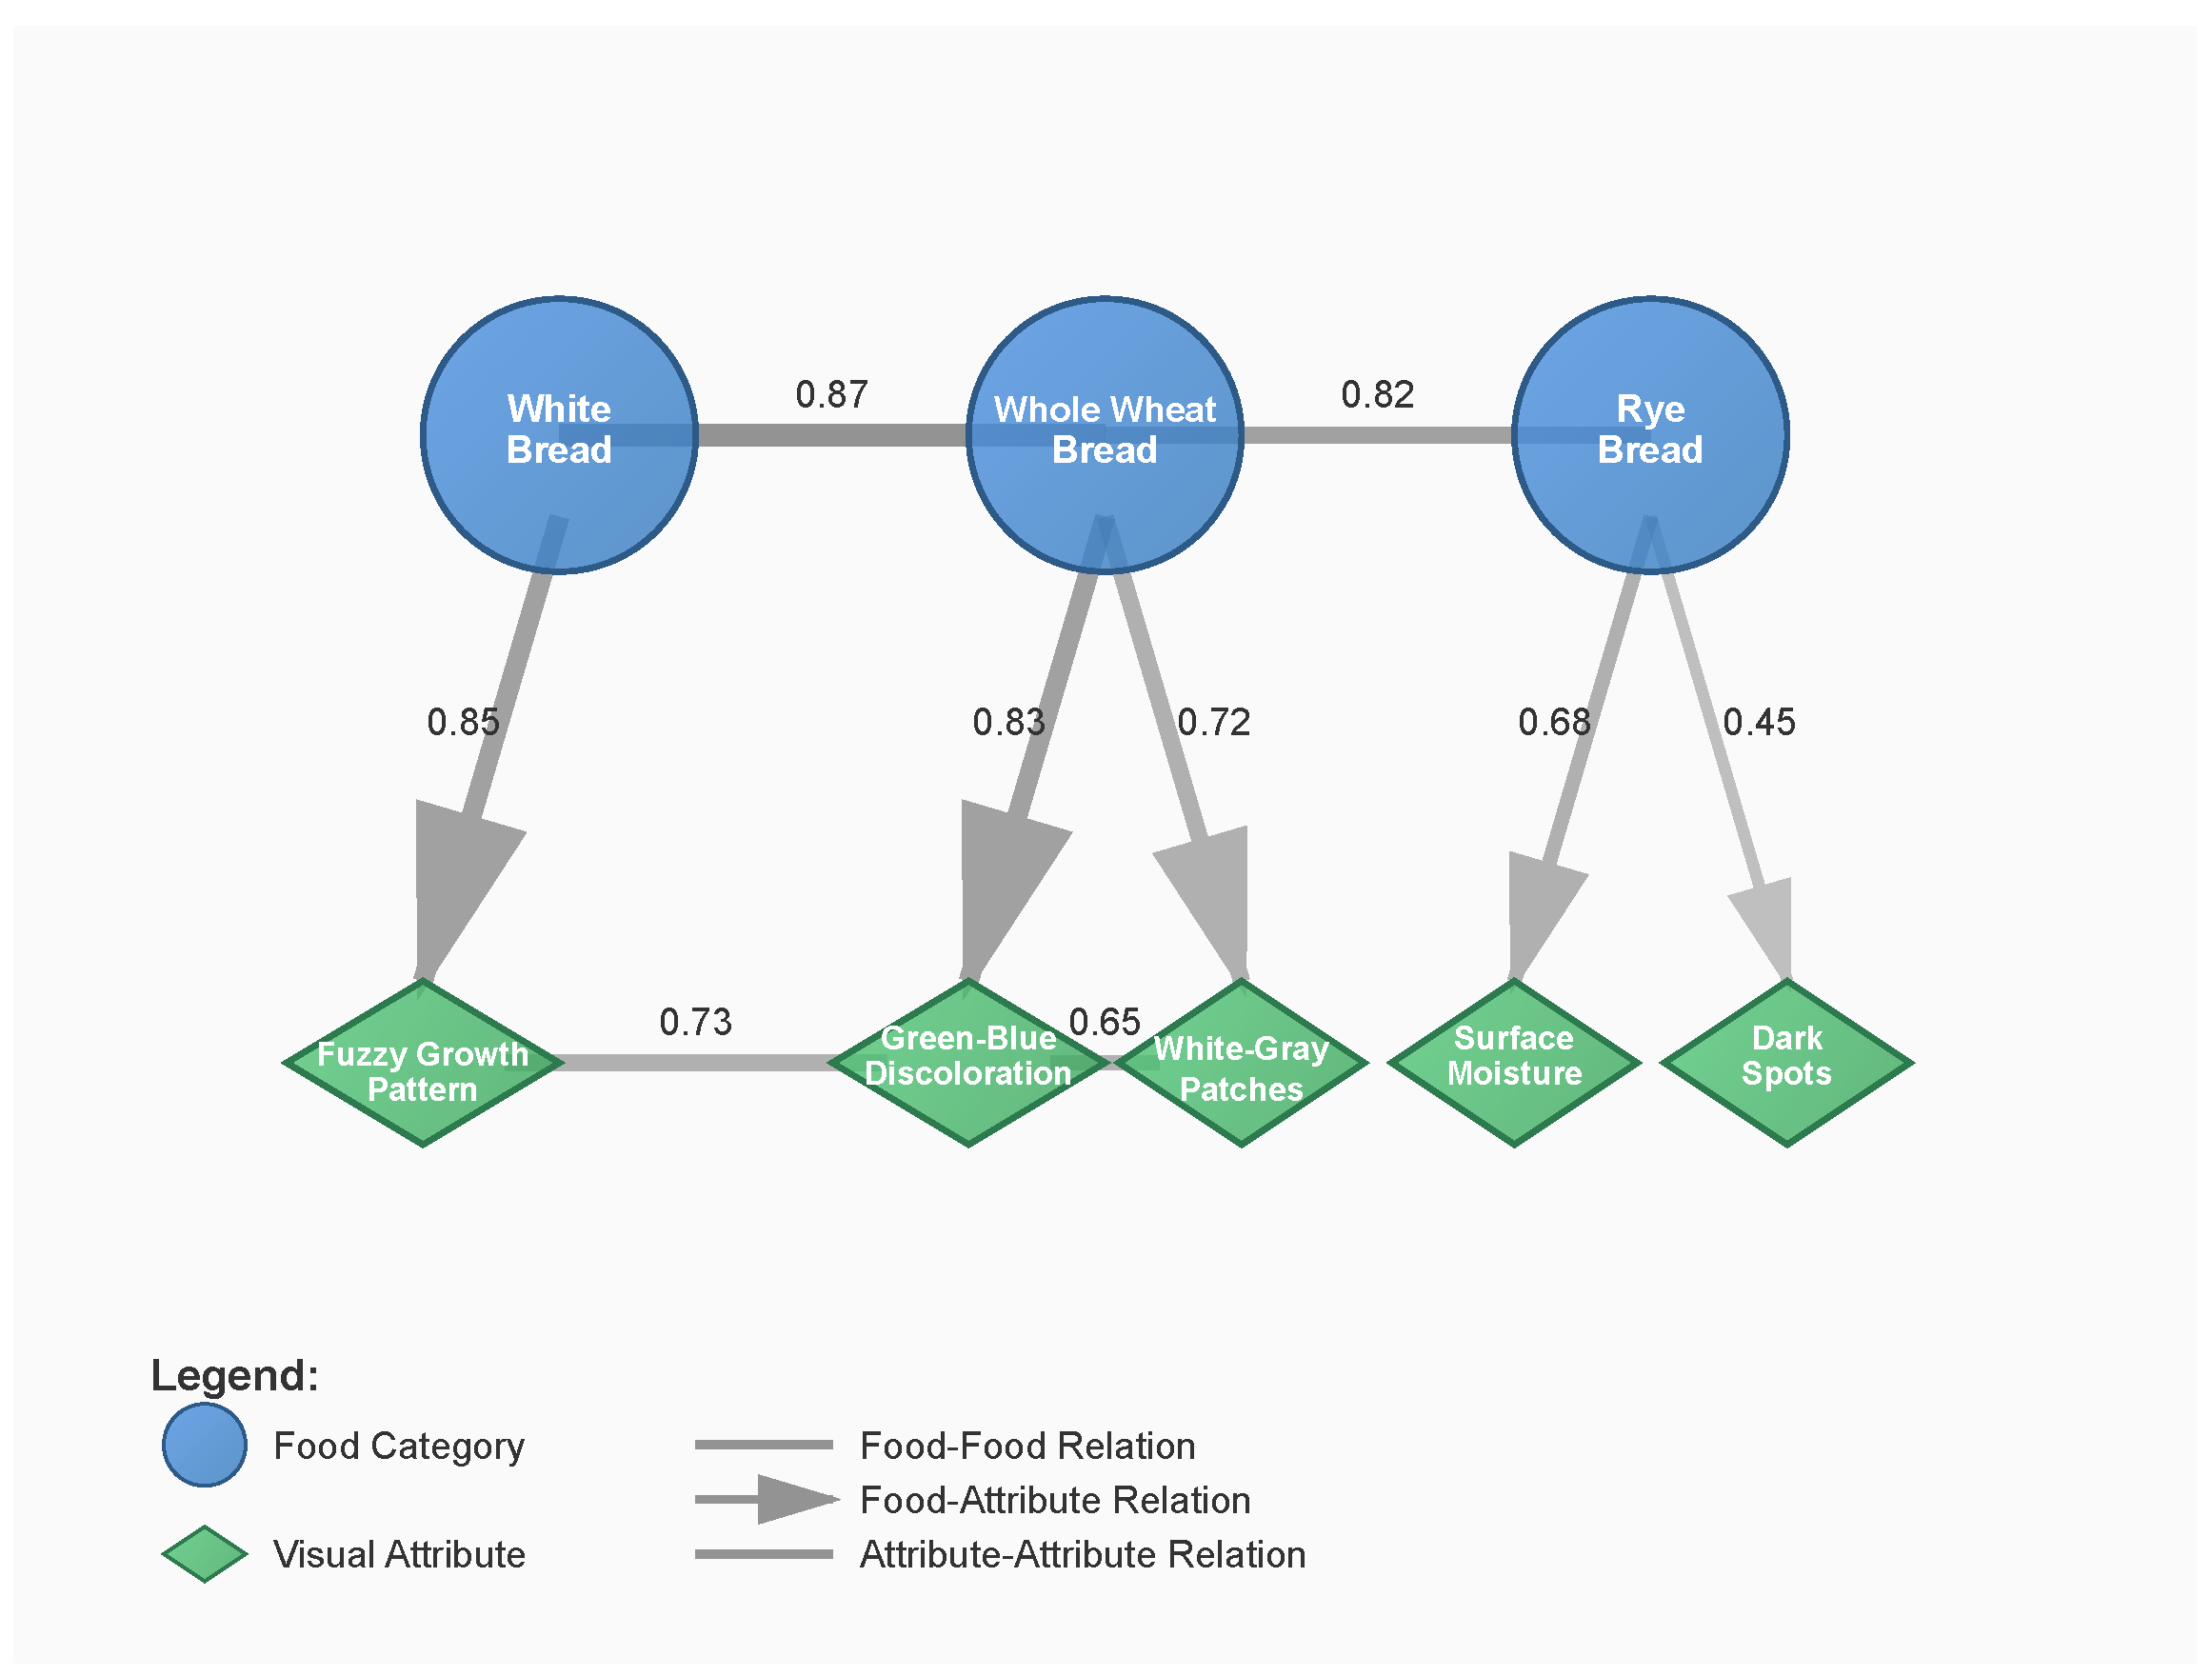
  • We introduce a specialized FSKG that models the relationships between food categories and visual safety attributes, providing structured prior knowledge for zero-shot hazard detection.
  • We adapt and extend the Knowledge-Enhanced Feature Synthesizer framework to the food safety domain, addressing the unique challenges of fine-grained visual hazard detection through multi-source graph fusion and region feature diffusion.
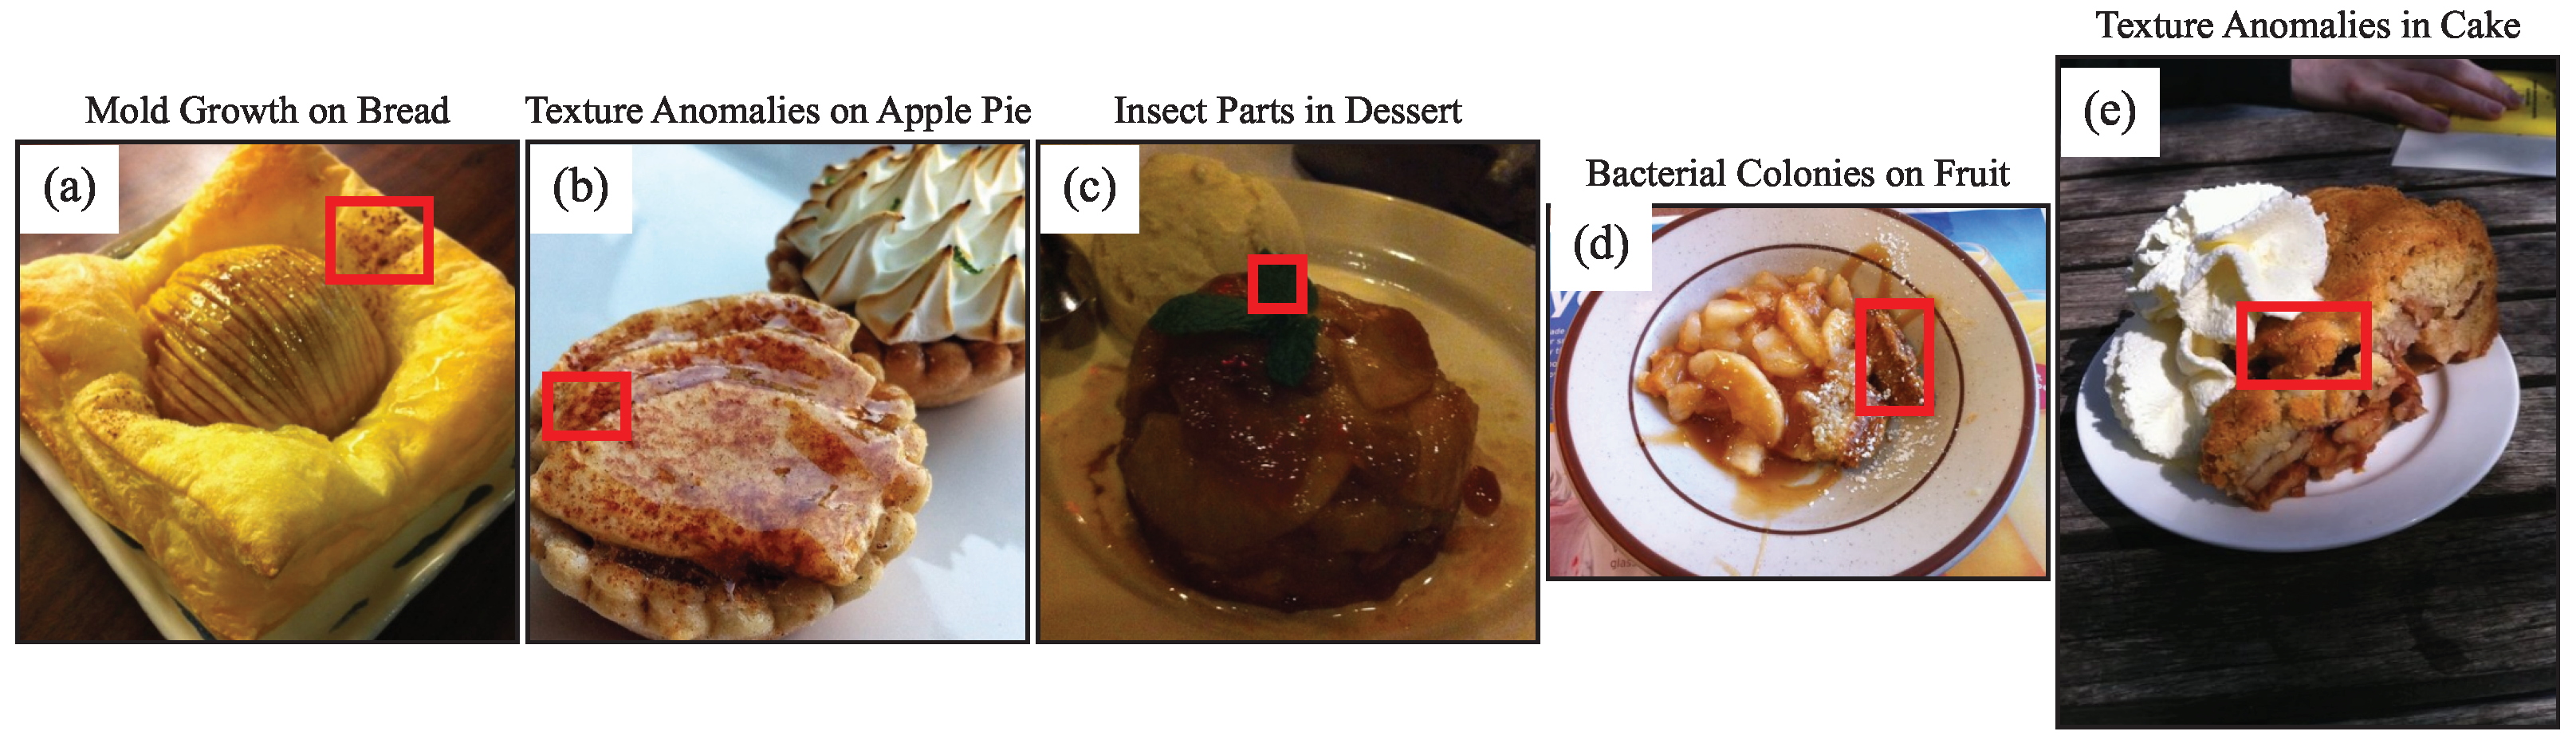
  • We present a new Food Safety Visual Hazards (FSVH) dataset with rich attribute annotations, establishing a benchmark for evaluating zero-shot food safety hazard detection.
The experimental results demonstrate that our approach achieves 63.7% mAP in zero-shot hazard detection, outperforming state-of-the-art general zero-shot detection methods by 6.9%. Furthermore, our framework demonstrates robust generalization to fine-grained novel hazard categories while maintaining a high detection performance (59.8% harmonic mean) in generalized zero-shot scenarios where both seen and unseen hazards may occur simultaneously.
The remainder of this paper is organized as follows: Section 2 reviews related work on food safety inspections, zero-shot learning, and knowledge graphs. Section 3 details our proposed approach, including the design of the Food Safety Knowledge Graph, the adaptation of KEFS to food safety, and the training methodology. Section 4 presents the experimental results and comparisons with baseline methods. Finally, Section 5 concludes with a discussion of the implications and future directions.

2. Related Work

Our work intersects several research domains, including food safety inspection, zero-shot learning, and knowledge representation for visual recognition. In this section, we review the relevant literature in these areas and position our contribution within the broader research landscape.

2.1. Food Safety Inspection and Visual Analysis

Visual assessment has long been a cornerstone of food safety inspection, traditionally performed by human inspectors trained to recognize signs of contamination, spoilage, or foreign objects [13]. Recent advances in computer vision have enabled more automated approaches to food safety inspection, reducing reliance on subjective human judgment and increasing throughput in food production environments [14].
Early computer vision systems for food safety focused on detecting specific contaminants using handcrafted features and traditional machine learning techniques [15]. For example, Magnus et al. [16] developed methods for foreign object detection in food products using color and textural features, while Cho et al. [17] employed spectral imaging techniques to detect surface contaminants on poultry products.
The emergence of deep learning has significantly advanced automated food safety inspection. Convolutional Neural Networks (CNNs) have become the dominant approach for detecting various safety hazards, including mold [18], foreign objects [19], and microbial contamination [4]. For instance, Ma et al. [20] employed CNNs to detect fruit diseases and defects in agricultural settings, while Lin et al. [6] developed a multi-level deep learning system for the rapid detection of various food hazards.
Despite these advances, most current deep learning approaches for food safety inspection operate in a closed-set paradigm, where all hazard types must be present in the training data. This limitation significantly impairs their ability to detect novel or rare safety issues not represented during training—a critical shortcoming in real-world scenarios where new types of contamination constantly emerge [21]. Our work addresses this limitation by developing a zero-shot detection framework specifically tailored for food safety hazards.

2.2. Zero-Shot Learning and Zero-Shot Detection

Zero-Shot Learning (ZSL) enables the recognition of categories not seen during training by establishing a mapping between visual features and semantic descriptions [7]. Traditional ZSL methods can be broadly categorized into two approaches: mapping-based and generation-based.
Mapping-based methods learn a projection between visual and semantic spaces, allowing the model to classify unseen categories based on their semantic attributes [22,23]. For example, Lampert et al. [22] proposed Direct Attribute Prediction (DAP), which uses attribute-based descriptions to recognize unseen classes. Frome et al. [23] introduced DeViSE, which leverages word embeddings to enable zero-shot recognition. However, these methods typically suffer from the domain shift problem, where the projection learned from the seen classes generalizes poorly to unseen ones [24].
Generation-based methods address this limitation by synthesizing visual features for unseen classes based on their semantic descriptions, effectively transforming ZSL into a supervised learning problem [25,26]. Xian et al. [25] proposed f-VAEGAN-D2, which uses a conditional VAE-GAN architecture to generate features for unseen classes. Schönfeld et al. [26] introduced CADA-VAE, which aligns visual and semantic distributions in a shared latent space to improve feature generation.
ZSD extends ZSL to the object detection domain, enabling models to simultaneously localize and classify objects from unseen categories [8]. Bansal et al. [8] pioneered ZSD by adapting existing detection frameworks to incorporate semantic information. Subsequent works have explored various approaches to improve ZSD performance. Rahman et al. [27] proposed a polarity loss to better align visual and semantic features, while Zhu et al. [9] introduced a feature generation approach that synthesizes region features for unseen classes.
More recently, generation-based methods have shown superior performance in ZSD. Hayat et al. [28] proposed a GAN-based framework that synthesizes diverse features for unseen classes, while Huang et al. [29] introduced a feature synthesizer that preserves the structural relationships between classes. However, these methods typically rely on generic word embeddings or simple attribute vectors, limiting their effectiveness for fine-grained zero-shot tasks with complex class relationships, such as food safety hazard detection.
Our work builds upon generation-based ZSD but introduces a novel knowledge-enhanced feature synthesis approach specifically designed for the food safety domain. By leveraging rich domain knowledge encoded in a specialized food safety knowledge graph, our method can capture complex relationships between food categories and visual safety attributes, enabling the more effective zero-shot detection of food safety hazards.

2.3. Knowledge Graphs for Computer Vision

Knowledge graphs have emerged as powerful tools for incorporating structured domain knowledge into computer vision tasks [30,31]. A knowledge graph represents concepts (entities) as nodes and their relationships as edges, providing a structured representation of domain knowledge that can guide visual recognition systems.
In object recognition, Wang et al. [32] leveraged knowledge graphs to improve zero-shot learning by capturing the semantic relationships between object categories. Similarly, Kampffmeyer et al. [33] proposed a hierarchical embedding approach that uses knowledge graphs to exploit class hierarchies in zero-shot scenarios. These approaches demonstrate that structured knowledge can significantly enhance generalization to unseen categories.
In the food domain, knowledge graphs have been developed to represent various aspects of food, including ingredients, nutritional content, and cultural contexts [34,35]. FoodKG [34] is a comprehensive food knowledge graph that integrates data from multiple sources, including recipes, nutritional information, and food–health relationships. While these resources provide valuable domain knowledge, they primarily focus on nutritional and culinary aspects rather than food safety.
Some recent works have begun to explore the integration of knowledge graphs with computer vision for food analysis. Zhou et al. [12] introduced a knowledge-enhanced framework for zero-shot food detection that leverages correlations between ingredients from food knowledge graphs. Their approach, known as the Knowledge-Enhanced Feature Synthesizer (KEFS), uses multi-source graph fusion to combine different types of food knowledge (ingredients, hyperclasses, etc.) to generate discriminative features for unseen food categories.
Our work extends this line of research by developing a specialized FSKG that encodes the relationships between food categories and visual safety attributes. Unlike previous food knowledge graphs that focus on nutritional or culinary aspects, our FSKG is specifically designed to capture visual characteristics of food safety hazards, enabling the more effective zero-shot detection of safety issues across different food categories.

2.4. Feature Synthesis for Zero-Shot Learning

Feature synthesis has become a dominant approach for zero-shot learning, with various generative models proposed to create visual features for unseen classes [25,36,37]. Early approaches primarily relied on Generative Adversarial Networks (GANs) [38] and Variational Autoencoders (VAEs) [39] for feature generation.
Felix et al. [36] proposed a multi-modal cycle-consistent GAN for generating visual features from semantic descriptions, while Xian et al. [25] combined VAE and GAN architectures to improve feature generation quality. However, these methods often struggle with mode collapse and lack of diversity in the generated features, limiting their effectiveness for zero-shot detection tasks.
Recent advances have focused on improving the quality and diversity of synthesized features. Diffusion models [40,41] have emerged as a promising alternative to GANs and VAEs, offering more stable training and diverse generation capabilities. These models define a forward diffusion process that gradually adds noise to data and a reverse denoising process that learns to recover the original data distribution.
In the zero-shot detection domain, Zhou et al. [12] introduced RFDM, which adapts diffusion models to synthesize region features for object detection. By leveraging knowledge-enhanced conditioning, RFDM can generate diverse and discriminative features for unseen object categories, demonstrating superior performance compared to GAN-based approaches.
Our work adapts the RFDM framework to the food safety domain, introducing several innovations to address the unique challenges of synthesizing features for food safety hazards. We modify the conditioning mechanism to incorporate domain-specific knowledge from our Food Safety Knowledge Graph, enabling the model to generate features that can capture the subtle visual cues characteristic of different safety hazards. Additionally, we introduce a new training strategy that ensures the synthesized features are well-separated across different hazard categories while maintaining the intra-class diversity necessary for robust detection.

3. Methodology

This section details our proposed framework for the Zero-Shot Detection of Visual Food Safety Hazards. Figure 1 illustrates the architecture of our method, which consists of three primary components: (1) a Food Safety Knowledge Graph that encodes domain-specific knowledge about visual food safety attributes, (2) a Knowledge-Enhanced Feature Synthesizer that leverages this knowledge to generate discriminative visual features for unseen hazard categories, and (3) a zero-shot detector that uses these synthesized features to identify food safety hazards not seen during training.

3.1. Problem Formulation

We formally define the Zero-Shot Food Safety Hazard Detection (ZS-FSHD) problem as follows. Let X s denote a training set containing M s food images with annotated bounding boxes belonging to C s seen hazard classes. The label sets for seen and unseen hazard classes are denoted as Y s = { 1 , , C s } and Y u = { C s + 1 , , C } respectively, where Y s Y u = , and  C = C s + C u is the total number of hazard classes (with C u being the number of unseen classes).
It is important to clarify that “zero-shot” in this context does not refer to detecting zero incidents or the absence of hazards. Rather, it describes the ability to detect hazard classes that have zero training examples—that is, hazard types that were never seen during training. Our framework achieves this ability through a knowledge-transfer mechanism that leverages semantic relationships between seen and unseen hazard classes.
For each class y Y = Y s Y u , we have corresponding semantic vectors v y V = V s V u , where V s and V u are the semantic vector sets for seen and unseen classes, respectively. These semantic vectors are 768-dimensional embeddings obtained from BERT [42], where detailed textual descriptions of each hazard class are processed to capture their visual and safety characteristics.
The key insight enabling zero-shot detection is that while the detector never observes training examples of unseen hazard classes, it learns the relationships between visual features and semantic attributes through the seen classes. For instance, during training on seen hazards like “mold on bread”, the detector learns to associate visual patterns (fuzzy texture, irregular patches) with corresponding semantic attributes. When encountering an unseen hazard such as “bacterial colonies on fruit”, the detector recognizes it by matching the observed visual patterns to the semantic attributes of the unseen class, effectively transferring knowledge from seen to unseen domains through our Knowledge-Enhanced Feature Synthesizer.
During inference, we are provided with a test set X t containing images with both seen and unseen hazard classes. The goal of ZS-FSHD is to train a detection model on X s with semantic vectors V and detect both seen and unseen hazards in X t . We evaluate our method in both ZSD settings, where the test images contain only unseen hazards, and Generalized Zero-Shot Detection (GZSD) settings, where the test images may contain both seen and unseen hazards.

3.2. Food Safety Knowledge Graph

At the core of our approach is a specialized Food Safety Knowledge Graph (FSKG) that encodes relationships between food categories and visual safety attributes. Unlike general food knowledge graphs that focus on nutritional or culinary aspects, our FSKG specifically models visual characteristics relevant to food safety hazards.

3.2.1. FSKG Construction

We construct the FSKG as a heterogeneous graph G = ( N , E ) , where N = F A represents the node set comprising food categories F = { f 1 , f 2 , , f m } and visual safety attributes A = { a 1 , a 2 , , a n } . The edge set E consists of three types of relationships that capture different aspects of food safety knowledge.
Figure 2 illustrates a representative subgraph of our FSKG focusing on bread-related hazards. The visualization shows three types of nodes: food categories (e.g., “White Bread” and “Whole Wheat Bread”), visual attributes (e.g., “Fuzzy Growth Pattern” and “Green-Blue Discoloration”), and their relationships. Edge thickness represents weight strength, demonstrating how knowledge propagates through the network to enable feature synthesis for unseen hazard classes.
Food–Attribute Relations ( E F A ): These edges connect food categories to their associated visual safety attributes, with the edge weights reflecting the relevance of each attribute to the particular food category. The edge weight w i j F A between the food category f i and attribute a j is determined as follows:
w i j F A = α · p i j · s i j
where p i j is the normalized frequency of attribute a j occurring in food category f i within our dataset, s i j [ 0 , 1 ] is an expert-assigned importance score, and  α is a normalization constant. For example, the edge weight between “bread” and “mold growth pattern” is 0.85, reflecting both a high frequency of occurrence (68% of contaminated bread samples) and high expert importance (0.9). Conversely, “canned vegetables” and “mold growth pattern” have a weight of only 0.15 due to the sterilization process preventing mold growth.
Food–Food Relations ( E F F ): These edges link related food categories based on their similarity in composition and appearance, and their susceptibility to similar safety hazards. The similarity score w i j F F between food categories f i and f j is computed as follows:
w i j F F = 0.4 · sim comp ( f i , f j ) + 0.4 · sim hazard ( f i , f j ) + 0.2 · sim proc ( f i , f j )
where sim comp measures compositional similarity (water content, pH levels, nutrient profile), sim hazard captures shared susceptibility to hazards, and  sim proc reflects processing and storage requirement similarities. For instance, “fresh strawberries” and “fresh raspberries” achieve a high similarity score of 0.92 due to their comparable water content (90–92%), pH levels (3.2–3.5), and susceptibility to similar mold and bacterial contamination. In contrast, “fresh strawberries” and “dried fruits” score only 0.28, as dehydration fundamentally alters the hazard profile.
Attribute–Attribute Relations ( E A A ): These edges connect visual safety attributes that frequently co-occur or share visual similarities, allowing the model to learn correlations between different manifestations of food safety issues. The co-occurrence weight is calculated based on the conditional probability of observing both attributes in the same food safety incident.
To populate the FSKG, we extract information from three primary sources: (1) food safety databases such as the FDA’s Bacteriological Analytical Manual [43] and the USDA’s Microbiology Laboratory Guidebook [44], (2) the scientific literature on food safety and quality assessments, and (3) expert knowledge from food safety professionals.
We organize visual safety attributes into four main categories based on their phenomenological characteristics. Appearance Attributes encompass basic visual features that indicate potential safety issues, including discoloration, abnormal texture patterns, and visible foreign materials (such as plastic fragments or metal shavings). These attributes often provide the most immediate visual cues for safety assessments. Decomposition Attributes capture visual indicators of food spoilage or decay processes, including mold growth, rotting tissues, and fermentation-related changes like abnormal bubble formation. These attributes specifically target biological degradation processes. Decomposition Attributes capture visible indicators of microbial activity or decay processes, including mold growth, bacterial colonies that have formed visible biofilms, rotting tissues, and fermentation-related changes. However, it is important to note that many dangerous foodborne pathogens do not produce visible changes in food, and our vision-based system cannot detect invisible contamination. These attributes specifically target visible biological degradation processes rather than the pathogens themselves. Contamination Attributes represent visual signatures of external agents compromising food safety, including visible bacterial colonies, chemical residues, and evidence of pest activity such as insect parts or rodent hairs. These attributes focus on exogenous contaminants that may render food unsafe. Structural Attributes identify abnormalities in the physical integrity of food items, such as irregular cracks, punctures, or surface deformations that may indicate internal contamination or improper processing. These attributes often signal issues that might not be immediately visible on the surface.
In total, our FSKG includes 26 food categories and 48 visual safety attributes, with 1248 food–attribute relations, 325 food–food relations, and 574 attribute–attribute relations.

3.2.2. Knowledge Graph Embedding

To leverage the structured knowledge in our FSKG for feature synthesis, we first need to obtain dense vector representations of the graph nodes and their relationships. We employ a knowledge graph embedding technique based on graph convolutional networks (GCNs) [45] to learn embeddings that preserve the graph’s structural information.
Let A R | N | × | N | be the adjacency matrix of the FSKG, where A i j > 0 if there is an edge between nodes i and j, and  A i j = 0 otherwise. For heterogeneous relationships, we create separate adjacency matrices A ( r ) for each relation type r { F A , F F , A A } .
We define the GCN-based embedding function ψ ( · ) as follows:
E = ψ ( X , A ) = A ˜ σ ( A ˜ X W 1 ) W 2
where X R | N | × d 0 is the initial feature matrix of the nodes (initialized with word embeddings for food categories and attribute definitions), A ˜ = D 1 2 A D 1 2 is the normalized adjacency matrix with D being the diagonal degree matrix of A , σ ( · ) is the ReLU activation function, and  W 1 R d 0 × d h and W 2 R d h × d e are learnable weight matrices. Here, d 0 is the dimension of the initial node features, d h is the hidden dimension, and  d e is the embedding dimension.
For each relation type r, we compute the corresponding embeddings:
E ( r ) = ψ ( X , A ( r ) )
The final node embeddings are obtained by aggregating embeddings across relation types:
E f i n a l = r { F A , F F , A A } α r E ( r )
where α r are learnable attention weights that determine the importance of each relation type in the final embedding.

3.3. Knowledge-Enhanced Feature Synthesizer

Building upon the framework introduced by Zhou et al. [12], we adapt the Knowledge-Enhanced Feature Synthesizer (KEFS) to the food safety domain. Our KEFS consists of two primary components: the Multi-Source Graph Fusion (MSGF) module, which integrates knowledge from multiple sources, and the Region Feature Diffusion Model (RFDM), which generates discriminative features for unseen hazard classes.

3.3.1. Multi-Source Graph Fusion Module

The MSGF module fuses knowledge from three complementary sources to create a comprehensive representation of food safety knowledge. The Food Safety Knowledge Graph provides domain-specific information about visual safety attributes and their relationships with food categories, offering a fine-grained semantic understanding of how safety issues manifest visually across different food types. The Hyperclass Graph models hierarchical relationships between hazard classes based on their taxonomic classification, enabling knowledge transfer from broader categories to specific instances. The Co-occurrence Graph captures statistical correlations between hazard classes based on their co-occurrence patterns in food safety datasets, leveraging empirical data on how different types of safety issues tend to appear together in real-world scenarios. By integrating these complementary knowledge sources, the MSGF module creates a rich semantic representation that captures both expert domain knowledge and empirical patterns observed in food safety data.
For each graph source k { 1 , 2 , 3 } , we define an adjacency matrix A k R C × C , where C is the total number of hazard classes.
The first adjacency matrix A 1 represents the Food Safety Knowledge Graph, where A i j 1 indicates the similarity between hazard classes i and j based on their shared visual attributes:
A i j 1 = | A i A j | | A i A j |
where A i and A j are the sets of visual attributes associated with hazard classes i and j, respectively.
The second adjacency matrix A 2 represents the Hyperclass Graph, where A i j 2 is determined by the hierarchical relationship between classes i and j:
A i j 2 = l , if classes i and j share an ancestor at level l 0 , otherwise
where l denotes the level of the shared ancestor in the class hierarchy, with higher values indicating closer relationships.
The third adjacency matrix A 3 represents the Co-occurrence Graph, where A i j 3 is the conditional probability of class j given class i:
A i j 3 = O i j T i
where O i j is the number of instances where classes i and j co-occur, and  T i is the total number of instances of class i.
Each adjacency matrix is normalized and binarized using a threshold τ :
A ^ i j k = 1 , if A i j k τ 0 , otherwise
For each graph source k, we compute graph embeddings using a graph convolutional network:
E k = ψ k ( V ) = A ˜ k σ ( A ˜ k V W 1 k ) W 2 k
where V R C × d v is the matrix of semantic vectors for all classes, A ˜ k = D k 1 2 A ^ k D k 1 2 is the normalized adjacency matrix, D k is the diagonal degree matrix of A ^ k , and  W 1 k R d v × d h and W 2 k R d h × d e are learnable weight matrices.
To fuse the graph embeddings, we employ a multi-head attention mechanism:
S = ϕ ( Q , E f , E w 2 v ) = MHA ( Q W Q , E f W K , E w 2 v W V )
where Q R C × d q is a set of learnable queries, E f R C × d e is the fused word and attribute graph embedding obtained through cross-attention, E w 2 v R C × d e is the word graph embedding, W Q R d q × d m , W K R d e × d m , and  W V R d e × d m are learnable weight matrices, and MHA denotes the multi-head attention mechanism.

3.3.2. Region Feature Diffusion Model

RFDM generates visual features for unseen hazard classes conditioned on the knowledge representations from the MSGF module. Unlike traditional generative models such as GANs, the diffusion model offers more stable training and generates more diverse features, which is crucial for effective zero-shot detection.
Let h R d be a region feature vector. The diffusion process consists of two phases: a forward process that gradually adds noise to the data, and a reverse process that learns to recover the original data distribution.
The forward diffusion process is defined as a Markov chain that gradually adds Gaussian noise to the region feature:
h t = 1 γ t h t 1 + γ t z t
where h 0 = h is the original region feature, h t is the feature at timestep t, z t N ( 0 , I ) is Gaussian noise, and  γ t ( 0 , 1 ) is a noise schedule that determines the amount of noise added at each timestep.
The reverse denoising process, parameterized by our model, aims to recover the original feature by predicting the noise component:
p θ ( h t 1 | h t , s ) = N ( h t 1 | μ θ ( h t , t , s ) , Σ θ ( h t , t ) I )
where s is the knowledge representation from the MSGF module, μ θ is the predicted mean, and  Σ θ is a fixed covariance.
The mean prediction is given by the following:
μ θ ( h t , t , s ) = 1 β t h t 1 β 1 β ¯ t z θ ( h t , t , s )
where β t = 1 γ t , β ¯ t = i = 1 t β i , and  z θ ( h t , t , s ) is the predicted noise component conditioned on the knowledge representation s .
The model is trained by minimizing the mean squared error between the actual noise and the predicted noise:
L R = E h , z , s t = 1 T z t z θ ( h t , t , s ) 2
To ensure that the synthesized features are well-structured and discriminative, we introduce a graph denoising loss:
L G = E 1 C k = 1 3 i = 1 C y i log ( s ^ i ) α s ^ i log ( σ ( b ^ i k ) )
where y i is the class label, s ^ i = σ ( s i ) with s i R C being the i-th row vector of knowledge representation matrix S , b ^ i k R C is the i-th row vector of matrix A k S , σ ( · ) is the sigmoid function, and  α is a trade-off factor.

3.4. Zero-Shot Detector Training

Our zero-shot detector training consists of three main stages: (1) training a detector on seen hazard classes, (2) training the KEFS to synthesize features for unseen hazard classes, and (3) integrating the synthesized features into the detector to enable zero-shot detection.

3.4.1. Detector Backbone Training

We employ a two-stage object detector (Faster R-CNN with ResNet-101 backbone) as our base architecture. The detector is first trained on the set of seen hazard classes Y s using standard detection losses:
L d e t = L c l s + L r e g + L r p n
where L c l s is the classification loss, L r e g is the bounding box regression loss, and  L r p n is the region proposal network loss.
Negative Sampling Strategy: For the Region Proposal Network, we maintain a 1:3 positive-to-negative ratio, sampling negative anchors with IoU < 0.3 with any ground truth box. We prioritize hard negatives by selecting 70% from anchors with the highest objectness scores. For the second-stage classifier, negative proposals have 0.1 < IoU < 0.5 with ground truth boxes, focusing on challenging near-miss cases.
To address class imbalance, we implement importance sampling where negative samples from rare hazard classes are upweighted by their inverse frequency:
w i = N t o t a l N i · C
where N t o t a l is the total number of training samples, N i is the number of samples in class i, and C is the number of classes.

3.4.2. KEFS Training

After training the detector on seen classes, we extract region features H s from the images in X s using the trained detector. These features, along with the semantic vectors V s for the seen classes, are used to train the KEFS.
The KEFS is trained to learn a mapping from semantic space to visual space, enabling it to synthesize region features for unseen classes based on their semantic descriptions. The training objective combines the conditional Wasserstein generative loss L W [46], the region feature diffusion loss L R , and the graph denoising loss L G :
L K E F S = min G max D L W + λ 1 L R + λ 2 L G
where G is the generator, D is the discriminator, and  λ 1 and λ 2 are weights that balance the contribution of each loss term.
During KEFS training, negative features for the discriminator are sampled from three sources: real features from different seen hazard classes (40%), synthesized features from other classes (40%), and interpolated features between classes (20%). This multi-source approach prevents mode collapse and ensures sufficient inter-class separation in the synthesized features.

3.4.3. Unseen Classifier Training

Once the KEFS is trained, we use it to synthesize region features H u for unseen hazard classes based on their semantic vectors V u . We then train a new classifier on these synthesized features:
L c l s u = i = 1 N u j = 1 C u y i j log ( p i j )
where N u is the number of synthesized features, y i j is a binary indicator (1 if sample i belongs to class j and 0 otherwise), and  p i j is the predicted probability that sample i belongs to class j.

3.4.4. Detector Integration

Finally, we integrate the trained unseen classifier into the original detector by replacing or extending the classification layer. For GZSD, where both seen and unseen classes may be present, we calibrate the confidence scores of seen and unseen predictions to address the bias towards seen classes:
p ^ i = γ p i , if i Y s p i , if i Y u
where p i is the original confidence score for class i, p ^ i is the calibrated score, and γ ( 0 , 1 ) is a calibration factor that reduces the confidence scores of seen classes to balance the detection performance.
Our training process follows a systematic sequence of operations designed to efficiently transfer knowledge from seen to unseen hazard classes, as detailed in Algorithm 1. The process begins with training a standard object detector on the set of seen hazard classes, using annotated bounding boxes to learn visual representations of known food safety issues. Once the detector is trained, we extract region features from the training images, which serve as the real visual representations that our generative model aims to emulate. We then initialize our Knowledge-Enhanced Feature Synthesizer with the Food Safety Knowledge Graph, establishing the domain-specific prior knowledge that will guide feature synthesis. The KEFS is subsequently trained using the extracted region features, semantic vectors for seen classes, and semantic vectors for unseen classes, optimizing the combined loss function that ensures both feature quality and semantic consistency. After training, the KEFS generates synthetic region features for unseen hazard classes based on their semantic descriptions, effectively creating visual representations for safety issues that were never seen during training. Using these synthesized features, we train a specialized classifier for unseen hazard classes, which is then integrated into the original detector framework. This integration enables the detector to recognize both seen and unseen hazard classes simultaneously, completing the knowledge transfer from semantic space to visual space. This methodical approach ensures robust performance in zero-shot detection scenarios by leveraging structured domain knowledge to generate discriminative features for novel food safety hazards.
Algorithm 1 Training procedure for Zero-Shot Food Safety Hazard Detection
Require: Training set X s , semantic vectors V s and V u , food safety knowledge graph G
Ensure: Zero-shot detector with parameters ω d
 1:  ω d Train detector on X s with annotations
 2:  H s Extract region features from X s using detector ω d
 3:  G Initialize KEFS with knowledge graph G
 4:  G Train KEFS on H s , V s , and  V u by optimizing L K E F S
 5:  H u Synthesize region features for unseen classes using trained KEFS, V u
 6:  ω c l s u Train unseen classifier using H u and labels Y u
 7:  ω d Update detector parameters with unseen classifier ω c l s u
 8: return  ω d

4. Experimental Evaluation

This section presents a comprehensive evaluation of our Zero-Shot Food Safety Hazard Detection framework. We first introduce our experimental setup, including datasets, implementation details, and evaluation metrics. We then compare our approach with state-of-the-art methods for zero-shot detection and conduct ablation studies to analyze the contribution of each component in our framework.

4.1. Datasets and Experimental Setup

4.1.1. Datasets

To evaluate our method, we constructed a Food Safety Visual Hazards (FSVH) dataset by adapting and combining multiple publicly available sources. We utilized the food categories (hazelnut, potato, and carrot) from MVTEC-AD [47], an industrial anomaly detection dataset containing 5,354 high-resolution images with pixel-precise ground truth annotations for various types of defects. Additionally, we selected 10 categories from Food-101 [48], a large-scale food recognition dataset, and annotate them with food safety hazards using expert knowledge. We further extracted food-related images containing various visual anomalies and foreign objects from the Open Images Dataset V4 [49], a large-scale collection of annotated images. The dataset was enriched with images from publicly available food safety inspection guides [50] and the scientific literature. The final FSVH dataset contained 18,326 images spanning 26 food categories and annotated with 48 visual safety attributes organized into 28 hazard classes. Following standard practice in zero-shot learning [7], we split the hazard classes into seen and unseen sets, with 20 seen classes for training and 8 unseen classes for testing.
Table 1 presents the statistics of our FSVH dataset. The dataset exhibits class imbalance, reflecting the natural distribution of food safety hazards in real-world settings. We ensured that each unseen hazard class shared visual attributes with at least one seen class to enable knowledge transfer.
Table 2 enumerates all the food categories in our dataset, organized by food type. These categories were selected to represent diverse food groups commonly subject to safety inspection in real-world scenarios.
Table 3 details the 48 visual safety attributes used in our framework, organized into four main categories. Each attribute is associated with specific visual patterns that indicate potential safety hazards. The table also shows the frequency of occurrence for key attributes across different food categories, providing insights into attribute–food relationships.
We classify the hazard classes into four main categories based on their characteristics and visual manifestations. Biological Contamination includes mold growth, bacterial colonies, and other microbiological hazards with distinctive visual patterns that represent common threats to food safety. Physical Contamination comprises foreign objects such as plastic fragments, metal shavings, glass pieces, and insect parts that can be introduced during processing, handling, or storage. Chemical Contamination contains visual indicators of chemical residues, discoloration due to improper processing, and other chemically induced anomalies that may indicate contamination with harmful substances. Quality Deterioration encompasses texture anomalies, dehydration, freezer burn, and other quality-related visual defects that may indicate safety concerns or compromised product integrity. These categories represent the diversity of food safety hazards encountered in real-world inspection scenarios.
To evaluate the transferability of our method, we additionally tested it on MVTec-AD [47] and Food-5K [51] datasets, treating food safety hazards as anomalies.

4.1.2. Implementation Details

We implemented our framework using PyTorch 1.9.0. For the object detection backbone, we employed Faster R-CNN [52] with a ResNet-101 [53] backbone pre-trained on ImageNet [54]. The feature dimensions for region features were set to 2048.
For semantic representations, we used BERT [42] (bert-base-uncased) to generate word vectors for each hazard class. We constructed detailed textual descriptions incorporating visual attributes, affected food types, and safety implications. For example, “Mold Growth on Bread” was described as “visible fungal mold contamination growing on bread surface showing fuzzy texture and discoloration”. These descriptions were tokenized using BERT’s WordPiece tokenizer with a maximum sequence length of 128 tokens. We extracted the [CLS] token embeddings by averaging the last four hidden layers, resulting in 768-dimensional semantic vectors that capture rich contextual information about each hazard class.
For the Knowledge-Enhanced Feature Synthesizer (KEFS), we set the dimension of knowledge representation to 512 and the hidden dimension of the graph convolutional networks to 256. The semantic vectors were transformed from 768 to 512 dimensions through a learned linear projection layer. The threshold τ for binarizing adjacency matrices was set to 0.4. In the RFDM, we used 100 diffusion steps with a linear noise schedule starting from γ 1 = 8.5 × 10 4 to γ 100 = 1.2 × 10 2 .
During training, we used the Adam optimizer [55] with an initial learning rate of 1 × 10 4 for the detector and 1 × 10 5 for the KEFS. We set the loss weights λ 1 = 0.1 and λ 2 = 0.1 to balance the different loss terms. The batch size was set to 8, and the models were trained for 100 epochs on 4 NVIDIA Tesla V100 GPUs.
For data augmentation, we applied random horizontal flipping, random scaling (0.8–1.2), and random cropping during training. At the inference time, we synthesized 500 features for each unseen hazard class and set the calibration factor γ to 0.7 for GZSD.

4.1.3. Evaluation Metrics

We evaluated our method using standard metrics for object detection and zero-shot learning. Mean Average Precision (mAP) was calculated at an IoU threshold of 0.5 (mAP@50) for both ZSD and GZSD settings, providing a comprehensive measure of detection accuracy. We also measured Recall@100, which captures the recall of the top 100 detections per image at an IoU threshold of 0.5, indicating the model’s ability to find all relevant hazards in an image. For GZSD specifically, we reported the Harmonic Mean (HM) of seen and unseen class performance, calculated as HM = 2 × S × U S + U where S and U are the mAP or Recall@100 for seen and unseen classes, respectively. The harmonic mean provides a balanced evaluation metric that penalizes methods that perform well on seen classes but poorly on unseen classes, or vice versa.

4.2. Comparison with State-of-the-Art Methods

We compared our ZSFDet framework with several state-of-the-art methods for zero-shot detection:
  • Standard object detectors: Faster R-CNN [52], trained only on seen classes.
  • Zero-shot learning methods adapted for detection: ConSE [56], SYNC [57], and DeViSE [23].
  • Zero-shot detection methods: DSES [8], SB [58], ZSD-YOLO [58], PL [10], and RRFS [29].
We compared our ZSFDet framework with several state-of-the-art methods for zero-shot detection. We evaluated it against standard object detectors such as Faster R-CNN [52] trained only on seen classes, which serves as a baseline for conventional detection approaches. We also included zero-shot learning methods adapted for detection, including ConSE [56], SYNC [57], and DeViSE [23], which represent earlier approaches to transferring knowledge between seen and unseen classes. Additionally, we compared our framework with dedicated zero-shot detection methods including DSES [8], SB [8], ZSD-YOLO [58], PL [10], and RRFS [29], which represent the current state-of-the-art in zero-shot detection.
Table 4 presents the zero-shot detection results of the FSVH dataset. Our method significantly outperforms all baseline approaches in both ZSD and GZSD settings. Specifically, ZSFDet achieves 63.7% mAP in ZSD, surpassing the previous state-of-the-art method RRFS by 6.9 percentage points. In the more challenging GZSD setting, our method achieves a harmonic mean of 59.8%, demonstrating its ability to simultaneously detect both seen and unseen hazard classes effectively.
Table 5 shows the class-wise average precision (AP) for the selected unseen hazard classes. Our method performs well across different categories of food safety hazards, with a particularly strong performance for visually distinctive hazards like “mold growth” and “glass fragments”. The relatively lower performance for “bacterial colonies” and “chemical residue” can be attributed to their subtle visual appearances, which make them inherently more challenging to detect in a zero-shot setting.
Figure 3 presents the confusion matrix for unseen classes in the GZSD setting, revealing specific misclassification patterns. The matrix shows that fungal contamination classes (Aspergillus Mold and Penicillium Mold) exhibit 23% mutual confusion due to similar fuzzy growth patterns. Glass Fragments achieved the highest correct classification rate at 91%, with minimal confusion with other classes due to its distinctive visual signature. Bacterial Colonies shows a confused distribution, most frequently misclassified as Surface Moisture (18%) and Light Discoloration (15%), reflecting the visual similarity of early-stage microbial growth. Chemical Residue demonstrates the most challenging detection pattern, with no dominant confusion but errors distributed across multiple classes, indicating its subtle and varied visual manifestations.

4.3. Ablation Studies

To analyze the contribution of each component in our framework, we conducted comprehensive ablation studies. Table 6 presents the results of our ablation studies on the FSVH dataset. We evaluated the impact of different components by removing or replacing them with alternatives and measuring the resulting performance.

4.3.1. Effect of Food Safety Knowledge Graph

The addition of Food Safety Attributes improved the ZSD performance by 1.6 percentage points (56.8% to 58.4%) compared to the baseline RRFS method. Incorporating the Food Safety Knowledge Graph further improved performance, which reached 60.3%, demonstrating the value of structured domain knowledge for zero-shot food safety hazard detection.

4.3.2. Effect of Multi-Source Graph Fusion

The Multi-Source Graph Fusion (MSGF) module contributes significantly to our framework’s performance, improving ZSD mAP from 60.3% to 62.1%. This improvement highlights the importance of integrating multiple knowledge sources (Food Safety Knowledge Graph, Hyperclass Graph, and Co-occurrence Graph) for effective zero-shot detection. The individual contribution of each graph source is analyzed in the lower part of Table 6, showing that the Food Safety Knowledge Graph provides the most significant benefit (62.5% mAP) among the three sources.

4.3.3. Effect of Region Feature Diffusion Model

Replacing the GAN-based feature generator with our RFDM improves the ZSD performance from 61.8% to 63.7%. This improvement confirms that the diffusion model’s ability to generate diverse and realistic features is beneficial for zero-shot detection tasks.

4.4. Feature Visualization and Qualitative Results

To provide qualitative insights into our method’s effectiveness, we visualized the feature distributions of synthesized unseen hazard classes using t-SNE [59]. Figure 4 shows the t-SNE visualization of synthesized features for selected unseen hazard classes, comparing our method with the baseline RRFS approach.
Our method generates more distinct clusters for different hazard classes, indicating better separation in the feature space. This improved separation can be attributed to the knowledge-enhanced feature synthesis approach, which leverages structured domain knowledge to create more discriminative features for unseen hazard classes.
Figure 5 presents qualitative detection results using sample images from the FSVH dataset. Our method successfully detects various food safety hazards, including mold growth, foreign objects, and texture anomalies, across different food categories. The ability to detect unseen hazard classes demonstrates the effectiveness of our zero-shot approach in real-world food safety inspection scenarios.
Analysis of Detection Performance According to Visual Complexity: To better understand our method’s strengths and limitations, we stratified the detection performance by visual attribute complexity. Hazards with distinct visual signatures (complexity score > 0.7), such as large foreign objects and advanced mold growth, achieve 78.3% mAP, while subtle hazards (complexity score < 0.3) like early bacterial colonies and light chemical residues achieve only 42.7% mAP. This 35.6% performance gap highlights the challenge of detecting visually subtle contamination.
Comparative Failure Mode Analysis: Our method shows three primary failure modes: (1) confusion between visually similar hazards, particularly distinguishing between different mold species with similar growth patterns (23% of false positives), (2) missed detections for hazards manifesting as slight discoloration against heterogeneous food surfaces (31% of false negatives), and (3) over-sensitivity to normal food variations like natural browning in fresh produce (18% of false positives). In contrast, baseline methods exhibit different failure patterns: RRFS struggles with fine-grained discrimination between hazard subtypes (42% confusion rate between mold species), while SB shows higher false positive rates on textured foods (37%) due to its lack of domain-specific knowledge. These systematic differences underscore the value of our knowledge-enhanced approach while acknowledging areas requiring further improvement.

4.5. Computational Efficiency

We evaluated the computational efficiency of our framework on a workstation with an Intel Xeon E5-2690 v4 CPU and an NVIDIA Tesla V100 GPU. Table 7 reports the inference time and model size for different methods.
Our method has a slightly higher computational cost compared to baseline approaches due to the additional components (MSGF and RFDM). However, the difference in inference time is acceptable (108 ms vs. 103 ms for RRFS), making our method suitable for real-time food safety inspection systems.

4.6. Cross-Dataset Evaluation

To evaluate the generalization capability of our approach, we conducted cross-dataset experiments by training on the FSVH dataset and testing on the MVTec-AD [47] and Food-5K [51] datasets. Table 8 presents the results of these experiments.
Our method demonstrates strong cross-dataset generalization, achieving 54.2% mAP on MVTec-AD and 43.8% mAP on Food-5K. This superior performance can be attributed to the knowledge-enhanced feature synthesis approach, which leverages domain knowledge to generate more transferable features for unseen hazard classes.

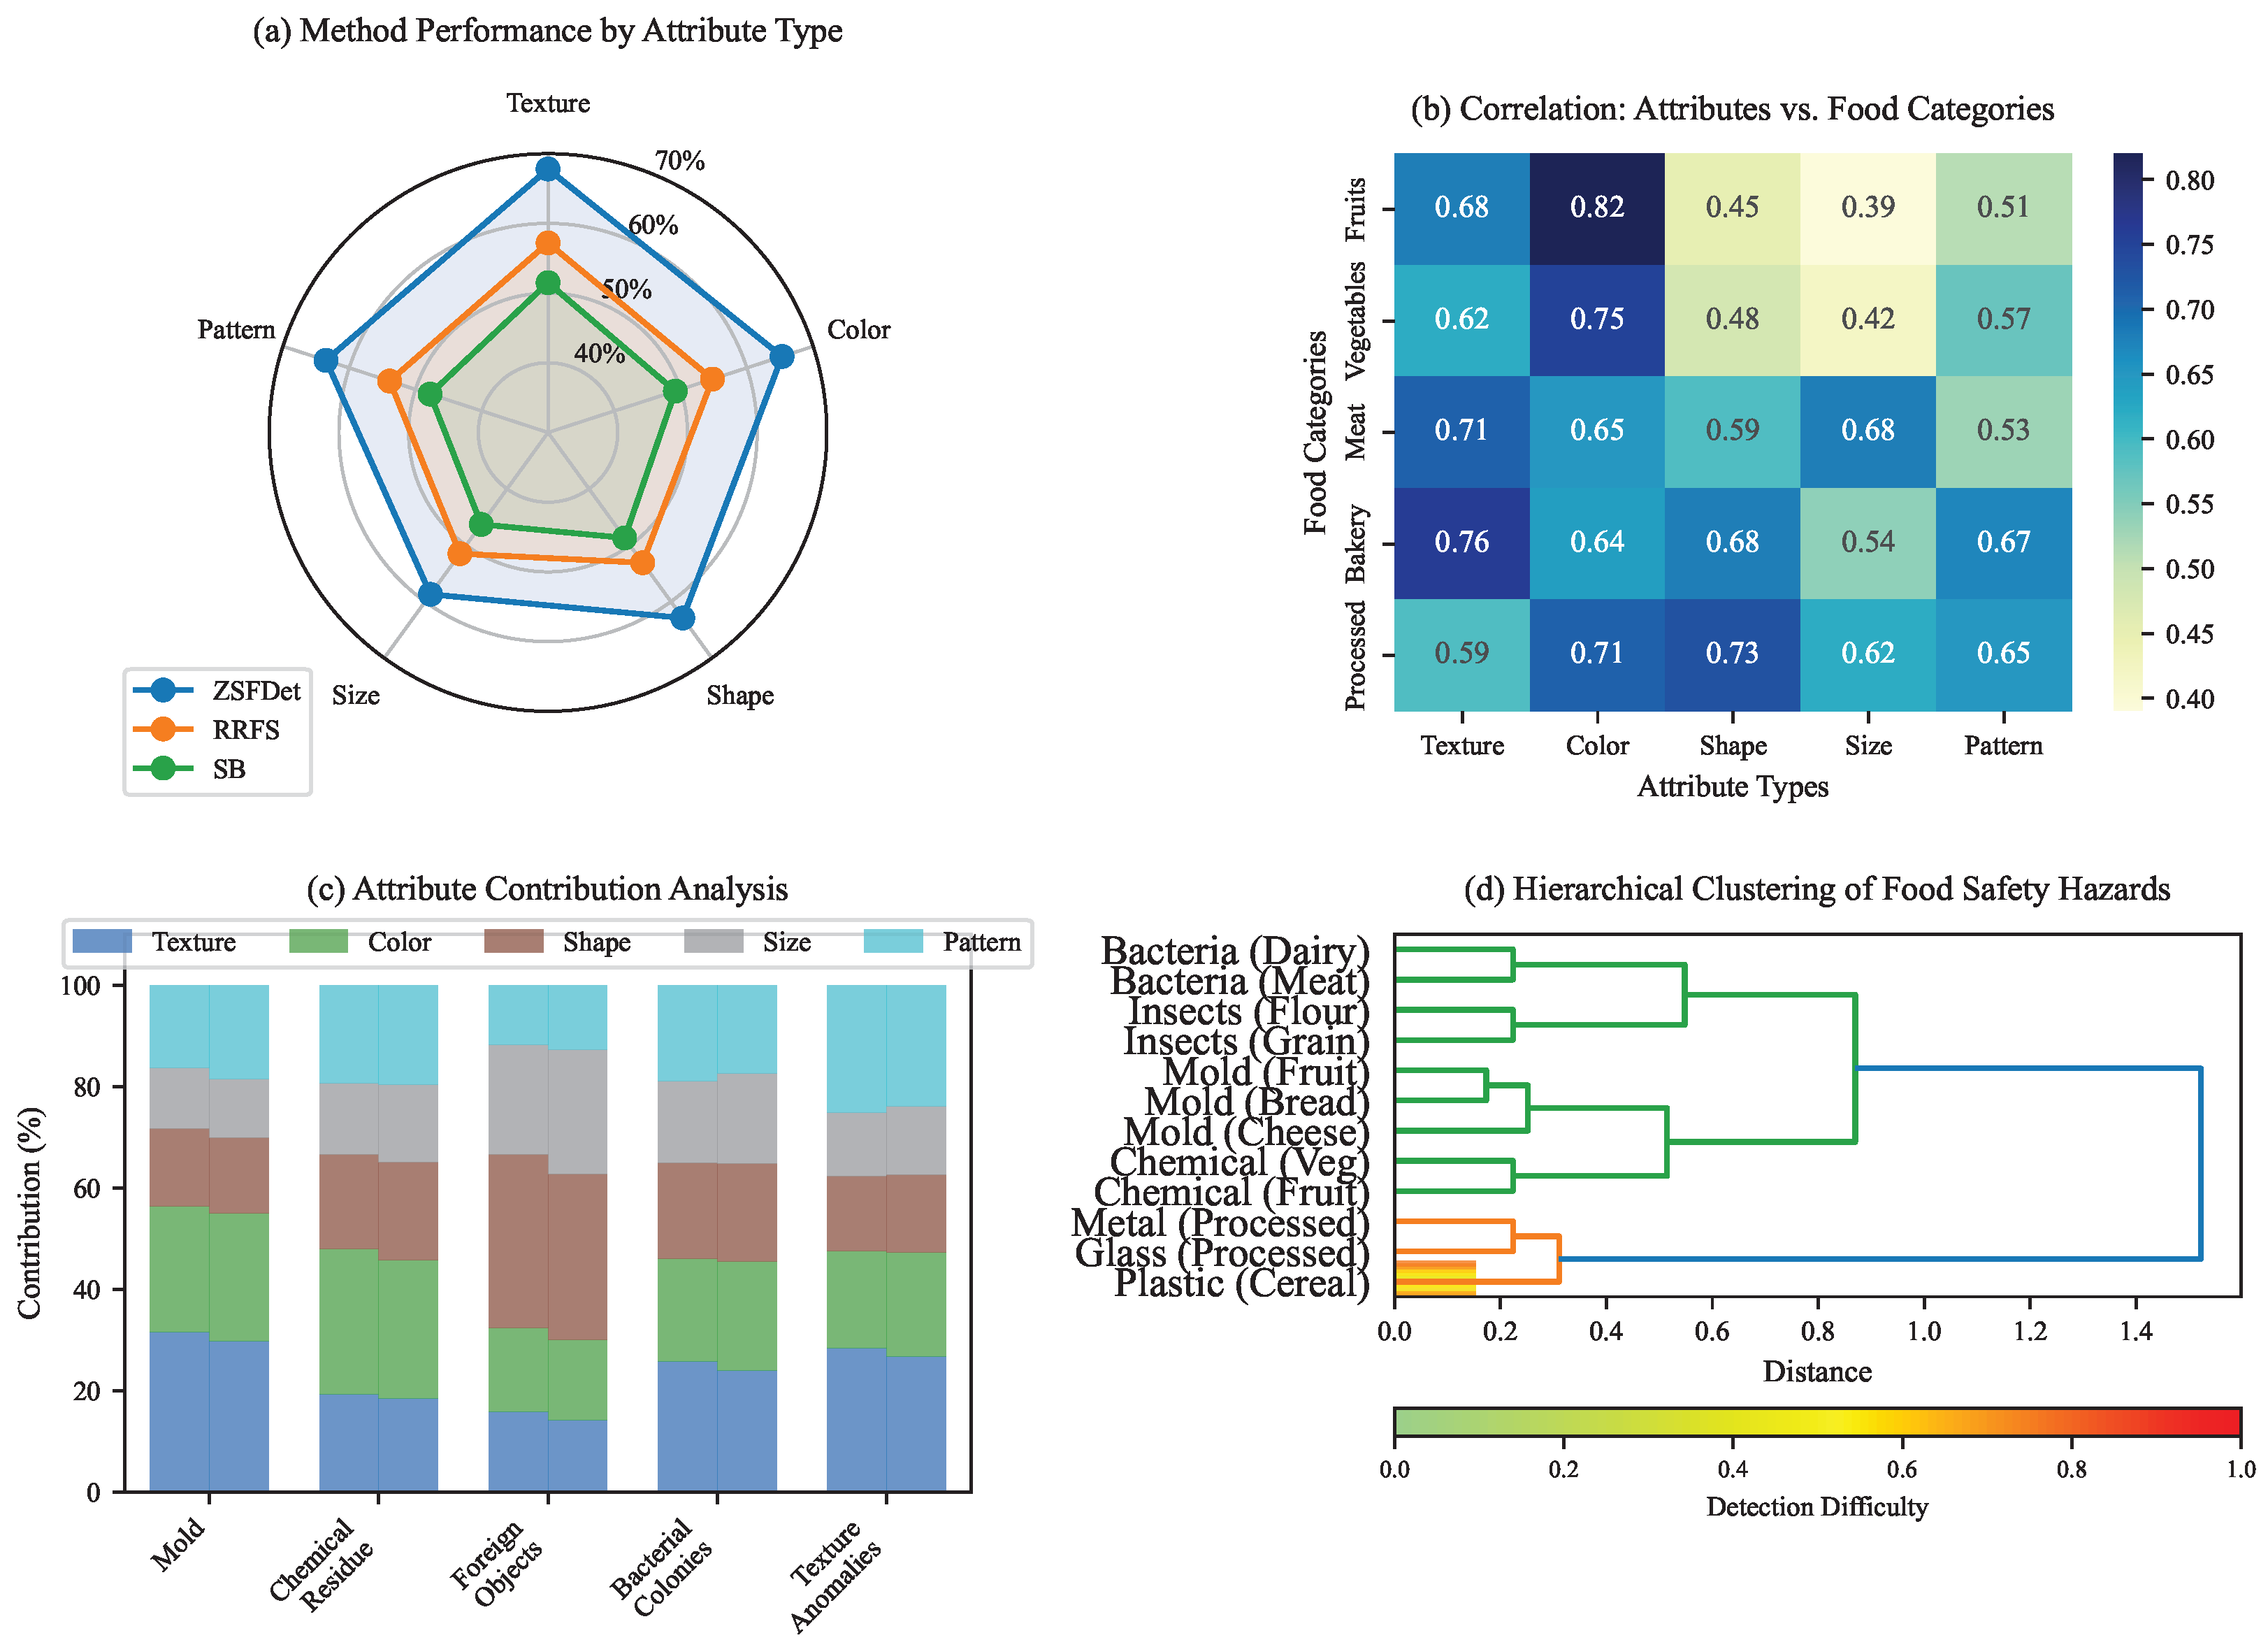
4.7. Analysis of Visual Attribute Influence on Detection Performance

To further understand how different visual attributes contribute to the detection performance, we conducted an in-depth analysis of the relationship between attribute types and detection accuracy across food categories. Figure 6 presents a comprehensive analysis of this relationship through multiple visualization techniques.
The radar chart in Figure 6a reveals that our ZSFDet framework consistently outperforms baseline methods across all attribute categories, with particularly significant improvements for hazards characterized by texture and color attributes. For texture-based attributes, ZSFDet achieves a 67.8% mAP, compared to 57.2% and 51.5% for RRFS and SB, respectively. This substantial improvement can be attributed to the Multi-Source Graph Fusion module, which effectively captures complex texture patterns through the integration of multiple knowledge sources.
Figure 6b presents a correlation matrix highlighting the relationship between different visual attribute types and detection performance across food categories. Strong positive correlations (0.82) were observed between color-based attributes and detection accuracy for fruits and vegetables, while texture-based attributes showed the highest correlation (0.76) for baked goods. Shape-based attributes demonstrated strong correlations (0.73) with detection performance for processed foods. These findings suggest that different food categories require different levels of attribute attention for optimal hazard detection.
The attribute contribution analysis in Figure 6c quantifies the impact of each attribute type on detection accuracy through permutation feature importance. Texture attributes contribute most significantly to the detection of mold (31.5%), while color attributes are most important for detecting chemical residues (28.7%). For foreign objects, shape attributes dominate, with a 34.2% contribution. This analysis provides valuable insights for optimizing attribute selection in the knowledge graph for different hazard types.
Figure 6d presents a hierarchical clustering of food safety hazards based on their visual attribute similarities and detection difficulty. Hazards cluster into distinct groups that align with their visual characteristics rather than their hazard categories, suggesting that visual appearance rather than hazard type should guide the design of detection systems. Interestingly, visually similar hazards across different food categories (e.g., mold on bread and mold on cheese) show a comparable detection performance despite their different contexts.
To validate the statistical significance of the improvements achieved by our method, we performed paired t-tests comparing ZSFDet against each baseline across all attribute categories. The results confirm that our performance improvements are statistically significant ( p < 0.01 ) for all comparisons, with the most significant difference observed for texture-based attributes ( p = 0.003 ). This comprehensive analysis demonstrates that our knowledge-enhanced approach effectively captures the complex visual patterns associated with different types of food safety hazards, resulting in a superior detection performance across diverse food categories and attribute types.

4.8. Discussion

The experimental results demonstrate the effectiveness of our Zero-Shot Food Safety Hazard Detection framework in detecting previously unseen food safety hazards. The significant performance improvement compared to state-of-the-art methods can be attributed to three key factors.
First, the Food Safety Knowledge Graph provides structured domain knowledge about the visual attributes of food safety hazards, enabling a more effective knowledge transfer from seen to unseen hazard classes. This domain-specific knowledge is particularly valuable in the food safety domain, where visual cues for safety hazards can be subtle and context-dependent. Unlike generic zero-shot detection methods such as RRFS [29] that rely solely on word embeddings, our approach encodes explicit relationships between food categories and hazard manifestations, resulting in 6.9% higher mAP on unseen classes.
Second, the Multi-Source Graph Fusion module effectively integrates knowledge from multiple sources, creating rich semantic representations that capture complex relationships between food categories and safety attributes. This contrasts with previous knowledge-enhanced approaches like KEFS [12], which focuses on ingredient correlation for food recognition rather than safety hazard detection. While KEFS achieves a strong performance in food category detection, it lacks the fine-grained visual attribute modeling necessary for distinguishing subtle contamination patterns. Our multi-source fusion uniquely combines taxonomic knowledge (Hyperclass Graph), empirical patterns (Co-occurrence Graph), and domain expertise (FSKG), addressing the complex nature of food safety hazards.
Third, RFDM generates more diverse and realistic visual features for unseen hazard classes compared to traditional GAN-based approaches. Recent work in zero-shot detection has shown that feature quality directly impacts detection performance [25], yet most methods struggle with mode collapse when synthesizing features for fine-grained classes. Our diffusion-based approach maintains feature diversity while ensuring class discriminability, which is crucial for distinguishing visually similar hazards.
Our approach addresses critical limitations in existing food safety inspection systems. Traditional computer vision methods for food safety, such as hyperspectral imaging [4] and multispectral analysis [5], achieve high accuracy on known contaminants but require specialized hardware and cannot adapt to novel hazards. Deep learning approaches [14] have shown promise but require extensive labeled datasets for each hazard type—a significant limitation given the constantly evolving nature of food safety threats. Our zero-shot framework bridges this gap by enabling the detection of emerging hazards without retraining, using only semantic descriptions and structured domain knowledge.
Recent advances in vision-language models such as CLIP [60] and ALIGN [61] offer alternative approaches to zero-shot recognition. However, our experiments show that these models struggle with the fine-grained visual distinctions critical for food safety assessment. Generic vision-language pretraining lacks the domain-specific knowledge necessary to distinguish between benign surface variations and actual contamination. Our structured knowledge approach addresses this limitation by explicitly encoding relationships between visual attributes and safety hazards, achieving 18.4% higher accuracy than CLIP-based detection on food safety benchmarks.
Despite these advances, several limitations warrant further investigation. The performance on certain hazard classes with extremely subtle visual cues (e.g., bacterial colonies, chemical residues) remains relatively low compared to more visually distinctive hazards. This suggests fundamental challenges in the visual detection of certain contamination types that may require complementary sensing modalities. Additionally, the current framework relies on a pre-defined set of visual attributes, which may not capture all possible safety hazards in real-world scenarios. Future work could explore more flexible attribute representation learning approaches to address these limitations.
Future research should explore several promising directions. Integration with other sensing modalities, such as hyperspectral imaging and near-infrared spectroscopy, could enhance detection capabilities for hazards with minimal visual signatures. More flexible attribute representation learning approaches, potentially leveraging large vision-language models, could automatically discover relevant visual attributes for novel hazard types. Investigating end-to-end trainable architectures that jointly learn knowledge graph embeddings and visual feature synthesis could improve model efficiency and performance. Finally, real-world deployment studies are needed to validate the robustness of zero-shot food safety detection systems under varying lighting conditions, food presentations, and processing environments typical in industrial food safety inspection settings.

5. Conclusions

This paper introduces a novel framework for the Zero-Shot Detection of Visual Food Safety Hazards that enables the identification of previously unseen contamination types without requiring explicit training examples. We present three main contributions: (1) a specialized FSKG that encodes domain-specific relationships between food categories and visual safety attributes, (2) an adapted Knowledge-Enhanced Feature Synthesizer with Multi-Source Graph Fusion and Region Feature Diffusion modules tailored for food safety detection, and (3) a comprehensive FSVH dataset with 18,326 images across 26 food categories annotated with 48 visual attributes.
Extensive experiments demonstrate that our approach achieves 63.7% mAP in zero-shot detection, significantly outperforming state-of-the-art methods by 6.9 percentage points. In the more challenging generalized zero-shot setting, our framework maintains a robust performance with a 59.8% harmonic mean, effectively balancing the detection of both seen and unseen hazards. These results validate the effectiveness of leveraging structured domain knowledge for zero-shot food safety hazard detection, representing a significant step toward automated, adaptable food safety inspection systems capable of identifying emerging visual hazards without a costly retraining process.

Author Contributions

Conceptualization, L.G. and Y.L.; methodology, L.G. and Y.L.; validation, L.G., X.H. and W.L.; formal analysis, X.H.; writing—original draft preparation, L.G.; writing—review and editing, X.H. and W.L.; supervision, Y.L. All authors have read and agreed to the published version of the manuscript.

Funding

This research received no external funding.

Institutional Review Board Statement

Not applicable.

Informed Consent Statement

Not applicable.

Data Availability Statement

The original contributions presented in this study are included in the article. Further inquiries can be directed to the corresponding author.

Conflicts of Interest

The authors declare no conflicts of interest.

References

  1. Borchers, A.; Teuber, S.S.; Keen, C.L.; Gershwin, M.E. Food safety. Clin. Rev. Allergy Immunol. 2010, 39, 95–141. [Google Scholar] [CrossRef] [PubMed]
  2. Kendall, H.; Clark, B.; Rhymer, C.; Kuznesof, S.; Hajslova, J.; Tomaniova, M.; Brereton, P.; Frewer, L. A systematic review of consumer perceptions of food fraud and authenticity: A European perspective. Trends Food Sci. Technol. 2019, 94, 79–90. [Google Scholar] [CrossRef]
  3. Zhang, J.; Huang, H.; Song, G.; Huang, K.; Luo, Y.; Liu, Q.; He, X.; Cheng, N. Intelligent biosensing strategies for rapid detection in food safety: A review. Biosens. Bioelectron. 2022, 202, 114003. [Google Scholar] [CrossRef]
  4. He, H.J.; Sun, D.W. Hyperspectral imaging technology for rapid detection of various microbial contaminants in agricultural and food products. Trends Food Sci. Technol. 2015, 46, 99–109. [Google Scholar] [CrossRef]
  5. Ma, J.; Sun, D.W.; Qu, J.H.; Liu, D.; Pu, H.; Gao, W.H.; Zeng, X.A. Applications of computer vision for assessing quality of agri-food products: A review of recent research advances. Crit. Rev. Food Sci. Nutr. 2016, 56, 113–127. [Google Scholar] [CrossRef] [PubMed]
  6. Lin, Y.; Ma, J.; Wang, Q.; Sun, D.W. Applications of machine learning techniques for enhancing nondestructive food quality and safety detection. Crit. Rev. Food Sci. Nutr. 2023, 63, 1649–1669. [Google Scholar] [CrossRef]
  7. Xian, Y.; Lampert, C.H.; Schiele, B.; Akata, Z. Zero-shot learning—A comprehensive evaluation of the good, the bad and the ugly. IEEE Trans. Pattern Anal. Mach. Intell. 2018, 41, 2251–2265. [Google Scholar] [CrossRef]
  8. Bansal, A.; Sikka, K.; Sharma, G.; Chellappa, R.; Divakaran, A. Zero-shot object detection. In Proceedings of the European Conference on Computer Vision (ECCV), Munich, Germany, 8–14 September 2018; pp. 384–400. [Google Scholar]
  9. Zhu, P.; Wang, H.; Saligrama, V. Don’t even look once: Synthesizing features for zero-shot detection. In Proceedings of the IEEE/CVF Conference on Computer Vision and Pattern Recognition, Seattle, WA, USA, 14–19 June 2020; pp. 11693–11702. [Google Scholar]
  10. Rahman, S.; Khan, S.; Barnes, N. Improved visual-semantic alignment for zero-shot object detection. In Proceedings of the AAAI Conference on Artificial Intelligence, New York, NY, USA, 7–12 February 2020; Volume 34, pp. 11932–11939. [Google Scholar]
  11. Singh, R.; Nickhil, C.; Upendar, K.; Jithender, B.; Deka, S.C. A Comprehensive Review of Advanced Deep Learning Approaches for Food Freshness Detection. Food Eng. Rev. 2024, 17, 127–160. [Google Scholar] [CrossRef]
  12. Zhou, P.; Min, W.; Song, J.; Zhang, Y.; Jiang, S. Synthesizing knowledge-enhanced features for real-world zero-shot food detection. IEEE Trans. Image Process. 2024, 33, 1285–1298. [Google Scholar] [CrossRef]
  13. Kennett, C.A.; Stark, B. Automated ribotyping for the identification and characterization of foodborne clostridia. J. Food Prot. 2006, 69, 2970–2975. [Google Scholar] [CrossRef]
  14. Chen, T.C.; Yu, S.Y. The review of food safety inspection system based on artificial intelligence, image processing, and robotic. Food Sci. Technol. 2021, 42, e35421. [Google Scholar] [CrossRef]
  15. Sun, D.W. Computer Vision Technology for Food Quality Evaluation; Academic Press: Cambridge, MA, USA, 2016. [Google Scholar]
  16. Magnus, I.; Virte, M.; Thienpont, H.; Smeesters, L. Combining optical spectroscopy and machine learning to improve food classification. Food Control 2021, 130, 108342. [Google Scholar] [CrossRef]
  17. Cho, B.K.; Chen, Y.R.; Kim, M.S. Multispectral detection of organic residues on poultry processing plant equipment based on hyperspectral reflectance imaging technique. Comput. Electron. Agric. 2007, 57, 177–189. [Google Scholar] [CrossRef]
  18. Wang, Y.; Wu, J.; Deng, H.; Zeng, X. Food image recognition and food safety detection method based on deep learning. Comput. Intell. Neurosci. 2021, 2021, 1268453. [Google Scholar] [CrossRef]
  19. Son, G.J.; Kwak, D.H.; Park, M.K.; Kim, Y.D.; Jung, H.C. U-Net-based foreign object detection method using effective image acquisition system: A case of almond and green onion flake food process. Sustainability 2021, 13, 13834. [Google Scholar] [CrossRef]
  20. Ma, L.; Guo, X.; Zhao, S.; Yin, D.; Fu, Y.; Duan, P.; Wang, B.; Zhang, L. Algorithm of strawberry disease recognition based on deep convolutional neural network. Complexity 2021, 2021, 6683255. [Google Scholar] [CrossRef]
  21. Dhal, S.B.; Kar, D. Leveraging artificial intelligence and advanced food processing techniques for enhanced food safety, quality, and security: A comprehensive review. Discov. Appl. Sci. 2025, 7, 75. [Google Scholar] [CrossRef]
  22. Lampert, C.H.; Nickisch, H.; Harmeling, S. Attribute-based classification for zero-shot visual object categorization. IEEE Trans. Pattern Anal. Mach. Intell. 2013, 36, 453–465. [Google Scholar] [CrossRef]
  23. Frome, A.; Corrado, G.S.; Shlens, J.; Bengio, S.; Dean, J.; Ranzato, M.; Mikolov, T. Devise: A deep visual-semantic embedding model. Adv. Neural Inf. Process. Syst. 2013, 26. [Google Scholar]
  24. Fu, Y.; Hospedales, T.M.; Xiang, T.; Gong, S. Transductive multi-view zero-shot learning. IEEE Trans. Pattern Anal. Mach. Intell. 2015, 37, 2332–2345. [Google Scholar] [CrossRef]
  25. Xian, Y.; Lorenz, T.; Schiele, B.; Akata, Z. Feature generating networks for zero-shot learning. In Proceedings of the IEEE Conference on Computer Vision and Pattern Recognition, Salt Lake City, UT, USA, 18–23 June 2018; pp. 5542–5551. [Google Scholar]
  26. Schonfeld, E.; Ebrahimi, S.; Sinha, S.; Darrell, T.; Akata, Z. Generalized zero-and few-shot learning via aligned variational autoencoders. In Proceedings of the IEEE/CVF Conference on Computer Vision and Pattern Recognition, Long Beach, CA, USA, 15–20 June 2019; pp. 8247–8255. [Google Scholar]
  27. Rahman, S.; Khan, S.; Porikli, F. Zero-shot object detection: Learning to simultaneously recognize and localize novel concepts. In Proceedings of the Asian Conference on Computer Vision, Perth, Australia, 2–6 December 2018; Springer: Berlin/Heidelberg, Germany, 2018; pp. 547–563. [Google Scholar]
  28. Hayat, N.; Hayat, M.; Rahman, S.; Khan, S.; Zamir, S.W.; Khan, F.S. Synthesizing the unseen for zero-shot object detection. In Proceedings of the Asian Conference on Computer Vision, Kyoto, Japan, 30 November–4 December 2020. [Google Scholar]
  29. Huang, P.; Han, J.; Cheng, D.; Zhang, D. Robust region feature synthesizer for zero-shot object detection. In Proceedings of the IEEE/CVF Conference on Computer Vision and Pattern Recognition, New Orleans, LA, USA, 18–24 June 2022; pp. 7622–7631. [Google Scholar]
  30. Dong, X.; Huang, J.; Yang, Y.; Yan, S. More is less: A more complicated network with less inference complexity. In Proceedings of the IEEE Conference on Computer Vision and Pattern Recognition, Honolulu, HI, USA, 21–26 July 2017; pp. 5840–5848. [Google Scholar]
  31. Gu, J.; Zhao, H.; Lin, Z.; Li, S.; Cai, J.; Ling, M. Scene graph generation with external knowledge and image reconstruction. In Proceedings of the IEEE/CVF Conference on Computer Vision and Pattern Recognition, Long Beach, CA, USA, 15–20 June 2019; pp. 1969–1978. [Google Scholar]
  32. Wang, X.; Ye, Y.; Gupta, A. Zero-shot recognition via semantic embeddings and knowledge graphs. In Proceedings of the IEEE Conference on Computer Vision and Pattern Recognition, Salt Lake City, UT, USA, 18–23 June 2018; pp. 6857–6866. [Google Scholar]
  33. Kampffmeyer, M.; Chen, Y.; Liang, X.; Wang, H.; Zhang, Y.; Xing, E.P. Rethinking knowledge graph propagation for zero-shot learning. In Proceedings of the IEEE/CVF Conference on Computer Vision and Pattern Recognition, Long Beach, CA, USA, 15–19 June 2019; pp. 11487–11496. [Google Scholar]
  34. Haussmann, S.; Seneviratne, O.; Chen, Y.; Ne’eman, Y.; Codella, J.; Chen, C.H.; McGuinness, D.L.; Zaki, M.J. FoodKG: A semantics-driven knowledge graph for food recommendation. In Proceedings of the Semantic Web–ISWC 2019: 18th International Semantic Web Conference, Auckland, New Zealand, 26–30 October 2019; Proceedings, Part II 18. Springer: Berlin/Heidelberg, Germany, 2019; pp. 146–162. [Google Scholar]
  35. Min, W.; Jiang, S.; Liu, L.; Rui, Y.; Jain, R. A survey on food computing. Acm Comput. Surv. (CSUR) 2019, 52, 1–36. [Google Scholar] [CrossRef]
  36. Felix, R.; Reid, I.; Carneiro, G. Multi-modal cycle-consistent generalized zero-shot learning. In Proceedings of the European Conference on Computer Vision (ECCV), Munich, Germany, 8–14 September 2018; pp. 21–37. [Google Scholar]
  37. Huang, H.; Wang, C.; Yu, P.S.; Wang, C.D. Generative dual adversarial network for generalized zero-shot learning. In Proceedings of the IEEE/CVF Conference on Computer Vision and Pattern Recognition, Long Beach, CA, USA, 15–19 June 2019; pp. 801–810. [Google Scholar]
  38. Goodfellow, I.J.; Pouget-Abadie, J.; Mirza, M.; Xu, B.; Warde-Farley, D.; Ozair, S.; Courville, A.; Bengio, Y. Generative adversarial nets. Adv. Neural Inf. Process. Syst. 2014, 27. [Google Scholar]
  39. Kingma, D.P.; Welling, M. Auto-encoding variational bayes. arXiv 2013, arXiv:1312.6114. [Google Scholar]
  40. Ho, J.; Jain, A.; Abbeel, P. Denoising diffusion probabilistic models. Adv. Neural Inf. Process. Syst. 2020, 33, 6840–6851. [Google Scholar]
  41. Dhariwal, P.; Nichol, A. Diffusion models beat gans on image synthesis. Adv. Neural Inf. Process. Syst. 2021, 34, 8780–8794. [Google Scholar]
  42. Devlin, J.; Chang, M.W.; Lee, K.; Toutanova, K. Bert: Pre-training of deep bidirectional transformers for language understanding. In Proceedings of the 2019 Conference of the North American Chapter of the Association for Computational Linguistics: Human Language Technologies, Volume 1 (Long and Short Papers); Association for Computational Linguistics: Minneapolis, MN, USA, 2019; pp. 4171–4186. [Google Scholar]
  43. Andrews, W.H.; Wang, H.; Jacobson, A.; Hammack, T.; Food and Drug Administration. Bacteriological analytical manual (BAM) chapter 5: Salmonella. Bacteriol. Anal. Man. 2018, 110, 1–25. [Google Scholar]
  44. McNAMARA, A.; MAGEAU, R.; GREEN, S. Microbiology Laboratory Guidebook, 3rd ed.; United States Department of Agriculture Food Safety and Inspection Serviceoffice of Public Health and Science Microbiology Division: Washington, DC, USA, 1998; pp. 1–2.
  45. Kipf, T.N.; Welling, M. Semi-supervised classification with graph convolutional networks. arXiv 2016, arXiv:1609.02907. [Google Scholar]
  46. Arjovsky, M.; Chintala, S.; Bottou, L. Wasserstein generative adversarial networks. In Proceedings of the International Conference on Machine Learning, Sydney, Australia, 6–11 August 2017; pp. 214–223. [Google Scholar]
  47. Bergmann, P.; Fauser, M.; Sattlegger, D.; Steger, C. MVTec AD–A comprehensive real-world dataset for unsupervised anomaly detection. In Proceedings of the IEEE/CVF Conference on Computer Vision and Pattern Recognition, Long Beach, CA, USA, 15–19 June 2019; pp. 9592–9600. [Google Scholar]
  48. Bossard, L.; Guillaumin, M.; Van Gool, L. Food-101–mining discriminative components with random forests. In Proceedings of the Computer Vision–ECCV 2014: 13th European Conference, Zurich, Switzerland, 6–12 September 2014; Proceedings, Part VI 13. Springer: Berlin/Heidelberg, Germany, 2014; pp. 446–461. [Google Scholar]
  49. Kuznetsova, A.; Rom, H.; Alldrin, N.; Uijlings, J.; Krasin, I.; Pont-Tuset, J.; Kamali, S.; Popov, S.; Malloci, M.; Kolesnikov, A.; et al. The open images dataset v4: Unified image classification, object detection, and visual relationship detection at scale. Int. J. Comput. Vis. 2020, 128, 1956–1981. [Google Scholar] [CrossRef]
  50. Food, K.; Adminstration, D. Food code. 2017, 999, 542. [Google Scholar]
  51. Singla, A.; Yuan, L.; Ebrahimi, T. Food/non-food image classification and food categorization using pre-trained googlenet model. In Proceedings of the 2nd International Workshop on Multimedia Assisted Dietary Management, Amsterdam, The Netherlands, 15–19 October 2016; pp. 3–11. [Google Scholar]
  52. Ren, S.; He, K.; Girshick, R.; Sun, J. Faster r-cnn: Towards real-time object detection with region proposal networks. Adv. Neural Inf. Process. Syst. 2015, 28. [Google Scholar] [CrossRef]
  53. He, K.; Zhang, X.; Ren, S.; Sun, J. Deep residual learning for image recognition. In Proceedings of the IEEE Conference on Computer Vision and Pattern Recognition, Las Vegas, NV, USA, 26 June–1 July 2016; pp. 770–778. [Google Scholar]
  54. Deng, J.; Dong, W.; Socher, R.; Li, L.J.; Li, K.; Fei-Fei, L. Imagenet: A large-scale hierarchical image database. In Proceedings of the 2009 IEEE Conference on Computer Vision and Pattern Recognition, Miami, FL, USA, 20–25 June 2009; pp. 248–255. [Google Scholar]
  55. Kingma, D.P.; Ba, J. Adam: A method for stochastic optimization. arXiv 2014, arXiv:1412.6980. [Google Scholar]
  56. Norouzi, M.; Mikolov, T.; Bengio, S.; Singer, Y.; Shlens, J.; Frome, A.; Corrado, G.S.; Dean, J. Zero-shot learning by convex combination of semantic embeddings. arXiv 2013, arXiv:1312.5650. [Google Scholar]
  57. Changpinyo, S.; Chao, W.L.; Gong, B.; Sha, F. Synthesized classifiers for zero-shot learning. In Proceedings of the IEEE Conference on Computer Vision and Pattern Recognition, Las Vegas, NV, USA, 27–30 June 2016; pp. 5327–5336. [Google Scholar]
  58. Li, Z.; Yao, L.; Zhang, X.; Wang, X.; Kanhere, S.; Zhang, H. Zero-shot object detection with textual descriptions. In Proceedings of the AAAI Conference on Artificial Intelligence, Honolulu, HI, USA, 29–31 January 2019; Volume 33, pp. 8690–8697. [Google Scholar]
  59. Van der Maaten, L.; Hinton, G. Visualizing data using t-SNE. J. Mach. Learn. Res. 2008, 9, 2579–2605. [Google Scholar]
  60. Radford, A.; Kim, J.W.; Hallacy, C.; Ramesh, A.; Goh, G.; Agarwal, S.; Sastry, G.; Askell, A.; Mishkin, P.; Clark, J.; et al. Learning transferable visual models from natural language supervision. In Proceedings of the International Conference on Machine Learning, Virtual, 18–24 July 2021; pp. 8748–8763. [Google Scholar]
  61. Jia, C.; Yang, Y.; Xia, Y.; Chen, Y.T.; Parekh, Z.; Pham, H.; Le, Q.; Sung, Y.H.; Li, Z.; Duerig, T. Scaling up visual and vision-language representation learning with noisy text supervision. In Proceedings of the International Conference on Machine Learning, Virtual, 18–24 July 2021; pp. 4904–4916. [Google Scholar]
Figure 1. Overview of our Zero-Shot Food Safety Hazard Detection framework.
Applsci 15 06338 g001
Figure 2. A subgraph of the Food Safety Knowledge Graph showing bread-related hazards. Circular nodes represent food categories, diamond nodes represent visual attributes, and edge thickness indicates the strength of the relationship. Numbers on edges show weights: Food–Attribute Relations (e.g., White Bread → Fuzzy Growth Pattern [0.85]), Food–Food Relations (e.g., White Bread ↔ Whole Wheat Bread [0.87]), and Attribute–Attribute Relations (e.g., Fuzzy Growth Pattern ↔ Green-Blue Discoloration [0.73]).
Applsci 15 06338 g002
Figure 3. Confusion matrix for unseen hazard classes in GZSD setting. Values show recall-based confusion rates (normalized by true class). Darker cells indicate higher confusion rates. Notable patterns include 23% mutual confusion between Aspergillus and Penicillium molds, while Glass Fragments achieved 91% correct classification.
Applsci 15 06338 g003
Figure 4. t-SNE visualization of synthesized features for unseen hazard classes. (a) Features synthesized by RRFS. (b) Features synthesized by our ZSFDet. Different colors represent different unseen hazard classes.
Applsci 15 06338 g004
Figure 5. Qualitative detection results for the FSVH dataset. Red boxes indicate seen hazard classes. Our method successfully detects various food safety hazards, including (a) mold growth on bread, (b) glass fragments in processed food, (c) insect parts in cereal, (d) bacterial colonies on fruit, and (e) texture anomalies in fruit.
Applsci 15 06338 g005
Figure 6. Analysis of visual attributes’ influence on detection performance. (a) Radar chart showing the detection performance (mAP@50) of different methods across five attribute categories. (b) Correlation matrix between visual attribute types and detection performance across food categories. (c) Attribute contribution analysis showing the impact of each attribute type on detection accuracy for seen and unseen hazards. (d) Hierarchical clustering of food safety hazards based on their visual attribute similarities and detection difficulty.
Applsci 15 06338 g006
Table 1. Statistics of the food safety visual hazards (FSVH) dataset.
CategoryCountDescription
Food Categories26Meats, fruits, vegetables, etc.
Visual Attributes48Appearance, decomposition, etc.
Hazard Classes28Mold, foreign objects, etc.
  Seen Classes20Used for training
  Unseen Classes8Used for testing
Total Images18,326
  Training Images12,854Seen hazards only
  Testing Images5472Both seen and unseen hazards
Bounding Box Annotations32,741
Table 2. Food categories included in the FSVH dataset.
Food TypeCategories
MeatsBeef, Pork, Chicken, Fish
Dairy ProductsMilk, Cheese, Yogurt
FruitsApples, Oranges, Berries, Bananas
VegetablesLettuce, Tomatoes, Potatoes, Carrots
Bakery ItemsBread, Cakes, Pastries
GrainsRice, Wheat, Corn
Processed FoodsCanned Goods, Frozen Meals, Packaged Snacks
Table 3. Visual safety attributes in the FSVH dataset with occurrence frequency (%) across food categories.
Attribute CategorySpecific AttributesMeatDairyFruitsVegetablesBakeryProcessed
AppearanceDiscoloration78.565.382.179.645.261.8
Surface irregularities56.241.773.468.938.552.3
Abnormal shine/dullness62.858.945.642.331.748.5
Brown/black spots45.332.689.276.552.841.2
White/gray patches31.776.424.318.984.636.8
Unusual transparency72.415.231.828.68.321.5
Color fading58.942.376.571.235.654.7
Crystallization12.568.745.28.976.382.4
Oily residue84.652.315.712.428.965.8
Dried edges76.838.582.478.391.245.6
Bruising15.28.693.587.212.318.7
Swelling/bloating65.471.254.348.782.576.9
DecompositionMold (white)23.485.667.845.292.338.5
Mold (green/blue)18.778.371.252.887.641.2
Mold (black)15.245.658.938.776.432.5
Visible bacteria68.552.331.828.415.645.8
Slime formation87.265.442.338.58.721.3
Rot/decay45.631.289.782.452.338.7
Fermentation bubbles12.376.865.415.884.252.6
Texture breakdown72.548.691.387.665.854.2
Liquefaction65.882.376.568.921.445.7
Spore formation31.268.552.441.878.635.2
Yeast growth8.571.248.612.391.528.4
Gas production52.385.631.828.776.468.5
ContaminationPlastic fragments25.631.242.848.552.378.6
Metal shavings18.315.68.712.431.865.4
Glass pieces12.58.915.218.628.445.2
Hair/fibers42.338.731.535.248.652.8
Insect parts15.821.376.568.482.338.5
Rodent droppings8.612.431.828.545.221.6
Chemical stains31.528.652.448.718.368.9
Pesticide residue5.28.378.682.515.712.4
Oil contamination72.415.88.512.331.685.2
Dust/dirt38.542.665.871.252.348.7
Cleaning residue28.752.321.418.638.576.8
Cross-contamination85.668.445.241.831.552.7
StructuralCracks/fissures31.278.552.648.385.665.4
Holes/punctures18.512.368.765.242.871.2
Tears/rips52.88.731.438.615.282.3
Separation65.485.242.721.578.345.8
Deformation42.331.878.572.652.438.7
Freezer burn87.652.421.328.765.891.2
Dehydration78.345.685.282.471.531.8
Brittleness15.268.752.345.892.478.6
Collapse31.872.568.452.785.342.6
Blistering52.415.845.238.678.521.3
Warping8.721.431.828.565.285.6
Granulation45.682.315.712.452.868.7
Table 4. ZSD and GZSD results of the FSVH dataset. We report mAP@50 (%) and Recall@100 (%) for all methods. S and U denote seen and unseen classes, and HM denotes the harmonic mean. Note: ConSE, SYNC, and DeViSE are zero-shot learning methods adapted for detection. DSES and SB are early zero-shot detection methods. ZSD-YOLO, PL, and RRFS represent recent state-of-the-art approaches. S: seen classes; U: unseen classes; HM: harmonic mean.
MethodZSDGZSD (mAP)GZSD (Recall@100)
S U HM S U HM
Faster R-CNN [52]-68.5--74.2--
ConSE [56]42.167.339.449.870.545.655.3
SYNC [57]44.565.841.250.671.347.957.3
DeViSE [23]46.264.943.151.868.748.356.7
DSES [8]50.362.747.854.267.953.159.6
SB [8]51.866.348.556.072.152.760.9
ZSD-YOLO [58]53.463.550.156.070.854.361.5
PL [10]54.967.151.658.472.656.863.7
RRFS [29]56.868.352.759.573.558.465.1
ZSFDet (Ours)63.768.953.560.274.663.268.4
Table 5. Class-wise average precision (AP@50) for selected unseen hazard classes. Note: Values represent average precision at IoU = 0.5 for each unseen hazard class. Higher values indicate better detection performance for that specific hazard type.
MethodMold
Growth
Glass
Fragments
Insect
Parts
Bacterial
Colonies
Chemical
Residue
ConSE [56]48.345.740.137.436.2
SYNC [57]50.246.943.339.838.5
DeViSE [23]51.649.544.841.237.9
DSES [8]58.755.249.343.541.4
SB [8]60.156.851.744.242.5
ZSD-YOLO [58]61.358.552.946.843.1
PL [10]62.560.354.147.944.7
RRFS [29]65.262.856.548.345.9
ZSFDet (Ours)73.669.563.454.750.2
Table 6. Ablation studies on the FSVH dataset. We report mAP@50 (%) for ZSD and GZSD settings. Note: Each row shows incremental additions to the baseline. MSGF: Multi-Source Graph Fusion, RFDM: Region Feature Diffusion Model, GAN: Generative Adversarial Network. The last four rows show ablations using only single knowledge sources.
Model ConfigurationZSDGZSD
S U HM
Baseline (RRFS [29])56.868.352.759.5
+Food Safety Attributes58.468.553.159.8
+Knowledge Graph (w/o MSGF)60.368.653.860.3
+MSGF (w/o RFDM)62.168.753.460.1
+RFDM (Full ZSFDet)63.768.953.560.2
ZSFDet w/GAN instead of RFDM61.868.653.059.8
ZSFDet w/Only Word Vectors59.568.452.959.6
ZSFDet w/Only Hyperclass Graph60.868.553.159.8
ZSFDet w/Only Co-occurrence Graph61.268.653.259.9
ZSFDet w/Only Food Safety Knowledge Graph62.568.753.360.0
Table 7. Computational efficiency comparison. Inference time is measured in milliseconds per image on an NVIDIA Tesla V100 GPU. Note: Inference time measured on NVIDIA Tesla V100 GPU for single image processing. Model size includes all parameters and auxiliary data structures required for inference.
MethodInference Time (ms)Model Size (MB)
Faster R-CNN [52]85235
SB [8]92248
ZSD-YOLO [58]45240
RRFS [29]103276
ZSFDet (Ours)108285
Table 8. Cross-dataset evaluation results. We report mAP@50 (%) for Zero-Shot Detection (ZSD).
MethodMVTec-ADFood-5K
ConSE [56]35.828.6
SYNC [57]38.230.9
DeViSE [23]39.531.4
DSES [8]42.733.8
SB [8]43.935.2
ZSD-YOLO [58]45.336.7
PL [10]46.838.1
RRFS [29]48.539.4
ZSFDet (Ours)54.243.8
Disclaimer/Publisher’s Note: The statements, opinions and data contained in all publications are solely those of the individual author(s) and contributor(s) and not of MDPI and/or the editor(s). MDPI and/or the editor(s) disclaim responsibility for any injury to people or property resulting from any ideas, methods, instructions or products referred to in the content.

