Article

Prediction of Blast Crushing Lumpiness Based on CPO-BP Modeling

School of Resources and Safety Engineering, Central South University, Changsha 410083, China
*
Author to whom correspondence should be addressed.
Appl. Sci. 2025, 15(11), 6312; https://doi.org/10.3390/app15116312
Submission received: 10 May 2025 / Revised: 30 May 2025 / Accepted: 31 May 2025 / Published: 4 June 2025

Abstract

:
Currently, the central task of predicting rock fragmentation is becoming increasingly important in the field of rock mechanics and engineering blasting. This direction has been shown to be crucial to ensure the safety and durability of construction projects. In this study, a BP neural network is constructed to optimize the network weights and bias with the help of CPO algorithm, and its practicality and reliability are tested through the case of an iron ore mine in Hunan Province, China. The model is trained and tested using typical blasting data, and the results show that it performs efficiently, with a short prediction time and a high level of confidence. The predicted values were consistent with actual engineering measurements, achieving an RMSE of only 0.015813, which indicates strong potential for guiding practical blasting block size predictions.

1. Introduction

In mining, road construction, water conservancy, hydropower, and tunnel construction, blasting technology plays a vital role as an efficient method of rock breakage and cannot be ignored. In the blasting operation, the rock mass distribution after crushing directly determines the efficiency of the subsequent excavation, loading, and transportation, which is a measure of the core indicators of the effectiveness of blasting. Accurate prediction of the blasting block size not only helps optimize the design of blasting parameters and reduce construction costs but also significantly enhances project safety and economic performance.
Since the 1930s, extensive research has been conducted to establish empirical models for predicting blast fragmentation size. Among the earliest, Rosin and Rammler [1] proposed a semi-empirical formula describing the relationship between particle size and the cumulative percentage of screen residue, providing a foundational approach to estimate rock fragmentation. Subsequently, Kuznetsov [2] expanded this model by incorporating explosive characteristics and burden–spacing parameters, although it was later noted that the model may underestimate fragmentation in certain geological settings. Building on these approaches, Cunningham [3] developed the Kuz–Ram model, which integrates Rosin–Rammler distribution theory with the Kuznetsov formula, and remains widely used for blast design optimization. However, its predictive capability is limited in heterogeneous rock masses where structural features, such as joints and fractures, significantly affect fragmentation outcomes [4].
To address these limitations, more physically based models have been proposed. For instance, the BM-MC model developed by Zou et al. [5] is grounded in stress wave propagation and energy absorption theory, providing a more mechanistic understanding of fragmentation. Similarly, Liu Weizhou [6] introduced Bond’s energy theory into bench blasting applications, highlighting the energy–fragmentation relationship, though this model does not fully account for discontinuities in rock masses. Later models, such as the crushed zone model (CZM) by Kanchibotla et al. [7] and the Kuznetsov Cunningham Ouchterlony (KCO) model by Ouchterlony et al. [8], further refined the classification of coarse and fine fragmentation and improved predictive accuracy by integrating updated empirical relationships and field observations.
Despite these advancements, traditional models generally struggle to capture the complex, nonlinear interactions between geological conditions and blast design parameters. With the rise of artificial intelligence and machine learning (ML) techniques, researchers have shifted toward data-driven predictive models. Techniques such as multiple regression analysis (MRA) and artificial neural networks (ANN) [9] support vector machines (SVM) and genetic algorithms (GA) and particle swarm optimization (PSO) have been widely applied to blasting data modeling [10,11]. Notably, Hudaverdi et al. [12] utilized MRA to incorporate joint characteristics, explosive energy, and hole geometry into a blast fragmentation model. Similarly, Shi et al. [13] employed a support vector regression (SVR) model to outperform ANN and MRA methods in terms of prediction accuracy and speed, though parameter tuning remained a challenge.
In parallel, researchers have explored more complex models incorporating rock structural parameters, Monte Carlo simulations, and heuristic optimization. Yang et al. [14] used fractal theory and random simulations to predict initial block size distributions. ASLP.F. et al. [11] combined the firefly algorithm with ANN to forecast fragmentation in iron ore blasting [15], though the model exhibited signs of overfitting due to excessive learning capacity. Recent works by Liu Yang et al. [16] and Liu Xiaobo et al. [17] integrated feature selection (e.g., via random forests) with neural networks (e.g., RBF, GA-BP), yielding higher prediction accuracy than standalone BP networks. Other researchers, such as Ye et al. [18], introduced methods like leave-one-out cross-validation in XGBoost frameworks, while Guan et al. [19] and Liu Xiang et al. [20] adopted gray relational analysis and Pearson correlation screening to refine input variables and boost model generalization.
These developments underscore a growing trend toward hybrid intelligent models that combine metaheuristic optimization with neural networks to enhance predictive robustness and adaptability under varying geological and operational conditions.
Overall, while current research has achieved certain results, it still presents several limitations: insufficient integration of multiple influencing factors, as most models consider only one or two variables and fail to account for complex interactions among rock types, joint systems, and explosive properties; susceptibility to overfitting, particularly in machine learning models like ANN and SVM when selecting input parameters and tuning hyperparameters; and limited generalization ability, as models that perform well on specific datasets often fail to maintain accuracy under varying geological conditions.
To address these challenges, this study proposes a hybrid prediction model that combines the Crown Porcupine Optimization (CPO) [21] algorithm with the BP neural network, referred to as the CPO-BP model, to improve the prediction of blast fragmentation. The CPO algorithm simulates four defensive strategies of the crown porcupine (visual deterrence, acoustic deterrence, odor diffusion, and physical attack), enabling a dynamic balance between global exploration and local exploitation, and effectively avoiding premature convergence. To enhance input optimization and interpretability, the Mean Impact Value (MIV) method is applied to select key influencing factors. The model is trained and validated using 97 sets of real-world blasting data from an iron ore mine in Hunan Province, China.
This study aims to investigate whether integrating a biologically inspired optimization algorithm (CPO) with BP networks and feature selection (via MIV) can improve the robustness and prediction accuracy of blasting fragmentation under variable geological conditions. The contributions of this study are threefold:
(1)
A novel hybrid model CPO-BP is developed that significantly improves the stability and prediction accuracy of BP networks under complex geological conditions;
(2)
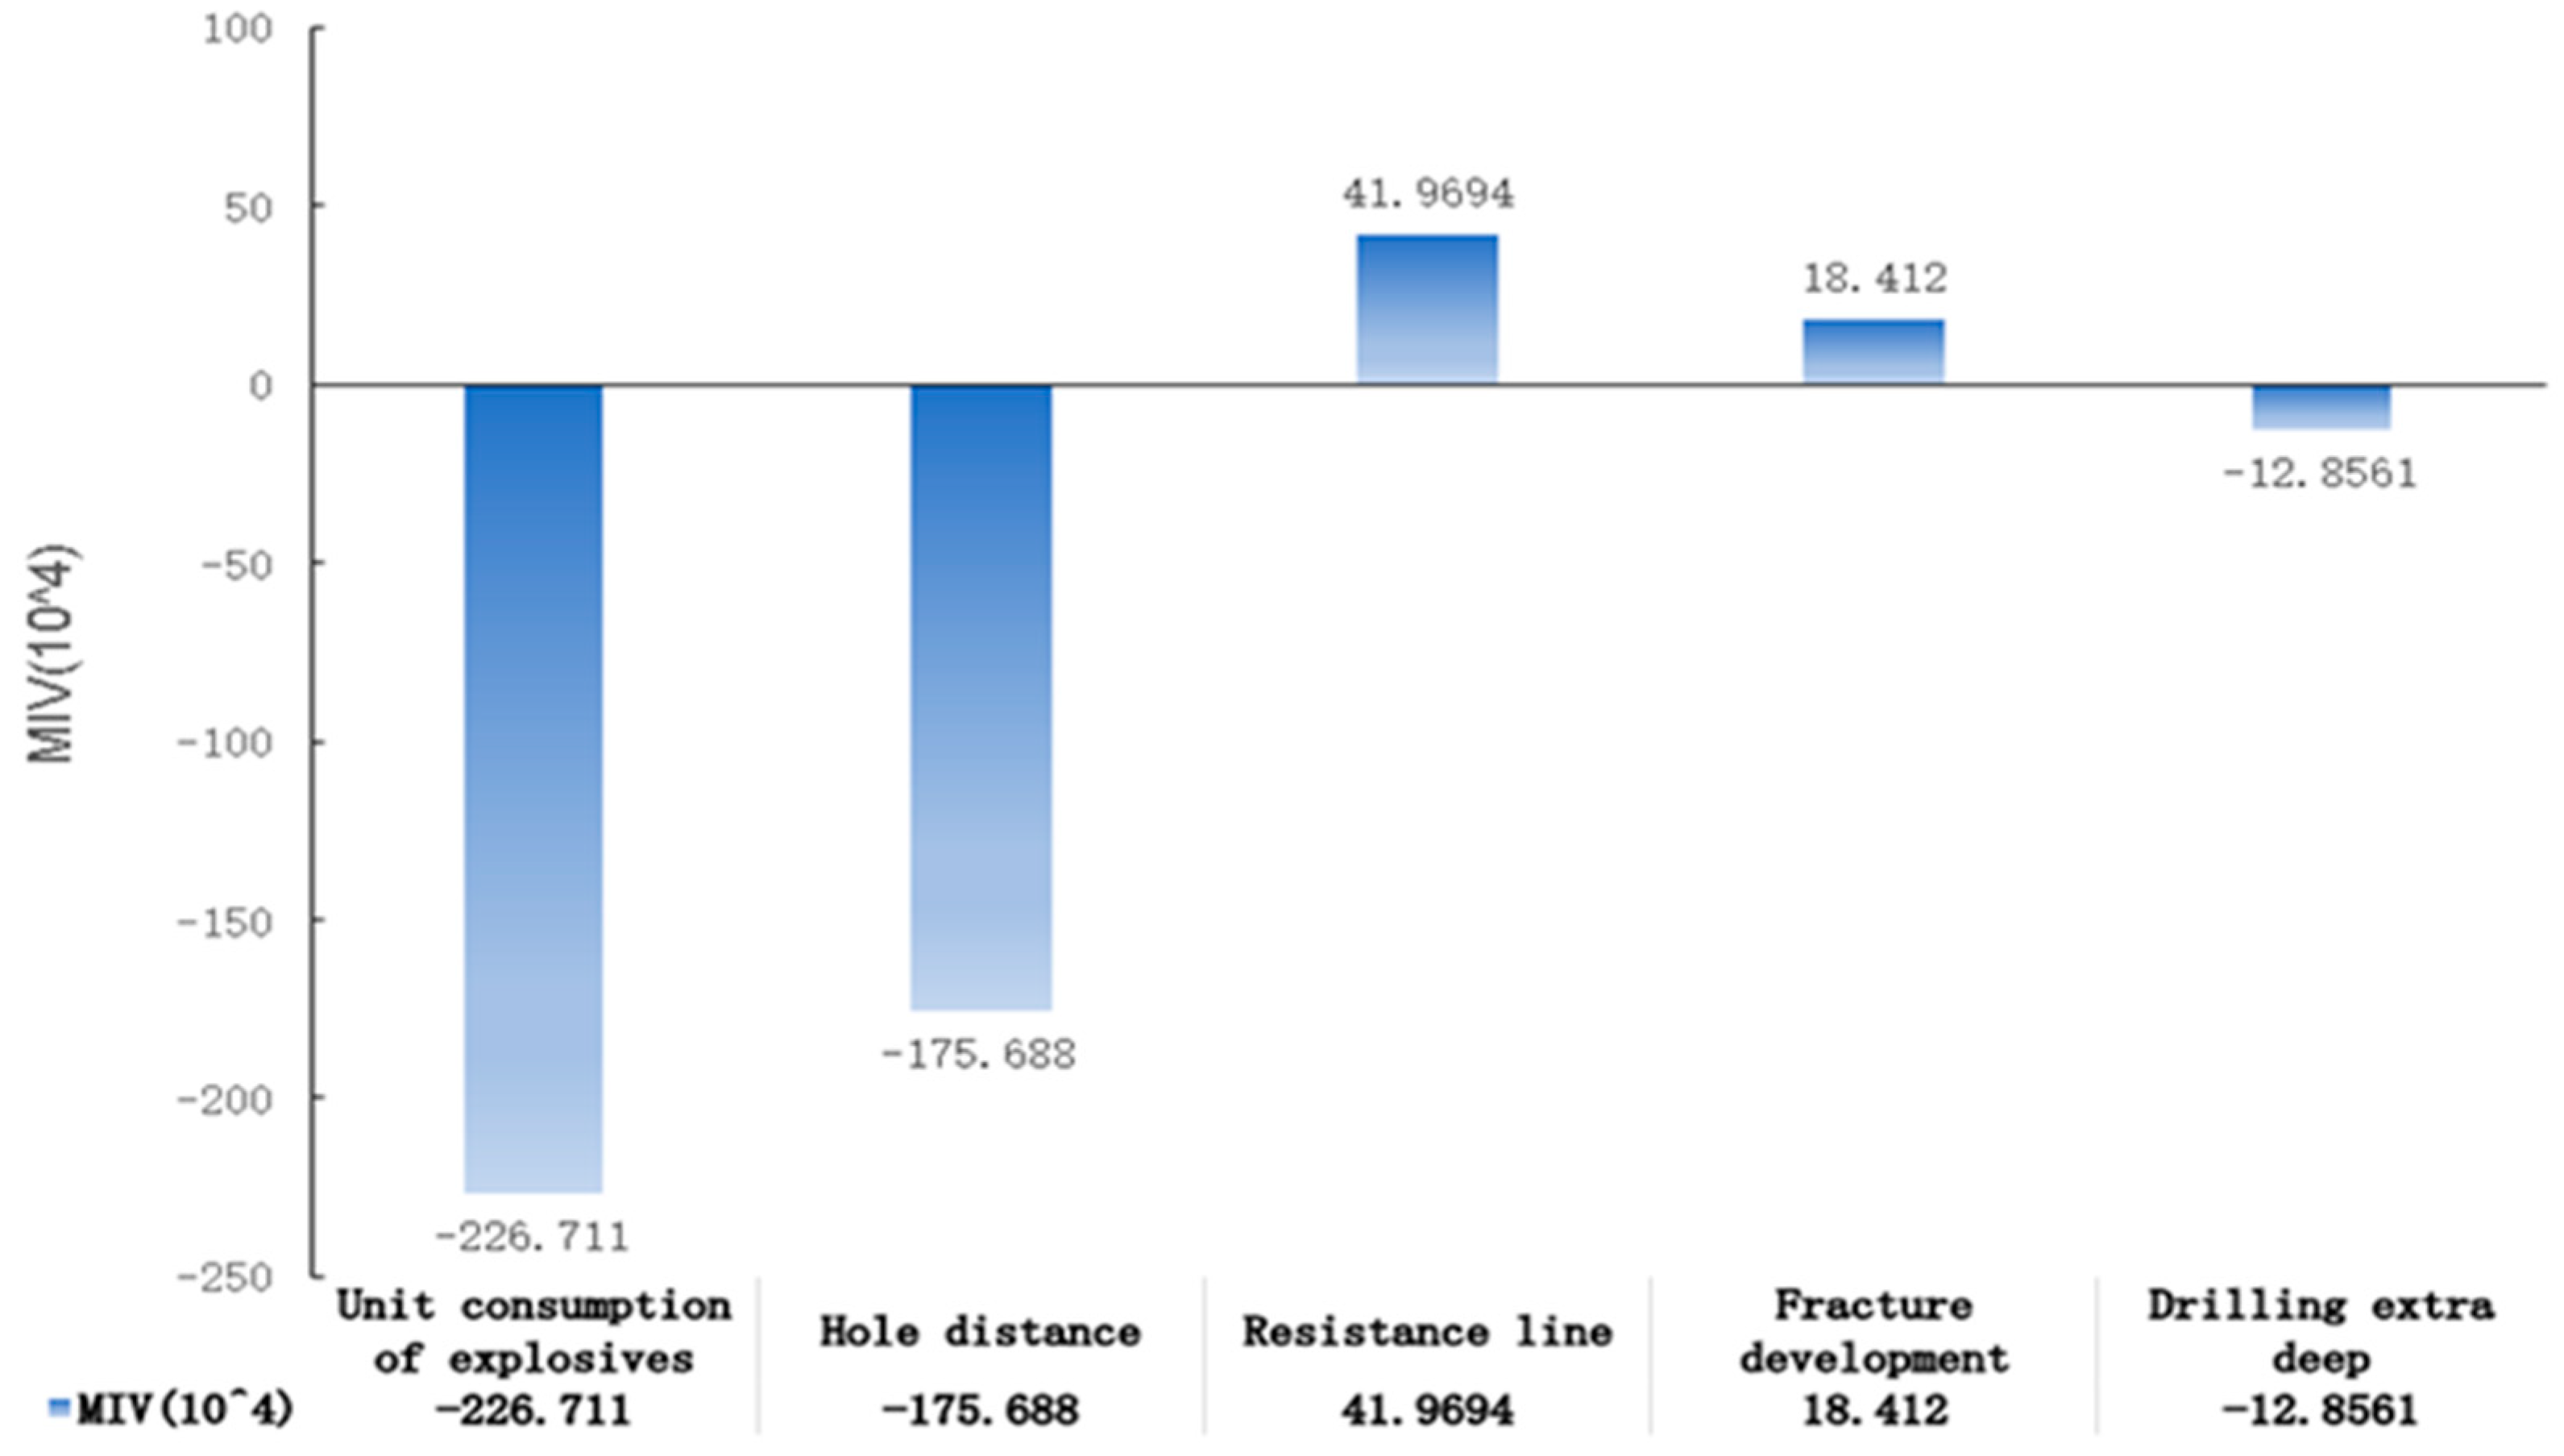
A real engineering database is constructed, and key variables are selected using the MIV method to optimize the model’s input structure;
(3)
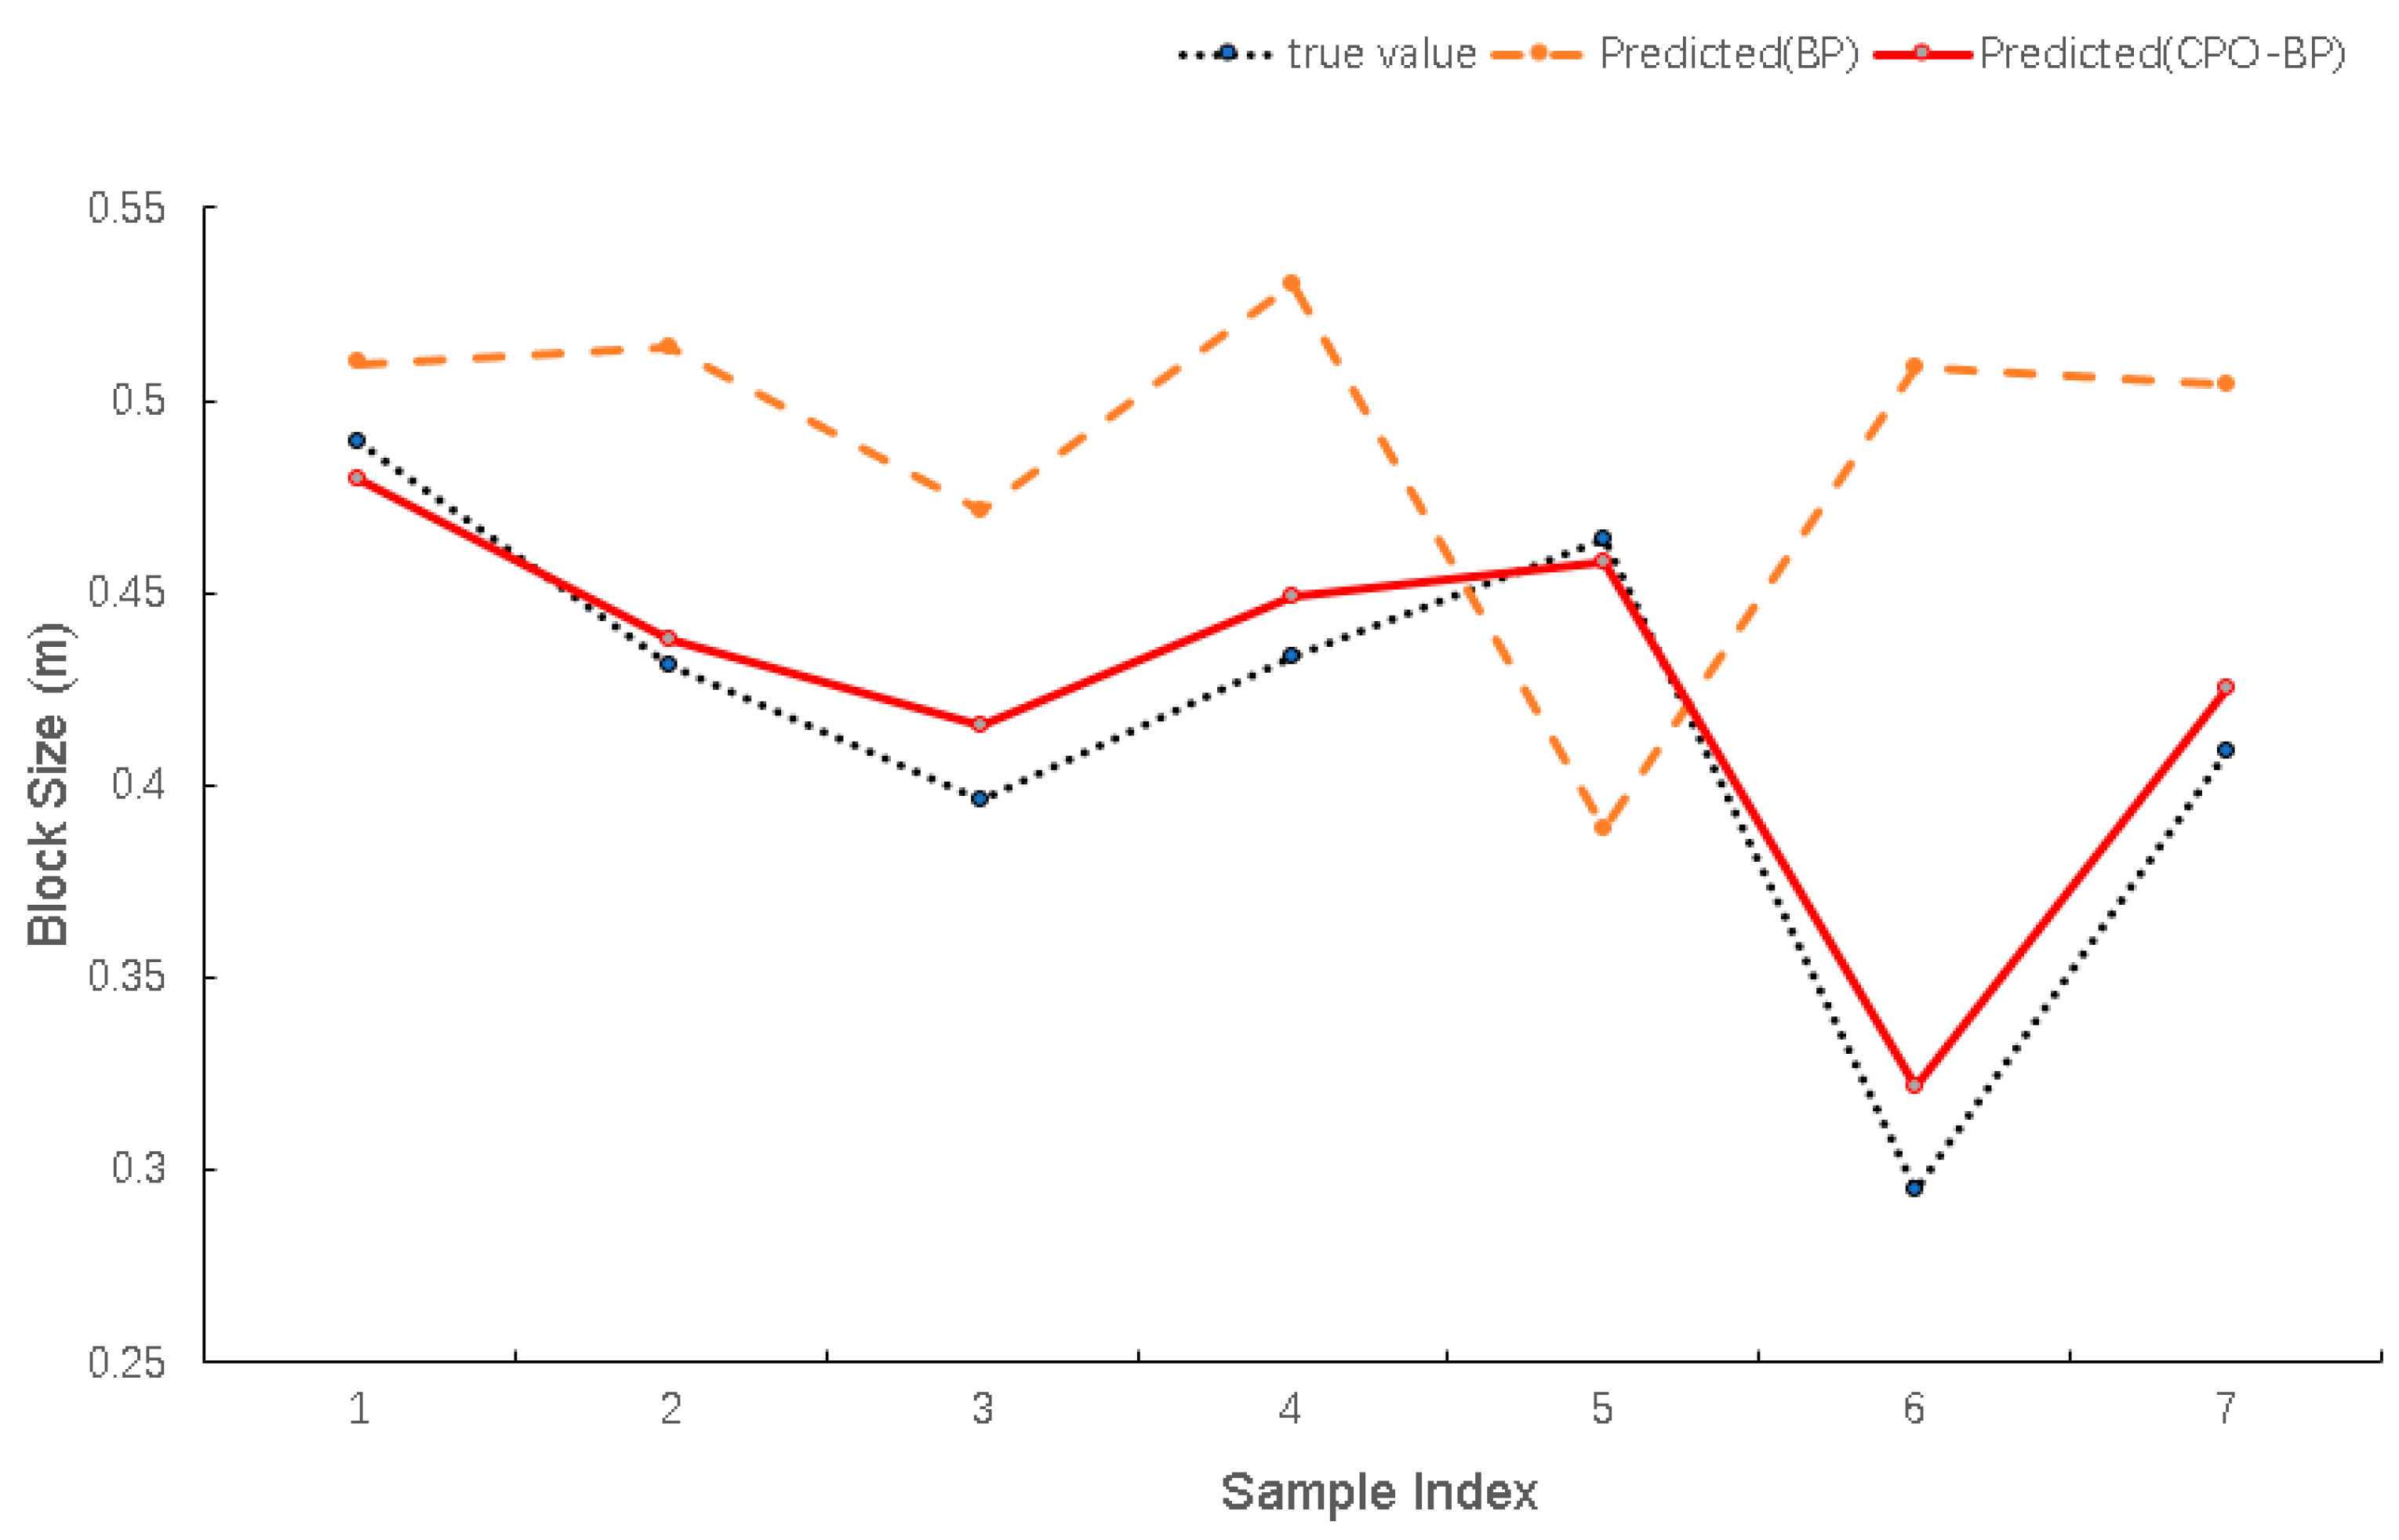
The proposed CPO-BP model outperforms the standard BP model in terms of RMSE, MAE, and MAPE, and demonstrates strong potential for practical application in engineering blasting design.

2. Research Methods

2.1. BP Algorithm

The BP algorithm is used to train multilayer feedforward neural networks and is an approach based on the error backward transfer mechanism. In practice, this technique has been shown to achieve efficient fitting of complex nonlinear relationships by gradually adjusting the weighting parameters and thresholds within the network. Here, we can summarize its core idea into two key processes: the “forward transmission of signal” and the “reverse transmission of error” [22]. First, in the forward propagation part of the signal, the input information flows from the input layer to the hidden layer through the extremely complete and complicated data nodes of the hierarchical structure, and then to the output layer through the calculation of the activation function, and the prediction result is thus generated. The function of the activation function is to introduce nonlinear properties to enhance the ability of the net to express complex patterns [23]. The error back-propagation stage involves adjusting the weights and thresholds backward layer by layer from the output layer to the input layer by calculating the difference between the predicted and true values. Specifically, the gradient descent method is used to calculate the partial derivatives of the error with respect to the parameters of each layer, which in turn updates the parameters to minimize the overall error. This iterative process continues until the error converges to a preset threshold or the maximum number of training sessions is reached. The advantage of BP neural networks that can satisfy the complex mapping relationships of high-dimensional data lies in their strong nonlinear modeling ability. However, the algorithm also has limitations, and the randomness of the initial weights and thresholds may cause the model to fall into a local optimal solution [24].

2.2. CPO Algorithm

CPO simulated various defensive behaviors of the crown porcupine. The four defense strategies of the crown porcupine were visual, sound, odor and physical attack, which corresponded to the four zones A, B, C, D. The four different zones simulated the defense of the crown porcupine.
In the implementation of the CPO algorithm, the four defense strategies—visual deterrence (A), acoustic deterrence (B), odor diffusion (C), and physical attack (D)—are not used simultaneously. Instead, the algorithm dynamically selects one of the strategies at each iteration based on the current state of the population and the optimization progress. Specifically, each defense mechanism is associated with a particular phase of the search process. Early iterations tend to favor global exploration strategies such as A and B, while later iterations focus more on local exploitation strategies such as C and D. The strategy selection is influenced by factors such as the iteration number, population diversity, and current fitness values of the agents.
I. CPO starts searching from the initial set of individuals:
X i = L + r × ( U L ) | i = 1,2 . . . , N
where N is the overall size, X I is the ith solution, L and U are the lower and upper bounds of the search range, and r is some random number in the interval [0, 1].
II. CPR
CPR not only promotes the speed of convergence but also shows significant results in maintaining the diversity structure. The optimization process introduces some CPs into is to accelerate the convergence to improve the diversity and avoid falling into very small local ranges. The formula is
N = N m i n + N N m i n × ( 1 ( t % t m a x t t m a x t ) )
where N is the overall size, t is the number of current iterations, tmax is the maximum number of iterations, % is the residual, and Nmin is the lower bound on the number of individuals in the new population.
(1) First defense strategy (A)
Predators have two paths in front of them when faced with a decision: either they move towards the CP or they choose to move away from it. In the first case, the interval between the predator and the CP is gradually shortened as a result of moving closer to the CP, thus helping to explore the area where the predator and the CP are located, with a view to increasing the convergence efficiency. In the second case, however, deliberate disengagement by increasing the distance between the two is a strategy that undoubtedly implies a motivation to explore more distant domains, with the aim of identifying unknown regions that may hold the answer. This behavior is expressed in the mathematical model as follows:
X i t + 1 = X i t + τ 1 × 2 × τ 2 × X c p t y i t
where X i t is the ith solution at iteration number t, X i t + 1 is the ith solution at iteration number t + 1, x c p t is the optimal solution at iteration number t, y i t is the position vector of the predator at iteration t, a n d   τ is some random number in the interval [0, 1] generated by the normal distribution. The generated mathematical formula is
y i t = x i t + x r t 2
where r is some random number in the interval [1, N], X r t is the rth solution at iteration number t, and X i t is the ith solution at iteration number t.
(2) Second defense strategy (B)
When a predator approaches a porcupine, the porcupine’s voice becomes louder. To mathematically model this behavior, the following equation was proposed:
x i t + 1 = 1 U 1 × x i t + U 1 × ( y i t + τ 3 × ( x r 1 t x r 2 t ) )
where X i t + 1 is the ith solution at iteration number t + 1, U 1 is the search upper bound, x i t is the ith solution at iteration number t, r1 and r2 are two random integers between [1, N], τ 3 is some random number in the interval [0, 1] generated by the normal distribution, and y i t is the position vector of the predator at iteration t.
(3) Third Defense Strategy (C)
The CP releases a hostile odor that gradually spreads throughout its environment making predators wary of approaching as a result, thus maintaining its own safety. Its behavioral trajectory is simulated by a mathematical model as the following equation:
x i t + 1 = 1 U 1 × x i t × x r 1 t + S i t × x r 2 t x r 3 t τ 3 × δ × γ t × S i t
where X i t + 1 is the ith solution at iteration number t + 1, U 1 is the search upper bound, x i t is the ith solution at iteration number t, x r t is the rth solution at iteration number t, r1, r2, r3 are two random integers between [1, N], τ 3 is some random number in the interval [0, 1] generated by the normal distribution, δ is the parameter used to regulate the direction of search, the meaning of which is indicated by Equation (7) later, γ t is the protection factor, the definition of which is based on Equation (8), and S i t is the odor factor, the definition of which is based on Equation (9). This is shown below:
δ = + 1 , if   r a n d 0.5 1 , Else
γ t = 2 × r a n d × ( 1 t t m a x ) t t m a x
S i t = e x p ( f ( x i t ) k = 1 N f ( x t k ) + ϵ )
where f ( x i t ) is the tth time in the iterative process, the value of the objective function of individual i is represented, ϵ is a value to prevent the division by zero case from occurring in the computation; rand is some random vector in the interval [0, 1], and the U1 vector simulates the existence of three situations in the analytical strategy: firstly, if U1 is 0, the diffusion of the odors will be prevented. First, if U1 is 0, odor diffusion is prevented. In this case, the predator is stationary due to its fear of the CP, and the distance between the two remains the same; second, when U1 is 1, those lurking predators encourage the CP to release strong odors; and, lastly, the last scenario, i.e., U1 is a mixture of 0 and 1, ensures that the predator maintains an appropriate safe distance from the CP.
(4) Fourth Defense Strategy (D)
The final strategy is physical attack, where the CP performs a striking action modeled as a one-dimensional inelastic collision. In this process, two individuals violently combine, which is actually a one-dimensional inelastic collision phenomenon. To express its attack pattern in formulas, the following out formula is proposed:
x i t + 1 = x C P t + ( α ( 1 τ 4 ) + τ 4 ) × ( δ × x C P t x i t ) τ 5 × δ × γ t × F i t
where X i t + 1 is the ith solution at iteration number t+1; x c p t is the optimal solution at iteration number t, τ 4 and τ 5 are some random number in the interval [0, 1] generated by the normal distribution, δ is the parameter used to regulate the direction of search, γ t is the protection factor, α is the convergence velocity factor, a n d   F i t is the average force of the ith CP at iteration t. Supported by the inelastic collision law, this is defined by formula. This is shown below:
F i t = τ 6 × m i × ( v i t + 1 v i t ) Δ t ,
m i = f ( x i t ) e k = 1 N f ( x i t ) + ϵ ,
v i t = x i t ,
v i t + 1 = x r t
where m i is the mass of predator i at iteration t, v i t + 1 is the final velocity of individual i at iteration t + 1, and v i t is the initial velocity of individual i at iteration t. x r t is the rth solution at iteration number t, f ( x i t ) is the tth time in the iterative process, the value of the objective function of individual i is represented, ϵ is a value to prevent the division by zero case from occurring in the computation, and τ 6 is some random number in the interval [0, 1] generated by the normal distribution.
In the equation, the calculation of the average CP force takes place based on the division of the numerator with the number of current iterations. In practice, it is shown that the number of current iterations increases linearly in the optimization process, allowing the effect to be gradually minimized. As seen through this phenomenon, the CPO performance is not affected by small values of this factor, as these values may not help much in finding constraints in the region around the more optimal solution. Therefore, by deleting the numerator and depending only on the denominator, it is shown in formula. This is shown below:
F i t = τ 6 × m i × ( v i t + 1 v i t )
where: as shown above.
Summarize: Strategy A (visual deterrence) is applied when the algorithm seeks to balance exploration and convergence—typically during the early to mid stages of the search process. Strategy B (acoustic deterrence) is used when there is a moderate attraction toward the best solution but the global best is not yet stable. Strategy C (odor diffusion) is activated in the middle to late stages to maintain safe search distances and prevent premature convergence. Strategy D (physical attack) is primarily used during the final convergence phase to refine solutions via aggressive local search near promising areas. The algorithm dynamically shifts between these strategies based on a probabilistic mechanism or predefined threshold conditions associated with the iteration counter t and maximum iteration tmax, ensuring a balance between global search (exploration) and local refinement (exploitation) throughout the optimization process.

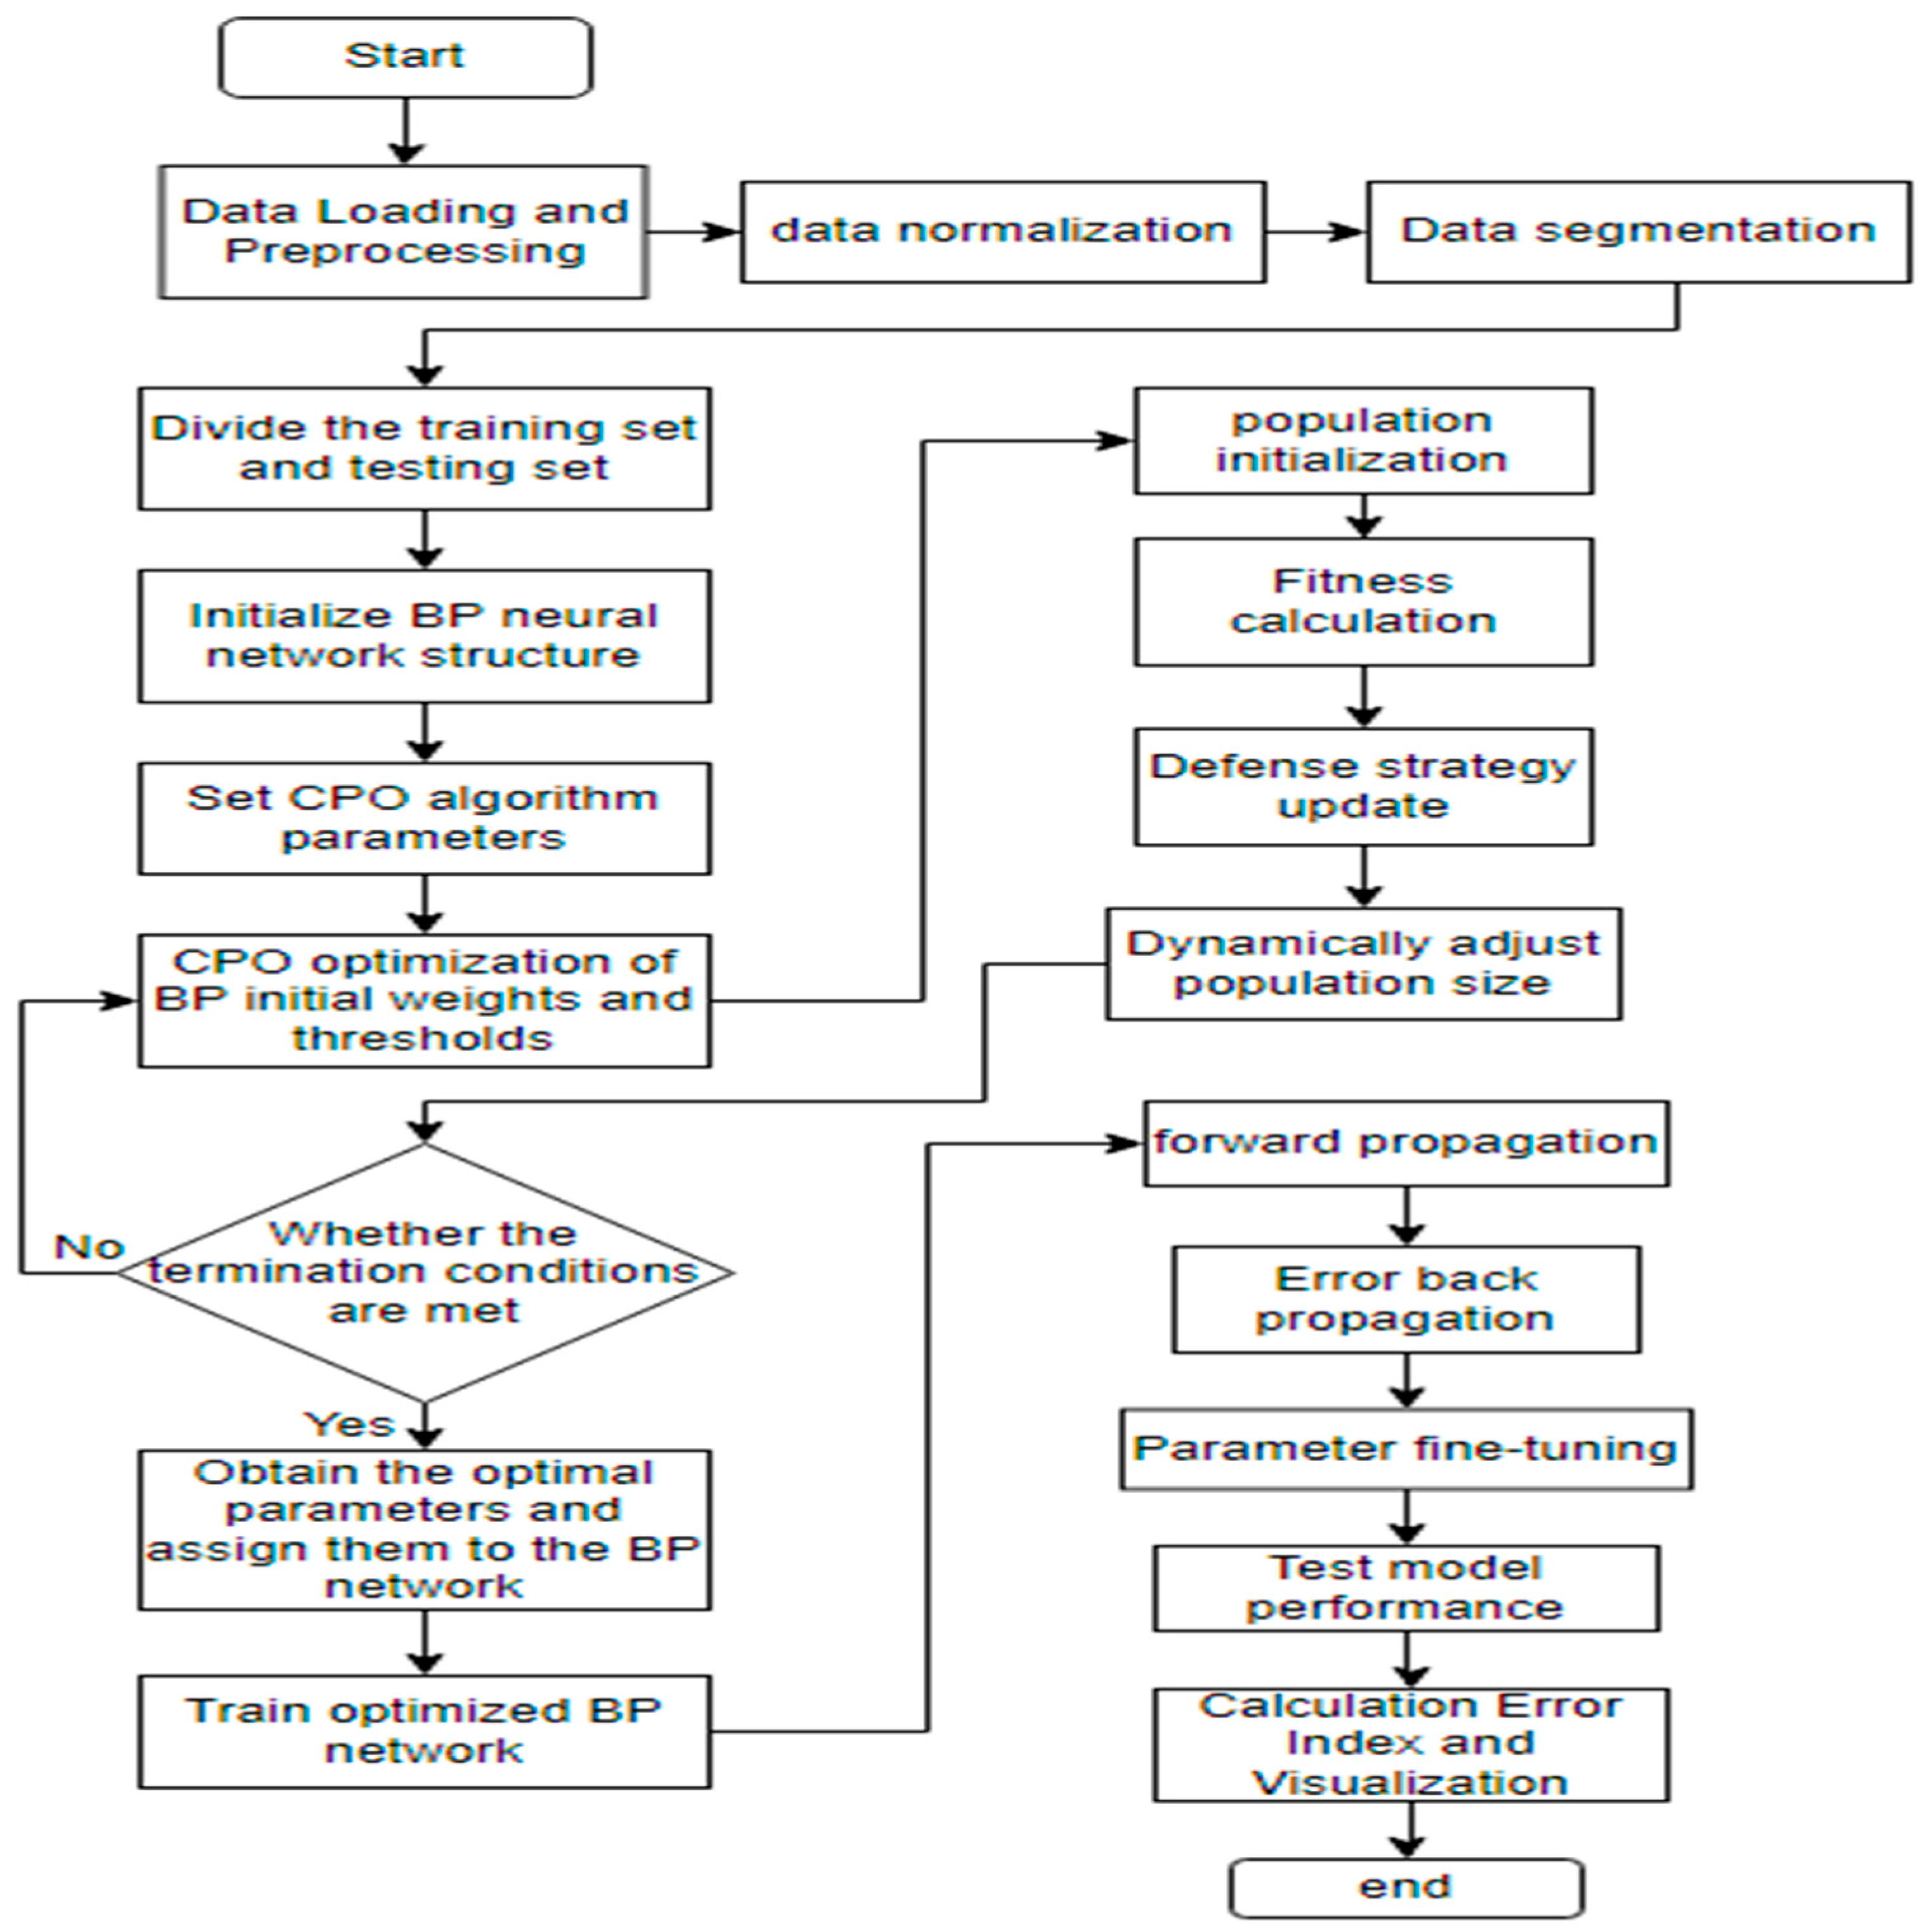
2.3. CPO-BP Algorithm

BP neural network [25] was proposed by Rumelhart and McClelland et al. in 1986 as a multilayer feed-forward type network model for modeling complex nonlinear problems by combining nonlinear activation functions through the gradient decreasing method with an error back-propagation mechanism to obtain the minimum error and has been widely used. However, its training process is susceptible to initial weight sensitivity and local minima convergence. For this reason, this study introduces the Crown Porcupine Optimization (CPO) algorithm, which performs global optimization on the initial weight matrix and threshold vector of BP neural networks by simulating the intelligent collaborative behavior of the group to break through the bottleneck of local convergence of the traditional gradient descent method and to significantly improve the model prediction accuracy and generalization ability. The basic idea of optimization of BP neural network using CPO is shown in Figure 1.

3. Construction and Validation of CPO-BP Prediction Models

To evaluate the prediction performance and generalization ability of the CPO-BP hybrid model, this study is based on the research of Hudaverdi and other scholars [10] and adopts several sets of production data under real blasting scenarios, and unfolds training and validation tests for the model by comparing the error distributions of the predicted block size and the actual block size, as well as the actual database of the blasting project constructed.

3.1. CPO-BP Model Parameterization

Based on the algorithm flow shown in Figure 1, MATLAB R2024a programming is used to realize the code compilation and training of CPO-BP hybrid model with the following parameter settings:
(1) Input and output layer parameterization
In this study, based on the blasting engineering database constructed by Hudaverdi and other scholars, the following seven types of parameters were selected as input layer variables of the network: the ratio of step height to the minimum line of resistance, the ratio of gunhole spacing to the minimum line of resistance, the ratio of the minimum line of resistance to the diameter of the hole, the ratio of the length of the blockage to the minimum line of resistance, the unit consumption of explosives, the elasticity modulus of the rock, and the average blockiness of the original rock [10]. The target variable for the output layer is average blast lumpiness, which is used to quantify the accuracy of the prediction model. Prior to training, all input variables were normalized using Min–Max scaling to ensure consistent value ranges and prevent any single feature from dominating the model training process in assessing the effectiveness of blast crushing.
(2) Hidden layer parameterization
The number of hidden layers is set to 1 and the number of nodes in the hidden layers is
h = 2 × i + 1
where i is the number of nodes in the input layer ( i = 4). Based on empirical testing and using the heuristic formula, the number of hidden layer nodes was set to 9. This value provided a good balance between model complexity and prediction performance. The design aims to balance the model complexity and computational efficiency.
(3) Transfer function and training function
Logsig function is used to enhance the nonlinear feature extraction capability acting on the input layer to the hidden layer:
f x = 1 1 + e x
The Purelin function is applied between the hidden layer and the output layer, and the predicted values can be obtained directly. The Levenberg–Marquardt algorithm for the selection of the training function shows its efficient and fast convergence properties which are extremely suitable for small and medium sized data sets.
(4) BP network hyperparameters
Maximum number of training sessions: 1000. Initial learning rate: 0.1. Target error: 0.00001. Momentum factor: 0.01. Minimum performance gradient: 1 × 10⁻⁶. Maximum number of failures: 6.
(5) Parameters of the crown porcupine optimization algorithm (CPO)
Number of search agents: 30. Maximum number of iterations: 30. Solution space boundaries: weights and thresholds take values in the range of [−3, 3]. Fitness function: mean square error ( M S E ). Dimension: dim = (number of nodes in input layer × number of nodes in hidden layer) + (number of nodes in hidden layer) + (number of nodes in hidden layer × number of nodes in output layer) + (number of nodes in output layer).

3.2. CPO-BP Model Evaluation Indicators

The common model evaluation indexes are coefficient of determination, mean absolute error, mean square error, root mean square error, etc. In this paper, we choose mean absolute error M A E , mean square error M S E , root mean square error R M S E , and mean absolute percentage error M A P E as the evaluation indexes [26], and its calculation formula is as follows:
M A E = 1 n i = 1 n | y i y ^ i |
M S E = 1 n i = 1 n y i y ^ i 2
R M S E = M S E = 1 n i = 1 n y i y ^ i 2
M A P E = 100 % n i = 1 n | y i y ^ i y u |
where y i is the true value of sample i , y ^ i is the predicted value of sample i ,   a n d   n is the sample size.

3.3. CPO-BP Model Validation

On the basis of the above parameter and evaluation index settings, the dataset consisting of 97 samples was randomly shuffled and then divided into a training set of 75 samples (approximately 77%) and a testing set of 15 samples (approximately 23%). This division was performed to ensure adequate training volume and sufficient testing for performance evaluation and the results of their model calculations are shown in Figure 2 and Figure 3.
From Figure 2 and Figure 3 it can be seen that the training output values and test output values are very less different from the true values. This indicates that the CPO-BP model is reliable in predicting blast blockiness. From Figure 4, it can be seen that the CPO-BP test values are within 0.06 of the true value residuals. The distribution of residuals around zero further confirms the consistency of the model’s predictions and its ability to generalize across different blasting conditions within the dataset.
No significant overfitting was observed, as the model performed consistently across both training and testing sets, with prediction errors remaining low and stable.

4. Engineering Applications

4.1. Project

An iron ore mine in Hunan is located at the junction of Hengyang County, Qidong County and Shaodong County, China, with a mining area of 1.66 square kilometers, which belongs to Qidong Iron Ore Mine’s Tianmiaochong—Pair of Jiachong mining section. Resource reserves of the mine reached 320 million tons, the annual design production capacity of 2.8 million tons of iron ore, the actual annual output of 2.33 million tons, 6400 tons of raw ore per day, the production of finished products concentrate stable at 1000~1200 tons. At this stage, open pit mining is adopted, with the thickness of the ore body ranging from 0.53 to 120 m, with an average thickness of 15.7 m, and the ore types are mainly sedimentary metamorphic magnetite, hematite, and mixed ore, and the main minerals are uniformly embedded in the vein matrix with authomorphic-semi-authomorphic structure, and crypto-crystalline particles are distributed in the form of hematite. Mining is faced with the following technical challenges: 1. Demand for blasting block size control: the block size of the ore after open blasting directly affects the subsequent crushing, transportation and beneficiation efficiency; too large block size to increase the cost of secondary crushing, too small rules lead to dust pollution and waste of resources. 2. Complexity of parameter optimization: the traditional blasting test relies on experience to adjust the distance between the holes, the row spacing, the amount of charge, and other parameters; time-consuming, costly, and unstable results. 3. Geological constraints: the ore body shows considerable variation in thickness, hardness, and structural characteristics, which requires dynamic adaptation of the blasting program to ensure mining safety and economy. To overcome the above problems, this study introduces the improved BP neural network model (CPO-BP) of the Crown Porcupine Optimization Algorithm (CPO) based on the previous blasting test data and accurately predicts the distribution of ore lumps under different blasting parameters by globally optimizing the initial weights of the network and the threshold value. The model can effectively avoid the traditional BP easily falling into the local optimum, poor robustness, and other problems, and, combined with the actual parameters of the mine, achieve intelligent optimization of the blasting program, reduce the number of tests, reduce the production cost, and provide scientific guidance for achieving safe and efficient mining operations.

4.2. Parameter Selection

The key variables related to blasting parameters are listed in Table 1. Each variable is labeled with its name and unit in the first row, including hole distance (m), resistance line (m), unit explosive consumption (kg/m3), drilling extra depth (m), fracture development (T), and the resulting fragmentation size represented by p50 (m). These parameters are selected based on prior field experiments and blasting design practices.
Table 1 provides the field data used for model input analysis. To reduce dimensionality and improve model performance, the Mean Impact Value ( M I V ) method was applied to assess the influence of each variable on blasting fragmentation. The variables with lower MIV scores were excluded from the model input, while the most impactful features were retained and used as inputs to the CPO-BP model for block size prediction.
According to the related research, among the neural networks evaluating the correlation of variables, the Mean Influence Value method ( M I V ) [27] is one of the best indicators. The steps for the application of the M I V method, and its specific implementation are generally to screen the key influencing factors based on the relative magnitude of the MIV value, to process one of the input parameters by increasing or decreasing it by a magnitude of 10%, while leaving the other covariates untouched, and finally to feed this adjusted data into the prediction model to calculate the average degree of change of the results [28]. This adjusted data is fed into the forecasting model to calculate the average degree of change in the results. The formula is as follows:
M I V k = 1 M j = 1 M | y j k + y j k |
where k is the first k input variable, M is the overall sample size, y j k + is the predicted value of the j sample after a 10% increase in the k variable, a n d   y j k is the predicted value of the j sample after a decrease of the same proportion in the k variable.
As shown in Figure 5, unit consumption of explosives, hole distance, resistance line, and fracture development have a strong influence on the prediction of blasting block size and are selected as input parameters.

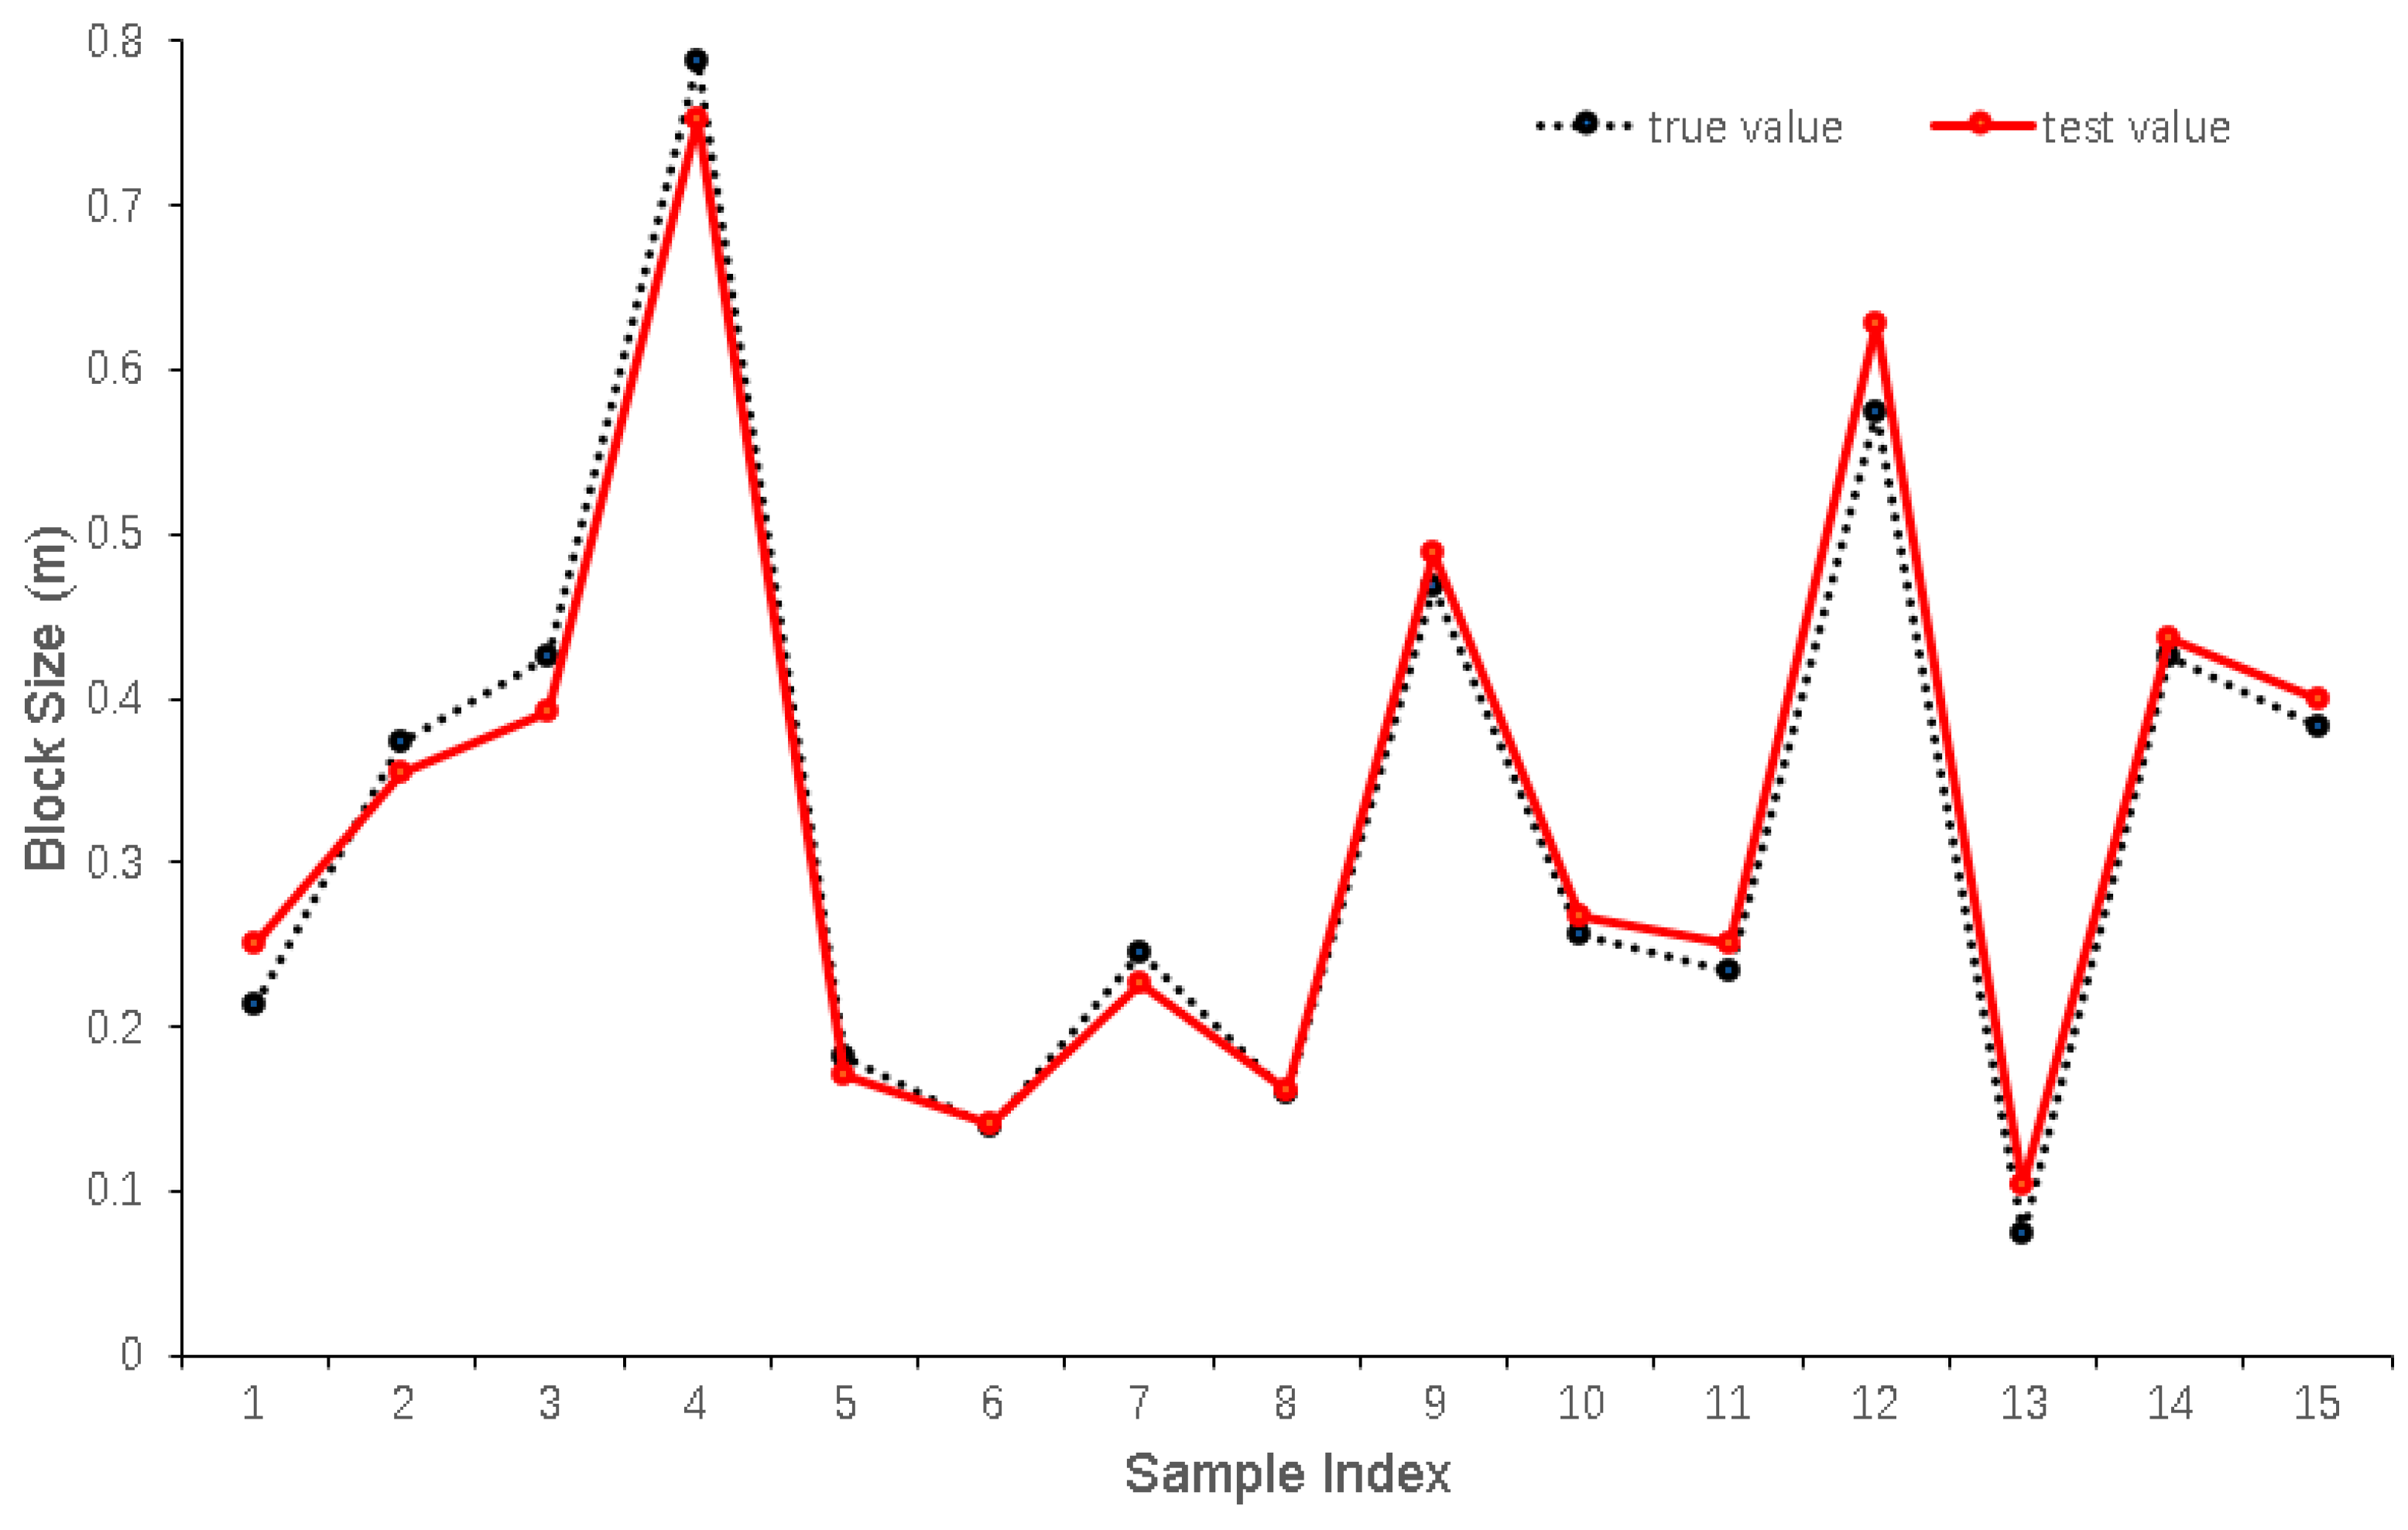
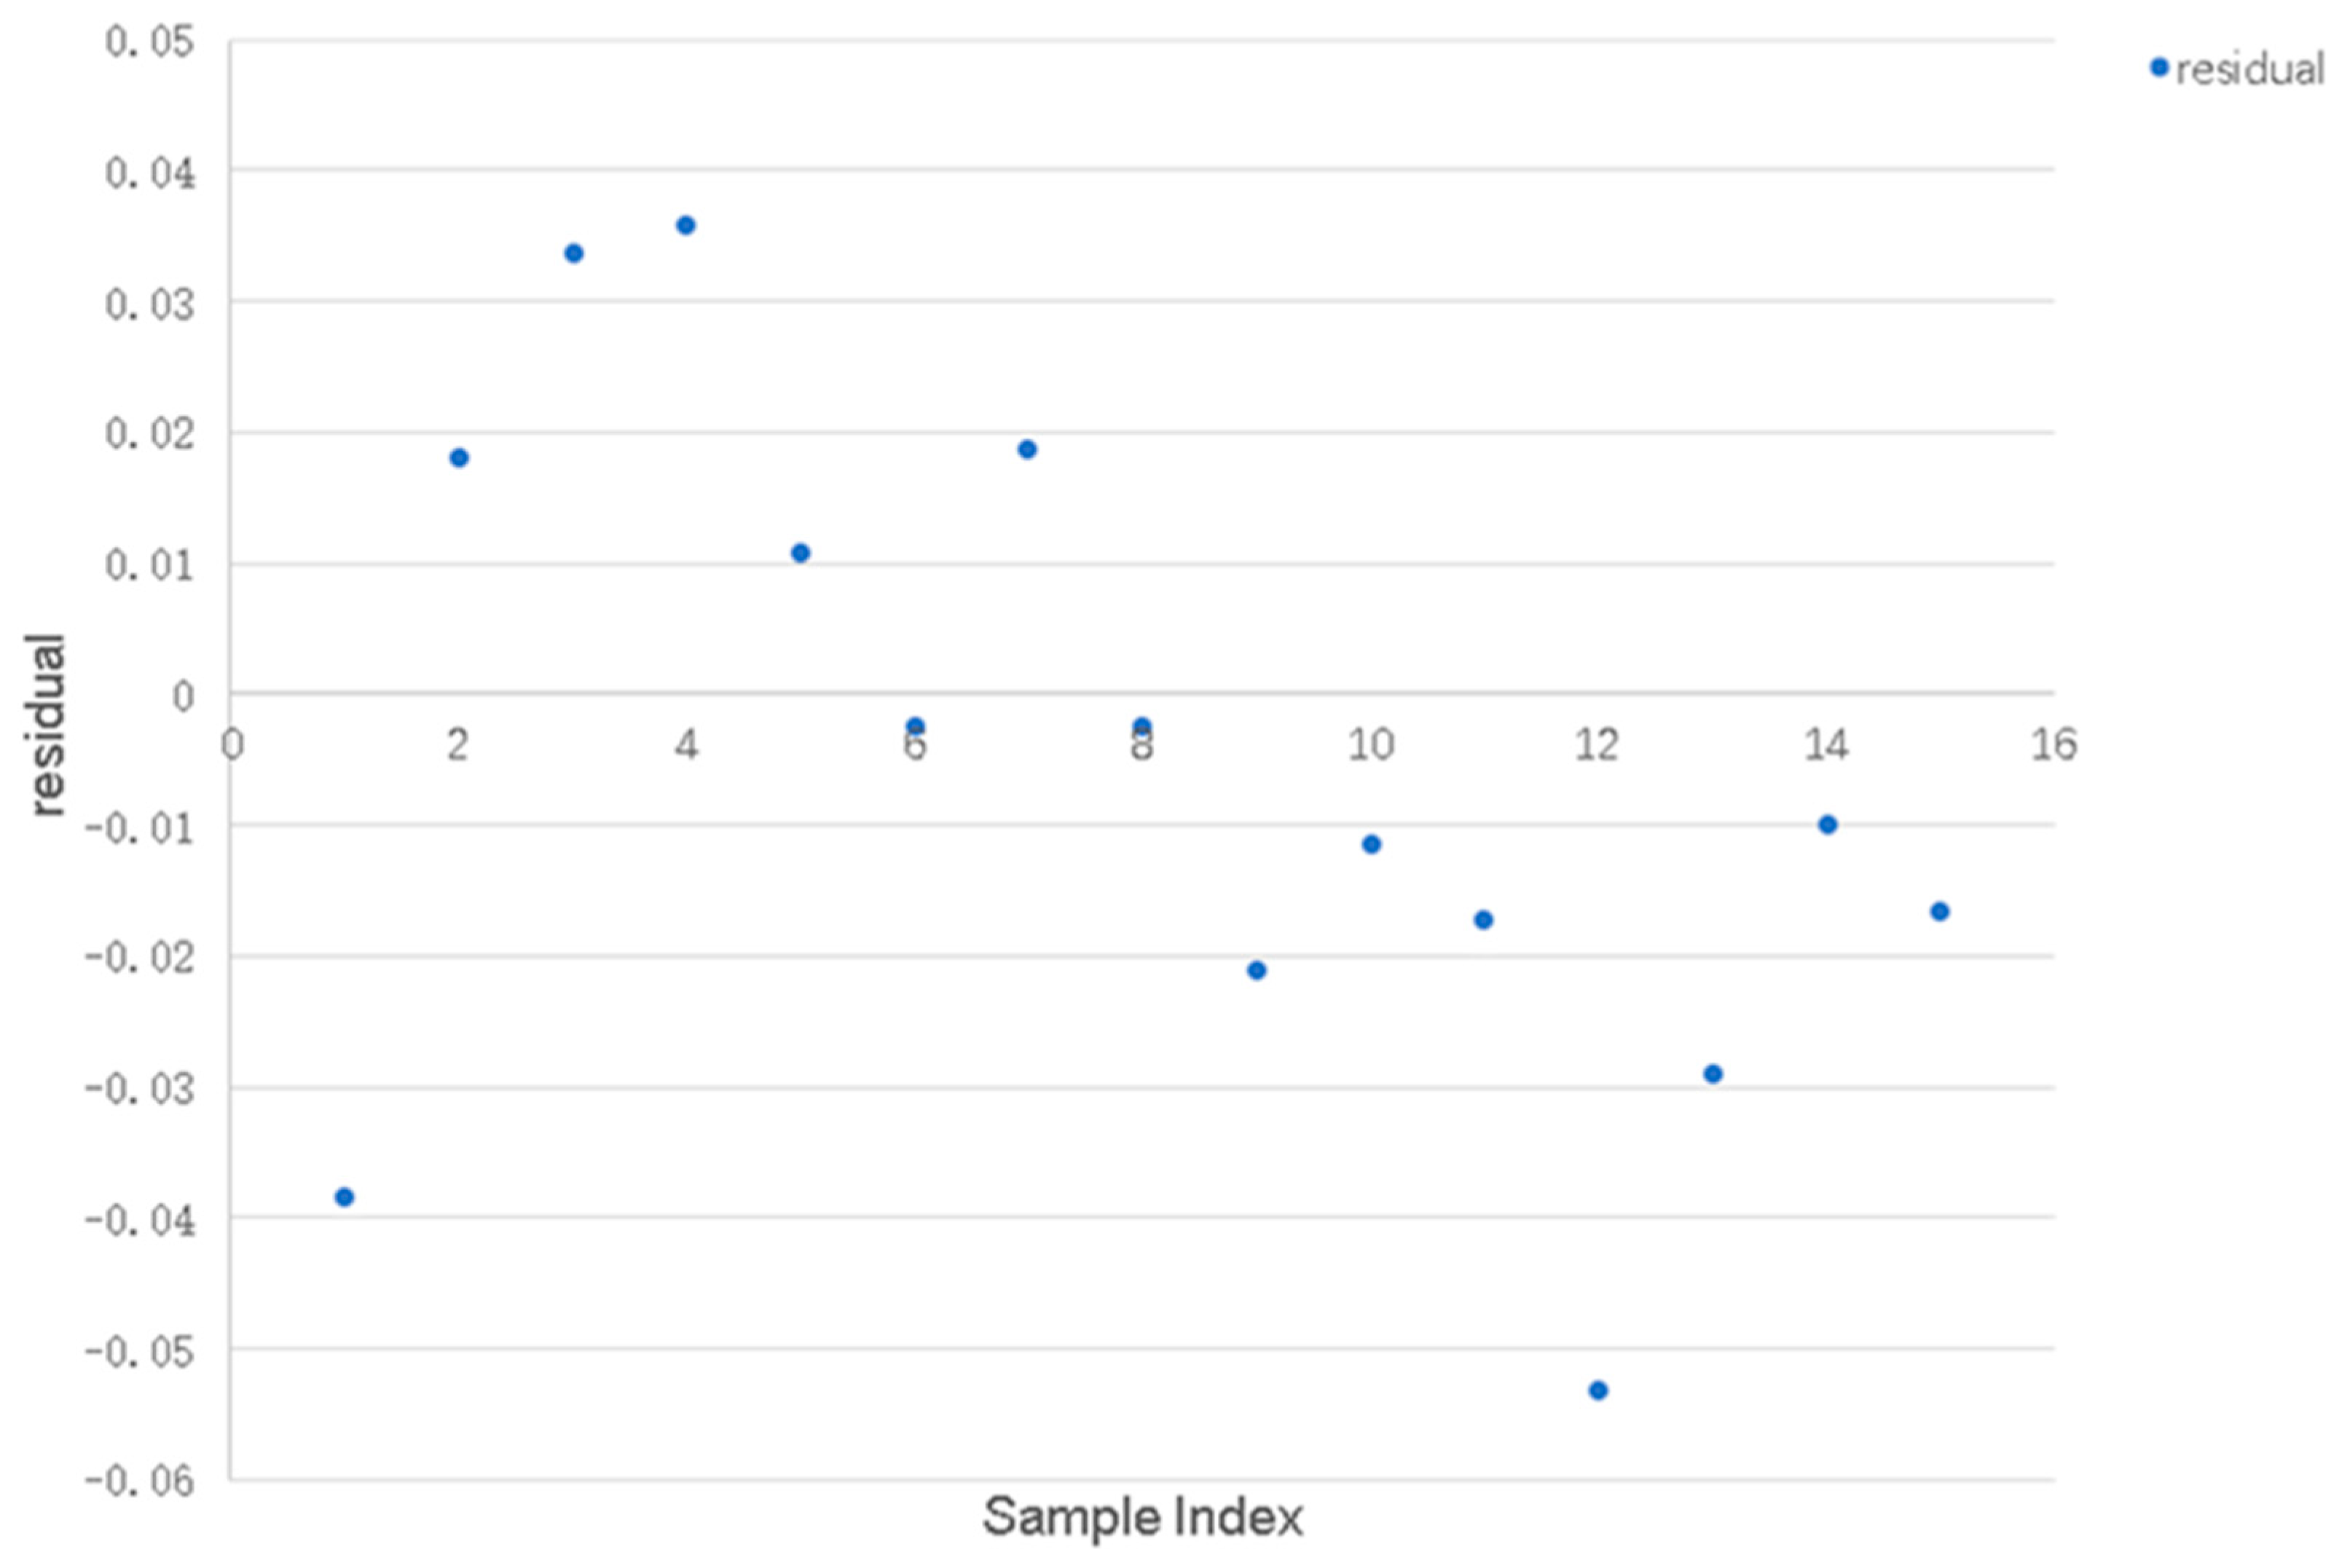
4.3. Blast Block Size Prediction and Validation Based on CPO-BP Modeling

The above 37 sets of blasting data were imported into the CPO-BP model for training, and the CPO-BP model and BP model output values are shown in Figure 6 and Table 2.
To further validate the performance of the proposed model, its results were compared with those of the standard BP model under the same dataset and parameter settings. As shown in Table 2, compared to the BP model, the CPO-BP model reduces RMSE by over 85% and MAPE by nearly 85%, demonstrating a substantial improvement in prediction accuracy. Future work will include comparisons with additional hybrid models such as GA-BP [29] and PSO-BP [30] to strengthen benchmarking and generalization analysis.
From Table 2, it can be seen that the average absolute error (MAE) of the CPO-BP model’s prediction results is 0.014341, the mean square error (MSE) is 0.00025004, the root mean square error (RMSE) is 0.015813, and the mean absolute percentage error (MAPE) is 0.037595%. These values were obtained during the engineering validation phase, where the predicted block sizes were compared with actual measured results in a real blasting project. This demonstrates that the model achieves high prediction accuracy and is effective for guiding practical blasting operations. While the model achieved a low RMSE of 0.015813 on the testing set, it is important to note that this result is based on a relatively small sample size and a single testing partition. Additional validations on larger and more diverse datasets, or through k-fold cross-validation, are recommended to further assess the model’s robustness.

5. Limitations and Future Work

The ability to accurately predict blasting fragmentation has direct implications for operational decision-making in mining. By anticipating block size distribution, engineers can adjust drilling parameters such as burden and spacing to achieve desired fragmentation levels. This, in turn, helps optimize explosive type and charge design to avoid over- or under-blasting. Furthermore, accurate prediction reduces the likelihood of excessive fines or oversize blocks, improving downstream processes such as loading, hauling, and crushing. These improvements not only enhance safety and efficiency but can also lead to significant cost savings in production. Although the proposed CPO-BP model has demonstrated strong prediction accuracy and practical applicability, several limitations should be acknowledged. First, the dataset used in this study, while real and relevant, includes only 97 samples, which may limit the statistical robustness of the results. Second, although the training data were based on the Hudaverdi dataset and the model was validated on an actual iron ore mine, the diversity of rock mass types and blasting environments is still limited. As such, the model’s performance under significantly different geological conditions remains to be evaluated.
Future studies will aim to expand the dataset to include a wider variety of rock formations, blasting parameters, and mining operations. This will enable more comprehensive validation of the model’s generalization ability and operational robustness. In addition, further investigation into ensemble learning or multi-objective optimization strategies could enhance model reliability in more complex environments.
In future studies, we plan to apply k-fold [31] cross-validation across datasets from different geological contexts to provide more robust statistical validation and prevent data partition bias. Regularization techniques were not explicitly applied; their potential benefits will be considered in future model refinements to further mitigate overfitting risks.

6. Conclusions

In this study, the model was trained and tested using the Hudaverdi blasting dataset, which is widely used in rock blasting research and includes data from various geological and operational settings. This ensures that the model learns from a broad set of blasting scenarios rather than being limited to a single mine. To further validate its applicability, the model was applied to a real-world case study involving an iron ore mine in Hunan Province, China. The results from this engineering application confirmed the model’s ability to generalize beyond the training data and accurately predict blast fragmentation under different geological conditions. These findings suggest that the CPO-BP model has strong potential for application across diverse rock types and mining operations.
While the CPO-BP model demonstrates promising performance, there remains room for enhancing the methodological robustness through integration with other complementary techniques. For instance, ensemble learning methods or hybrid metaheuristic combinations could further improve stability and generalization. Additionally, exploring deep neural network architectures or model pruning strategies may also enhance efficiency and predictive power. These directions will be considered in future work.
The CPO-BP prediction model is based on the basic principles of BP neural network and CPO algorithm, based on an iron ore mine in Hunan province, using the CPO algorithm to optimize the weights and bias of the BP neural network and combining with the typical blasting data for the training and testing of the model, so as to validate the reliability of the model in predicting the blasting block size and practical engineering applications. It is summarized as follows:
(1)
The CPO-BP model was trained and tested using the Hudaverdi blasting dataset, a representative and widely used database in blasting research. To verify its practical utility, the model was also applied to a real-world iron ore mine in Hunan Province, China. Results from both the benchmark dataset and the field validation confirm that the model can generalize well across different blasting conditions and deliver high prediction accuracy, indicating its potential for broad engineering application.
(2)
Although the model demonstrated high accuracy on the current dataset, its generalization ability across different geological conditions and blasting environments remains to be verified. Future research will explore applying the CPO-BP model to other datasets to further evaluate its robustness and practical transferability.

Author Contributions

Conceptualization, C.H. and X.X.; methodology, C.H. and X.X.; software, C.H.; validation, C.H. and X.X.; formal analysis, C.H.; investigation, C.H.; resources, C.H. and X.X. data curation, C.H.; writing—original draft preparation, C.H.; writing—review and editing, X.X.; visualization, C.H.; supervision, X.X.; project administration, X.X. All authors have read and agreed to the published version of the manuscript.

Funding

This research received no external funding.

Institutional Review Board Statement

Not applicable.

Informed Consent Statement

Not applicable.

Data Availability Statement

The data presented in this study are available upon request from the corresponding author. If any researcher is in need of the data and codes, email: 235512119@csu.edu.cn.

Conflicts of Interest

The authors declare no conflicts of interest.

References

  1. Peleg, M. Determination of the parameters of the Rosin-Rammler and beta distributions from their mode and variance using equation-solving software. Powder Technol. 1996, 87, 181–184. [Google Scholar] [CrossRef]
  2. Kuznetsov, V.M. The mean diameter of the fragments formed by blasting rock. Sov. Min. Sci. 1973, 9, 144–148. [Google Scholar] [CrossRef]
  3. Cunningham, C. The Kuz-Ram model for prediction of fragmentation from blasting. First Int. Symp. Rock Fragm. Blasting 1983, 2, 439–453. [Google Scholar]
  4. Zheng, R.C. Bond-Ram model for rockburst lumpiness distribution prediction. Met. Mine 1988, 23, 11–15+29. [Google Scholar]
  5. Zhou, D.X. A three-dimensional mathematical model for calculating the blasting blockiness distribution of an open-pit mine step. Explos. Shock. Waves 1984, 4, 48–59. [Google Scholar]
  6. Liu, W.Z. Three-dimensional mathematical model of energy flux distribution and fragmentation composition in step blasting. Met. Mine 1987, 22, 25–28. [Google Scholar]
  7. Kanchibotla, S.S.; Valery, W.; Morrell, S. Modelling fines in blast fragmentation and its impact on crushing and grinding. Proc. Explo 1999, 99, 137–144. [Google Scholar]
  8. Ouchterlony, F. The Swebrec© function: Linking fragmentation by blasting and crushing. Min. Technol. 2005, 114, 29–44. [Google Scholar] [CrossRef]
  9. He, L.; Liu, Y.H.; Li, L.N.; Chen, J.W.; Yao, Y.K.; Liu, C.B. Prediction of blast vibration velocity in mines based on particle swarm—Least squares support vector machine model. Met. Mine 2022, 57, 145–150. [Google Scholar] [CrossRef]
  10. Kulatilake, P.; Qiong, W.; Hudaverdi, T.; Kuzu, C. Mean particle size prediction in rock blast fragmentation using neural networks. Eng. Geol. 2010, 114, 298–311. [Google Scholar] [CrossRef]
  11. Asl, P.F.; Monjezi, M.; Hamidi, J.K.; Armaghani, D.J. Optimization of flyrock and rock fragmentation in the Tajareh limestone mine using metaheuristics method of firefly algorithm. Eng. Comput. 2018, 34, 241–251. [Google Scholar] [CrossRef]
  12. Hudaverdi, T.; Kulatilake, P.; Kuzu, C. Prediction of blast fragmentation using multivariate analysis procedures. Int. J. Numer. Anal. Methods Geomech. 2011, 35, 1318–1333. [Google Scholar] [CrossRef]
  13. Shi, X.; Jian, Z.; Wu, B.; Huang, D. Support vector machines approach to mean particle size of rock fragmentation due to bench blasting prediction. Trans. Nonferrous Met. Soc. China 2012, 22, 432–441. [Google Scholar] [CrossRef]
  14. Yang, X.; Yang, Z.Q.; Gao, Q.; Xue, G. Prediction of rock mass fragmentation based on joint network simulation and fractal theory. J. Taiyuan Univ. Technol. 2015, 46, 318–322. [Google Scholar]
  15. Duan, B.F.; Fe, H.L. Application of neural network model in step blasting blockiness prediction. Eng. Blasting 1999, 5, 25–29. [Google Scholar]
  16. Liu, Y.; Tan, K.X.; Guo, Q.P. Prediction of rock blasting fragmentation using random forest and GA. BP Neural Netw. Ming Res. Dev. 2021, 41, 135–140. [Google Scholar]
  17. Liu, X.B.; Yuan, P.Z.; Zhang, X.F. Research on prediction of blasting effect in open pit mines based on RBF neural network. China Min. Mag. 2020, 19, 81–84. [Google Scholar]
  18. Ye, H.W.; Hu, J.J.; Lei, T.; Li, N.; Wang, Q.Z. LOO-XGBoost model prediction of rock blasting fragmentation. Blasting 2022, 39, 16–21. [Google Scholar]
  19. Guan, F.S.; Wu, M.F.; Luo, Z.; Yao, Q.; Liao, Y.B.; Li, H.T. Prediction of rock mass blasting blockage based on grey correlation analysis and GA-BP model. Explos. Mater. 2021, 50, 40–47+53. [Google Scholar]
  20. Liu, X.; Xie, T.; Wang, X.H.; Yi, Z.B.; He, Q.Z. Rock blasting fragmentation prediction based on improved random forest algorithm. Ming Res. Dev. 2022, 42, 25–29. [Google Scholar]
  21. Abdel-Basset, M.; Mohamed, R.; Abouhawwash, M. Crested Porcupine Optimizer: A new nature-inspired metaheuristic. Knowl.-Based Syst. 2024, 284, 111257. [Google Scholar] [CrossRef]
  22. Liu, Y.; Mao, Y.; Xu, S.C.; Li, B.; Gu, Y.; Zhang, J.K.; Jiang, N. Prediction of blast blockiness based on PSO-BPNN model. Blasting 2024, 41, 136–142. [Google Scholar]
  23. Hu, X.B.; Chen, Z.Y.; Wei, G.P.; Wei, Z.; Wang, G.; Song, J.W. Blasting vibration prediction system based on BP neural network. Min. Res. Dev. 2020, 40, 154–158. [Google Scholar] [CrossRef]
  24. Dai, S.; Su, H.Z.; Gu, Y. Dam deformation monitoring model based on HO-BP-AdaBoost. Water Resour. Power 2025, 43, 153–156+108. [Google Scholar]
  25. Wang, X.M.; Zhao, B.; Wang, X.L. Optimization of rock drilling and blasting parameters based on BP neural network. J. Cent. South Univ. (Sci. Technol.) 2009, 40, 1411–1416. [Google Scholar]
  26. Bo, Z. Prediction of NEP of Rotor Spinning Yarn by Means of Intelligent Theory. In Information Engineering Research Institute, USA, Proceedings of the 2012 2nd International Conference on Mechanical, Industrial, and Manufacturing Engineering (Volume 1 · 2012), Singapore, 27–28 June 2012; College of Textiles, Zhongyuan University of Technology: Zhengzhou, China, 2012; Volume 6. [Google Scholar]
  27. Zhou, Y. Research on Rolling Bearing Fault Diagnosis Technology Based on MIV Feature Screening and BP Neural Network. Master’s Thesis, Beijing Jiaotong University, Beijing, China, 2011. [Google Scholar]
  28. Zhang, Z.Y.; Jin, J.X. Prediction of Peak Velocity of Blasting Vibration Based on Artificial Neural Network Optimized by Dimensionality Reduction of FA-MIV. Math. Probl. Eng. 2018, 2018, 8473547. [Google Scholar] [CrossRef]
  29. Hu, Y.H.; He, M.; Zhou, C.J.; Ding, Z.H.; Cai, C.G.; Ma, X.Y.; Zhang, J.J. Research on prediction of vibration velocity of millisecond delay blasting based on GA-BP neural network. China Min. Mag. 2022, 31, 72–77. [Google Scholar]
  30. Zhao, G.Y.; Sun, G.D.; Dai, B.; Chen, Y. Application of BP network improved by PSO in optimization of blasting rate. Blasting 2017, 34, 15–19. [Google Scholar]
  31. Wong, T.T.; Yeh, P.Y. Reliable accuracy estimates from k-fold cross validation. IEEE Trans. Knowl. Data Eng. 2019, 32, 1586–1594. [Google Scholar] [CrossRef]
Figure 1. CPO-BP model process.
Applsci 15 06312 g001
Figure 2. The comparison between the output values of CPO-BP training and the actual values.
Applsci 15 06312 g002
Figure 3. Comparison of CPO-BP test output value with real value.
Applsci 15 06312 g003
Figure 4. Plot of CPO-BP test value vs. true value residuals.
Applsci 15 06312 g004
Figure 5. MIV calculation results.
Applsci 15 06312 g005
Figure 6. Comparison of the predicted value and the real value of the CPO-BP algorithm and the BP algorithm.
Applsci 15 06312 g006
Table 1. Field experimental data.
Hole Distance (m)Resistance Line (m)Unit Consumption of Explosives (kg-m−3)Drilling Extra Deep (m)Fracture Development (T)p50 (m)
5.804.300.450.8010.357
5.804.300.491.2010.314
5.804.300.492.2010.318
5.804.300.472.0010.324
5.804.800.411.5010.397
5.804.800.382.0020.450
5.804.300.460.5010.349
5.804.300.482.5010.317
5.804.300.361.5020.480
5.804.800.331.5010.530
5.504.300.481.5010.321
5.804.300.511.5010.298
4.305.500.361.5020.443
5.504.500.350.5010.458
5.804.300.402.5010.406
5.804.800.320.5010.557
5.504.300.402.5010.398
5.804.300.421.0010.391
5.504.300.401.0020.401
5.804.500.391.5020.447
5.804.500.371.5010.505
5.504.300.4220.0020.388
5.504.500.392.0010.441
5.504.300.452.0010.350
5.804.300.421.5010.395
5.804.300.371.5010.486
5.804.300.411.5010.402
5.504.300.492.0020.308
5.504.300.471.5010.495
5.804.500.372.0010.516
5.504.500.361.5010.489
5.504.300.391.5010.431
5.504.500.401.5010.396
5.504.300.391.5020.433
5.804.800.391.5010.464
5.004.000.542.0010.295
5.504.300.402.0010.409
Table 2. CPO-BP model and BP model prediction evaluation index.
MouldCPO-BPBP
Mean Absolute Error MAE0.0143410.094344
Mean Square Error MSE0.000250040.011837
Root Mean Square Error RMSE0.0158130.1088
Mean Absolute Percentage Error MAPE0.037595%0.25274%
Disclaimer/Publisher’s Note: The statements, opinions and data contained in all publications are solely those of the individual author(s) and contributor(s) and not of MDPI and/or the editor(s). MDPI and/or the editor(s) disclaim responsibility for any injury to people or property resulting from any ideas, methods, instructions or products referred to in the content.

