1. Introduction
In the design of large infrastructures, such as facilities for international scientific experiments, one of the critical requirements is the earthquake-induced acceleration. The particle accelerators built by the High Energy Accelerator Research Organization (KEK) in Japan [
1] and the European Southern Observatory’s Extremely Large Telescope (ESO’s ELT) [
2,
3] are two very meaningful examples. Notably, the ELT is located in Armazones, Chile, near the region affected by the most potent recorded earthquake to date, the Valdivia Earthquake of 22 May 1960. Earthquake requirements also significantly influence the design of nuclear power plants in multiple countries.
The design process of structures against seismic loads is extensively studied by national norms, such as Eurocode 8 [
4] for the European Union. These norms thoroughly cover the design and verification procedures for structures and buildings and offer both linear and non-linear approaches. In the linear case, the seismic design is based on the Acceleration Response Spectrum (RS) [
5], a plot of the maximum absolute acceleration experienced by a simple oscillator, in response to a certain transient input load, as a function of the natural frequency of the 1-dof oscillator. This tool is common for studying the effect of transient vibrations or shocks. Except for structures entering the post-elastic regime, which can be analyzed with a pushover non-linear analysis [
6], all the non-linear systems are studied via time history transient simulations that are very system-specific and do not facilitate deriving general rules.
Installing and maintaining the delicate assemblies that comprise an experiment require a daily use of cranes, which lift and move hoisted loads. This operation poses risks to personnel and to the integrity of often unique, expensive and schedule-critical systems. In the event of an earthquake, the crane rope can become temporarily slack (i.e., it loses its tension) and then determine an increased acceleration to the lifted systems once the rope regains its tension [
7]. This type of oscillation is highly non-linear, and the acceleration experienced by the hoisted load is not properly forecast by linear techniques.
This paper generalizes the response of hoisted loads and estimates the intensification factor in the acceleration experienced with respect to the one of a given linear design RS. The result is based on a large number of parametric simulations with a Monte Carlo approach, which is suitable for capturing the uncertainties and variability inherent in seismic events. The Monte Carlo method allows for exploring a wide range of potential scenarios, which is essential for preliminary design considerations.
To obtain a generic parameter-free result, we implement a first-order model of the hoisted load and generate statistical earthquake load histories with a simple, but established, approach. The use of older references is justified as they are foundational works that established key concepts in the field. While newer references can provide an additional context, these classic works remain relevant and are regularly used in design work. We also note that a hoist crane is a sub-system hosted by a structure, which transfers an input ground earthquake into an interface load and decouples this study from detailed knowledge of ground earthquakes.
In
Section 1, we see the process of generating a realistic earthquake time history compliant with a certain RS. In
Section 2, we discuss the hoisted load’s simple mathematical model and the typical values of the physical parameters. In
Section 3, we discuss the effect of damping on the RS. Finally, in the last section, we collect and discuss the results, providing an upper value for the intensification factor.
2. Generation of Acceleration Time Histories
Conducting a large number of simulations using a Monte Carlo approach requires an equally large set of generic acceleration time histories that must comply with a prescribed design response spectrum
. The methodology used to generate the time histories follows the approach described in Levy (1976) [
8]. The Eurocode 8 (EC8) design code leaves significant freedom on how accelerograms should be selected [
9]. As a trade-off, we use [
8], which is very simple while still ensuring compliance with the given design spectrum. Discussing modern tools for the generation of spectrum-compatible accelerograms goes beyond the scope of this work and can be investigated in several other references [
10,
11,
12]. The process can be summarized as follows:
- 1.
Initialization of the frequency vector, where the frequency step is defined as follows:
- 2.
Derivation of the time envelope, , from a recorded earthquake time history.
- 3.
Construction of a synthetic time history as follows:
where the initial amplitudes
are set proportional to the response spectrum at the corresponding frequencies
.
- 4.
Calculation of the response spectrum of the generated synthetic time history. The amplitudes are then adjusted iteratively using the relation:
The response spectrum is computed following the algorithm described in [
13].
- 5.
Iteration of steps 3 and 4 until the synthetic response spectrum closely matches the target spectrum .
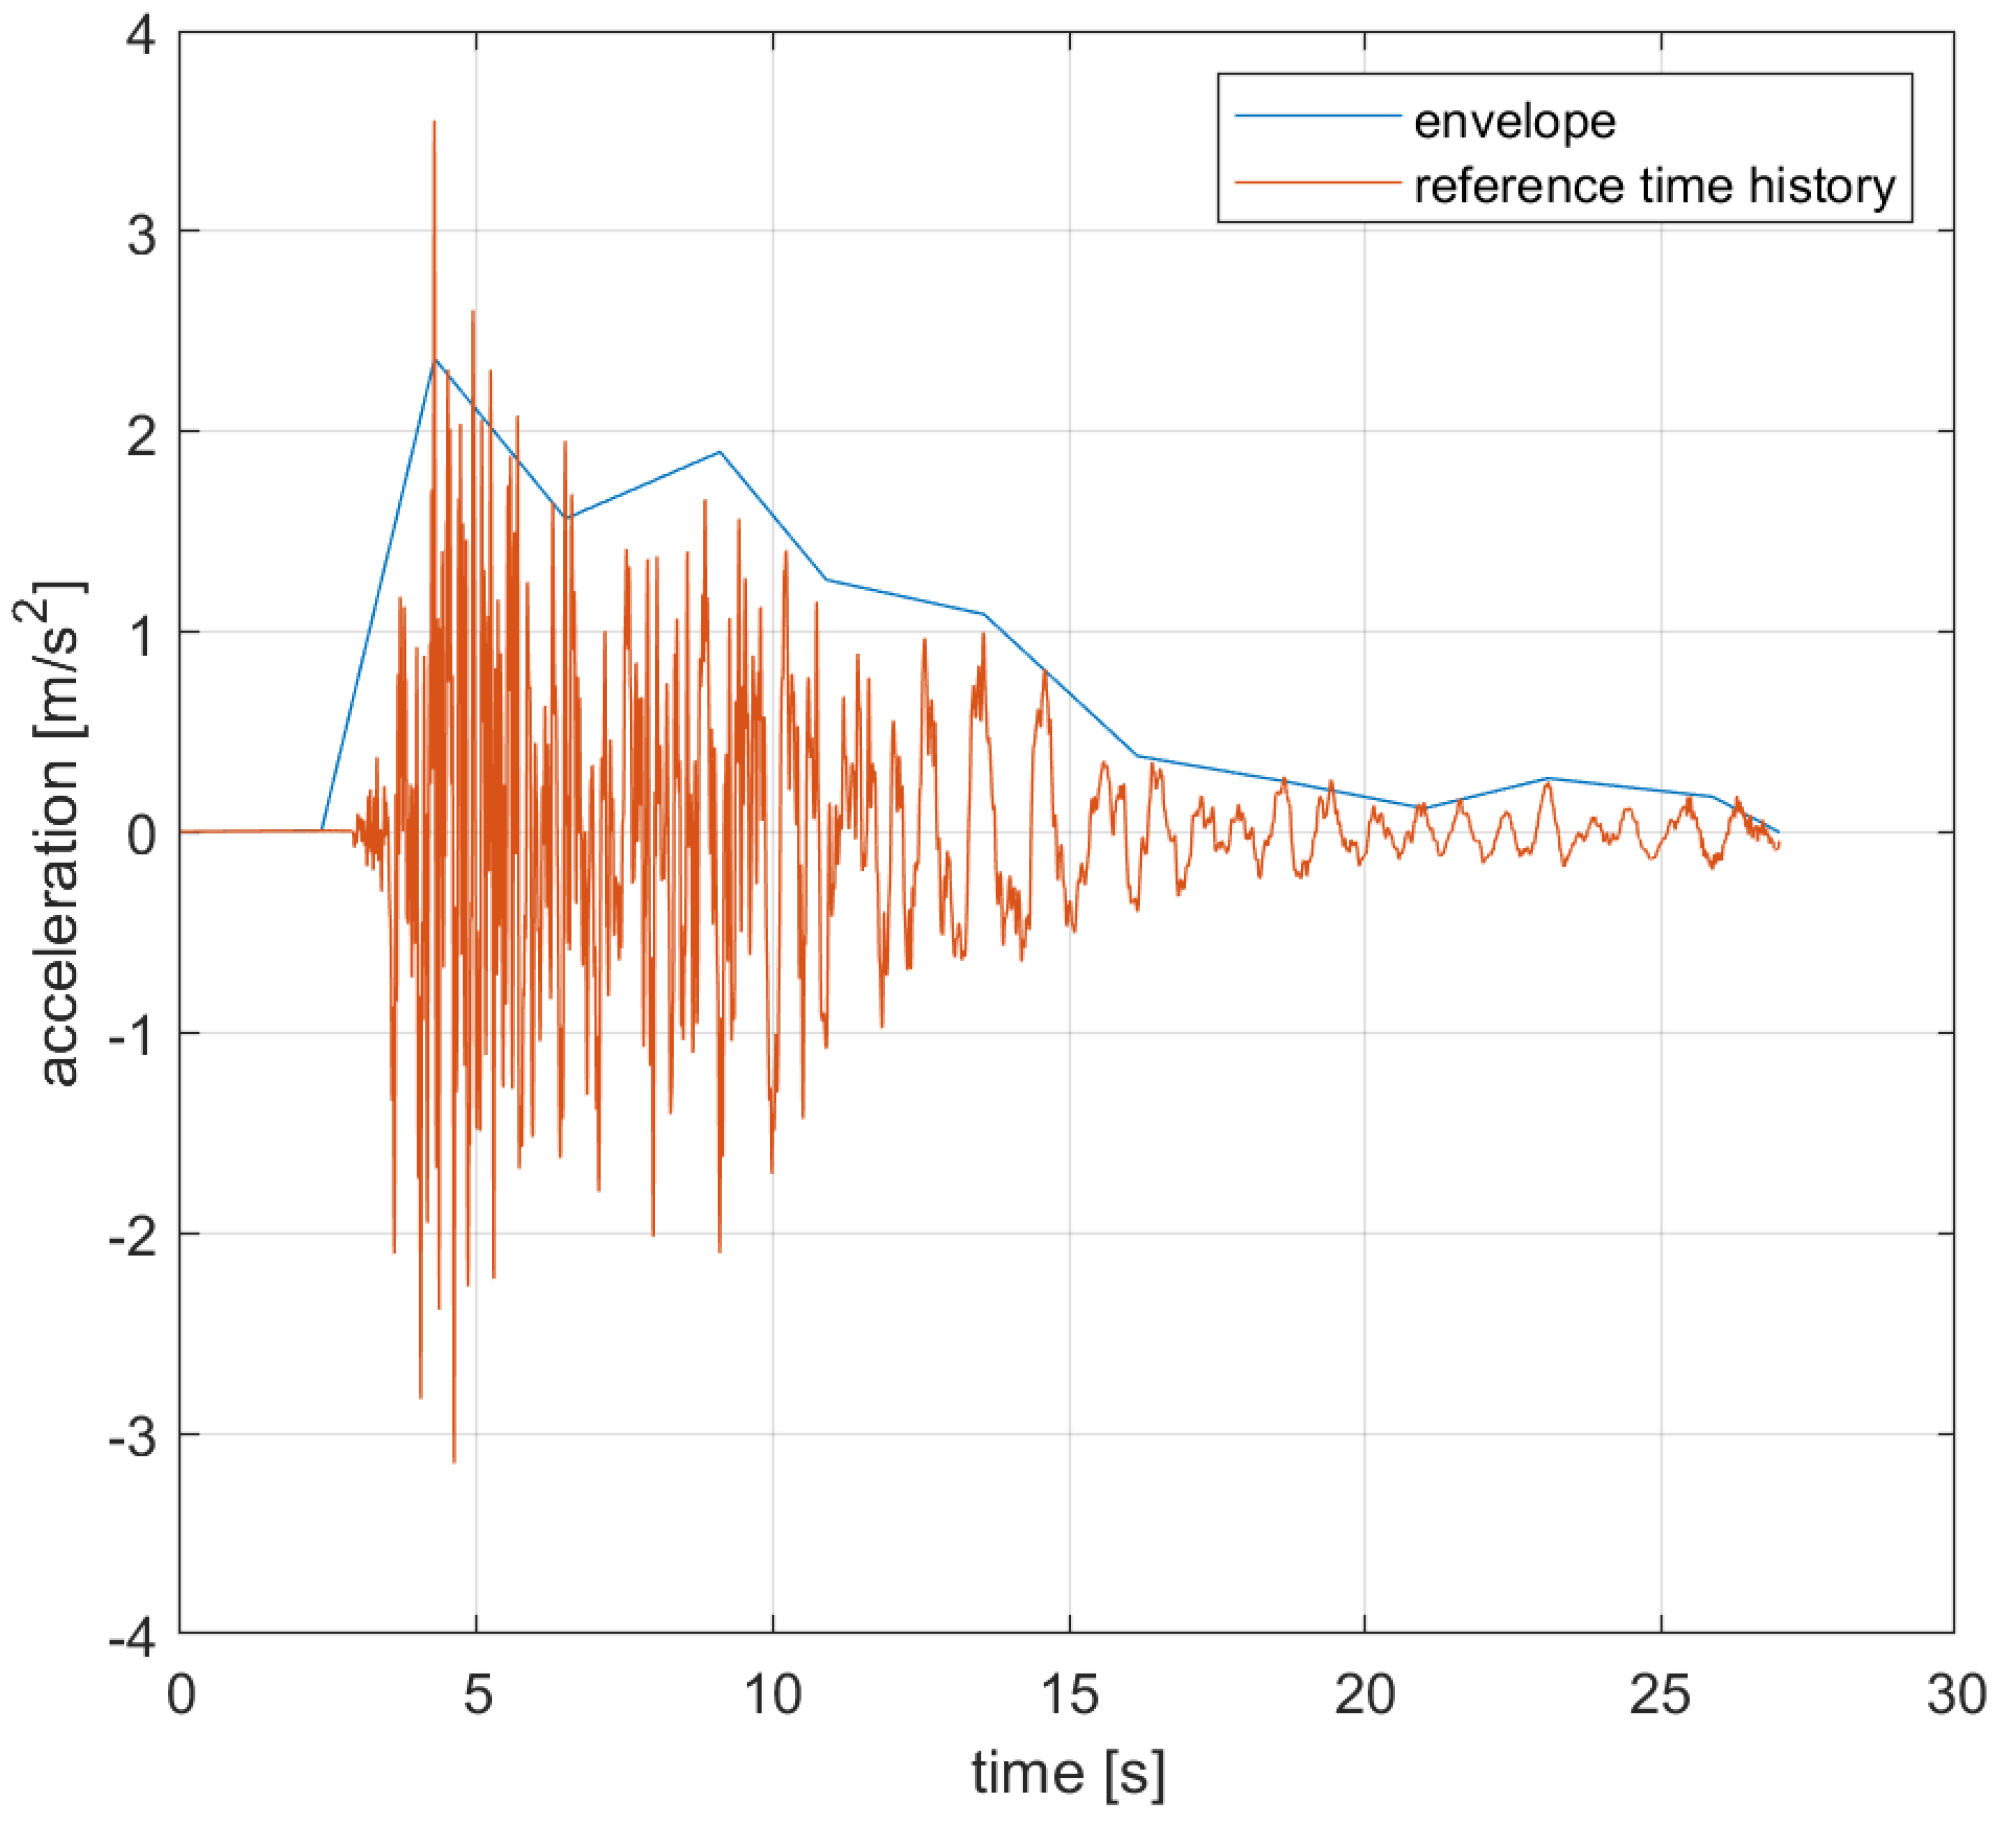
As a reference earthquake time history, we used the L’Aquila earthquake (Abruzzo region, Italy), which occurred on 6 April 2009 at 01:32:40 UT (
Figure 1). The accelerations were recorded by the AQK station and are available in the ITACA database (ITalian ACcelerometric Archive, [
14]).
Using this time history ensures a realistic temporal evolution representative of an actual seismic event. However, since the frequency content is independently adjusted to match the design spectrum and the envelope function is randomized, the choice of the reference earthquake does not introduce any loss of generality.
A few modifications are applied to the procedure above. First, the rescaling of Equation (
3) in the first iterations is applied as follows:
which empirically shows beneficial effects on the convergence. Meanwhile, the time envelope is randomized by a uniform
% factor at each of its points to limit its systematic effect. Finally, for each time history, each one of the harmonic functions of Equation (
2) is assigned a random phase, with a
uniform distribution. This is a key aspect to be able to generate a large number of different time histories inducing different transient responses in the system under analysis.
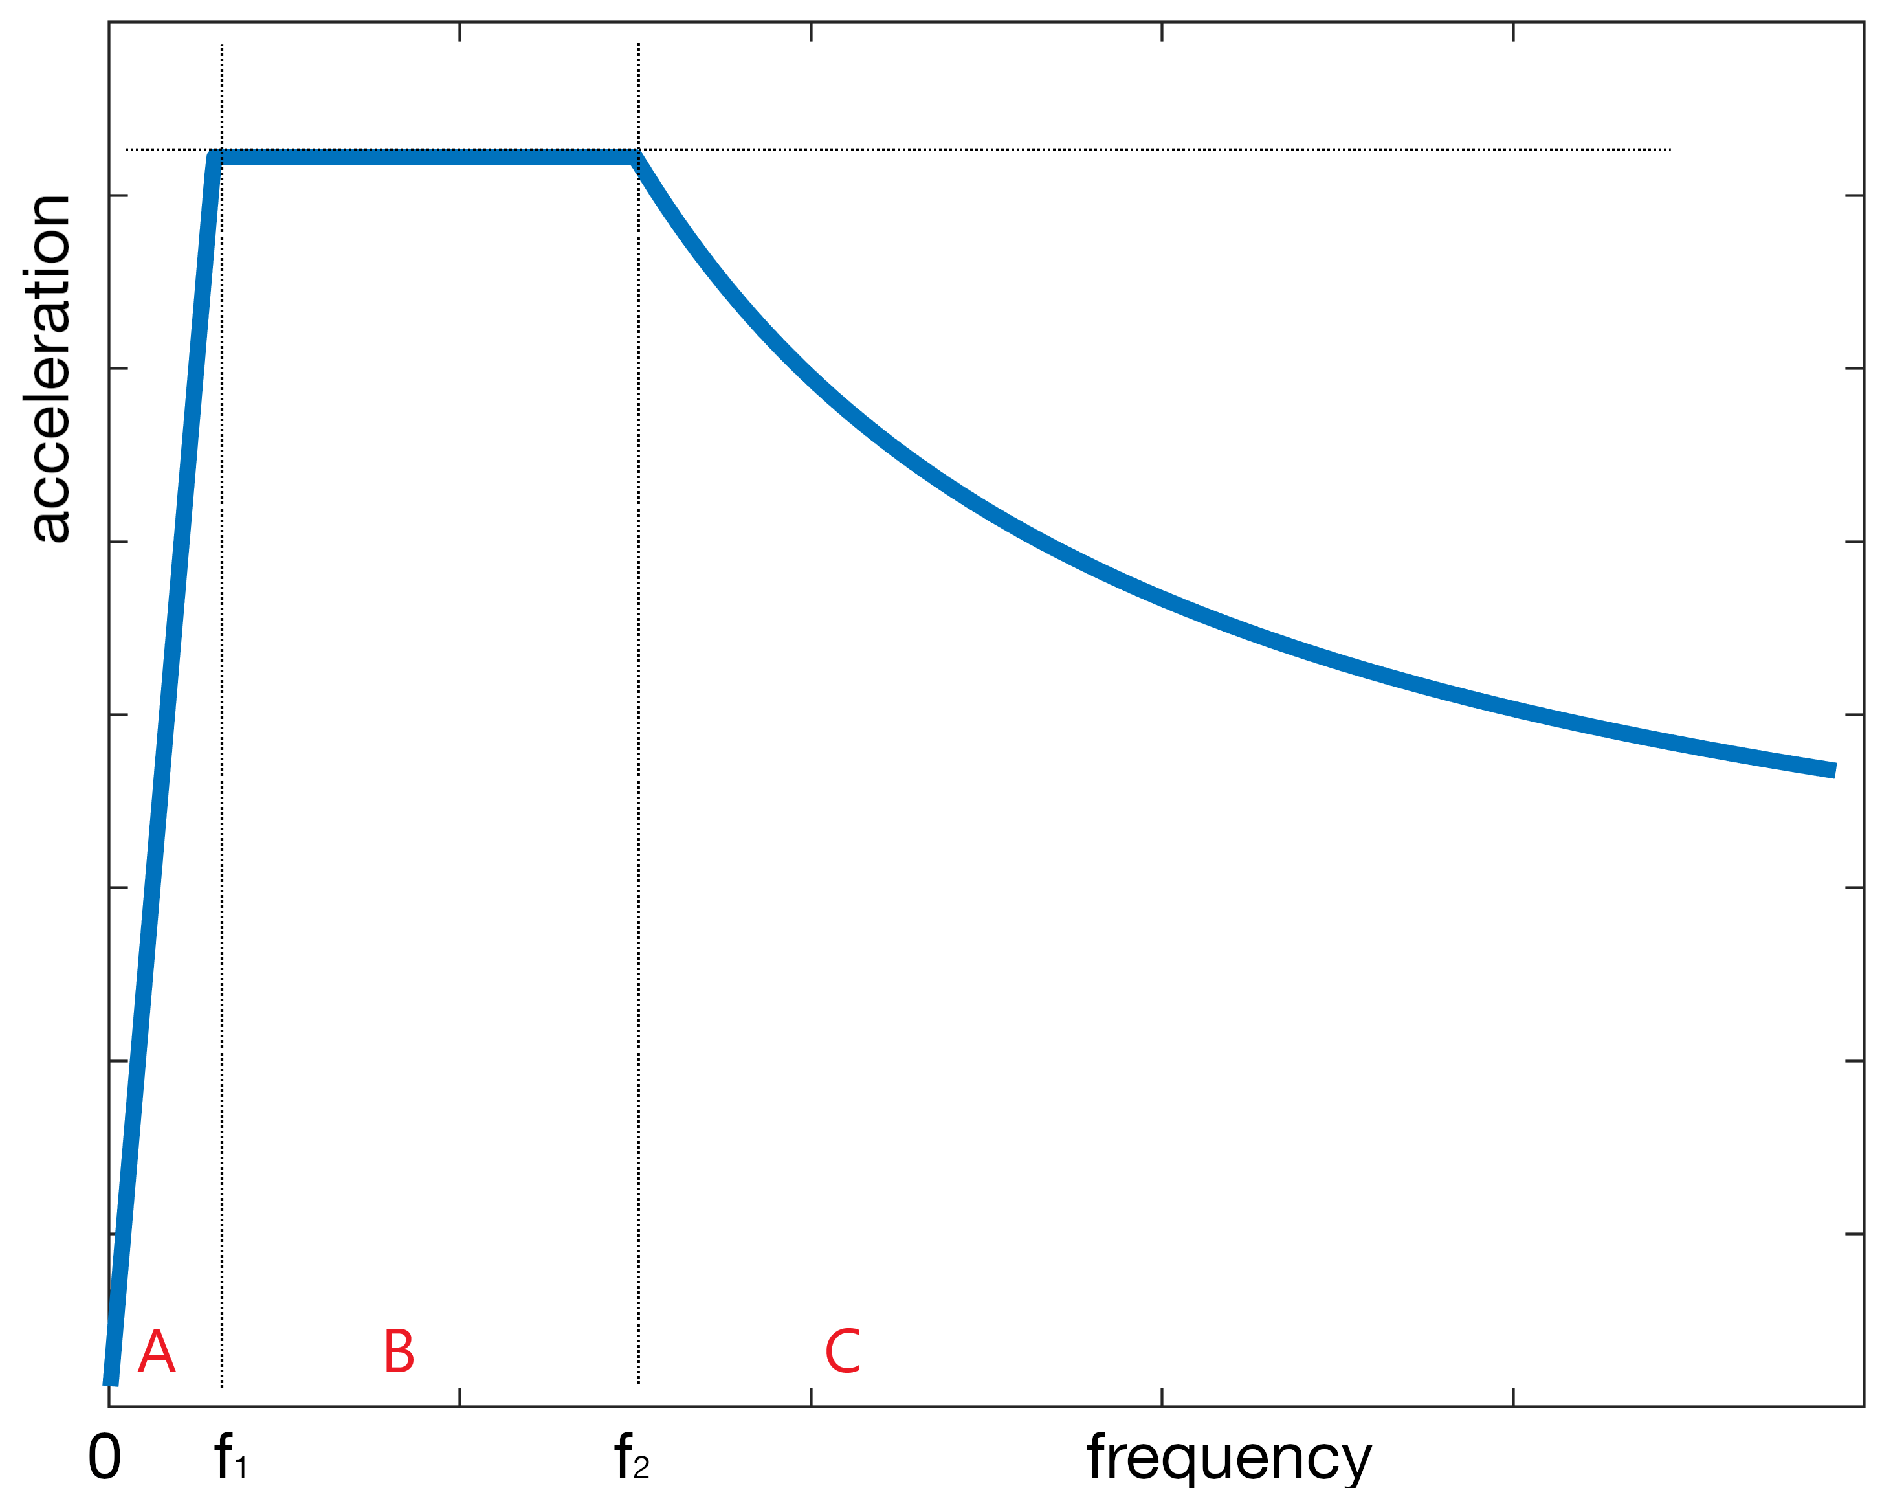
The typical target RS is shown in
Figure 2, where
The shape of this idealized RS is given in the Eurocode 8 [
4] and is based on what is used for the Extremely Large Telescope [
2,
3]. We omit here a first frequency range in which the RS is proportional to
because it concerns only very low frequencies (<1 Hz) that are not of interest for a slack rope in a crane, which can happen only with accelerations above 1×
g typical of higher frequencies. We chose as
and
6 Hz and 30 Hz, respectively. In
Section 5, it is shown that these boundaries have a negligible effect on the intensification factor. The magnitude of the constant in the plateau is one of the parametrized values. Note that the RS we need here is the one of a system attached to a structure, not directly the RS of the soil.
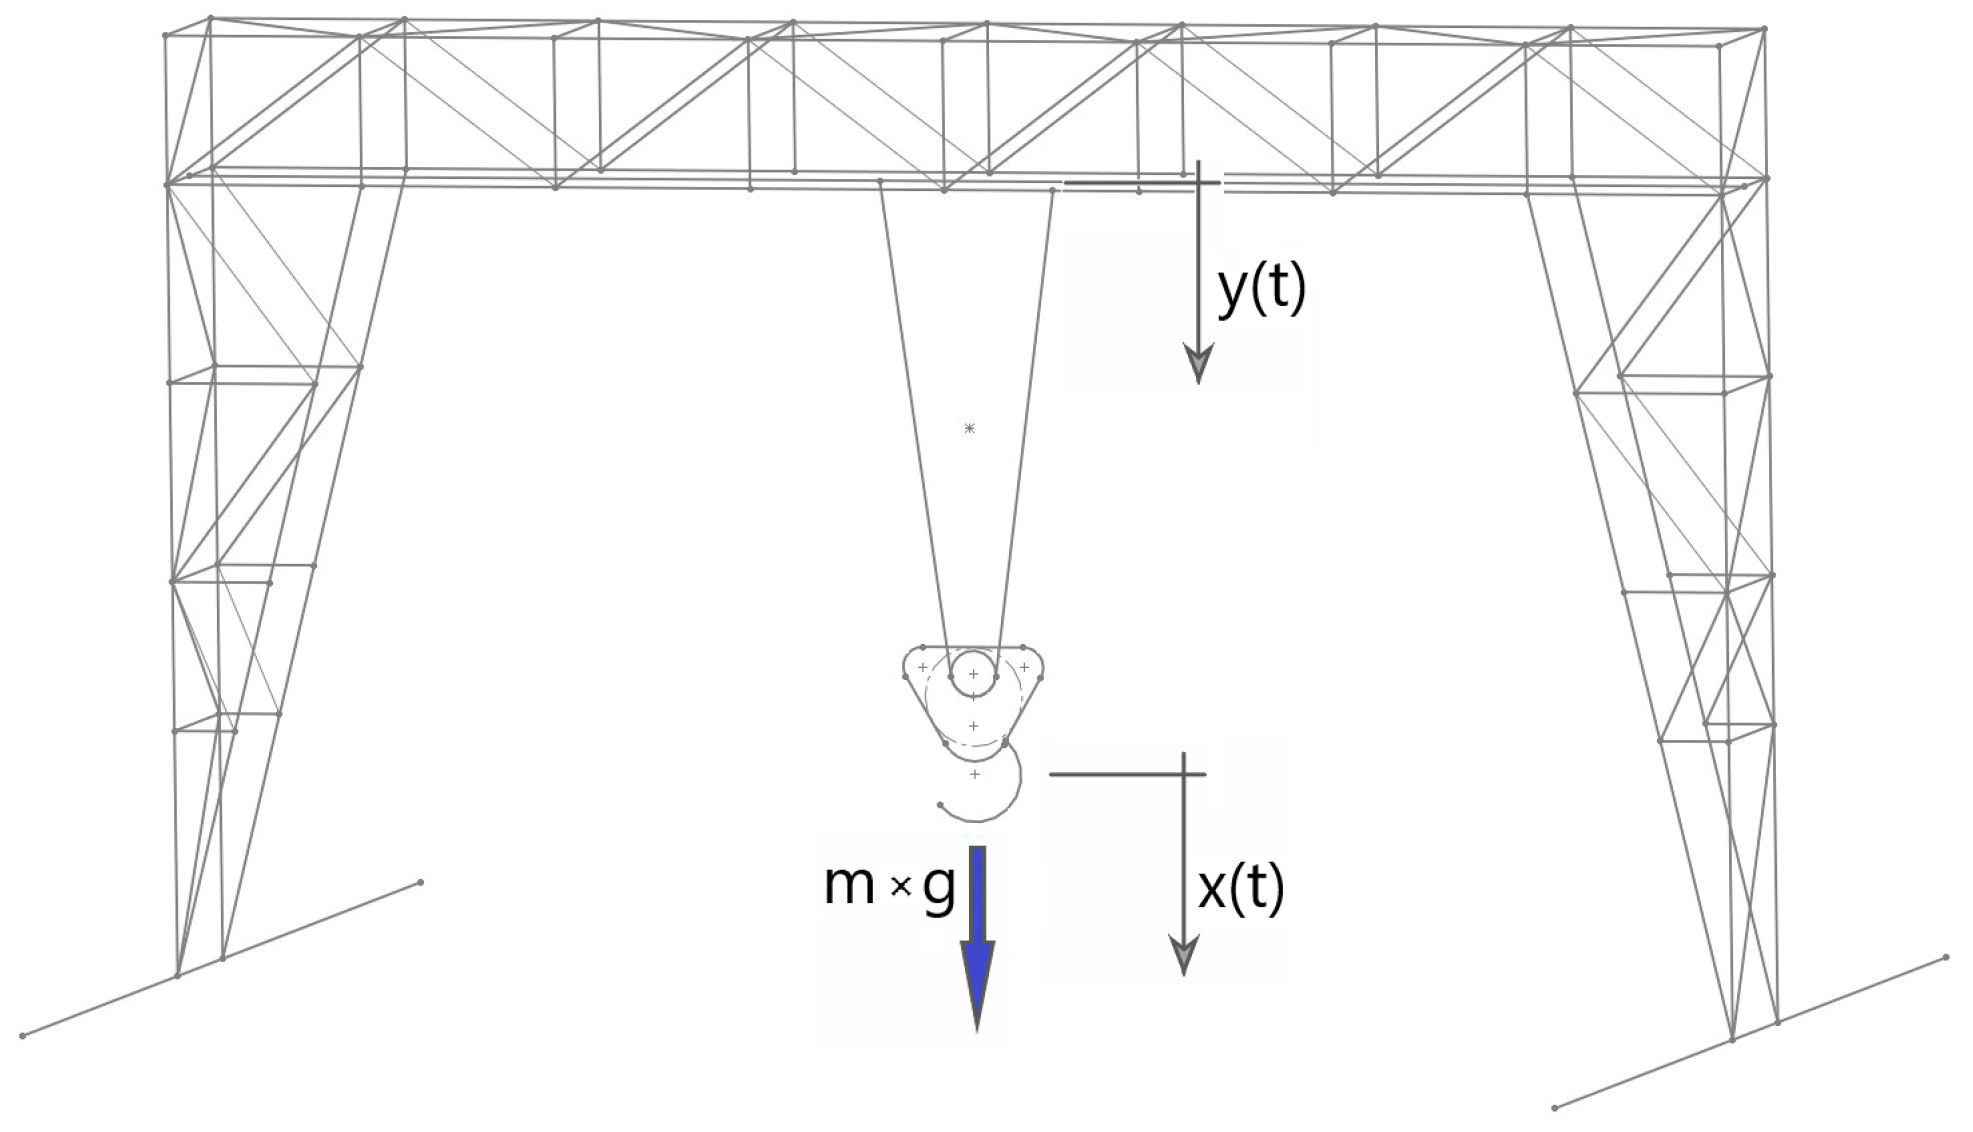
3. Dynamic Model of the Hoist Load
Cranes are well known devices and consist of a structure supporting the pivot point that is then connected to the hoisted load via one or more vertical ropes, usually folded back via some pulleys located near the hook. The motors are located either close to the pivot point or at the base of the support structure and enable the motion of the pivot point, usually in a plane, and the winding or unwinding of the ropes.
The resulting system has vertical dynamics, given by the elasticity of the ropes, and horizontal pendulum-like dynamics. We neglect here this horizontal dynamics because the natural frequency is low, e.g., below 0.25 Hz for lengths equal or above 5 m, which are typical for research infrastructures. The reader can see, for instance, the cranes used in the high-luminosity upgrade of the LHC at CERN [
15] (see Section 17.6.4 of the technical report). Low natural frequencies are decoupled from the typical resonances of the structure and are not excited in a significant way. The crane trolley should also be assumed blocked during a seismic event due to the use of emergency braking.
Considering only the vertical dynamics,
Figure 3, and assuming that the motion of the pivot point is given by the supporting structure and is determined by the design of the support structure, the simplified motion equation of a hoist load with mass
m, in the non-inertial frame of the pivot, is as follows:
where
is the difference between the motion of the hoist load and the one of the pivot,
. The input acceleration
is equal to
. The stiffness and damping are non-linear functions:
This means that the hoist load is in free fall when the crane rope is not in tension. The parameter
is the length of the rope without loads and
g is the gravity. The typical elastic modulus of a wire rope is 91 GPa [
16]. The construction concept of a crane of this type sees 4 ropes in parallel, with a diameter between 15 mm and 20 mm for weights up to 20 tons. The filling factor of the rope is about 75%. The stiffness
K of the rope in tension is then about 700
for a length of 40 m.
The damping
C is defined in terms of the damping ratio, with the usual
where
is the damping ratio and
the natural frequency in
.
The simple dynamic model is required for running a large number of simulations with a Monte Carlo approach.
Figure 3.
Schematic representation of a crane.
Figure 3.
Schematic representation of a crane.
4. Effect of Damping on the Linear Response Spectrum
Unlike the stiffness and the mass, the damping, which appears in Equation (
6), is a parameter that cannot be chosen easily by design or that is determined by the operational parameters’ weight and length. At the same time, the damping is a key driver of the maximum acceleration experienced with harmonic inputs, even during the transient.
The typical RS is given at a fixed damping values with a formula of Eurocode 8 [
4] to scale the RS values when the damping differs from the baseline value, often 5%:
Metal structures and systems have typical
damping values ranging from 2% to 5%. There is a significant uncertainty in the damping values as it is clearly shown by [
17]. The hoist crane is supposed to be part of a structure, often in metal; and, thus, it requires a damping scaling factor suitable to such lower damping values. To study this aspect, we ran a dedicated Monte Carlo analysis and quantitatively estimated the damping scaling factor in conditions equivalent to the ones used in simulating the crane.
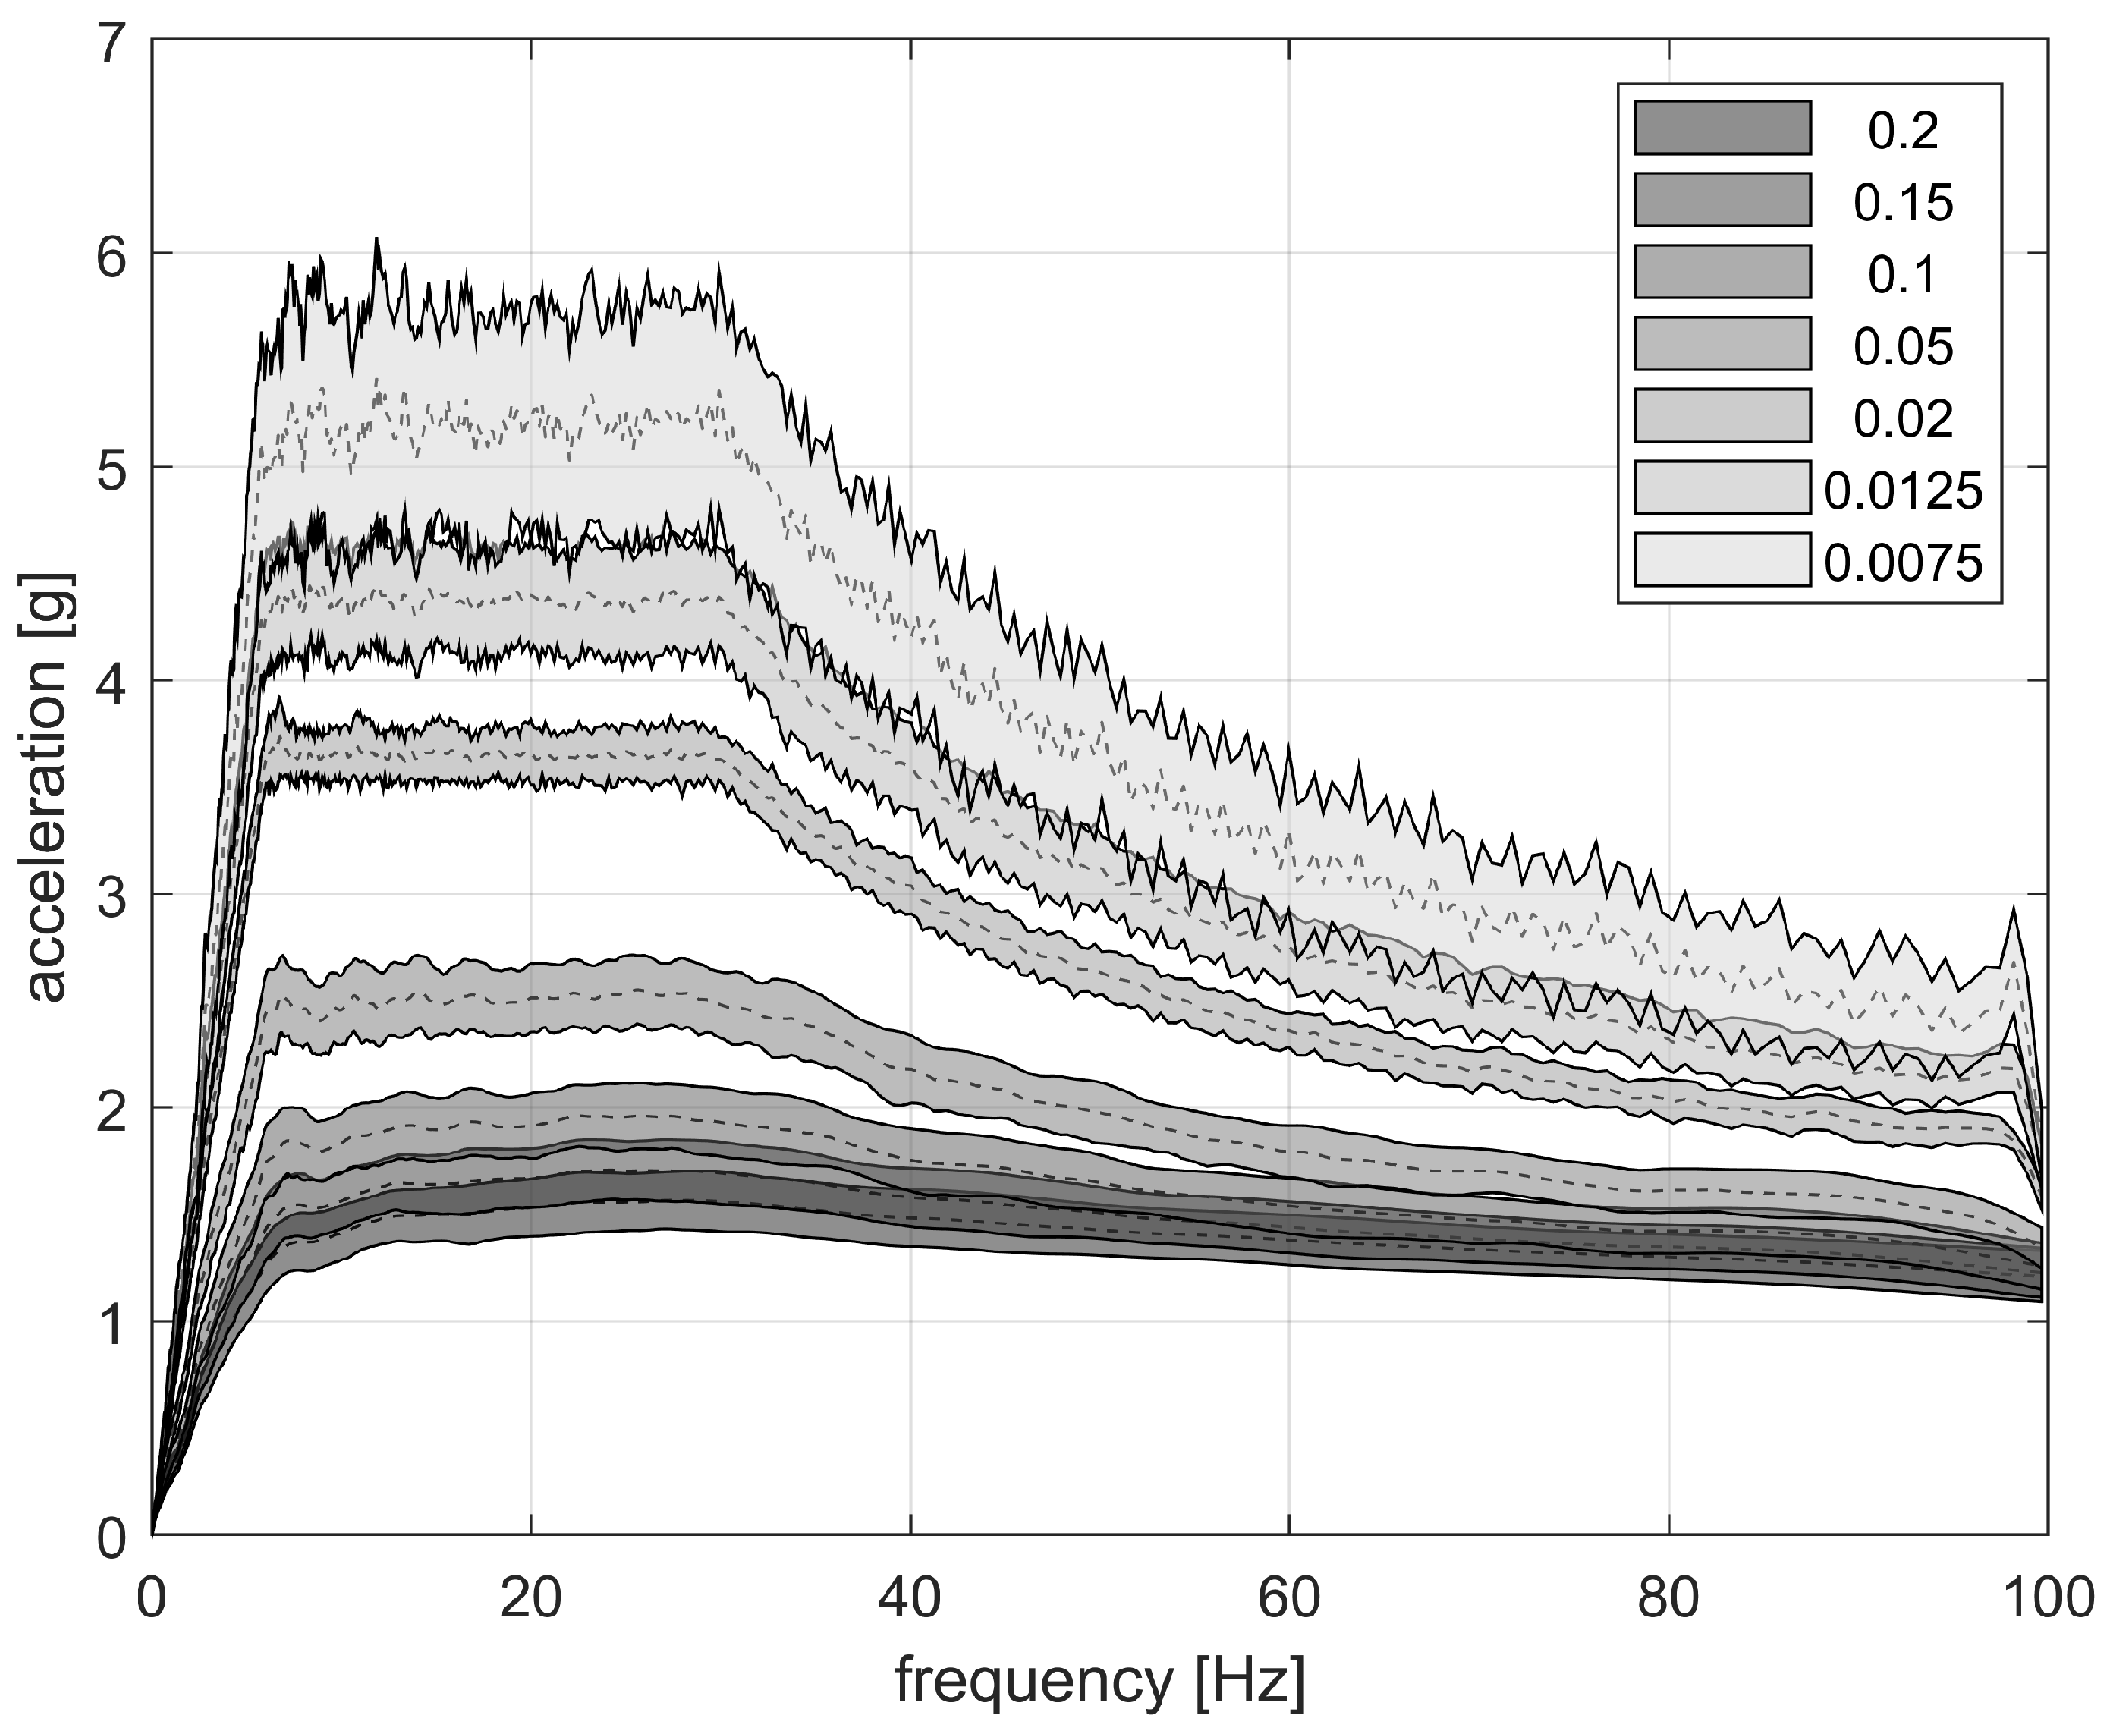
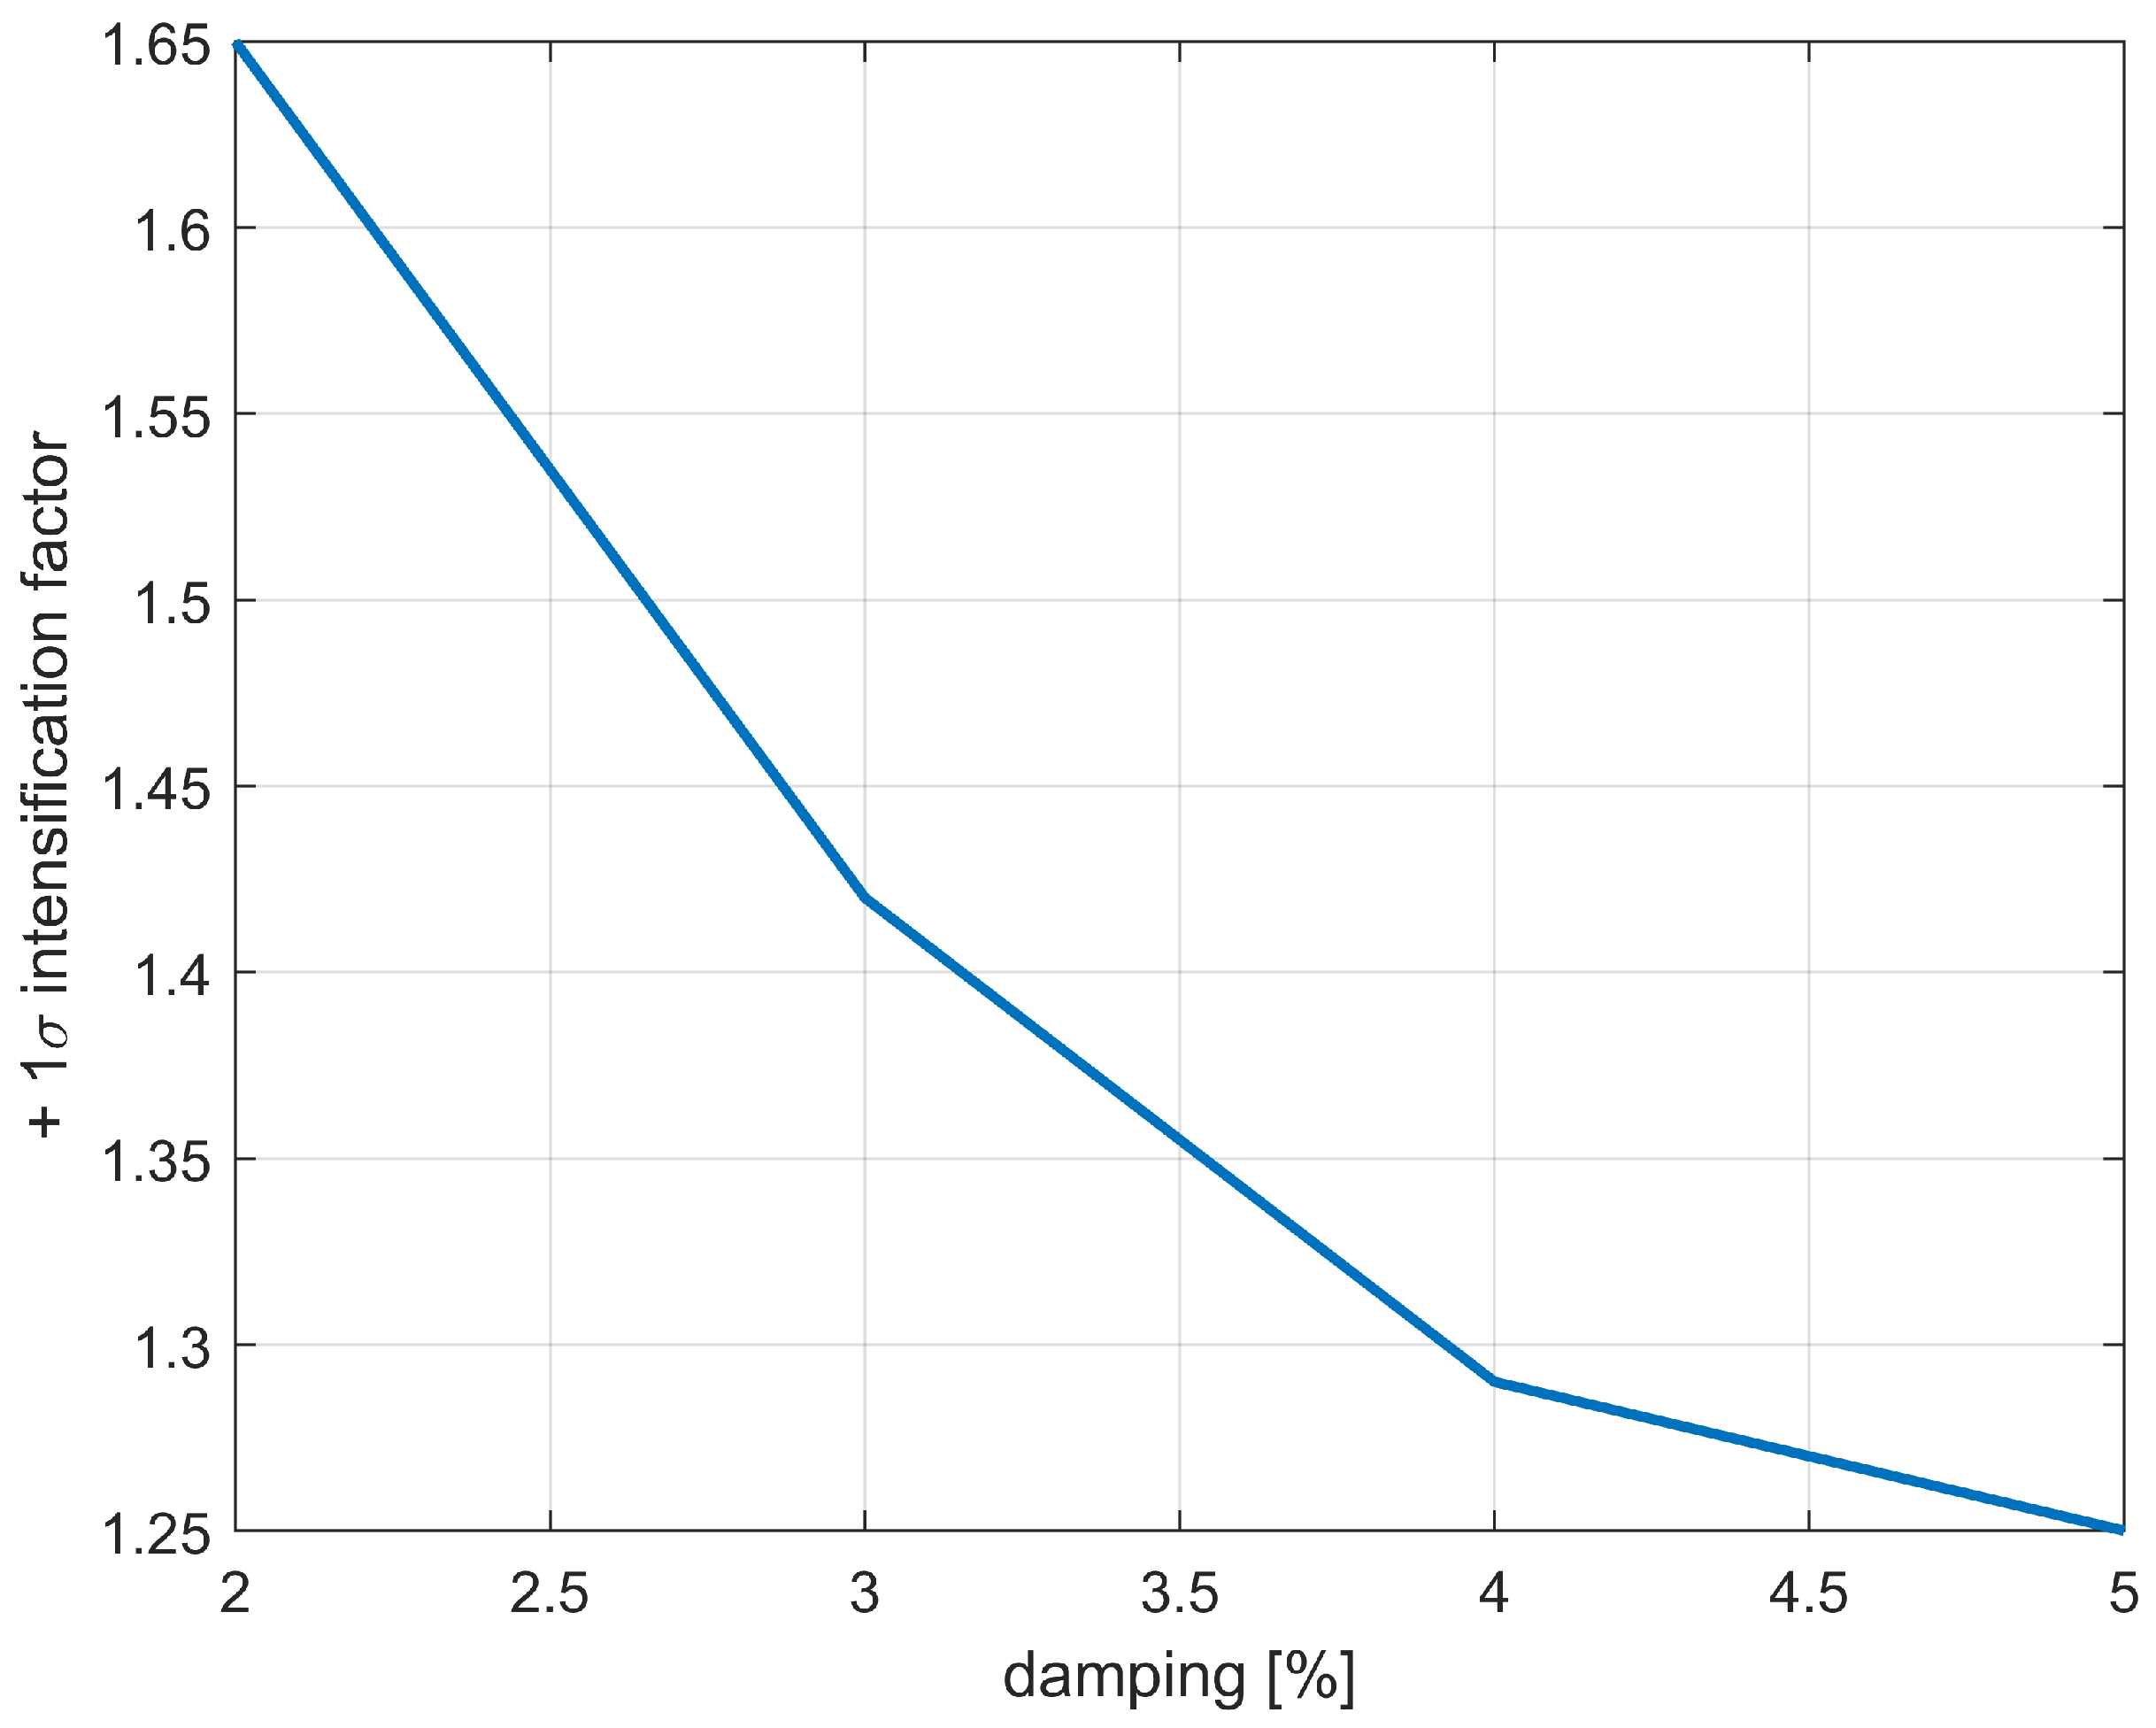
The procedure of
Section 2 generates a large number of random seismic events. For each of these events, the RS is calculated with a set of damping values that differ from the one used for the time history generation. For each of these RS curves, the average acceleration in the plateau bandwidth [6 Hz, 30 Hz] is collected and plotted as shown in
Figure 4. The set of random RS generated in this way is shown in
Figure 5, where the boundaries for each damping ratio are given by the standard deviation of all the relevant results.
From
Figure 4, it is clear that the scaling formula given by Eurocode 8 is not a good fit below 2%, as already highlighted by [
18]. We propose here an alternative formula based on our numerical results:
Our alternative scaling rule is also shown in
Figure 4. This formula is based solely on the definition of shock response spectra. Eurocode 8 is calibrated for higher damping values, which are usually of interest for large structures during seismic events and for ground response spectra.
5. Statistical Analysis of the Intensification Factor
The objective of this study was to estimate the intensification factor of design response spectra (RS) for hoisted loads. This requires evaluating the peak acceleration of the hoisted load as a function of the resonant frequency of an equivalent linear system. The time response of the hoisted load is obtained by numerically integrating Equation (
6) using a synthetic time history as input. The peak acceleration is then computed as follows:
where
is the numerical solution of Equation (
6).
This process is repeated several times with a Monte Carlo approach where the input parameters are randomized or parameterized. The parameters we consider are as follows:
- 1.
Natural frequency of the hoisted load. The natural frequency of the load attached to the crane ranges in the bandwidth [0–6] Hz, which is justified by the range of stiffness and mass that can occur.
- 2.
Seismic time history. The seismic time history is randomized according to
Section 2 via the time envelope shape and the phase of the harmonic components.
- 3.
Initial slope of the RS (or magnitude of the plateau). The magnitude of the acceleration in the plateau bandwidth, and, therefore, the slope of the linear part of the RS, is parameterized from a value of 1.8× g to 3.6× g with two equally spaced intermediate values (2.4× g and 3.0× g). These values are justified for a severe earthquake and account for an intensification of the load due to the structure where the crane is mounted.
- 4.
Internal damping of the crane. The effect of the internal damping of the crane is studied parametrically for the most severe RS curves.
- 5.
Shape of the RS. The effect of changing the RS shape, i.e., with a plateau in a smaller bandwidth, is studied independently and described at the end of this paper.
The Monte Carlo analysis consists of 3000 simulated time histories with a crane internal damping of 2% and the RS with a plateau in the range [6–30] Hz. The 3000 simulations are equally distributed for the four RS plateau values. For each time history, we obtain the response of the hoisted load and derive its peak acceleration.
The time history generation and numerical integration of motion equations were implemented in MATLAB R2020 [
19]. Each case was simulated using both the non-linear system defined by Equation (
6) and a corresponding linear oscillator with identical parameters for comparison. The entire process required several days of computation on a standard analysis machine.
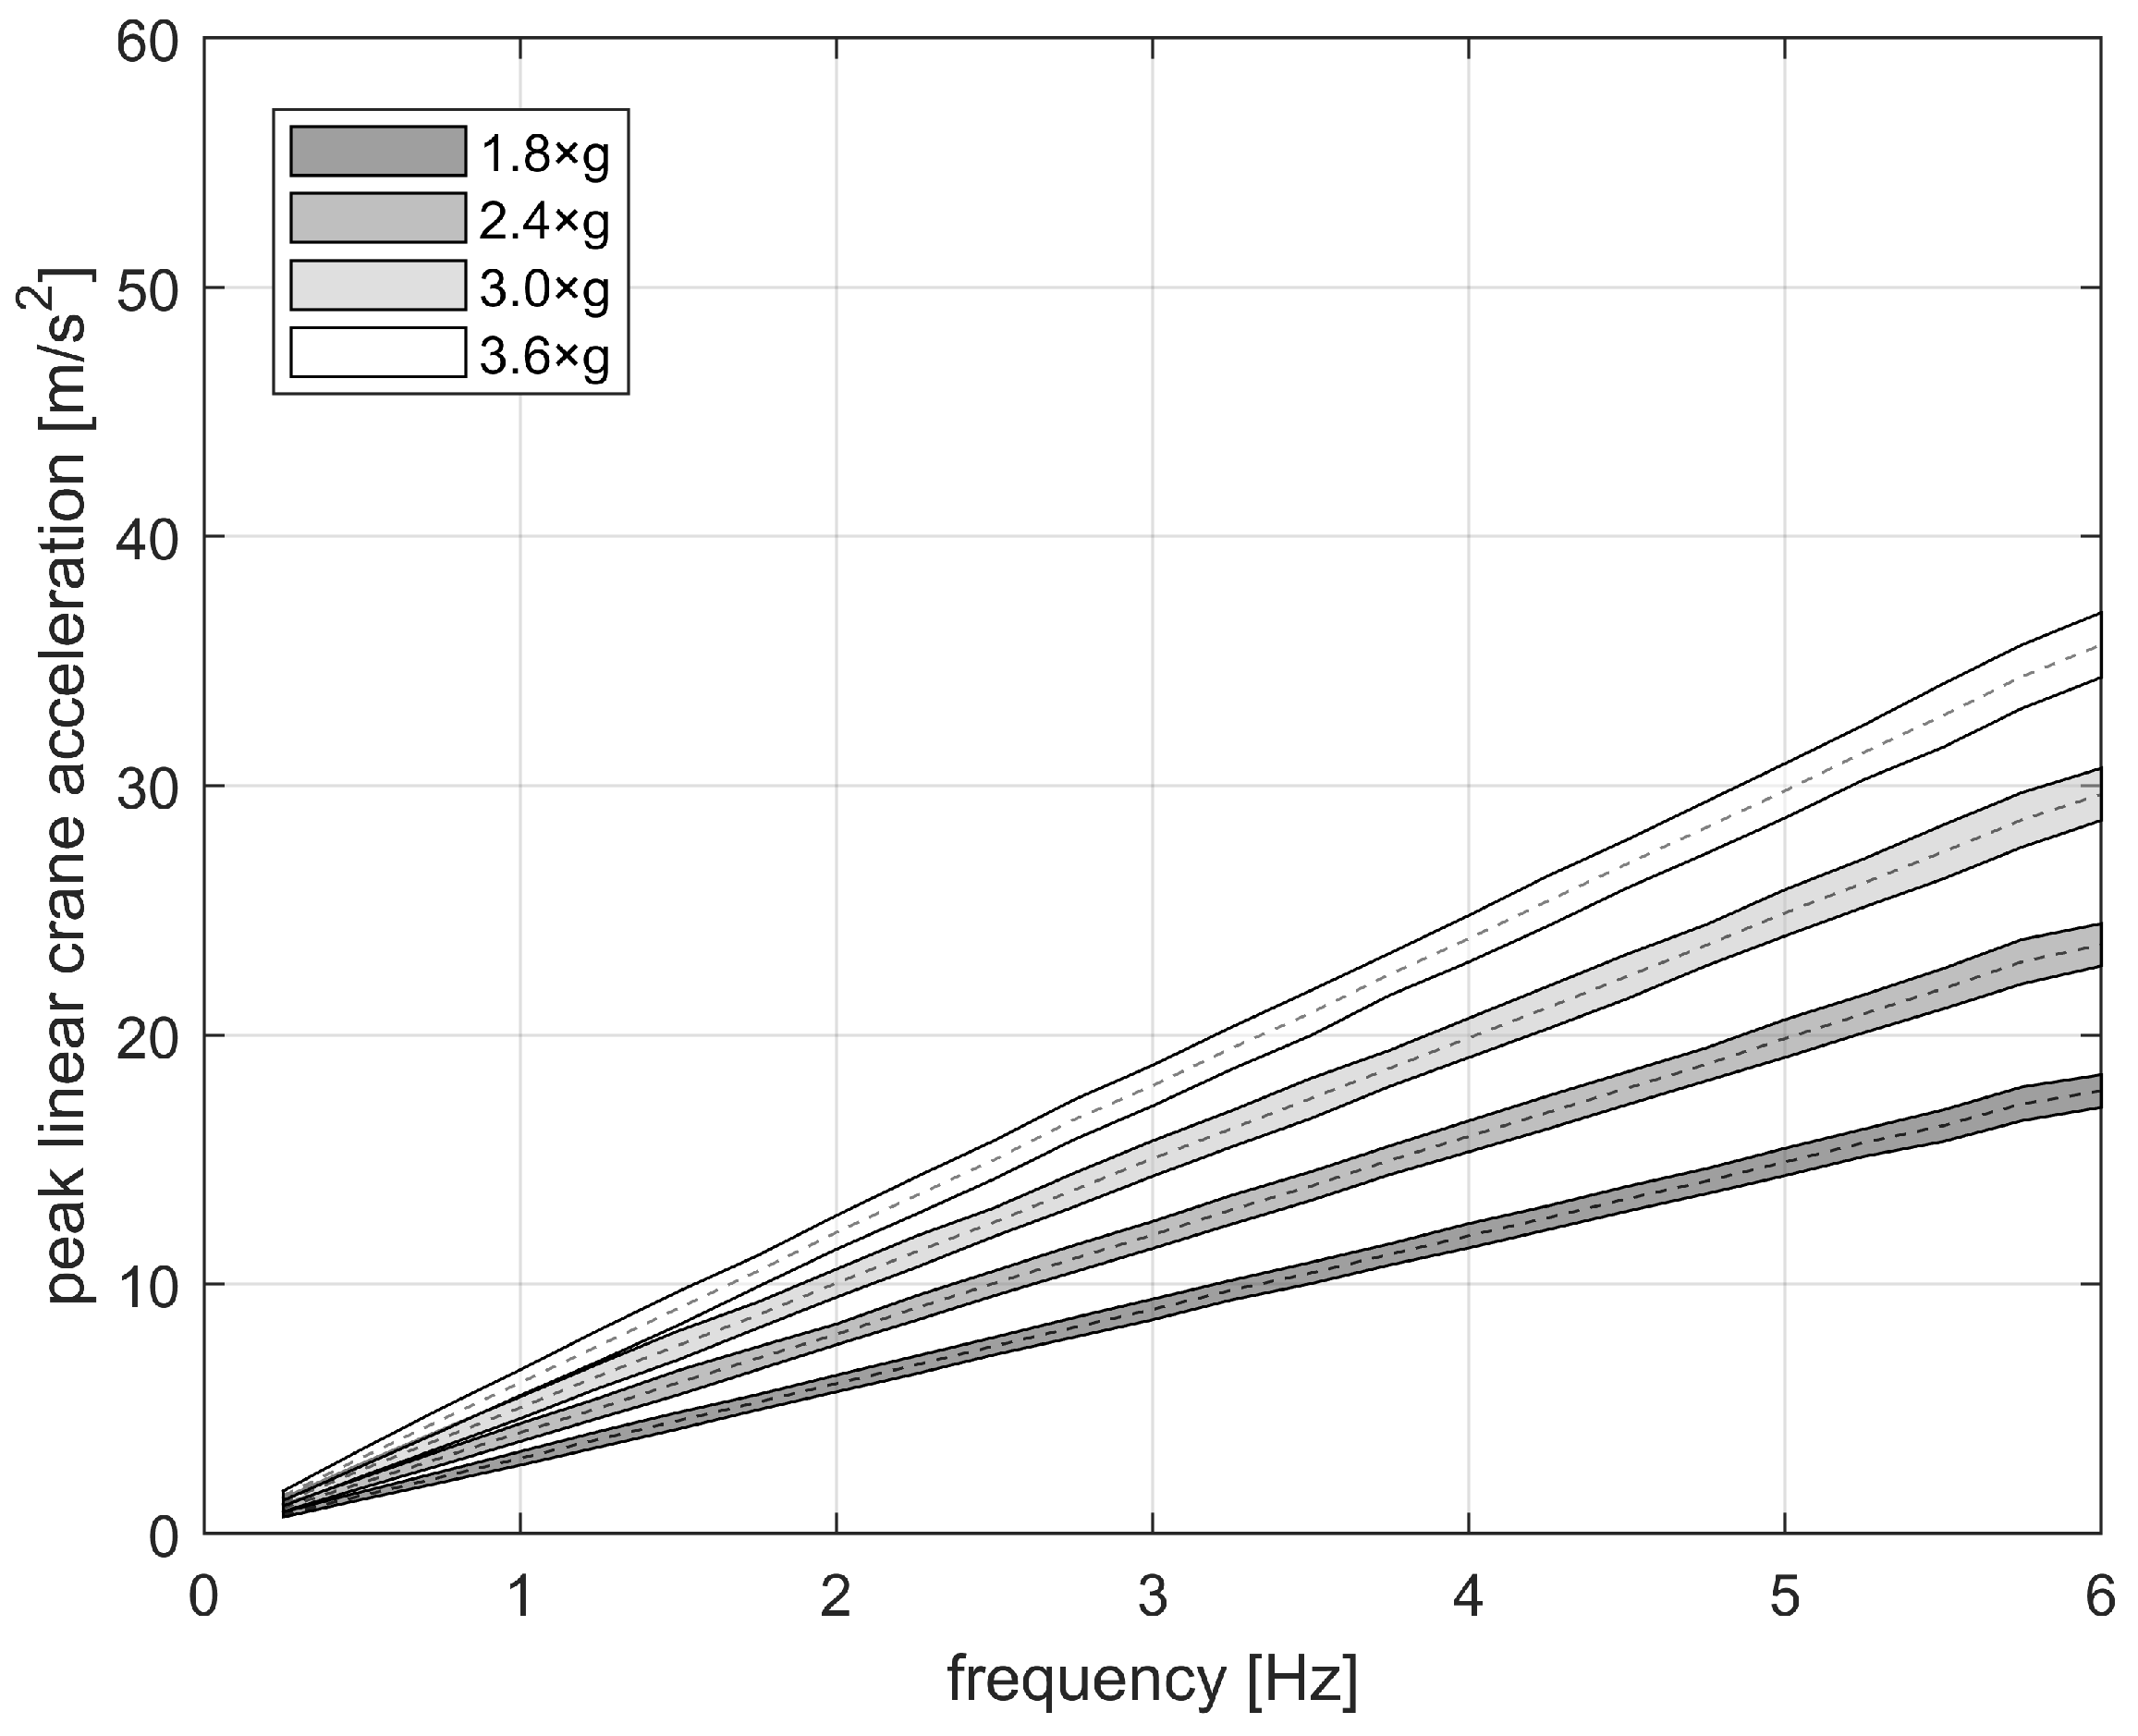
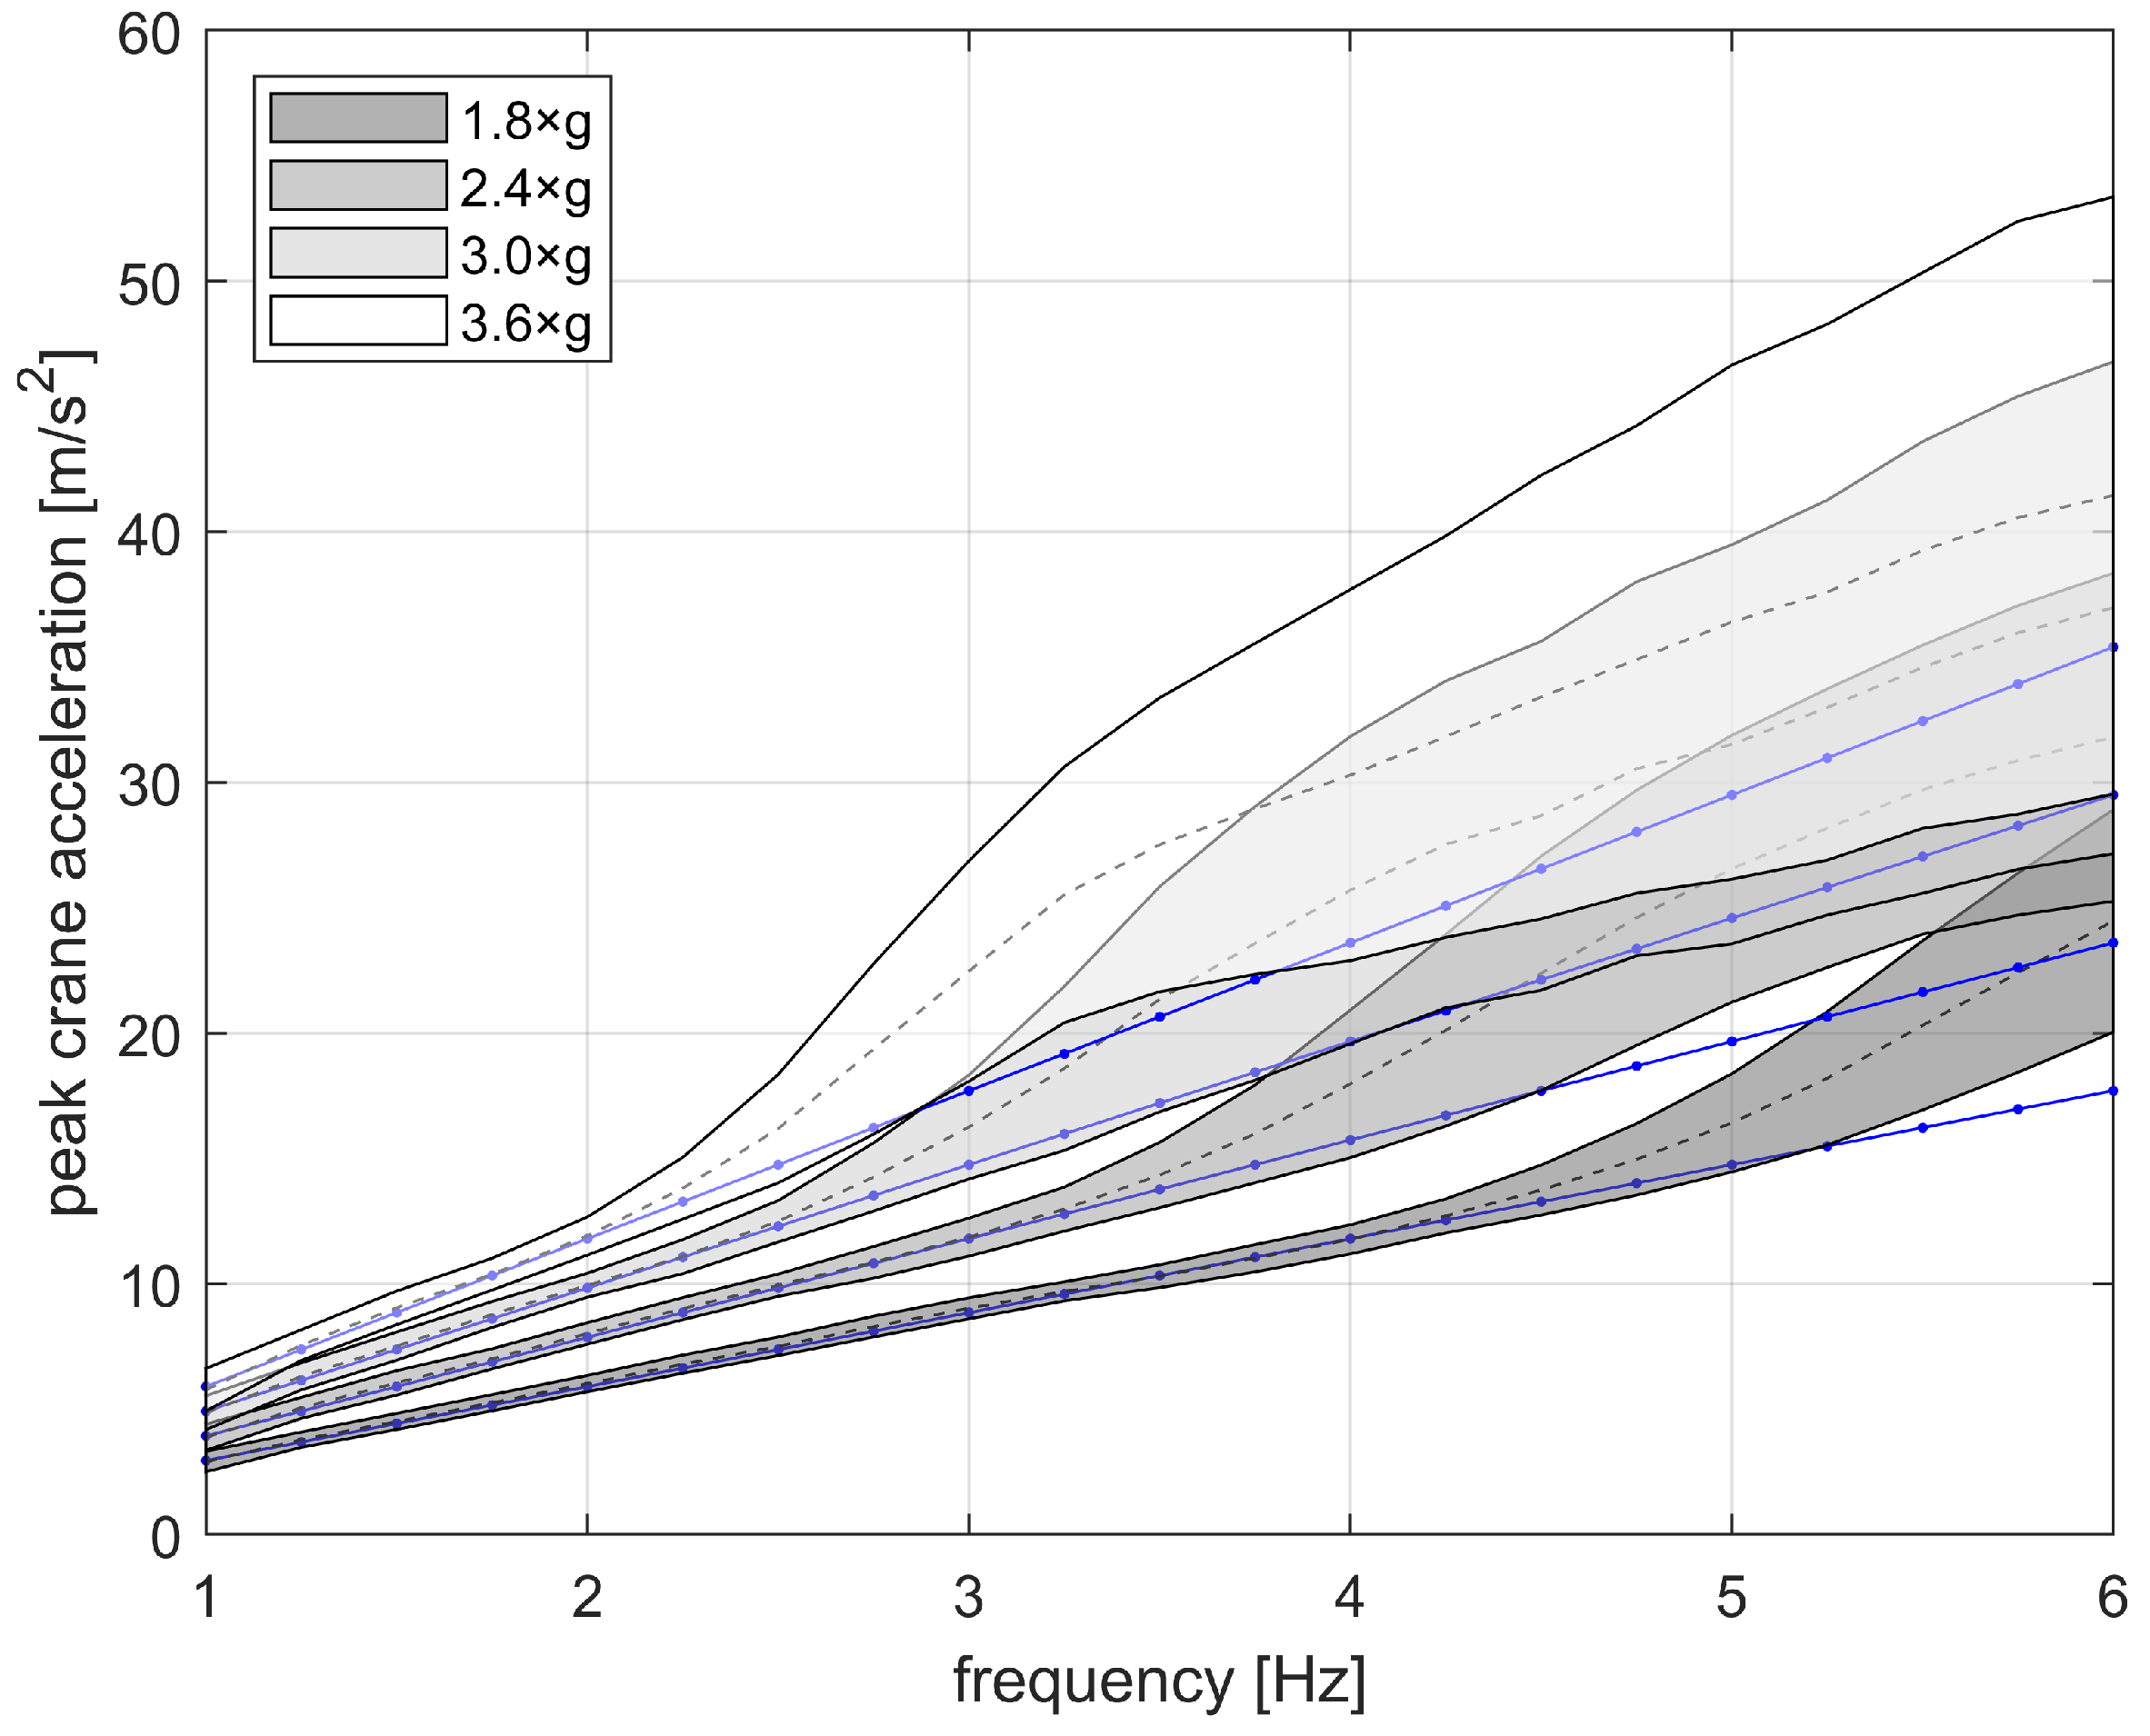
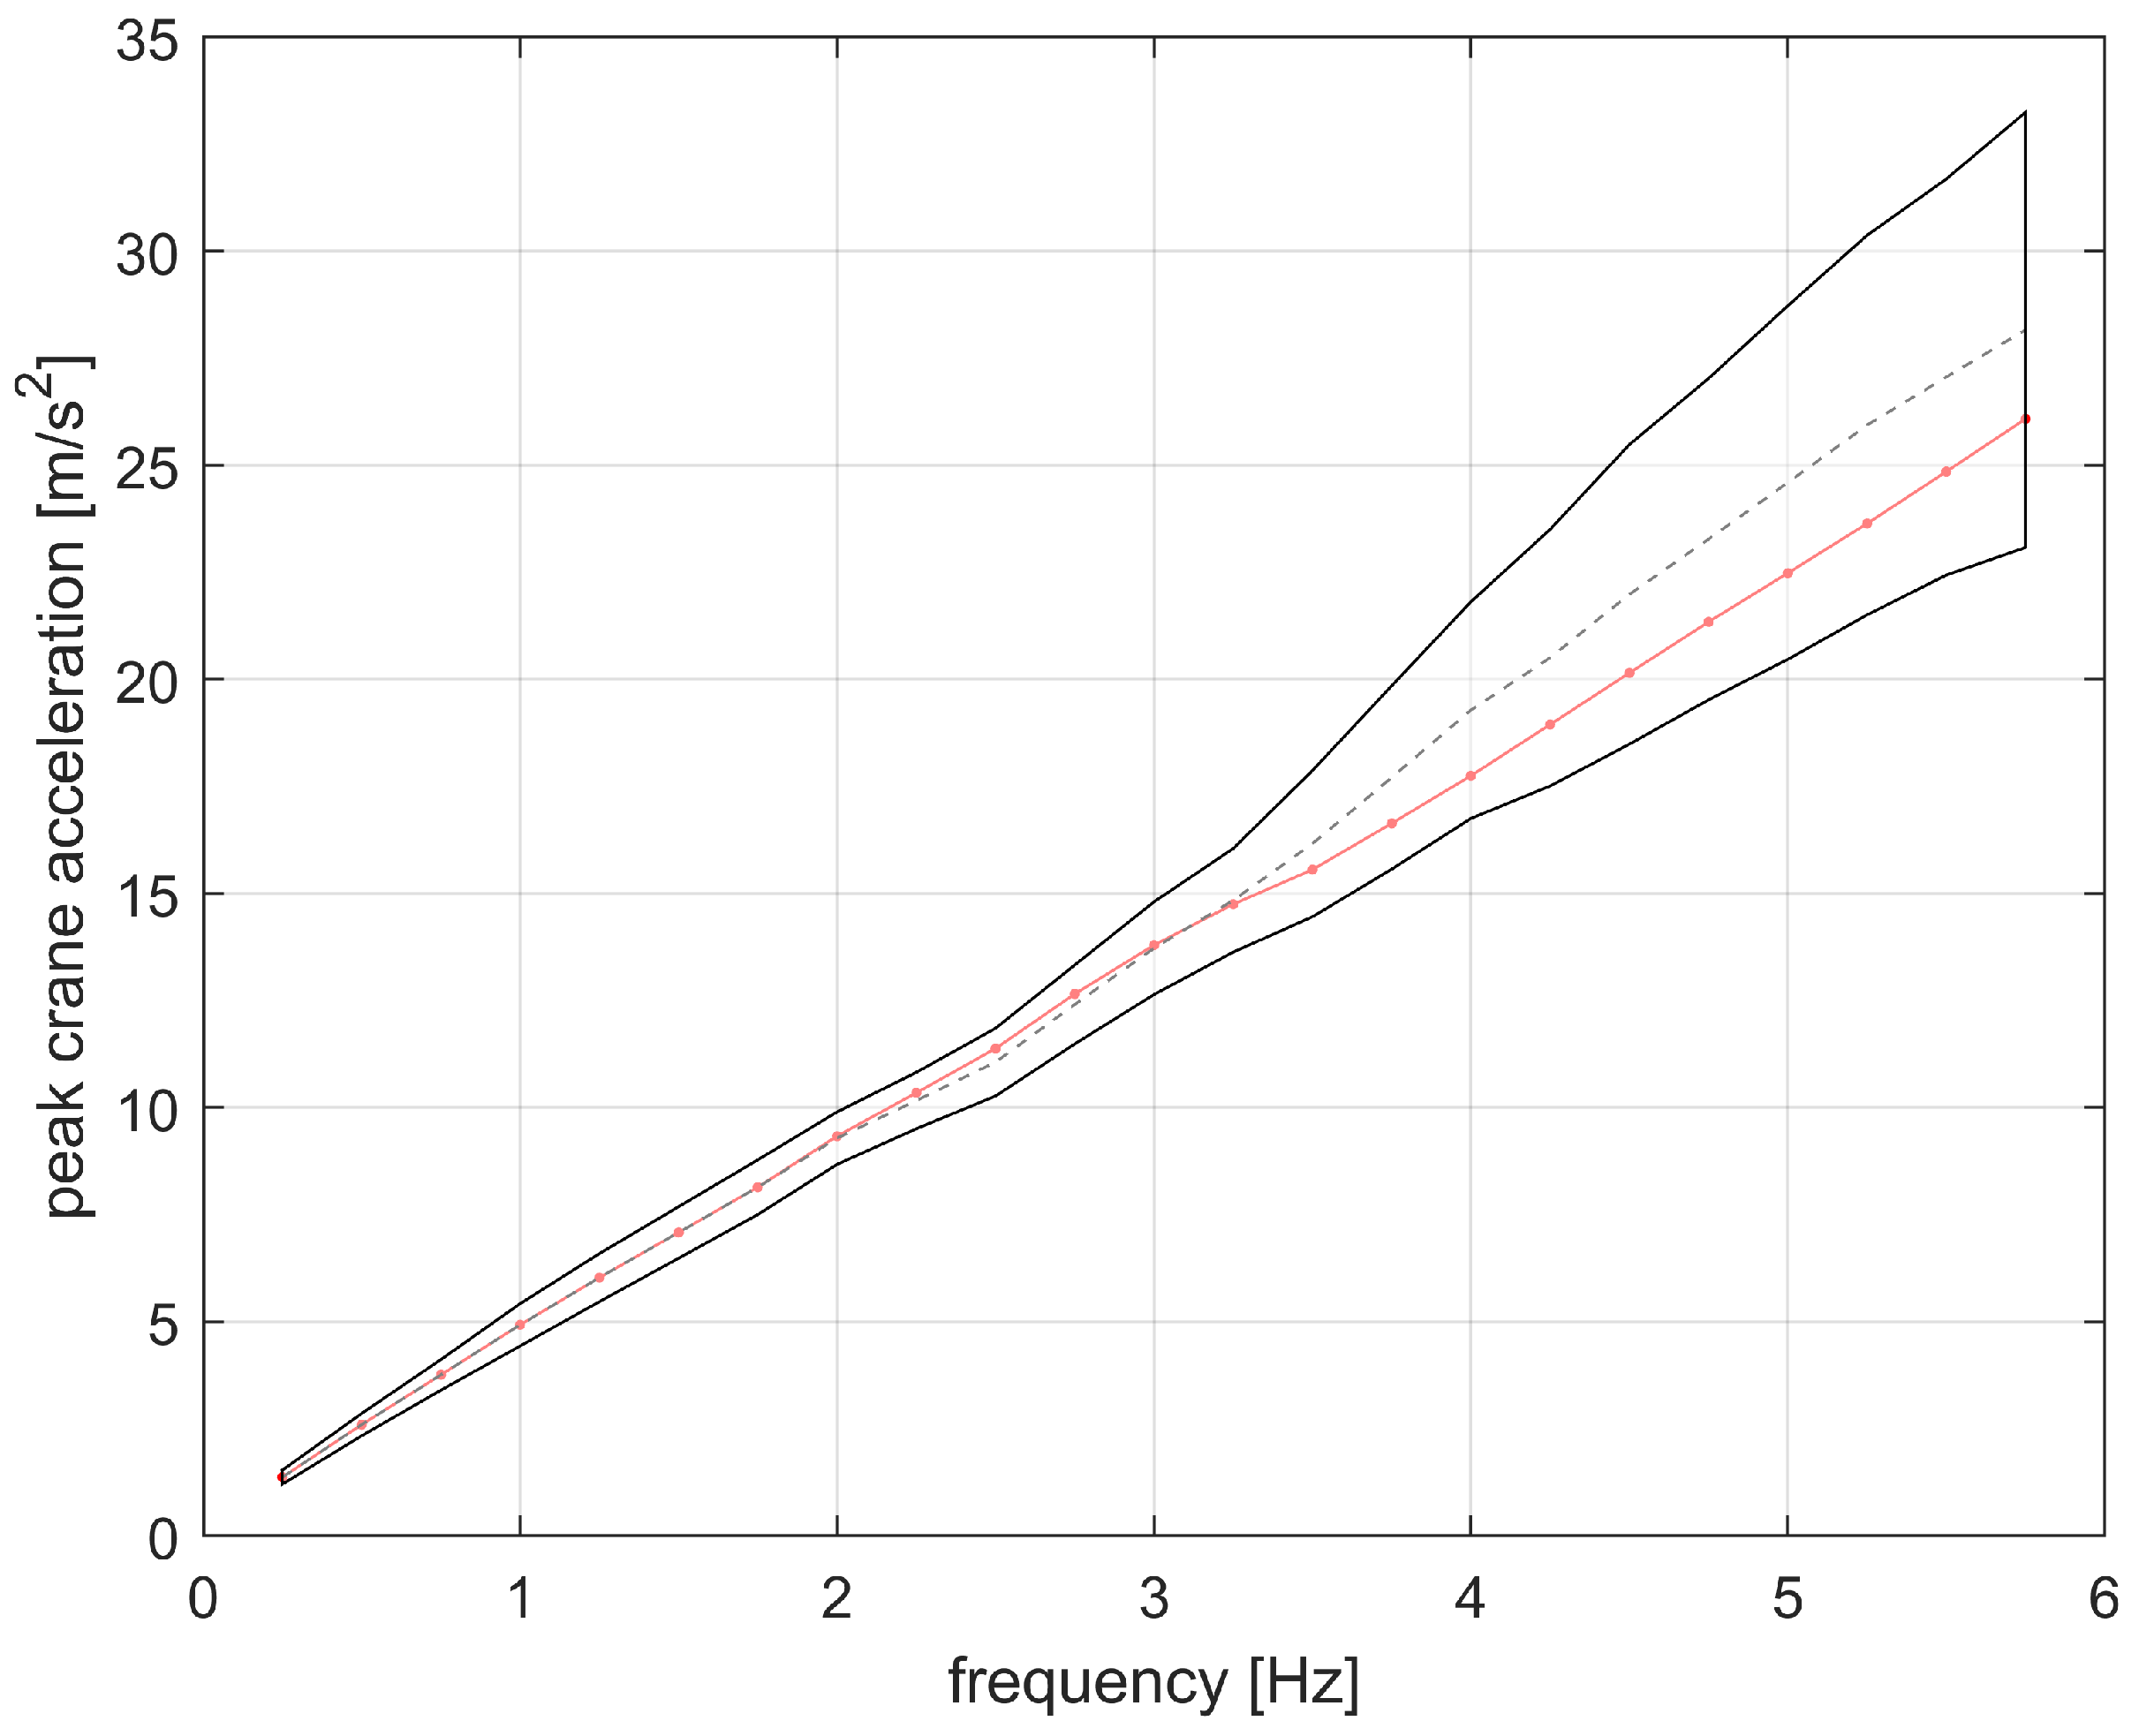
The peak accelerations obtained for the linear oscillator are presented in
Figure 6, while the results for the non-linear crane are shown in
Figure 7 and
Figure 8. The non-linear system exhibits a significantly larger dispersion in peak accelerations compared to the linear case.
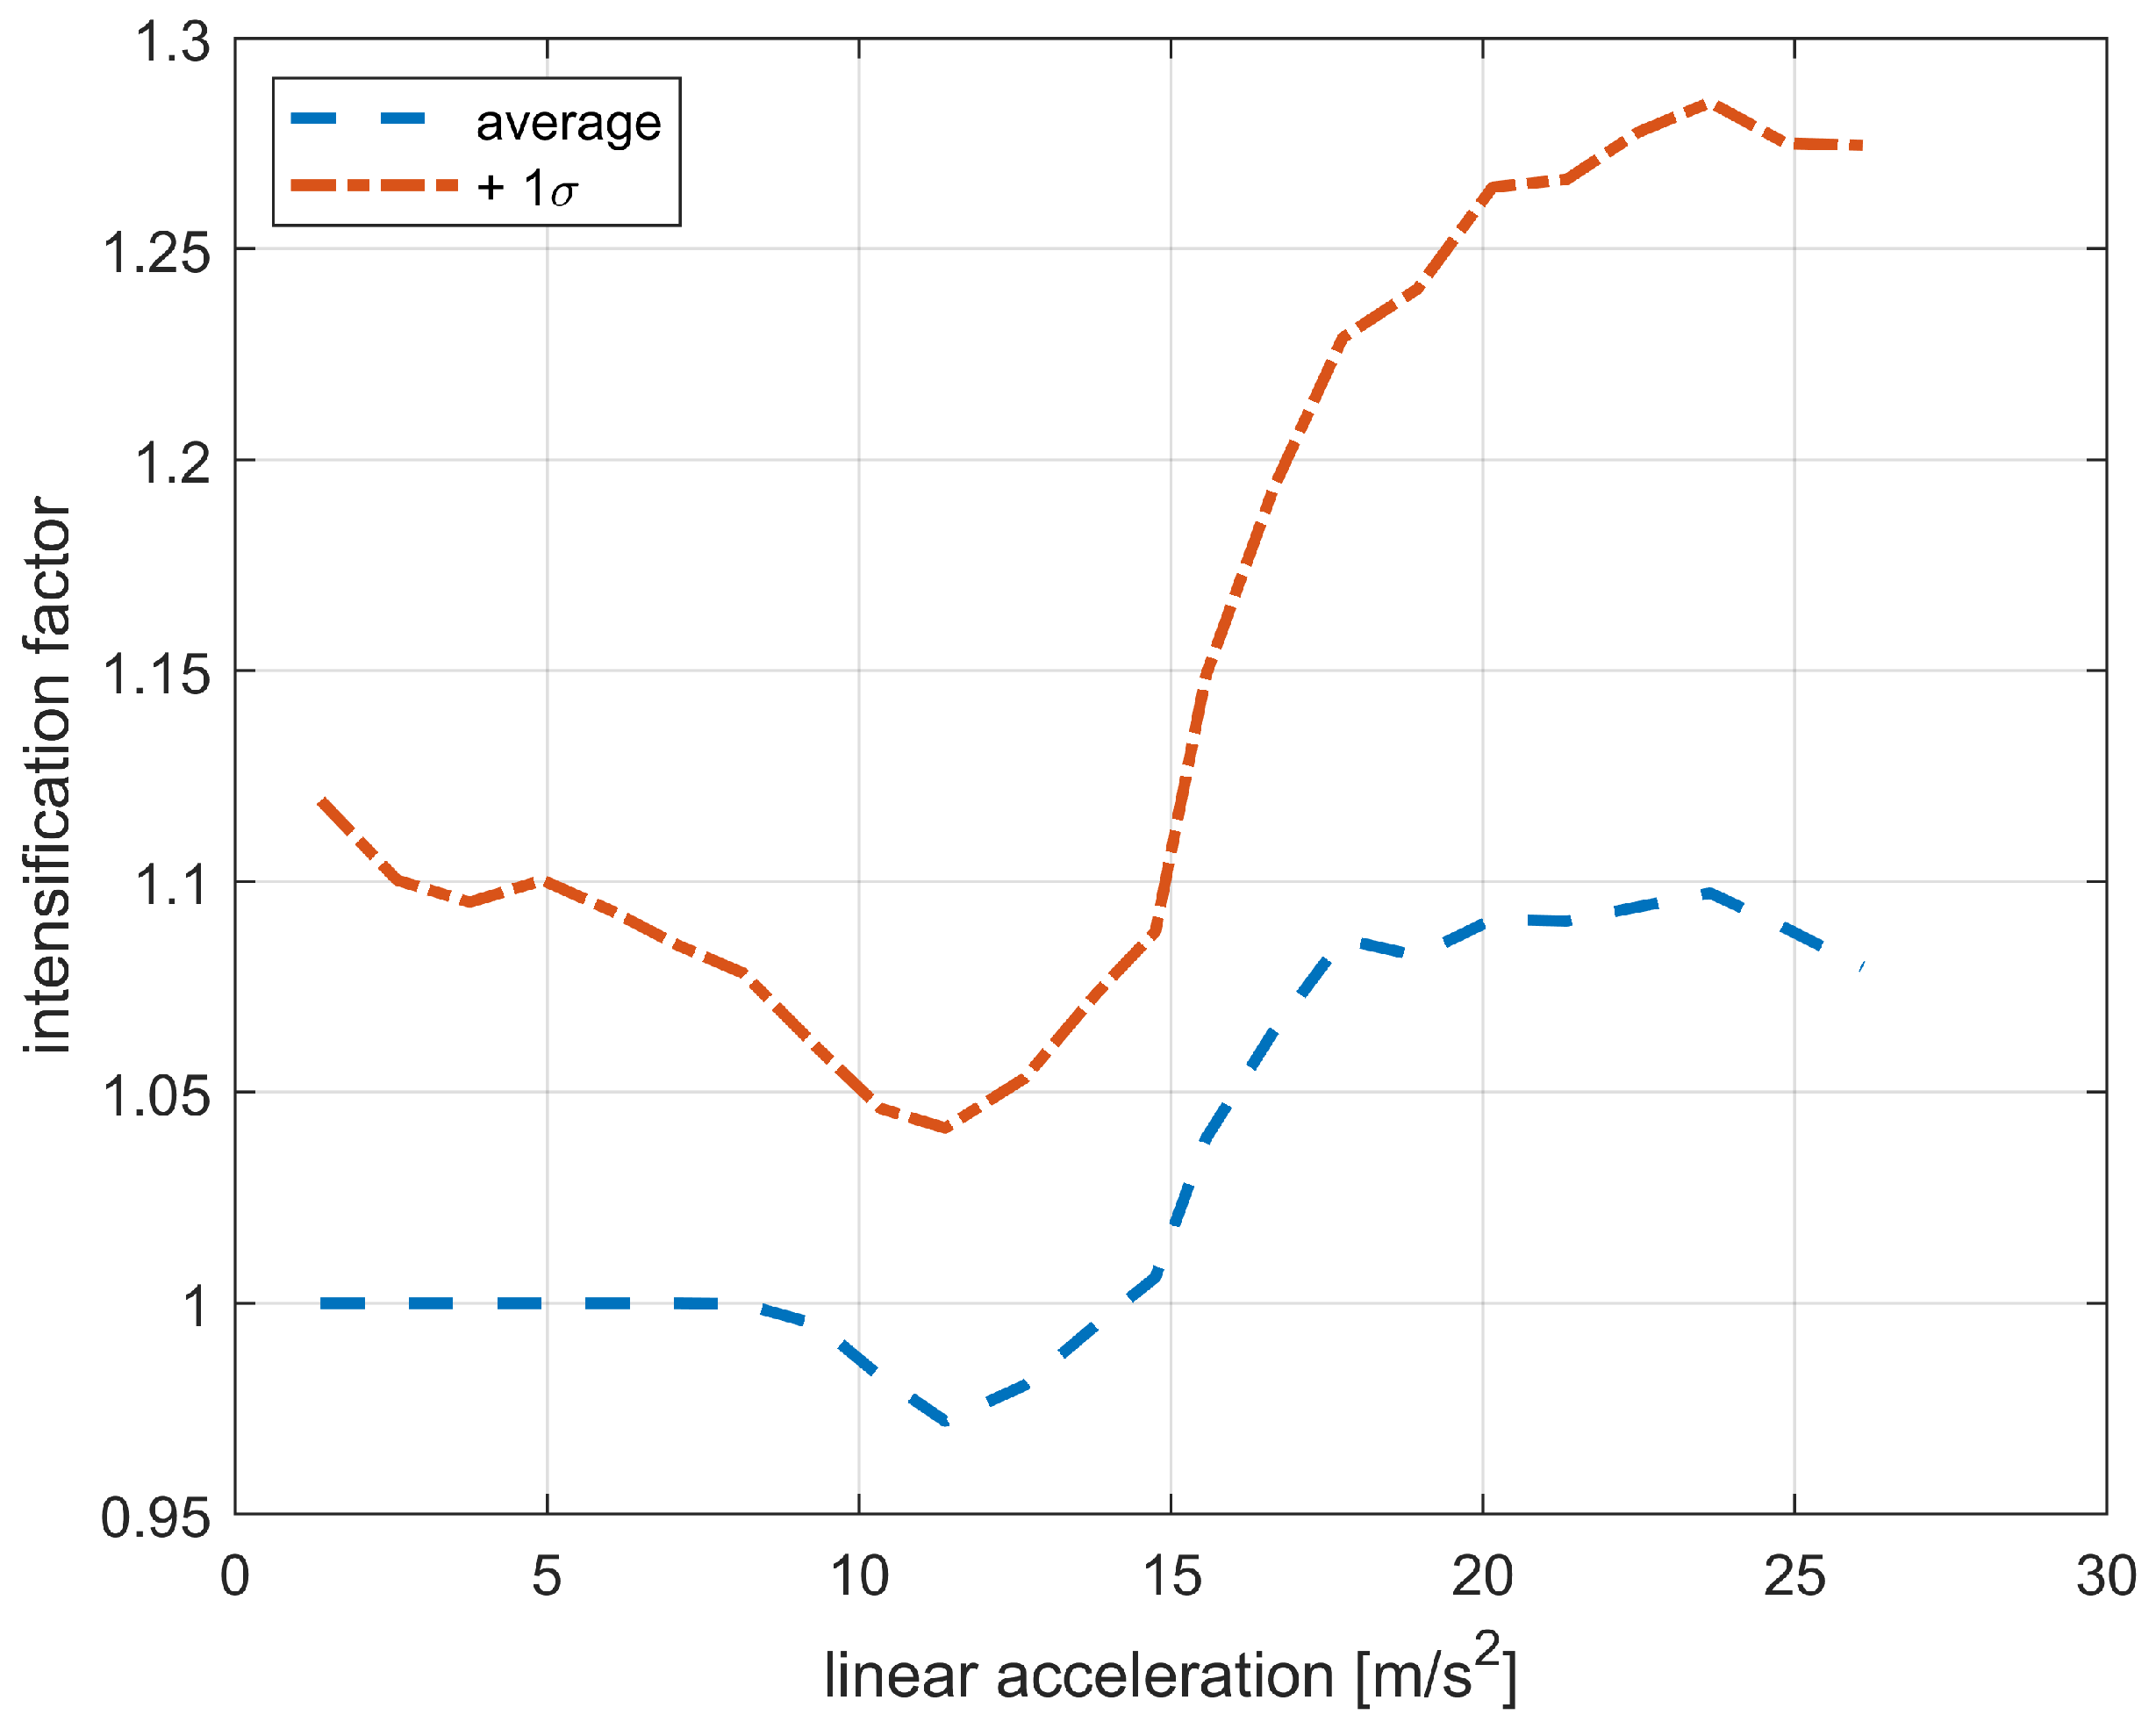
The computed intensification factors for the non-linear crane, relative to an equivalent linear system, are illustrated in
Figure 9. Since the linear case (
Figure 6) shows limited variability, its average value is used as the denominator. The estimated
intensification factor is approximately 1.65, with the RS plateau magnitude having only a secondary effect.
For accelerations below 1×
g, the response remains linear. However, at higher acceleration levels, the non-linear effects become significant. The peak acceleration of the hoisted load initially decreases due to a reduction in energy transfer from the attachment point: when the hoisted load enters free fall, no external energy is introduced. In the second phase, starting approximately at 1.5×
g, the intensification factor rises. We believe this is determined by a reduction in effective damping due to the slack rope, in line with what is discussed in
Section 3. At around 2×
g, the intensification factor starts decreasing again. This behavior suggests that the effective period of the system increases, making it behave as if it had a lower natural frequency. A large fraction of the motion occurs in free fall, reducing the energy transfer from the crane structure.
In
Section 3, we see that the internal damping is a key parameter for an RS. The literature on the internal damping of cranes lacks relevant information. Regarding the damping in the directions perpendicular to the rope, refs. [
20,
21] measure values between 0.2% and 1%. These values are not directly linkable to our Monte Carlo analysis, which refers to the motion parallel to the crane rope, and already exhibit a relatively large variability. For this case, only ref. [
22] has some figures with a damping of 5–6%. The figures are, however, not based on available sources or measurements. Eurocode 1 [
17] also points to values between 5% (steel buildings) and 0.6% (parallel cables).
The intensification factor is then explored for an internal damping of 3%, 4%, and 5%, on top of the original 2%, with different sets of Monte Carlo simulations, limited to the 3.6×
g plateau case. Example results for the 4% case are shown in
Figure 10 and
Figure 11.
Figure 12 shows all the results for all the internal damping ratios considered and shows a significant reduction of the intensification factor with the increase in damping.
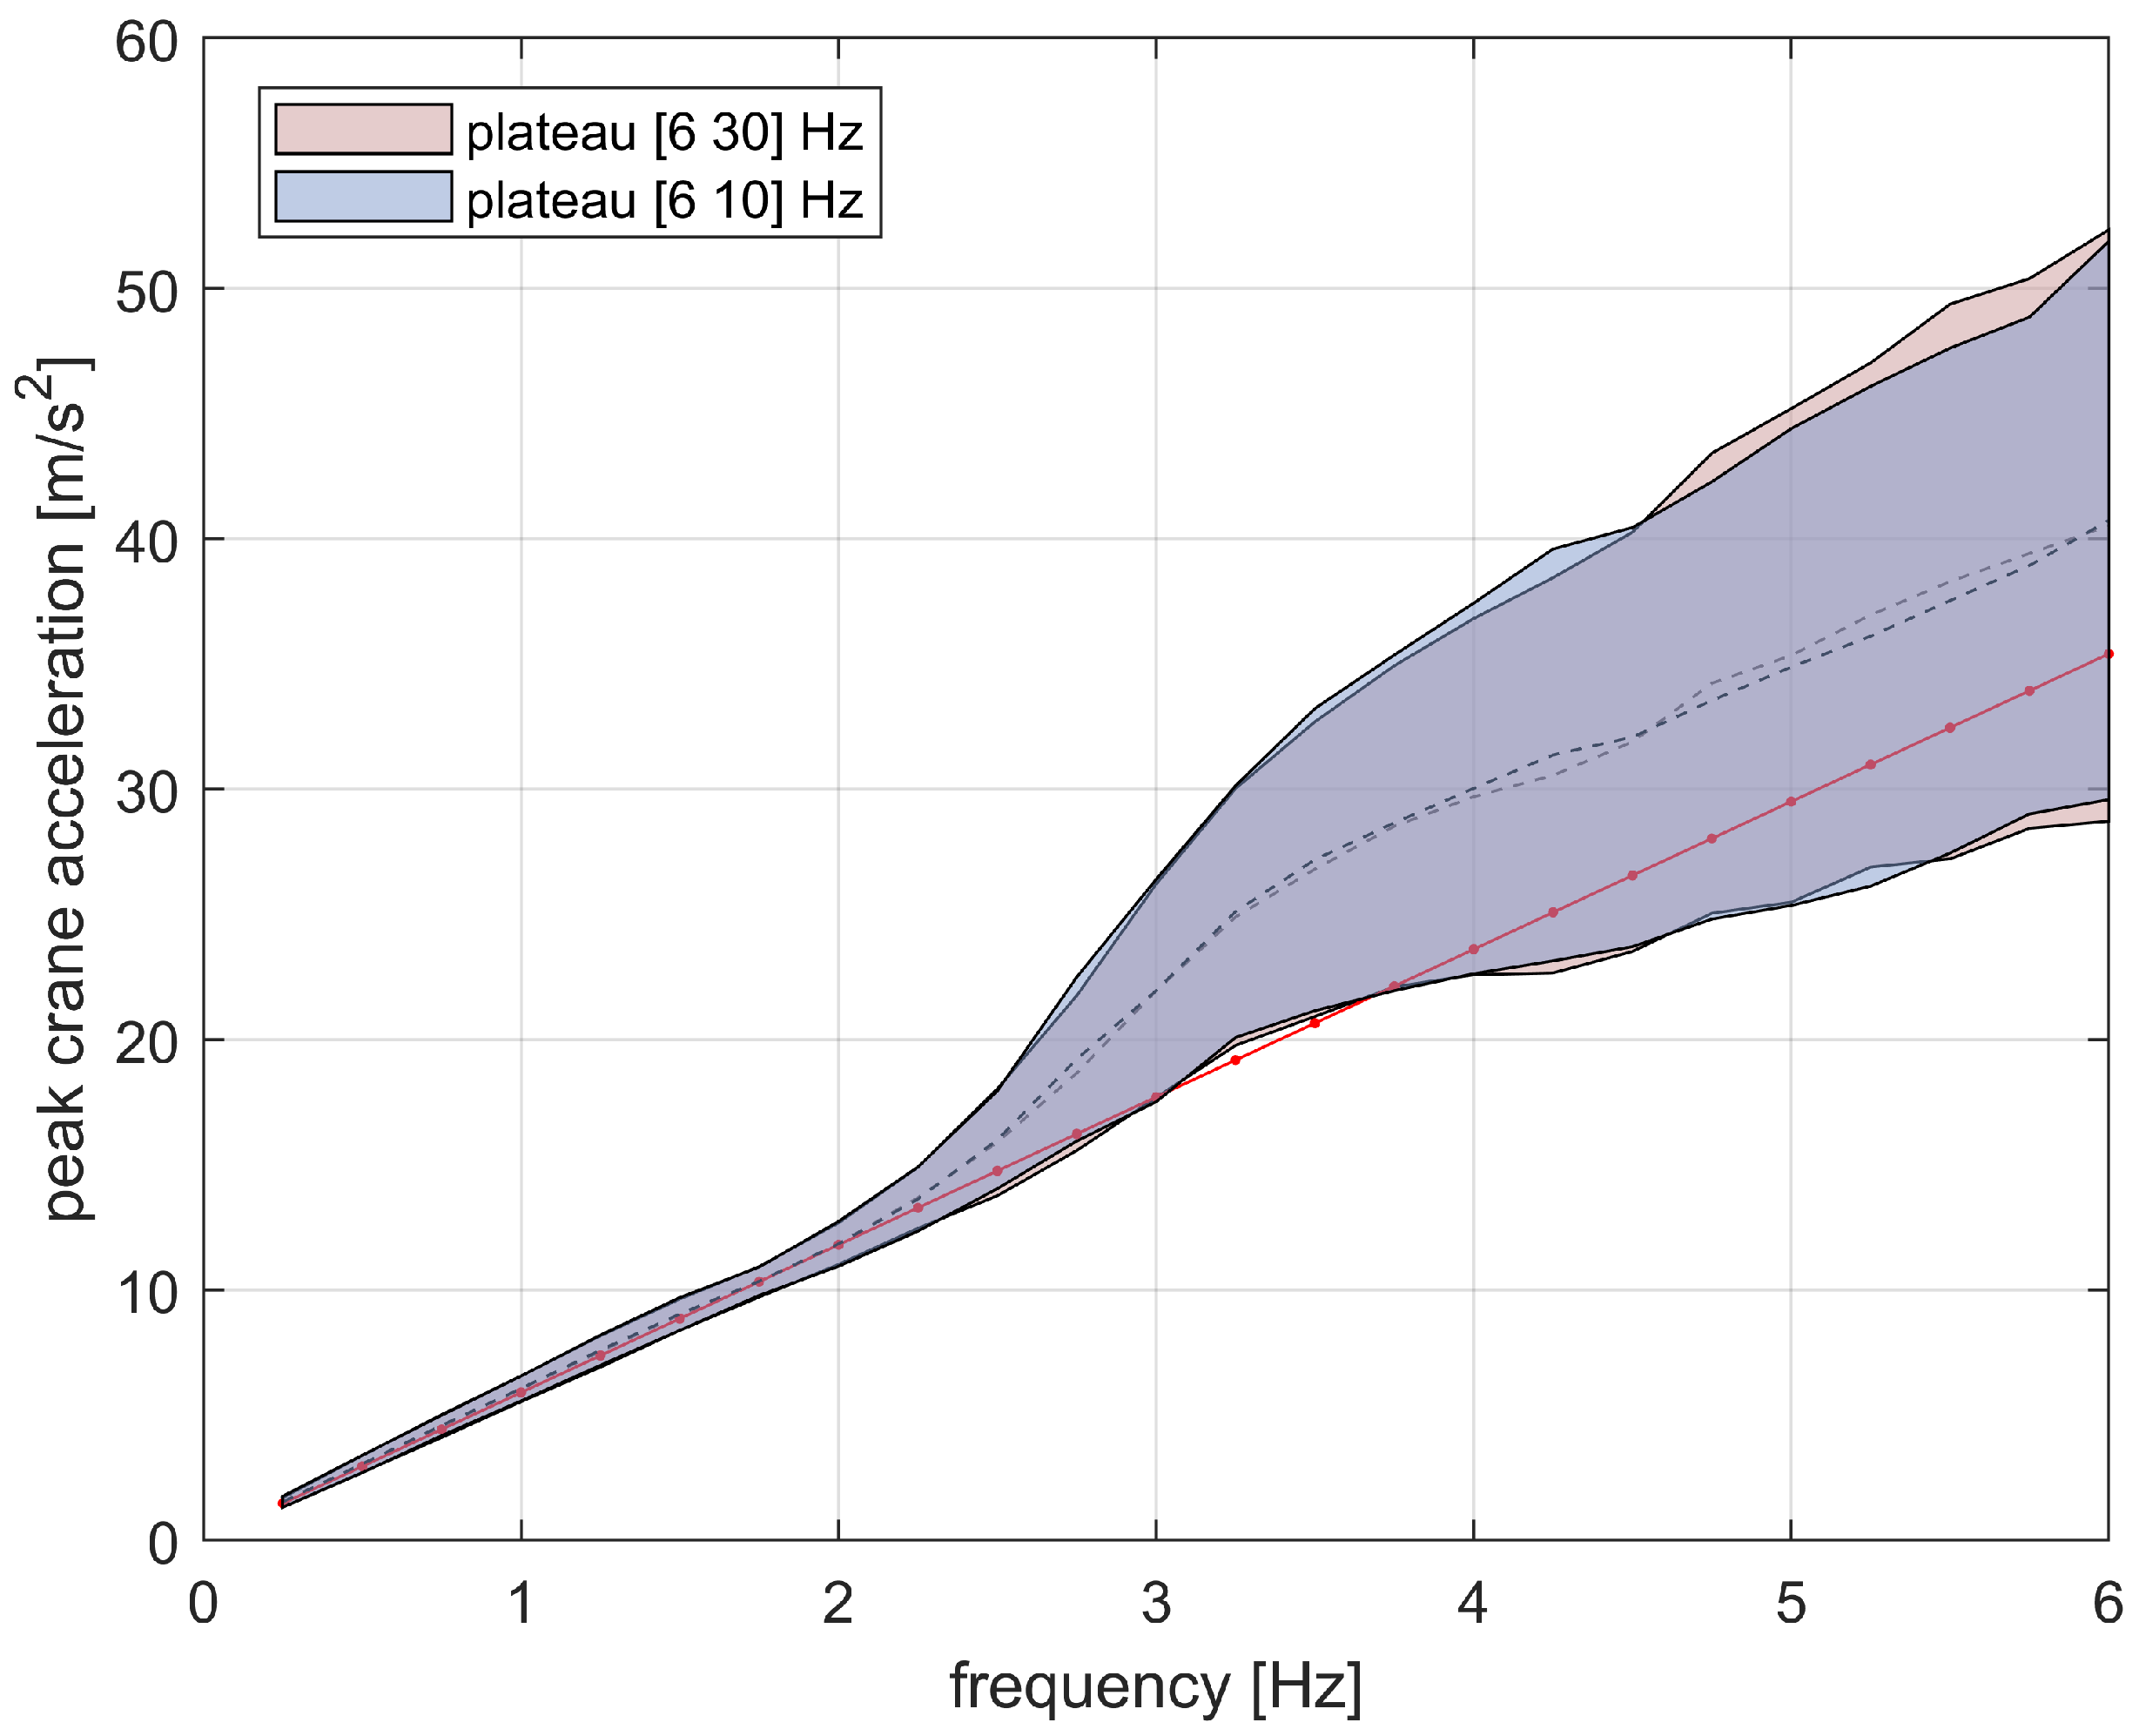
Finally, to rule out systematic effects due to the RS shape, the non-linear peak acceleration is studied for an RS with a [6–10] Hz plateau;
Figure 13. No noticeable difference is noted. This is a fundamental check; without it, in fact, the results presented above could not be generalized.
6. Conclusions
The use of idealized response spectra as a design driver for systems in seismically active regions is well established. Response spectra provide a concise yet powerful tool for assessing transient vibrations in linear systems. However, non-linear systems demand alternative, often more intricate, approaches.
Among these, hoisted loads under cranes present a particularly relevant case, as they can experience non-linear dynamic effects when strong accelerations momentarily slacken the supporting rope. Given that cranes frequently handle delicate and mission-critical components, understanding these effects is essential.
This hands-on study derived an intensification factor relative to the linear response spectrum, reaching a maximum of 1.65 at low damping levels. Notably, this factor remains largely independent of the specific shape of the response spectrum, provided the spectrum retains a linear trend in the low-frequency range—an assumption that holds in typical engineering practice.
A key finding is the critical role of internal damping in mitigating peak accelerations. High damping significantly reduces the intensification factor, reinforcing the importance of design strategies that enhance energy dissipation in suspended loads.
In future developments of this work, we plan to perform tests with actual cranes.


