Article

Comparison of Image Preprocessing Strategies for Convolutional Neural Network-Based Growth Stage Classification of Butterhead Lettuce in Industrial Plant Factories

1
Department of Biosystems Engineering, Seoul National University, Seoul 08826, Republic of Korea
2
Integrated Major in Global Smart Farm, Seoul National University, Seoul 08826, Republic of Korea
3
Institute of Agriculture and Life Sciences, Seoul National University, Seoul 08826, Republic of Korea
*
Author to whom correspondence should be addressed.
Appl. Sci. 2025, 15(11), 6278; https://doi.org/10.3390/app15116278
Submission received: 3 April 2025 / Revised: 26 May 2025 / Accepted: 31 May 2025 / Published: 3 June 2025
(This article belongs to the Special Issue Applications of Image Processing Technology in Agriculture)

Abstract

The increasing need for scalable and efficient crop monitoring systems in industrial plant factories calls for image-based deep learning models that are both accurate and robust to domain variability. This study investigates the feasibility of CNN-based growth stage classification of butterhead lettuce (Lactuca sativa L.) using two data types: raw images and images processed through GrabCut–Watershed segmentation. A ResNet50-based transfer learning model was trained and evaluated on each dataset, and cross-domain performance was assessed to understand generalization capability. Models trained and tested within the same domain achieved high accuracy (Model 1: 99.65%; Model 2: 97.75%). However, cross-domain evaluations revealed asymmetric performance degradation—Model 1-CDE (trained on raw images, tested on preprocessed images) achieved 82.77% accuracy, while Model 2-CDE (trained on preprocessed images, tested on raw images) dropped to 34.15%. Although GrabCut–Watershed offered clearer visual inputs, it limited the model’s ability to generalize due to reduced contextual richness and oversimplification. In terms of inference efficiency, Model 2 recorded the fastest model-only inference time (0.037 s/image), but this excluded the segmentation step. In contrast, Model 1 achieved 0.055 s/image without any additional preprocessing, making it more viable for real-time deployment. Notably, Model 1-CDE combined the fastest inference speed (0.040 s/image) with stable cross-domain performance, while Model 2-CDE was both the slowest (0.053 s/image) and least accurate. Grad-CAM visualizations further confirmed that raw image-trained models consistently attended to meaningful plant structures, whereas segmentation-trained models often failed to localize correctly in cross-domain tests. These findings demonstrate that training with raw images yields more robust, generalizable, and deployable models. The study highlights the importance of domain consistency and preprocessing trade-offs in vision-based agricultural systems and lays the groundwork for lightweight, real-time AI applications in smart farming.

1. Introduction

Concerns about global food production are increasing due to population growth, climate change, and the reduction in arable land [1,2]. By 2050, the global population is expected to reach approximately 9.7 billion. As urbanization and climate change accelerate the decline of agricultural land, the issue of food shortages is expected to worsen [3,4]. To address these challenges, Controlled-Environment Agriculture (CEA) has emerged as a promising alternative to traditional open-field farming.
Among CEA technologies, plant factories are automated crop production systems that precisely regulate environmental factors such as light, temperature, humidity, CO2 concentration, and nutrients [5,6]. Plant factories are considered an effective solution to the challenges of climate change and land reduction, as they allow for year-round crop production in urban areas while improving food self-sufficiency and conserving resources [7,8].
Furthermore, plant factories provide precise environmental control, ensuring high reproducibility in experiments and reliable data collection. While previous studies have mainly been conducted in small-scale laboratory environments, this study aims to enhance practical applicability by utilizing empirical data collected from industrial-scale plant factories [9,10].
Accurate prediction of crop growth stages is essential for harvest scheduling, disease prevention, and quality control [11,12]. In CEA environments, integrating growth stage classification models with automated systems enables real-time, precise growth monitoring, significantly improving crop management efficiency.
Previous studies have primarily focused on biomass, yield, and leaf area index prediction [13,14,15], whereas growth stage classification remains relatively underexplored. In particular, biomass prediction models require continuous numerical outputs, making them less intuitive for direct decision-making in industrial environments, and data collection can be complex and impractical for real-world plant factories.
Conversely, CNN (Convolutional Neural Network)-based supervised learning models can directly process plant images, learning morphological characteristics and enabling more precise and consistent growth stage classification [16,17]. CNN-based classification models offer clear categorical outputs, facilitating interpretation and seamless integration with automated environmental control systems. Additionally, CNN models can extract growth stage-related morphological features (e.g., leaf size, structure) and maintain stable performance across different environments, making them more suitable for industrial applications than biomass prediction models.
This study selects butterhead lettuce (Lactuca sativa L.) as the target crop due to its short growth cycle (approximately 45–55 days) and relatively low space requirements, making it ideal for capturing images across multiple growth stages [13,18,19]. Furthermore, butterhead lettuce is a highly consumed salad vegetable with increasing global demand, adding to its research value.
Previous studies have explored non-destructive weight estimation, classification of lettuce varieties, and automated quality grading systems [13,20,21]. Building on these findings, this study aims to develop a CNN-based growth stage classification model to optimize its applicability in smart agriculture and industrial environments.
Image preprocessing is a crucial factor affecting the performance of CNN-based plant growth classification models. The GrabCut algorithm is widely used for background removal due to its high computational efficiency and accurate object segmentation capabilities [22,23]. However, it requires manual Region of Interest (ROI) selection and struggles with complex backgrounds, which can degrade performance in uncontrolled environments [24,25]. To overcome these limitations, hybrid approaches combining GrabCut with other segmentation techniques have been studied. For example, GrabCut combined with DeepLabV3+ has improved plant disease detection, while integrating GrabCut with Canny Edge Detection and the Watershed algorithm has enhanced grain classification accuracy [26,27].
At the same time, CNNs can automatically learn morphological and textural features from raw images, making it possible to achieve sufficient classification performance without extensive preprocessing [28,29]. Using raw images reduces preprocessing costs and increases feasibility for real-time applications, making it essential to evaluate whether GrabCut–Watershed preprocessing significantly improves model performance compared to using raw images alone [30,31].
This study aims to explore how plant growth classification models can be effectively developed by evaluating the influence of image processing strategies—specifically, the comparison between raw images and GrabCut–Watershed preprocessed images—on learning behavior and deployment feasibility in industrial plant factories.
The primary research objectives are as follows:
  • To assess the feasibility of CNN-based growth stage classification using raw, unstructured images of butterhead lettuce.
  • To compare classification performance between models trained on raw images and those trained on images processed through GrabCut–Watershed segmentation.
  • To evaluate cross-classification performance between raw and preprocessed domains in order to examine generalization capacity and inform future system design choices.
Ultimately, this research serves as a design-oriented investigation that aims to identify which modeling direction—raw image-based or segmentation-preprocessed—is more effective and practical for downstream applications. The findings offer guidance for the development of lightweight, real-time AI models in smart farming systems.
This study provides several key contributions:
  • A data-centric analysis of preprocessing strategies in CNN-based growth stage classification models, identifying scenarios where preprocessing helps or hinders model effectiveness.
  • An empirical understanding of the trade-offs between segmentation-based and raw image-based training approaches, particularly under data-limited conditions.
  • A foundation for future research into lightweight architectures and efficient data pipelines that support scalable deployment in industrial plant factories.
By addressing how data characteristics and preprocessing strategies impact CNN model performance, this research offers practical insights into how to best utilize agricultural image datasets for reliable and scalable AI-based crop monitoring.

2. Materials and Methods

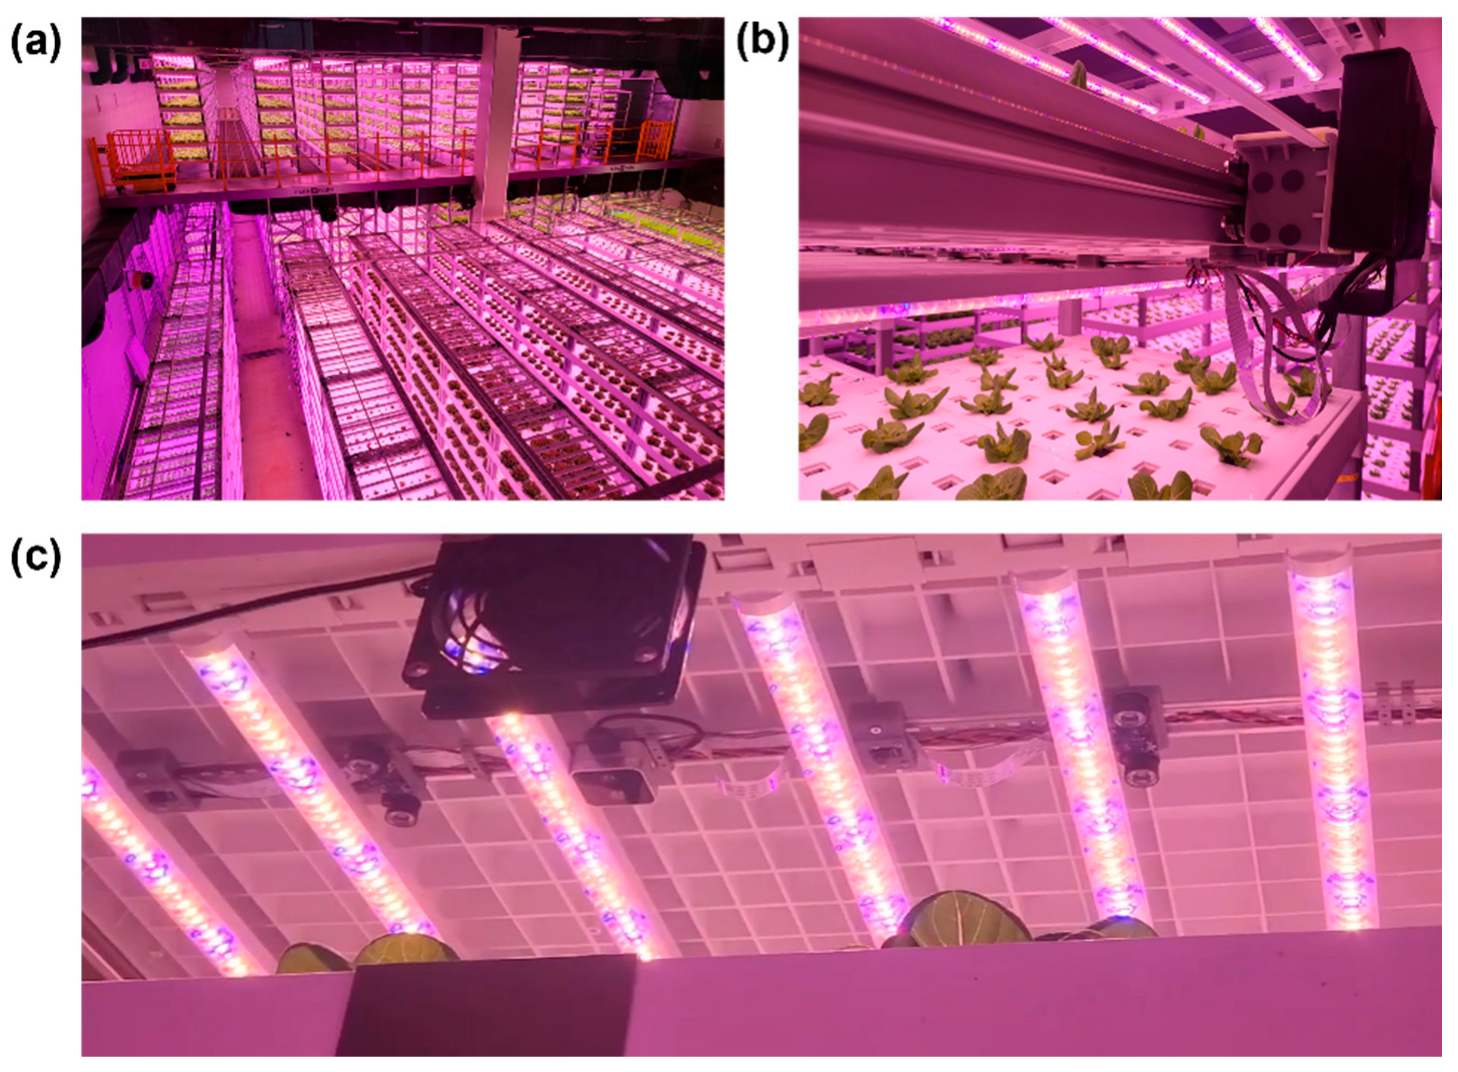
2.1. Dataset and Image Preprocessing

The experimental data used in this study consist of butterhead lettuce images collected over approximately two months, from 23 September 2022, to 26 November 2022. These images were acquired and selected separately during three cultivation cycles using the data acquisition system from previous research [13] in an industrial plant factory (Figure 1). Since the optimal range of environmental conditions for butterhead lettuce are 18–25 °C for temperature, 60–80% for relative humidity, and 788–917 ppm for carbon dioxide concentration, the industrial plant factory maintained conditions of 21.2 ± 3 °C, 75.6 ± 15%, and 827 ppm on average, respectively. The original images used in this study (Figure 2) are RGB images captured under normal lighting conditions of the industrial plant factory. To define the growth stages of butterhead lettuce for image classification, this study followed the temporal categorization period into weekly intervals. Importantly, Week 1 was defined as the first week after transplanting, which includes the early nursery phase. This labeling scheme is consistent with previous studies on lettuce growth monitoring using machine vision and deep learning models. As a previous study divided growth development into three stages during the cultivation period [32], the plant growth stages were classified into three categories based on the time of capture: Stage 1 for the first week, Stage 2 for the second week, and Stage 3 for the third week. Each cultivation cycle lasted three weeks. The dataset comprises a total of 476 original images, including 163 images in Stage 1, 160 images in Stage 2, and 153 images in Stage 3.
In addition, for each growth stage of the original images shown in Figure 2, butterhead images preprocessed using the GrabCut–Watershed algorithm were also employed in the experiments for efficient manual segmentation. The GrabCut–Watershed was applied to each original image using Python’s OpenCV library, and similarly, the GrabCut–Watershed images were classified into three stages, as depicted in Figure 2. The GrabCut–Watershed image dataset comprised a total of 445 images, with 139 images in growth stage 1, 171 images in growth stage 2, and 135 images in growth stage 3 (Table 1). Some images were excluded due to incomplete edge preprocessing caused by overlapping neighboring leaves.
In this study, GrabCut–Watershed was selected as the segmentation approach to generate preprocessed image datasets for model comparison. Given the limited dataset size and the overlapping nature of lettuce leaves, fully automated deep learning-based segmentation models such as U-Net or DeepLabV3+ were intentionally excluded due to their high annotation cost and relatively poor boundary precision under these conditions. In contrast, the GrabCut–Watershed method allowed targeted, user-guided object separation with better control over morphological detail. This choice enabled a controlled investigation of how segmentation affects classification performance, without the added complexity of training a separate segmentation network.

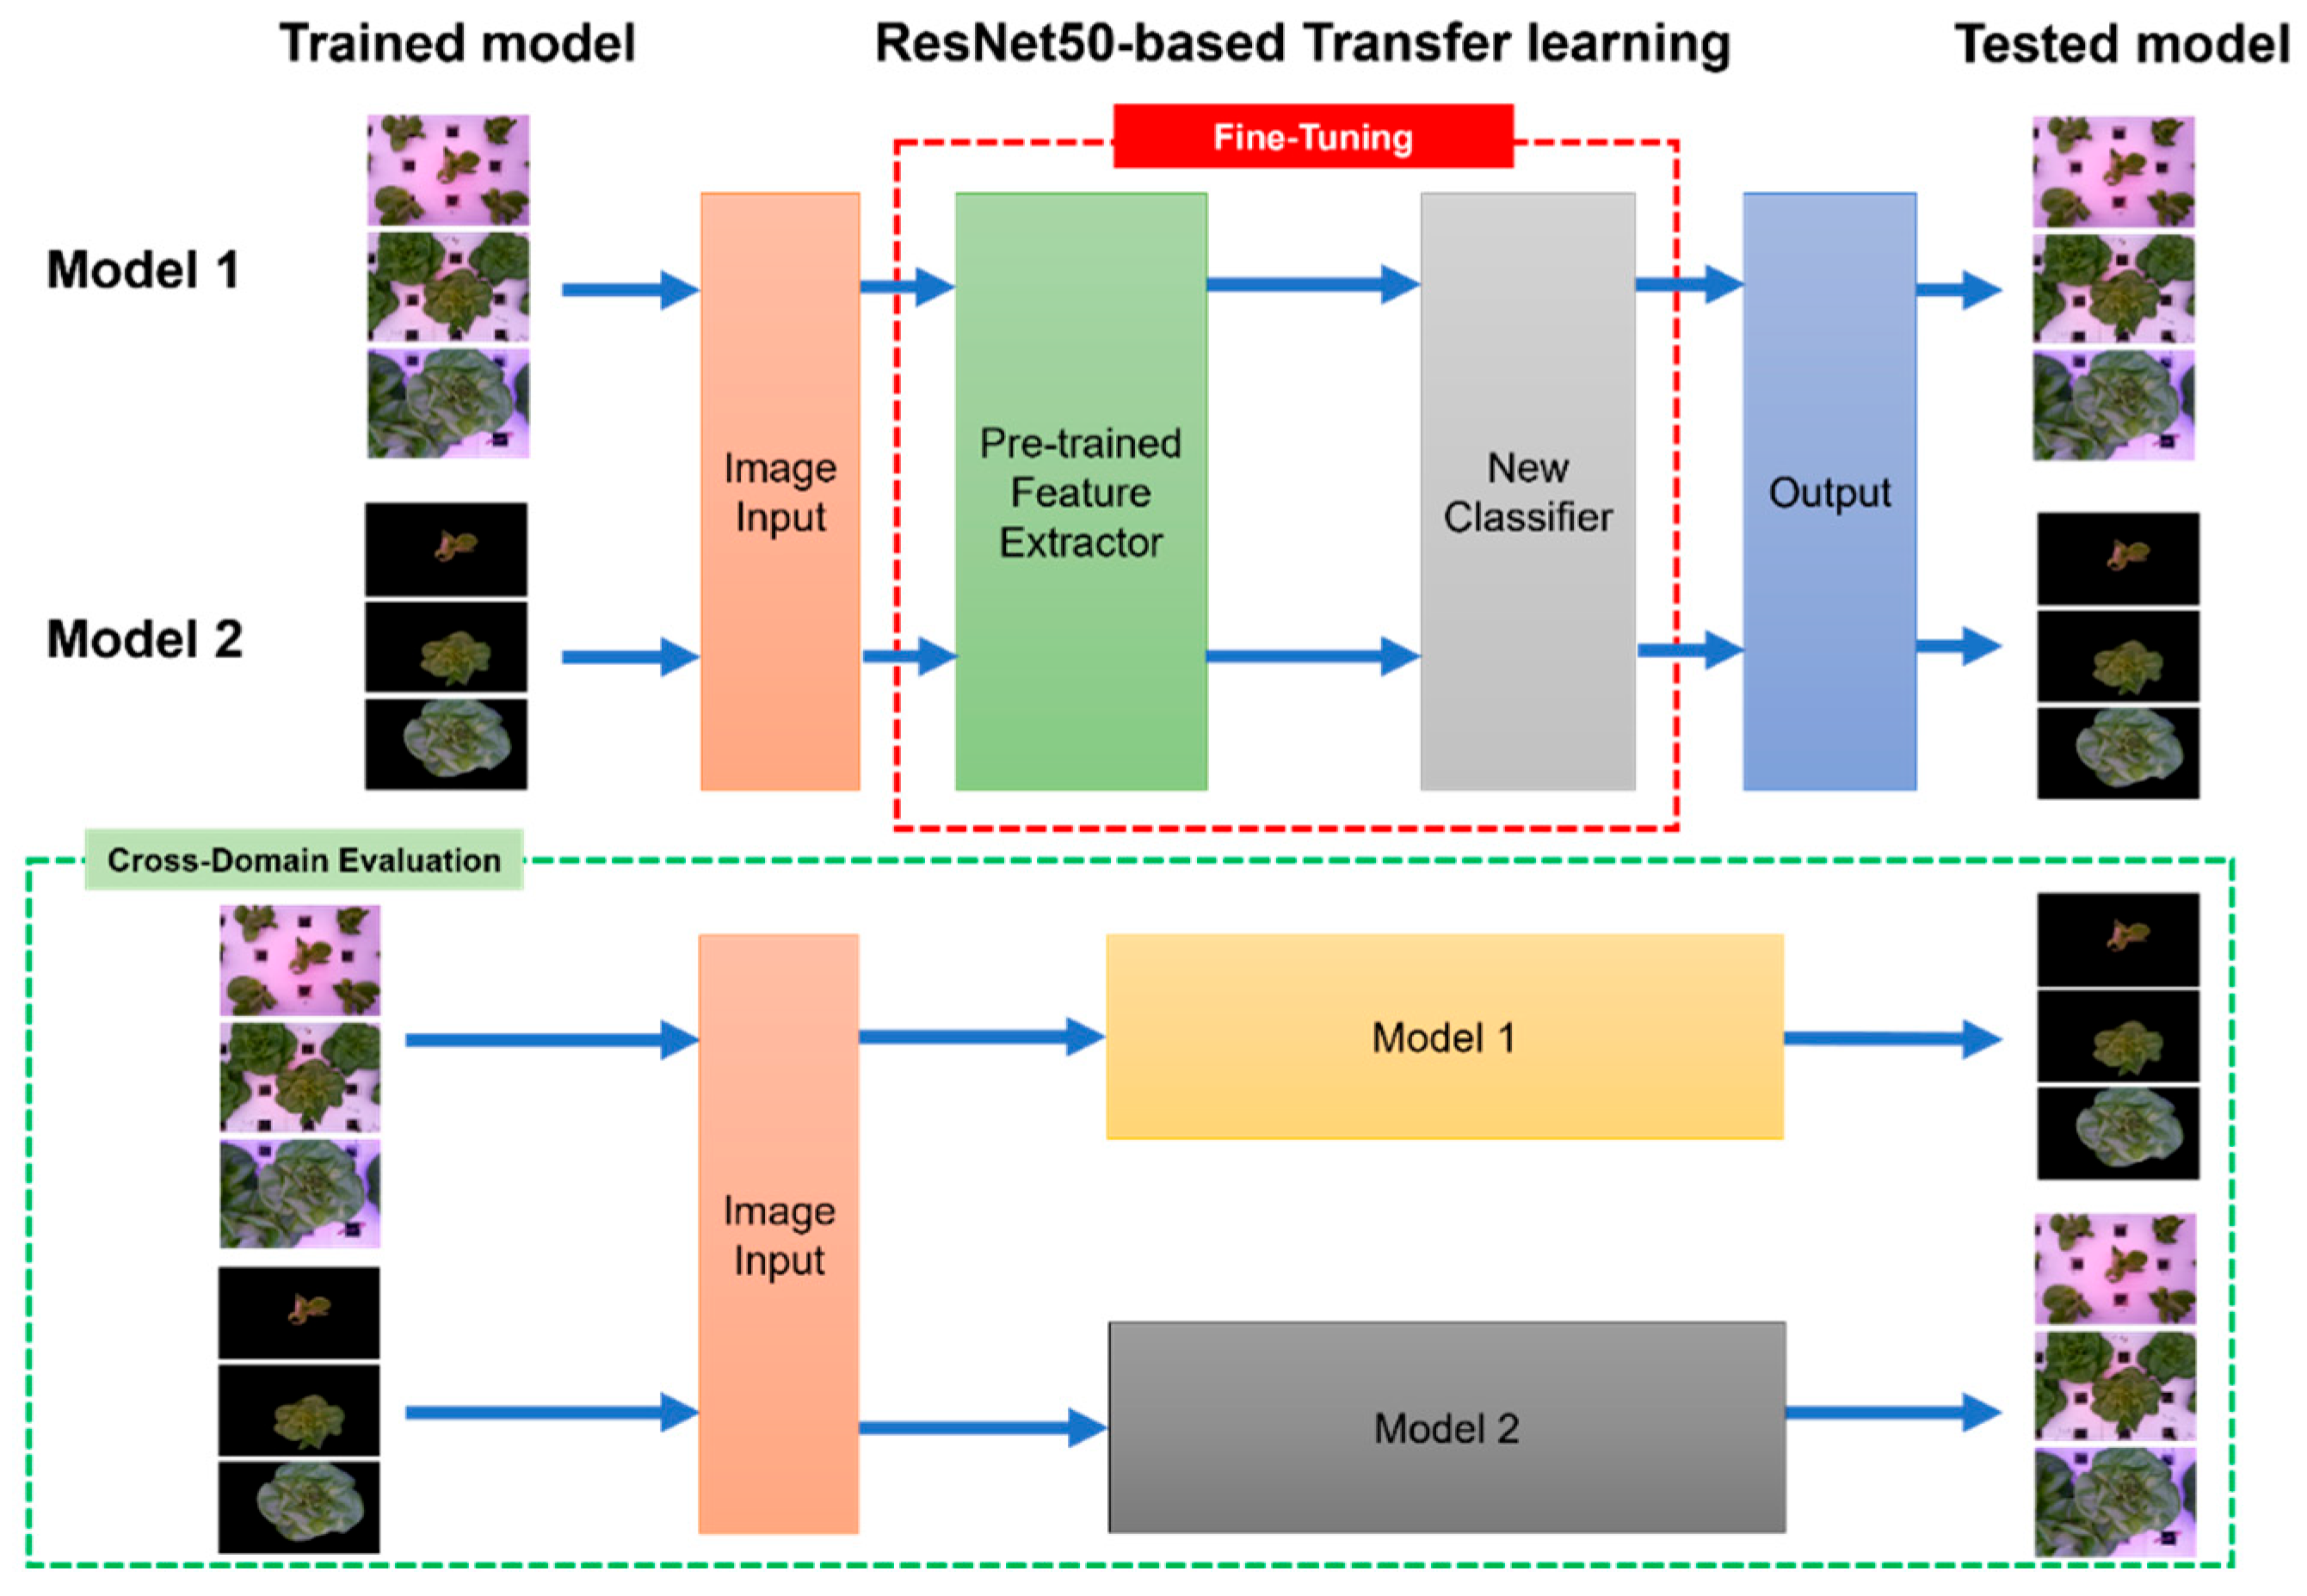
2.2. Experimental Design and Model Training

In this study, a total of four analyses were conducted. To improve generalization under limited dataset conditions, we applied a series of data augmentation techniques to the training images, including random horizontal flipping, ±15° random rotation, and brightness/contrast/saturation jittering via ColorJitter. As a result, 1428 augmented original images (856:285:287 = train–validation–test) and 1335 augmented GrabCut–Watershed images (801:267:267) were generated and included in the respective datasets (Table 1). All datasets were partitioned using a 6:2:2 ratio, in line with common practices in image-based learning tasks [33,34,35].
Given the relatively limited size of the dataset, transfer learning using a CNN model pre-trained in PyTorch allows the classification model to converge relatively quickly [36]. Therefore, to achieve high performance, model 1 was created by fine-tuning a pre-trained ResNet50 provided by the PyTorch library (version 2.7.0). Leveraging the pre-trained weights of ResNet50 reduces both the training time and cost on small datasets, while maintaining higher accuracy in transfer learning compared to other models such as VGG16, VGG19, and AlexNet [37,38] (Figure 3).

2.3. Training Strategy and Hyperparameter Settings

In this study, the batch size was set to 32 and the number of epochs to 10. According to previous studies, extensive experiments on various datasets such as CIFAR-10, CIFAR-100, and ImageNet have shown that optimal performance—in terms of training stability, convergence speed, and test accuracy—is often achieved with batch sizes of 32 or less, and sometimes even with very small batch sizes such as 2 or 4. These findings indicate that smaller batch sizes can capture the most recent gradient information, thereby reducing the variance in weight updates and providing a more stable learning rate range [39].
For SGD (Stochastic gradient descent)-based optimization, an initial learning rate of 0.01 has been shown to facilitate stable convergence without significant fluctuations, particularly on small datasets [40]. Therefore, in our experiments, the learning rate was initially set to 0.01 and then reduced by a factor of 10 using a step decay method every 3 epochs, ensuring stable convergence as the number of epochs increased. The step decay method effectively reduces the noise in SGD and promotes stable convergence due to its simplicity and clear decay intervals [41].
As previously mentioned, the dataset of original images shown in Figure 2 was divided into three datasets: training, validation, and test sets. Subsequently, the model was trained using the training dataset and validated on the validation dataset, with the changes in the loss function and accuracy visualized over the epochs. Finally, the model corresponding to the highest validation accuracy was saved, and its test accuracy was measured.
Next, using the GrabCut–Watershed images shown in Figure 2, we replicated the same experimental procedure previously applied to the original plant images to build the growth stage classification model (Model 2). We then saved the model parameters that achieved the highest validation accuracy and measured the corresponding test accuracy. Subsequently, we tested the GrabCut–Watershed image test set on Model 1 (which was saved at its highest validation accuracy from the original image experiments) and tested the original image test set on Model 2 (which was saved at its highest validation accuracy from the GrabCut image experiments) to evaluate and compare their classification accuracies (Figure 3; Cross-Domain Evaluation). Since the two test sets—the one from the original images and the other from the GrabCut–Watershed images—are composed differently, the results of the cross-domain evaluation are more reliable in a practically random situation.

2.4. Evaluation Metrics and Model Interpretability

To comprehensively evaluate model performance, both quantitative and visual interpretability analyses were conducted. Classification performance was assessed using standard metrics, including precision, recall, and F1-score for each growth stage class. These metrics were computed using the classification report and confusion matrix functions from the Scikit-learn library, based on the predictions made on the test set. The results were summarized in tabular form and supplemented with confusion matrices to analyze class-wise prediction reliability and error patterns.
In addition to numerical evaluation, Grad-CAM (Gradient-weighted Class Activation Mapping) was employed to interpret the spatial focus of each model during classification. Activation maps were extracted using the final block of layer 3 in the ResNet50 backbone, which captures mid-level feature representations. Grad-CAM visualizations were generated for representative samples from class 0 (Week1) across four evaluation scenarios: Model 1, Model 2, Model 1-CDE, and Model 2-CDE. These visualizations enabled the identification of key morphological features that the models relied on and provided insight into model robustness and generalization across domains.

3. Results and Discussion

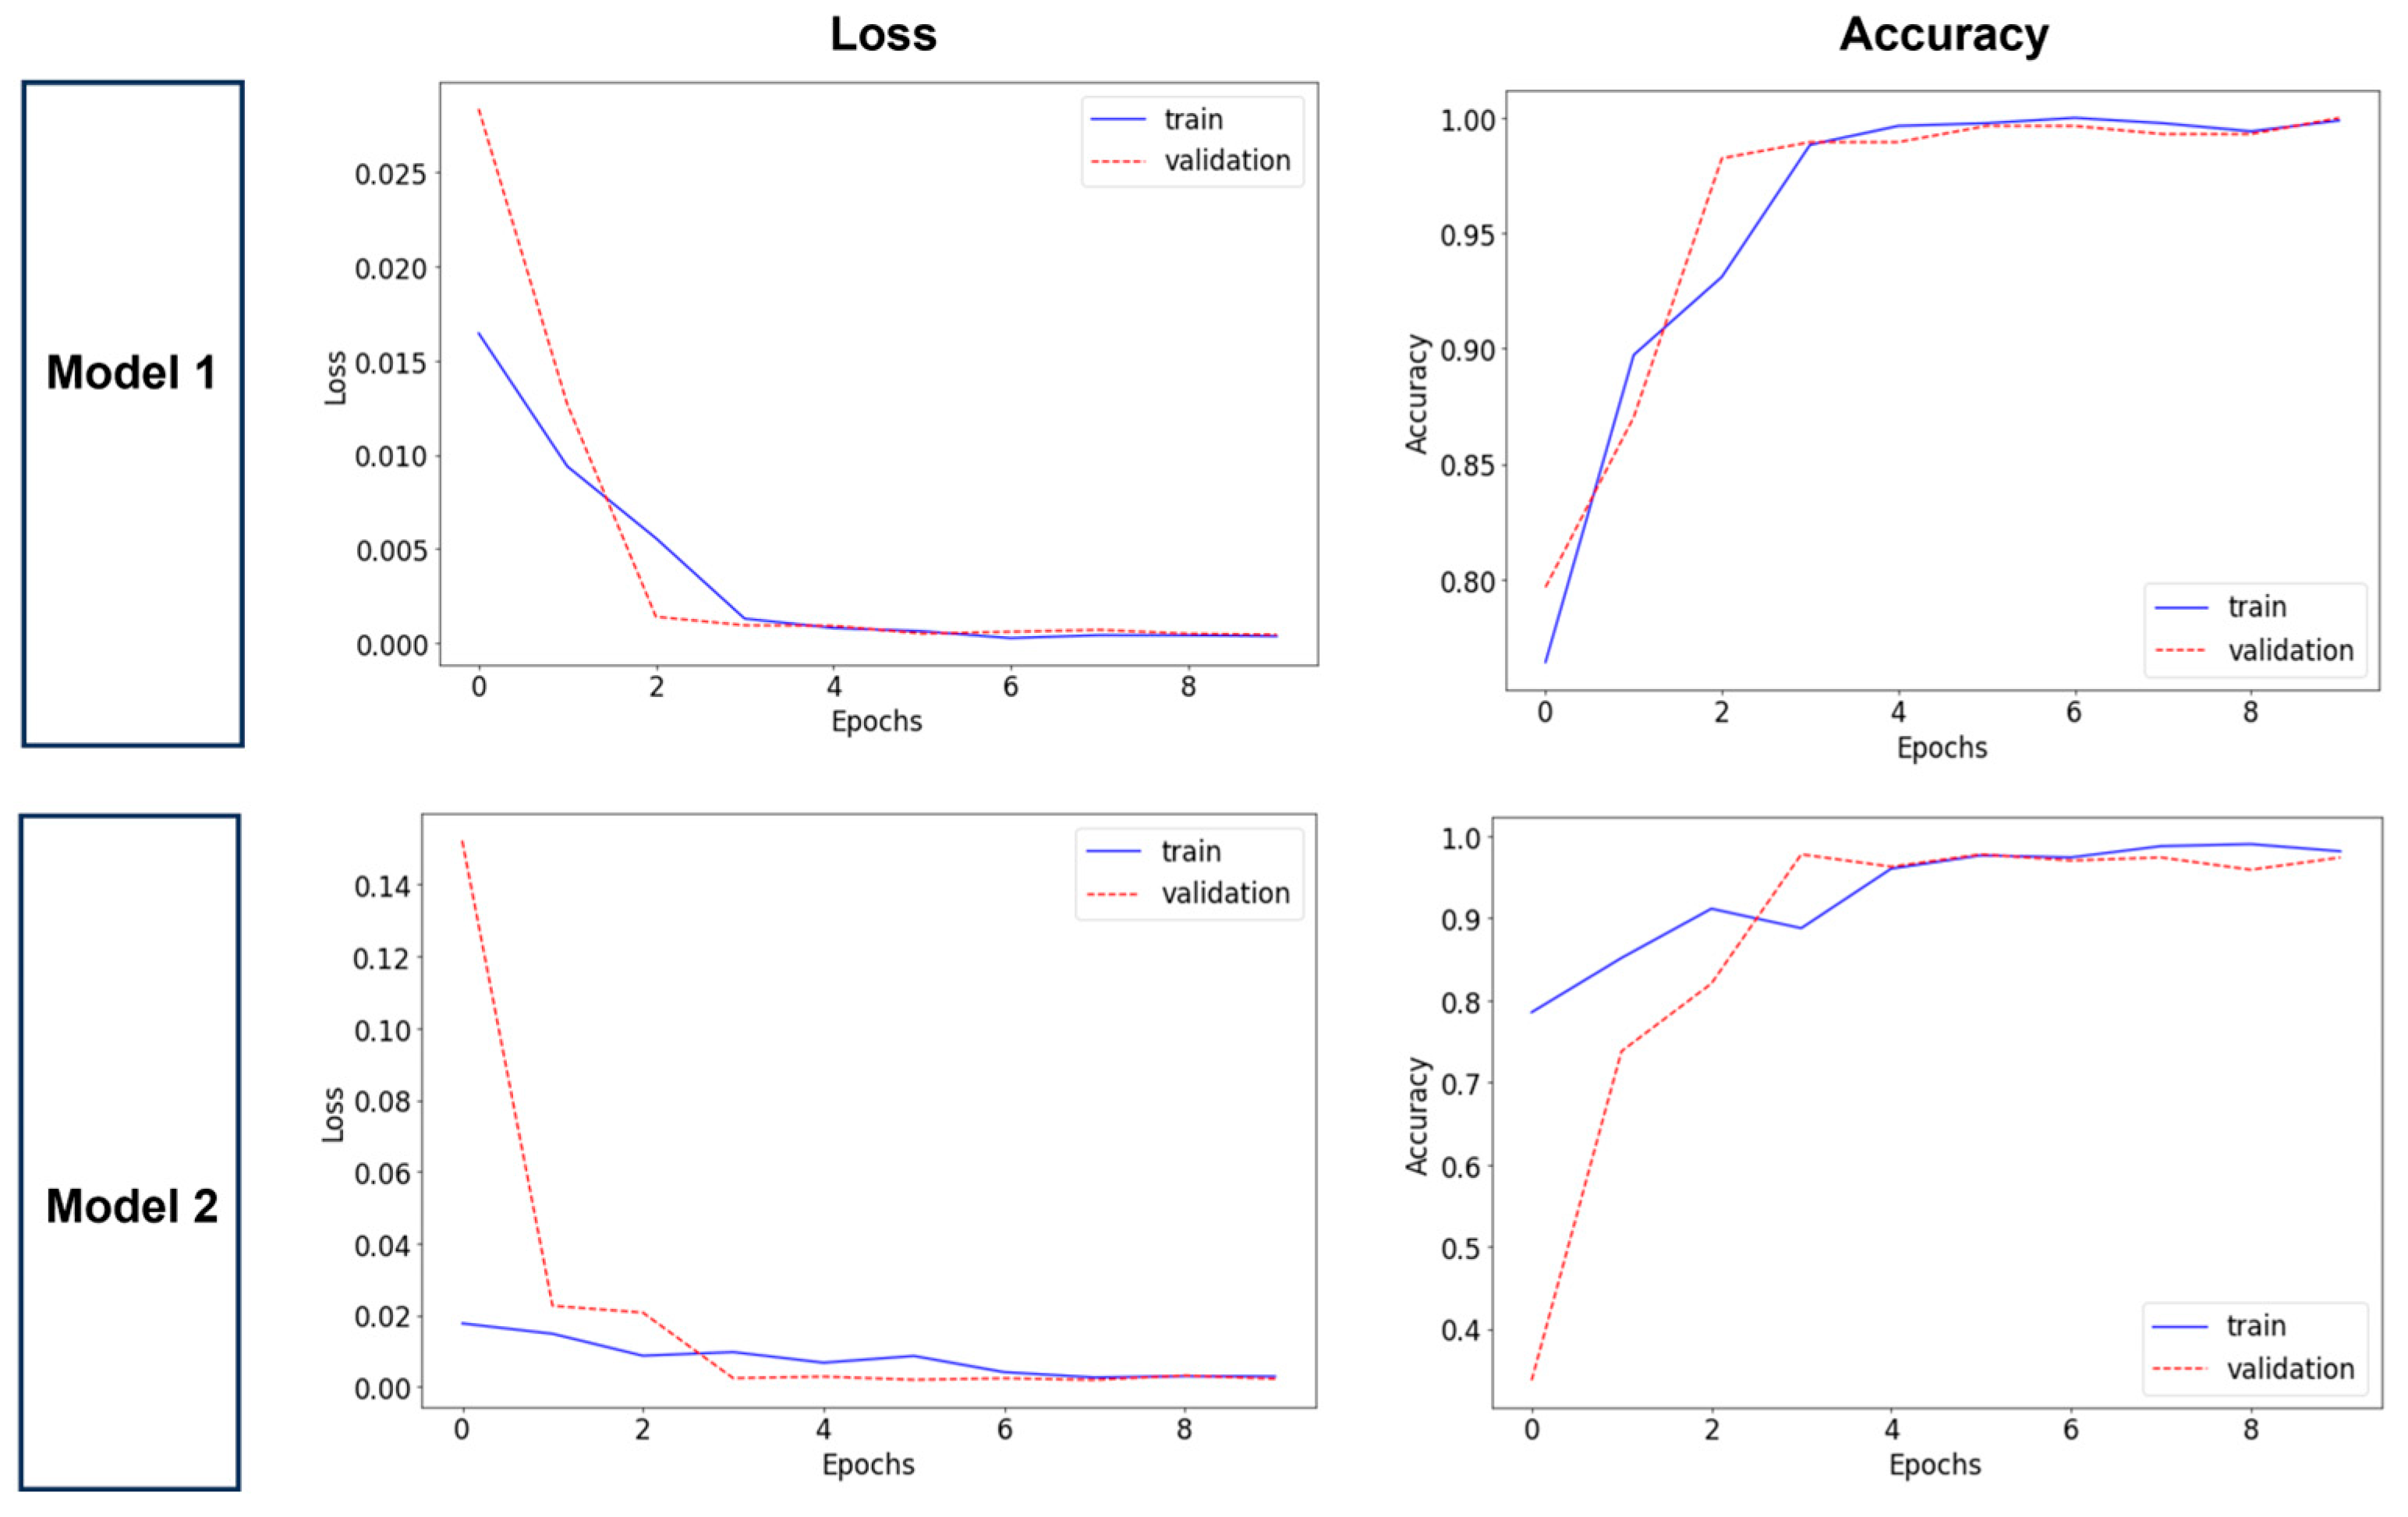
3.1. Evaluation of the Original Image-Based Model

When training for a total of 10 epochs, the training and validation loss and accuracy for Model 1 at each epoch are visualized in the Model 1 section of Figure 4. Although some variability was observed during the initial epochs, both training and validation losses gradually decreased while accuracy increased, eventually stabilizing as the number of epochs increased. The validation graph in Figure 4 clearly indicates that the highest validation accuracy was achieved at the 10th epoch.
Furthermore, the test accuracy obtained from the model trained with the original images matches the results presented for Model 1 in Table 2. In Table 2 and Table 3, the highest validation accuracy is also observed at the 10th epoch, and the model, whose parameters were saved at this epoch, achieved a test classification accuracy of approximately 99.65% when evaluated on the original images. This value is higher than the previous research for lettuce growth stage classification in smart aquaponics using K-Nearest Neighbor (KNN), which showed the most effective model among Logistic Regression (LR) and Linear Support Vector Machine (L-SVM), with a classification accuracy of 91.67% [42].

3.2. Evaluation of the GrabCut–Watershed Image-Based Model

For the model trained on GrabCut–Watershed images, the test results on GrabCut–Watershed images were visualized over 10 epochs by plotting the training and validation loss and accuracy for Model 2, as shown in the Model 2 graphs in Figure 4. Similar to Model 1, Model 2 exhibited considerable variability during the early epochs; however, as the epochs progressed, both the training and validation losses decreased while accuracy increased and eventually stabilized. Moreover, the validation graph in Figure 4 clearly indicates that the highest validation accuracy for Model 2 was achieved at the fourth epoch. This finding is shown in Table 2 and Table 3, which also show that Model 2 attained its highest validation accuracy at epoch 4. The model, whose parameters were saved at this epoch, achieved a test classification accuracy of 97.75% when evaluated on the GrabCut–Watershed images.

3.3. Cross-Domain Evaluation

In contrast, the model trained on original images (Model 1) but tested on the test set of GrabCut–Watershed images (Model 1-CDE in Table 2) achieved a classification accuracy of approximately 82.77%, while the model trained on GrabCut–Watershed images (Model 2) but tested on the test set of original images (Model 2-CDE in Table 2) achieved an accuracy of approximately 34.15%. In the cases of Models 1 and 2, the variability in training and validation loss and accuracy decreased over the epochs, eventually stabilizing; this behavior indicates good convergence and reliability of the generated classification models. Moreover, by simply fine-tuning a pre-built PyTorch model, we were able to develop an image-based growth stage classification model that achieved over 97% accuracy, demonstrating that deep learning models can provide effective growth stage classification even with relatively small datasets.
However, the results of Model 1-CDE and Model 2-CDE demonstrate a substantial decline in classification accuracy when there is a domain shift between training and testing images, compared to experiments conducted within the same domain. Although we initially anticipated that Model 1-CDE would significantly outperform the baseline, given that the original images contain richer and more complex information than the preprocessed images, its performance was unexpectedly low, achieving only around 80% accuracy. This discrepancy may be attributed to the presence of multiple crops and higher visual density in the original images, whereas the GrabCut–Watershed preprocessed images typically contain a single, isolated crop, resulting in reduced complexity for the classifier.
Additionally, while the model trained on original images and tested on GrabCut–Watershed images still achieved an accuracy above 80%, the model trained on GrabCut–Watershed images and tested on original images barely exceeded 30% accuracy. These findings indicate that generalizing from features learned on preprocessed images to classify original images is a more challenging task.
Therefore, additional improvements in experimental conditions may be required to enhance the model’s performance in such cross-domain scenarios. Furthermore, these results suggest that the features learned from the preprocessed images are insufficient to fully capture the diversity caused by the complex background information and noise present in the original images, clearly demonstrating that domain differences have a negative impact on classification performance.

3.4. Classification Error Patterns: Confusion Matrix Analysis

Figure 5 presents the confusion matrices for all four evaluation scenarios, illustrating how each model predicted the three growth stages (Week1, Week2, Week3).
In the same-domain settings, Model 1 (Figure 5a) and Model 2 (Figure 5b) showed strong diagonal dominance, indicating excellent classification performance. Model 1 achieved near-perfect predictions across all classes, with only minimal misclassification (e.g., one sample in Week1 misclassified as Week2). Model 2 also demonstrated high precision and recall, though a slightly larger number of misclassifications occurred, particularly for Week1 samples misclassified as Week2.
In contrast, cross-domain evaluations revealed notable degradation in performance. Model 1-CDE (Figure 5c) retained a moderate level of accuracy, especially in predicting Week1 and Week3, although Week2 exhibited more confusion, being misclassified across adjacent stages. Model 2-CDE (Figure 5d) exhibited severe degradation, with the model predicting all samples as Week3 regardless of the actual class. This resulted in a complete failure to distinguish among stages and reflects the model’s inability to generalize beyond the domain it was trained on.
These results reinforce the importance of domain consistency in training and deployment. They also demonstrate that while segmentation-based preprocessing may simplify visual features and aid within-domain accuracy (as seen in Model 2), it may hinder generalization when real-world variability is introduced (as in Model 2-CDE).
In addition to the confusion matrices, detailed performance metrics for each growth stage are provided in Table 3. These detailed metrics offer a more comprehensive view of model behavior beyond overall accuracy, highlighting differences in prediction reliability by class. In the same-domain setting, both Model 1 and Model 2 demonstrated strong performance (F1-scores > 0.97), with Model 1 achieving perfect scores for Week1 and F1-scores close to 1.000 for Week2 and Week3, confirming its robustness and consistency. Model 2 achieved F1-scores of 0.971 and 0.975 for Week2 and Week3, respectively.
Cross-domain evaluations, however, revealed significant divergence: Model 1-CDE maintained moderate performance (F1-scores ranging from 0.857 to 0.871) with reasonable class-wise balance, while Model 2-CDE entirely failed to classify Week1 and Week2 (precision and recall = 0) and only partially identified Week3 (F1 = 0.510). This collapse in classification confirms the poor generalizability of models trained exclusively on segmented inputs when applied to unsegmented, real-world images—a pattern consistently observed in the confusion matrices (Figure 5) and Grad-CAM visualization (Figure 6). These findings underscore the importance of domain consistency and support the conclusion that models trained on original images provide more stable and transferable performance across diverse input conditions.

3.5. Attention Behavior Analysis: Grad-CAM Visualization

To further investigate the decision-making behavior of each model and interpret their differences in classification performance, Grad-CAM visualizations were generated using the output of the final block of layer 3 in the ResNet50 backbone. This layer was chosen as it captures mid-level spatial representations, balancing local and global visual features. Four representative samples are shown in Figure 6.
In the same-domain scenarios, Model 1 achieved the highest accuracy (99.65%), while Model 2 followed closely (97.75%). Grad-CAM results confirm that both models consistently attended to morphologically meaningful regions, especially the central area of the lettuce leaves. Model 2 exhibited slightly more concentrated attention due to the visual simplicity of segmented images, but this marginal gain in efficiency did not surpass the high accuracy of Model 1, which demonstrated superior generalization on raw images with richer contextual information.
A notable performance drop occurred in the cross-domain evaluations. Model 1-CDE maintained a reasonably high accuracy of 82.77%, indicating its moderate robustness when exposed to preprocessed images despite being trained on original ones. Grad-CAM in this case showed partially diffused attention, yet still captured key plant areas. In contrast, Model 2-CDE’s accuracy fell dramatically to 34.15%, and its Grad-CAM visualization revealed a breakdown in localization—attention was misdirected toward irrelevant background regions, such as grid patterns and lighting areas, rather than the plant itself.
These findings suggest that while segmentation can offer cleaner inputs for training, models trained exclusively on preprocessed images (Model 2) may overfit to such uniform visual conditions and fail to generalize when faced with real-world variability. Conversely, models trained on original images (Model 1) demonstrate better adaptability and spatial awareness across domains, leading to more stable performance and interpretable attention behavior in deployment settings.

3.6. Inference Time and Practical Considerations for Deployment

In addition to classification accuracy and generalization, inference time is a critical factor in determining model suitability for real-world deployment. It should be noted that the reported inference time does not account for segmentation operations such as GrabCut–Watershed. Moreover, depending on the image domain (original or preprocessed) and experimental setup (same-domain or cross-domain evaluation), the inference time varied significantly. These variations were analyzed to better reflect real-world application scenarios where preprocessing steps may or may not be included.
As summarized in Table 2, Model 2 exhibited the shortest pure model inference time (0.037 s/image), benefiting from the visual simplicity of pre-segmented inputs. Model 1 recorded a slightly slower inference time (0.055 s/image), but required no additional preprocessing, making it operationally more self-contained. Among the cross-domain settings, Model 1-CDE achieved a strong balance of performance and speed, with the fastest overall inference time (0.040 s/image) and an accuracy of 82.77%. In contrast, Model 2-CDE showed the worst performance across all metrics, with both the longest inference time (0.053 s/image) and the lowest accuracy (34.15%), underscoring its lack of generalizability and computational inefficiency when tested on raw images.
These findings emphasize not only the importance of raw image-based models in terms of classification performance but also their advantage in achieving a favorable trade-off between accuracy and inference speed. In particular, Model 1-CDE demonstrates that models trained on diverse visual features can generalize well even under domain shift, while maintaining efficient inference performance. This highlights the practical benefit of training on raw data in scenarios where real-time decisions must be made under varying visual conditions.
From a practical standpoint, inference times between 0.04 and 0.06 s/image for monitoring plants, as observed in Models 1 and 1-CDE, fall within the generally acceptable range for near-real-time applications in industrial plant factories [13]. In such environments, image acquisition and decision-making cycles often occur at intervals of several seconds to minutes. Therefore, the observed inference times indicate that raw image-based models are suitable not only in terms of accuracy and generalization but also in meeting operational requirements for deployment in real-world automated cultivation systems.

3.7. Future Study

Future work should focus on enhancing the practical reliability and generalizability of the proposed CNN-based growth stage classification model in industrial plant factory environments. One promising direction is to combine both raw and preprocessed images during training to improve robustness against domain variability. Additionally, expanding the dataset with a larger and more diverse collection of original images, along with refined preprocessing techniques that better reflect the background characteristics of real-world environments, may further improve generalization.
Furthermore, incorporating standard data augmentation methods (e.g., rotation, brightness, variation, noise injection) is expected to increase model robustness across environmental conditions. Adopting lightweight architectures such as MobileNet or EfficientNet-Lite may also reduce inference time, thereby supporting real-time integration with automated crop monitoring and control systems.
Finally, future efforts should consider training and validating the model under a broader range of cultivation scenarios and crop batches to ensure scalability and consistent performance in dynamic production settings.

4. Conclusions

This study developed a CNN-based transfer learning model for butterhead lettuce (Lactuca sativa L.) growth stage classification applicable to industrial plant factories, and analyzed the impact of GrabCut–Watershed preprocessing on model performance and inference efficiency. To achieve this, models were trained on both raw and GrabCut–Watershed preprocessed images, and their classification performance was compared. Additionally, cross-classification experiments were conducted to evaluate the adaptability of models trained on different image types.
The results showed that models trained and tested within the same domain achieved high classification accuracy (~98–99%), confirming the potential of CNN-based transfer learning for practical applications in industrial plant factories. However, cross-domain evaluations revealed a significant performance drop, with the raw image-trained model achieving 82.77% accuracy on GrabCut–Watershed images, while the GrabCut–Watershed-trained model achieved only 34.15% accuracy on raw images. These discrepancies were further substantiated by class-wise metrics, where Model 2-CDE showed complete misclassification in Week1 and Week2 (F1 = 0), in contrast to Model 1-CDE, which retained balanced performance across classes. Visual interpretability analysis using Grad-CAM revealed that raw image-trained models consistently attended to meaningful plant structures such as leaf centers and contours, whereas models trained on segmented images often misdirected attention toward background artifacts in unseen domains. These findings highlight the importance of domain consistency and rich visual diversity in training data for robust generalization.
These performance trends were also reflected in inference efficiency. Although Model 2 showed the fastest model-only inference time (0.037 s/image), this measurement excludes the time-consuming GrabCut–Watershed preprocessing step, which would significantly increase overall latency in practice. In contrast, Model 1 required 0.055 s/image without any additional preprocessing, making it more favorable for real-time or near-real-time applications. Notably, Model 1-CDE achieved the fastest overall inference speed (0.040 s/image) while maintaining reasonable accuracy, whereas Model 2-CDE was both the slowest (0.053 s/image) and the least accurate. These results emphasize not only the superior generalization of raw image-based models but also their computational efficiency, making them suitable for real-time deployment in cross-domain settings. From an industrial perspective, inference speeds in the range of 0.04 to 0.06 s per image are generally acceptable for systems where image acquisition occurs at several-second or minute-level intervals, such as automated nutrient control or environmental monitoring. These findings support the practical deployment of raw image-based models in time-sensitive, vision-driven plant factory systems.
Future research should focus on optimizing preprocessing techniques to retain essential plant features while minimizing processing time, broadening the diversity of training data through broader environmental sampling, and applying robust data augmentation strategies to enhance model generalization. Additionally, adopting lightweight CNN architectures such as MobileNet or EfficientNet-Lite may further reduce inference time and facilitate real-time deployment in automated crop monitoring systems. Overall, this study provides practical insights into the implementation of CNN-based growth stage classification models in industrial plant factories and contributes to the advancement of smart agriculture and intelligent crop management technologies.

Author Contributions

Conceptualization, J.-S.G.K.; methodology, J.-S.G.K. and M.K.; software, J.-S.G.K. and M.K.; validation, J.-S.G.K. and M.K.; formal analysis, J.-S.G.K.; investigation, J.-S.G.K.; resources, M.K. and S.C.; data curation, J.-S.G.K. and S.C.; writing—original draft preparation, J.-S.G.K., M.K., J.S. and S.H.S.; writing—review and editing, J.-S.G.K., M.K., J.S., S.H.S. and S.C.; visualization, J.-S.G.K., M.K. and J.S.; supervision, S.C.; project administration, J.-S.G.K. and S.C.; funding acquisition, S.C. All authors have read and agreed to the published version of the manuscript.

Funding

This research was funded by the Korea Institute of Planning and Evaluation for Technology in Food, Agriculture and Forestry (IPET) through the Technology Commercialization Support Program, funded by the Ministry of Agriculture, Food and Rural Affairs (MAFRA) (Project No. RS-2024-00395333).

Institutional Review Board Statement

Not applicable.

Informed Consent Statement

Not applicable.

Data Availability Statement

The data presented in this study are available on request from the corresponding author.

Acknowledgments

This work was supported and funded by the Korea Institute of Planning and Evaluation for Technology in Food, Agriculture and Forestry (IPET) through the Technology Commercialization Support Program, funded by the Ministry of Agriculture, Food and Rural Affairs (MAFRA) (Project No. RS-2024-00395333) and the BK21 FOUR, Global Smart Farm Educational Research Center, Seoul National University, Seoul, Korea.

Conflicts of Interest

The authors declare no conflicts of interest.

References

  1. Brain, R.; Perkins, D.; Ghebremichael, L.; White, M.; Goodwin, G.; Aerts, M. The shrinking land challenge. ACS Agric. Sci. Technol. 2023, 3, 152–157. [Google Scholar] [CrossRef]
  2. Lehman, R.M.; Cambardella, C.A.; Stott, D.E.; Acosta-Martinez, V.; Manter, D.K.; Buyer, J.S.; Maul, J.E.; Smith, J.L.; Collins, H.P.; Halvorson, J.J.; et al. Understanding and enhancing soil biological health: The solution for reversing soil degradation. Sustainability 2015, 7, 988–1027. [Google Scholar] [CrossRef]
  3. Gu, D.; Andreev, K.; Dupre, M.E. Major trends in population growth around the world. China CDC Wkly. 2021, 3, 604. [Google Scholar] [CrossRef] [PubMed]
  4. Nations, U. World population prospects: The 2015 revision. United Nations Econ. Soc. Aff. 2015, 33, 1–66. [Google Scholar]
  5. Benke, K.; Tomkins, B. Future food-production systems: Vertical farming and controlled-environment agriculture. Sustain. Sci. Pract. Policy 2017, 13, 13–26. [Google Scholar] [CrossRef]
  6. Martinez, J. Controlled Environment Agriculture: A Systematic Review. Food Safety, 10 April 2024. Available online: https://www.food-safety.com/articles/9386-controlled-environment-agriculture-a-systematic-review (accessed on 25 May 2025).
  7. Hirama, J. The history and advanced technology of plant factories. Environ. Control Biol. 2015, 53, 47–48. [Google Scholar]
  8. Luna-Maldonado, A.I.; Vidales-Contreras, J.A.; Rodríguez-Fuentes, H. Advances and trends in development of plant factories. Front. Plant Sci. 2016, 7, 1848. [Google Scholar] [CrossRef]
  9. Chen, Y.-R.; Chao, K.; Kim, M.S. Machine vision technology for agricultural applications. Comput. Electron. Agric. 2002, 36, 173–191. [Google Scholar] [CrossRef]
  10. Liu, Y.; Mousavi, S.; Pang, Z.; Ni, Z.; Karlsson, M.; Gong, S. Plant factory: A new playground of industrial communication and computing. Sensors 2021, 22, 147. [Google Scholar] [CrossRef]
  11. Meng, Y.; Xu, M.; Yoon, S.; Jeong, Y.; Park, D.S. Flexible and high quality plant growth prediction with limited data. Front. Plant Sci. 2022, 13, 989304. [Google Scholar] [CrossRef]
  12. Nidamanuri, R.R. Deep learning-based prediction of plant height and crown area of vegetable crops using LiDAR point cloud. Sci. Rep. 2024, 14, 14903. [Google Scholar]
  13. Kim, J.S.G.; Moon, S.; Park, J.; Kim, T.; Chung, S. Development of a machine vision-based weight prediction system of butterhead lettuce (Lactuca sativa L.) using deep learning models for industrial plant factory. Front. Plant Sci. 2024, 15, 1365266. [Google Scholar] [CrossRef] [PubMed]
  14. Colonna, R.; Genzano, N.; Ciancia, E.; Filizzola, C.; Fiorentino, C.; D’Antonio, P.; Tramutoli, V. A Method to Determine the Optimal Period for Field-Scale Yield Prediction Using Sentinel-2 Vegetation Indices. Land 2024, 13, 1818. [Google Scholar] [CrossRef]
  15. Du, L.; Yang, H.; Song, X.; Wei, N.; Yu, C.; Wang, W.; Zhao, Y. Estimating leaf area index of maize using UAV-based digital imagery and machine learning methods. Sci. Rep. 2022, 12, 15937. [Google Scholar] [CrossRef]
  16. Tan, S.; Liu, J.; Lu, H.; Lan, M.; Yu, J.; Liao, G.; Wang, Y.; Li, Z.; Qi, L.; Ma, X. Machine learning approaches for rice seedling growth stages detection. Front. Plant Sci. 2022, 13, 914771. [Google Scholar] [CrossRef]
  17. Wang, H.; Chang, W.; Yao, Y.; Yao, Z.; Zhao, Y.; Li, S.; Liu, Z.; Zhang, X. Cropformer: A new generalized deep learning classification approach for multi-scenario crop classification. Front. Plant Sci. 2023, 14, 1130659. [Google Scholar] [CrossRef]
  18. Worth, L.; Rodgers, M.; Reardon, A. Butterhead Lettuce—Butterhead Lettuce Variety Performance Trial in in a Hydroponic NFT System. 2022. Available online: https://docs.lib.purdue.edu/cgi/viewcontent.cgi?article=1237&context=mwvtr (accessed on 25 May 2025).
  19. Schwartz, P.A.; Anderson, T.S.; Timmons, M.B. Predictive equations for butterhead lettuce (Lactuca sativa, cv. flandria) root surface area grown in aquaponic conditions. Horticulturae 2019, 5, 39. [Google Scholar] [CrossRef]
  20. Alejandrino, J.; Concepcion, R.; Lauguico, S.; Tobias, R.R.; Almero, V.J.; Puno, J.C.; Bandala, A.; Dadios, E.; Flores, R. Visual classification of lettuce growth stage based on morphological attributes using unsupervised machine learning models. In Proceedings of the 2020 IEEE REGION 10 CONFERENCE (TENCON), Osaka, Japan, 16–19 November 2020; IEEE: Piscataway, NL, USA, 2020. [Google Scholar]
  21. Seri’Aisyah, H. Pattern Recognition of Lettuce Varieties with Machine Learning; University of Malaya: Kuala Lumpur, Malaysia, 2019. [Google Scholar]
  22. Pang, S.; Thio, T.H.G.; Siaw, F.L.; Chen, M.; Xia, Y. Research on Improved Image Segmentation Algorithm Based on GrabCut. Electronics 2024, 13, 4068. [Google Scholar] [CrossRef]
  23. Satti, S.K.; Devi K, S.; Srinivasan, P. Recognizing the Indian Cautionary Traffic Signs using GAN, Improved Mask R-CNN, and Grab Cut. Concurr. Comput. Pract. Exp. 2023, 35, e7453. [Google Scholar] [CrossRef]
  24. Hernández-Vela, A.; Reyes, M.; Ponce, V.; Escalera, S. Grabcut-based human segmentation in video sequences. Sensors 2012, 12, 15376–15393. [Google Scholar] [CrossRef]
  25. Huang, X.; Wang, S.; Gao, X.; Luo, D.; Xu, W.; Pang, H.; Zhou, M. An H-grabcut image segmentation algorithm for indoor pedestrian background removal. Sensors 2023, 23, 7937. [Google Scholar] [CrossRef]
  26. Sreya John, D.P. Integration of automated grabcut algorithm with DeepLabv3+ to enhance image segmentation for accurate leaf disease detection and classification. J. Theor. Appl. Inf. Technol. 2024, 102, 7203–7215. [Google Scholar]
  27. Athani, S.; Athani, S. Identification of Different Food Grains by Extracting Colour and Structural Features using Image Segmentation Techniques. Indian J. Sci. Technol. 2017, 10, 1–7. [Google Scholar] [CrossRef]
  28. Liu, X.; Aldrich, C. Deep learning approaches to image texture analysis in material processing. Metals 2022, 12, 355. [Google Scholar] [CrossRef]
  29. Lee, K.; Yi, S.; Hyun, S.; Kim, C. Review on the recent welding research with application of CNN-based deep learning part I: Models and applications. J. Weld. Join. 2021, 39, 10–19. [Google Scholar] [CrossRef]
  30. Sistaninejhad, B.; Rasi, H.; Nayeri, P. A review paper about deep learning for medical image analysis. Comput. Math. Methods Med. 2023, 2023, 7091301. [Google Scholar] [CrossRef]
  31. Liu, J.; Wu, C.H.; Wang, Y.; Xu, Q.; Zhou, Y.; Huang, H.; Wang, C.; Cai, S.; Ding, Y.; Fan, H.; et al. Learning raw image denoising with bayer pattern unification and bayer preserving augmentation. In Proceedings of the IEEE/CVF Conference on Computer Vision and Pattern Recognition Workshops, Long Beach, CA, USA, 15–20 June 2019. [Google Scholar]
  32. Lauguico, S.C.; Concepcion, R.S.; Alejandrino, J.D.; Tobias, R.R.; Macasaet, D.D.; Dadios, E.P. A comparative analysis of machine learning algorithms modeled from machine vision-based lettuce growth stage classification in smart aquaponics. Int. J. Environ. Sci. Dev. 2020, 11, 442–449. [Google Scholar] [CrossRef]
  33. Chiu, M.T.; Xu, X.; Wei, Y.; Huang, Z.; Schwing, A.G.; Brunner, R.; Shi, H. Agriculture-vision: A large aerial image database for agricultural pattern analysis. In Proceedings of the IEEE/CVF Conference on Computer Vision and Pattern Recognition, Seattle, WA, USA, 13–19 June 2020; pp. 2828–2838. [Google Scholar]
  34. Peng, Y.; Wang, Y. An industrial-grade solution for agricultural image classification tasks. Comput. Electron. Agric. 2021, 187, 106253. [Google Scholar] [CrossRef]
  35. Zhang, Z.; Lu, Y.; Yang, M.; Wang, G.; Zhao, Y.; Hu, Y. Optimal training strategy for high-performance detection model of multi-cultivar tea shoots based on deep learning methods. Sci. Hortic. 2024, 328, 112949. [Google Scholar] [CrossRef]
  36. Barman, R.; Deshpande, S.; Agarwal, S.; Inamdar, U.; Devare, M.; Patil, A. Transfer learning for small dataset. In Proceedings of the National Conference on Machine Learning, Long Beach, CA, USA, 9–15 June 2019; Amity University Mumbai: Maharashtra, India, 2019; Volume 26. [Google Scholar]
  37. Mukti, I.Z.; Biswas, D. Transfer learning based plant diseases detection using ResNet50. In Proceedings of the 2019 4th International Conference on Electrical Information and Communication Technology, Khulna, Bangladesh, 20–22 December 2019; IEEE: Piscataway, NL, USA, 2019; pp. 1–6. [Google Scholar]
  38. Sarku, E.; Steele, J.; Ruffin, T.; Gokaraju, B.; Karimodini, A. Reducing data costs—Transfer learning based traffic sign classification approach. In Proceedings of the SoutheastCon 2021, Atlanta, GA, USA, 10–13 March 2021; IEEE: Piscataway, NL, USA, 2021; pp. 1–5. [Google Scholar]
  39. Masters, D.; Luschi, C. Revisiting small batch training for deep neural networks. arXiv 2018, arXiv:1804.07612. [Google Scholar]
  40. Bengio, Y. Practical recommendations for gradient-based training of deep architectures. In Neural Networks: Tricks of the Trade, 2nd ed.; Springer: Berlin/Heidelberg, Germany, 2012. [Google Scholar]
  41. Lewkowycz, A. How to decay your learning rate. arXiv 2021, arXiv:2103.12682. [Google Scholar]
  42. Gang, M.S.; Kim, H.J.; Kim, D.W. Estimation of greenhouse lettuce growth indices based on a two-stage CNN using RGB-D images. Sensors 2022, 22, 5499. [Google Scholar] [CrossRef] [PubMed]
Figure 1. Environment (a), data acquisition system (b), and cameras on the rail (c) for unstructured data collection in an industrial plant factory.
Applsci 15 06278 g001
Figure 2. Photographs of the same crop across growth stages 1 to 3 obtained using two methods: original images and images preprocessed with GrabCut–Watershed.
Applsci 15 06278 g002
Figure 3. Workflow of the CNN-based growth stage classification model for butterhead lettuce using transfer learning and cross-domain evaluation. The top section (outlined in red) illustrates the fine-tuning process of a pre-trained feature extractor with a new classifier for growth stage classification. The bottom section (outlined in green) represents the cross-domain evaluation, where Model 1 and Model 2 are tested on different datasets to analyze their generalization performance across original and GrabCut–Watershed preprocessed images.
Applsci 15 06278 g003
Figure 4. Changes in training and validation loss and accuracy across epochs. Model 1: Test results on original images for the model trained on original images. Model 2: Test results on GrabCut–Watershed images for the model trained on GrabCut–Watershed.
Applsci 15 06278 g004
Figure 5. Confusion matrices for the growth stage classification models under four training-testing scenarios: (a) Model 1 (trained and tested on original images), (b) Model 2 (trained and tested on GrabCut-Watershed preprocessed images), (c) Model 1-CDE (cross-domain evaluation: trained on original images, tested on preprocessed images), and (d) Model 2-CDE (cross-domain evaluation: trained on preprocessed images, tested on original images).
Applsci 15 06278 g005
Figure 6. Grad-CAM visualizations for representative test images under training–testing scenarios: (a) Model 1; (b) Model 2; (c) Model 1-CDE (Model 1 under cross-domain evaluation); (d) Model 2-CDE (Model 2 under cross-domain evaluation). The heatmaps indicate regions contributing to the model’s prediction, where red represents higher activation (stronger attention) and blue represents lower activation.
Applsci 15 06278 g006
Table 1. Dataset used in this study.
ItemDetails
Original Images (Total)TotalStage1Stage 2Stage 3
476163160153
GrabCut Preprocessed
Images (Total)
TotalStage1Stage 2Stage 3
445139171135
Learning RateTrain–Validation–TestBatch SizeEpochInitial Learning Rate
6:2:232100.01
The total number of
Augmented Images
(Train–Validation–Test)
Original ImagesGrabCut–Watershed Images
1428
(856:285:287)
1335
(801:267:267)
Learning Rate SchedulingStep decay: reduce by a factor of 10 every 3 epochs
ModelPre-trained ResNet50 with Fine-Tuning applied
Table 2. Performance summary of four models under different training and test image settings.
ModelInference Time Per Image (s)Best EpochTest LossTest
Accuracy (%)
Domain
Model 10.05510th0.00099.65Same
Model 20.0374th0.00397.75Same
Model 1-CDE
(Cross-Domain Evaluation)
0.0409th0.01782.77Cross
Model 2-CDE
(Cross-Domain Evaluation)
0.0536th2.93134.15Cross
Table 3. Performance metrics of models across different training and evaluation scenarios.
ModelWeeksPrecisionRecallF1-ScoreThe Number of Samples
Model 1Week11.0001.0001.00093
Week21.0000.9910.995106
Week30.9891.0000.99488
Model 2Week11.0000.9770.98887
Week20.9710.9710.971102
Week30.9620.9870.97578
Model 1-CDE
(Cross-Domain Evaluation)
Week10.7501.0000.85787
Week20.9000.6430.75098
Week30.8770.8660.87182
Model 2-CDE
(Cross-Domain Evaluation)
Week10.0000.0000.000103
Week20.0000.0000.00086
Week30.3431.0000.51098
Disclaimer/Publisher’s Note: The statements, opinions and data contained in all publications are solely those of the individual author(s) and contributor(s) and not of MDPI and/or the editor(s). MDPI and/or the editor(s) disclaim responsibility for any injury to people or property resulting from any ideas, methods, instructions or products referred to in the content.

