1. Introduction
Inflammatory demyelinating diseases (IDDs), including multiple sclerosis (MS) and neuromyelitis optica spectrum disorder (NMOSD), affect the central nervous system (CNS) through myelin damage [
1]. Beyond motor and sensory symptoms, cognitive dysfunction affects approximately 40–65% of MS patients and 30–54% of NMOSD patients, manifesting as impaired processing speed, attention, executive function, and memory [
2,
3]. This cognitive decline progresses independently of physical disability and significantly impacts quality of life [
4].
Neuropsychological evaluation is essential for assessing cognitive function in IDDs, but no consensus exists on the instruments to use. The available tools range from brief screeners such as the Montreal Cognitive Assessment (MoCA) and Mini-Mental State Examination (MMSE) to disease-specific batteries—the Brief International Cognitive Assessment for MS (BICAMS), Minimal Assessment of Cognitive Function in MS (MACFIMS), and Brief Repeatable Battery–Neuropsychology (BRB-N)—and individual tests such as the Symbol Digit Modalities Test (SDMT) and the Paced Auditory Serial Addition Test (PASAT) [
5,
6].
The MoCA detects mild impairments with a higher sensitivity than that of the MMSE (90% vs. 18%) but exhibits 1–2-point practice effects, ceiling effects in educated participants, and up to 1.4-point differences between in-person and telehealth administration [
7,
8,
9,
10]; the SDMT is often cited as the single most sensitive test in MS [
11], but its performance also depends on memory, lexical access, and visual–motor speed, and scores improve upon repeat testing [
12,
13]; and the PASAT provokes stress, limiting its routine use [
14]. Comprehensive batteries require 45–90 min with trained personnel [
15], and paper-based scoring is subject to inter-rater variability [
16].
These limitations—time burden, rater-dependent scoring, practice effects, and patient stress—motivate automated digital alternatives such as handwriting analytics, with a millisecond resolution and automatic scoring. From a computational standpoint, IDD handwriting presents unique challenges—subtle motor–cognitive deficits manifest in fragmented-velocity (MS) or variable-acceleration (NMOSD) signatures—requiring high-precision temporal features and algorithms capable of modeling non-linear, high-dimensional, small-sample data.
Digital handwriting analyses offer unique advantages for cognitive assessments in neurological disorders by capturing millisecond-precision temporal, spatial, and kinematic parameters unavailable in the traditional assessments [
17]. Because handwriting engages the frontoparietal and cerebellar circuits, frequently affected by demyelination, it is particularly relevant for IDD patients [
18]. Digital versions of the SDMT show high test–retest reliability (with an intraclass correlation coefficient (ICC) > 0.85) when completed unsupervised [
19], while kinematic features distinguish mild cognitive impairments from normal aging with >90% accuracy [
20]. MS patients exhibit distinctive handwriting patterns—longer movement durations and fragmented velocity profiles—that correlate with cognitive impairment even in minimally disabled individuals [
21,
22]. Deep learning models have achieved > 0.90 accuracy on digital clock drawings, and the thinking time between strokes can track executive performance when the final drawings appear normal [
23,
24]. These findings suggest that digital handwriting metrics can detect subtle cognitive–motor changes that escape traditional observation.
Despite these advances, most studies have examined a single drawing task rather than integrating information across multiple cognitive demands [
25]. NMOSD, where up to 70% of patients show a slowed processing speed and which may present distinct cognitive–motor patterns compared to those in MS, has been largely ignored in digital handwriting research [
26]. Furthermore, while projective tasks like the House–Tree–Person drawing may provide insights into cognitive–affective integration, they have rarely been incorporated into digital analysis frameworks [
27].
To address these gaps, the present study implements a comprehensive nine-task protocol integrating the digital SDMT, standardized neuropsychological drawings, and House–Tree–Person projective sketches to capture complementary cognitive–motor dimensions; compares the handwriting dynamics between MS and NMOSD subgroups to identify disease-specific patterns; and develops a streamlined assessment protocol that maintains diagnostic accuracy while reducing the administration time by 35%. We hypothesize that this multi-domain integration will yield richer pathophysiological insights and improve the sensitivity of cognitive screening compared to that of single-task approaches.
2. Materials and Methods
2.1. The Study Design and Participants
This cross-sectional study was conducted at Beijing Tiantan Hospital, Capital Medical University. The study protocol was approved by the hospital’s Ethics Committee, and written informed consent was obtained from all participants.
Patients with IDDs (MS, NMOSD, and other IDDs) were recruited from the Neurology Department between January 2022 and December 2024, diagnosed according to the current international criteria. Physical disability was quantified using the Expanded Disability Status Scale (EDSS), rating neurological impairment from 0 (normal) to 10 (death) based on eight functional systems in the CNS [
28]. To minimize confounding by severe motor/visual deficits, we only included patients with EDSS scores < 6.5 and visual-function EDSS scores < 3.
Exclusion criteria included the following:
The use of psychotropic medications or other drugs that could affect cognitive function;
The presence of severe psychiatric disorders as assessed by clinical experts;
A history of traumatic brain injury or stroke;
Other neurological disorders that could impact cognitive performance;
An inability to complete the cognitive assessment protocol.
All participants underwent a one-time assessment session lasting approximately 60 min. At enrollment, we recorded detailed medication history including drug names, start/end dates, and the self-rated relief levels for both disease-modifying therapies and symptomatic treatments. To reduce acute pharmacological confounding, only patients on stable regimens (no dose changes or relapses ≥4 weeks before testing) were included.
Cognitive impairment was defined using the MoCA (Beijing version), with scores < 26 indicating impairment according to its original validation [
7] and subsequent application in neurological populations. Alternative thresholds have been proposed, including lower cutoffs (23/24) for better specificity [
29] and stratified thresholds based on age and education [
30]. However, our sample is relatively young (mean: 37.8 ± 10.5 years) and highly educated (72% ≥ 16 years; see Results
Section 3.1), with limited demographic variability. Based on these sample characteristics and to maintain consistency with most cognitive studies on IDDs [
31] and avoid demographic confounding, we retained the standard < 26 cutoff. Participants were accordingly classified into cognitively impaired (CI, MoCA < 26) and cognitively normal (CN, MoCA ≥ 26) groups.
Demographic information was collected, including age, gender, and years in education, for all participants.
2.2. The Cognitive Assessment and Task Protocol
2.2.1. The Neuropsychological Assessment
The participants completed a neuropsychological battery administered by trained neuropsychologists, including the following:
The Montreal Cognitive Assessment (MoCA-Beijing version): A validated screening tool for multiple cognitive domains, culturally adapted to Chinese populations [
32];
The Mini-Mental State Examination (MMSE): A widely used cognitive screening measure;
The Controlled Oral Word Association Test (COWAT): A test of verbal fluency and executive function;
The Symbol Digit Modalities Test (SDMT): Both paper (P-SDMT) and electronic (E-SDMT) versions were used to assess information processing speed;
The Paced Auditory Serial Addition Test (PASAT): This is used to evaluate working memory and attention;
The Hamilton Anxiety Scale (HAMA), the Hamilton Depression Scale (HAMD), and the Montgomery–Åsberg Depression Rating Scale (MADRS): These tools quantify the severity of anxiety and depression.
These tests were selected for their established sensitivity in detecting cognitive impairment in IDD patients, particularly deficits in information processing speed, executive function, and attention.
2.2.2. The Cognitive and Drawing Task Protocol
The handwriting battery consisted of nine tasks drawn from widely used neuropsychological instruments.
Table 1 summarizes the plain-language instructions and the principal cognitive domain addressed by each task; representative stroke images are shown in
Figure 1.
Table 1 summarizes the nine handwriting/drawing tasks; the key administration details are outlined below.
Task administration and rationale: The participants were provided standardized instructions before each task. Except for the SDMT (90 s), no time limits were imposed, allowing for natural expression while still capturing completion times. This nine-task battery samples the complementary cognitive and motor circuits for comprehensive handwriting biomarker extraction.
Paper and electronic versions of the SDMT: The SDMT was delivered in two counterbalanced modes to minimize practice effects: a paper version (P-SDMT) with full capture of the pen trajectory and an electronic version (E-SDMT) recording only response timestamps.
Standard drawing tasks: Standard tasks derived from the MMSE (sentence-writing, pentagon-copying) and the MoCA (cube-, clock-, and trail-making). All five were recorded using legacy firmware that stored time and length summaries but not the point-wise trajectories.
House–Tree–Person: The HTP test captured self-paced drawings, engaging motor planning and spatial construction. We analyzed only the quantitative kinematic traces, not the traditional qualitative content.
The raw pen trajectory and timestamp data were processed for feature extraction as described below.
2.3. Data Acquisition and Feature Extraction
The workflow consisted of three stages: data acquisition, task segmentation, and feature computation.
Data acquisition: All nine tasks were performed on a Wacom Bamboo Slate A4 smartpad. Using the Wacom Ink SDK [
35], we recorded the planar coordinates
(mean sampling rate: 200 Hz; range: 180–200 Hz), stylus pressure (1–1024), 5 ms timestamps, and event phases (Begin/Move/End).
Task segmentation: Each stroke inherits a task label provided by the recording interface. The results for the five drawing tasks (SE, CL, CU, CO, and PE) were recorded using legacy firmware that stored only stroke-level summaries; hence, the higher-order kinematic features could not be derived.
Feature computation: Extraction was implemented in Python 3.8 and produced the following domains:
- -
E-SDMT (9 features): From the response timestamps (esdmt_timestamps), we computed the interval timing statistics (mean, SD, median, IQR, min/max), acceleration patterns (first-/second-half ratio, linear slope), and variability (coefficient of variation);
- -
The P-SDMT and the HTP test (31 features each): From full pen streams (pressureList, timeList, inputPhase, xList, yList), we derived time features (total/air/paper time and ratios), length features (air/paper/total length and ratios), stroke statistics (count, length statistics), pressure features (mean, SD, extremes), kinematic features (velocity, acceleration, pauses), and coordination features (the pressure–velocity correlation);
- -
Legacy drawing tasks (13 features each): From the stroke summaries only, we computed time, length, stroke, and pressure metrics, plus efficiency ratios.
Finally, we appended three demographic covariates (gender, age, education_years) and nine clinical/scale scores (MMSE, COWAT, HAMA, HAMD, MADRS, PASAT, SDMT-D, P-SDMT total, disease label), yielding a total of 210 predictors.The MoCA-Beijing score was excluded from the predictor set to prevent label leakage, as it defined the CN/CI outcome.
The complete variable list: A spreadsheet containing all 210 predictor names and descriptions is provided as
Supplementary File S1 (Complete_Feature_List.xlsx).
Beyond standard timing and spatial statistics, we incorporated several higher-order metrics—such as the pressure–velocity correlation, the high-pressure/high-speed ratio, the acceleration change count, and detailed pause measures—that are less commonly applied in IDD handwriting analyses [
36]. Such features capture the fine-grained motor–cognitive coupling and enhance the sensitivity to early impairments.
2.4. Data Preprocessing
To ensure the data’s quality and reliability, we performed systematic pre-processing of our dataset. Features were categorized by their missing rates as low (<30%), medium (30–60%), or high (>60%). Rather than immediately eliminating features with moderate missing rates, we retained all features for initial statistical screening. This decision aimed to preserve potentially informative features during the early screening phase, before applying stricter inclusion thresholds in modeling.
For analyses requiring complete data, we employed multiple imputation by chained equations (MICE) [
37] with predictive mean matching [
38]. The imputation quality was assessed by comparing the pre- and post-imputation distributions, correlation structures, and statistical relationships with cognitive status, ensuring that the process did not significantly alter the underlying data patterns.
To address the class imbalance between the cognitively normal (CN) and cognitively impaired (CI) groups, we incorporated class weights into the modeling process, assigning weights proportional to the inverse class frequencies.
2.5. The Statistical Analysis
We employed a combination of non-parametric and correlation-based methods to analyze the relationships between handwriting features and cognitive function. Given the non-parametric nature of many dynamic handwriting features, we primarily utilized Spearman’s correlations and Wilcoxon’s rank-sum tests to robustly assess the relationships between these features and cognitive scores. Spearman’s correlation coefficients assessed the associations between each feature and MoCA scores, providing a continuous measure of their cognitive relevance. The Wilcoxon’s rank-sum tests compared the feature distributions between the cognitively normal and impaired groups.
To address multicollinearity, we identified highly correlated feature pairs (|r| > 0.8) and retained only the feature with stronger cognitive associations from each pair, minimizing redundant information while preserving the most cognitively relevant metrics.
For subgroup analyses, we separately evaluated the feature–cognition relationships in the MS and NMOSD patient cohorts. This approach enabled the identification of both shared cognitive biomarkers and disease-specific features that might reflect the different pathophysiological mechanisms underlying cognitive impairment in these distinct disease entities.
All statistical analyses and machine learning models were implemented using R version 4.4.2 (R Foundation for Statistical Computing, Vienna, Austria) and RStudio version 2024.12.1.
2.6. Feature Selection and Machine Learning Methods
Due to the relatively high feature-to-sample ratio (a classic “large p, small n” problem) [
39], we implemented a multi-stage feature selection strategy to reduce noise and identify the features most consistently associated with cognitive status.
2.6.1. Feature Selection
Our feature selection process comprised three sequential stages designed to maximize both the statistical reliability and clinical relevance:
First, we conducted a bootstrap stability analysis to evaluate the feature robustness across multiple resampled datasets [
40]. This involved generating 100 bootstrap samples, each using 70% of the original data, and recording the frequency with which features maintained statistical significance. Features were classified as high-stability (selected in ≥70% of bootstrap iterations), medium-stability (50–70%), or low-stability (<50%).
Second, we performed a disease-specific feature analysis by separately evaluating the feature–cognition relationships in the MS and NMOSD patient subgroups to identify both shared cognitive biomarkers and disease-specific features reflecting different pathophysiological mechanisms.
Finally, we employed an ensemble feature selection strategy integrating five complementary methods: (1) information gain; (2) recursive feature elimination with random forest (RFE); (3) Lasso regularization with cross-validated parameter tuning; (4) random forest feature importance measures; and (5) support vector machine recursive feature elimination (SVM-RFE). Features selected by at least two independent methods were designated as consensus features [
41].
The optimal feature subset size was determined through progressive feature addition, sequentially adding features based on their consensus importance ranking and evaluating the performance using 5-fold cross-validation with random forest classifiers.
2.6.2. Model Development
Following feature selection, we trained and compared four classifiers, each offering distinct advantages for handling high-dimensional, small-sample biomedical data:
Logistic regression (LR) with L2 regularization, selected as an interpretable baseline with well-studied coefficient estimates in clinical predictions [
42];
Random forest (RF), included for its robustness to noise and multicollinearity, native support for
scenarios, and built-in feature importance measures [
43];
The support vector machine (SVM–RBF), chosen for its strong performance with non-linear boundaries in high-dimensional, low-sample-size settings [
44];
Extreme gradient boosting (XGBoost), evaluated for its state-of-the-art accuracy on tabular biomedical data and built-in regularization to reduce overfitting [
45].
To address the class imbalance, we applied inverse class frequency weighting to improve the minority-class recognition [
46]. Hyperparameters were tuned through nested cross-validation (outer 5-fold for the generalization error; inner 5-fold for the model/parameter selection), using the AUC as the optimization objective, thus avoiding optimistic bias in the performance estimation [
47,
48].
Models were trained on both the full feature set and on predefined feature subgroups to assess the independent and combined predictive value of different handwriting domains and task types.
2.6.3. Performance Evaluation
We implemented a comprehensive performance evaluation framework using 5-fold cross-validation to ensure that the performance estimates were robust to any particular train/test split. The primary evaluation metric was the area under the receiver-operating characteristic curve (AUC), which quantifies a model’s ability to discriminate between cognitively normal and impaired individuals across all classification thresholds. We also reported the accuracy, balanced accuracy, sensitivity, specificity, precision, and F1-score to provide a detailed assessment. For each metric, 95% confidence intervals were estimated through bootstrap resampling (10,000 iterations) to assess statistical robustness. Confusion matrices were examined to characterize the classification outcomes in different patient subgroups.
To address disease heterogeneity, we adopted three complementary strategies. First, we quantified the distribution of the disease types (MS, NMOSD, and others) across the cognitive status groups and, where appropriate, included disease type as a covariate in our models. Second, we carried out subgroup analyses by disease type, developing separate classifiers for MS and NMOSD patients to identify both shared and disease-specific handwriting biomarkers. Finally, we performed sensitivity analyses by stratifying the validation folds by disease type to confirm that our findings were not driven by uneven disease distributions between cognitive groups.
3. Results
3.1. Demographic and Clinical Characteristics
A total of 93 patients with inflammatory demyelinating diseases (IDDs) participated in this study. After excluding 3 with missing MoCA scores, 90 patients remained for analysis.
The demographic and key clinical characteristics of the participants are summarized in
Table 2. Cognitive impairment (MoCA < 26) was detected in 34 (37.8%) participants, while 56 (62.2%) were classified as cognitively normal. Notably, the distributions of the disease types differed significantly between the cognitive status groups (
p = 0.006), with NMOSD being more prevalent in the CI group (58.8%) than in the CN group (25.0%). The complete neuropsychological test results and detailed demographic characteristics are presented in
Supplementary Table S1 (Detailed_Demographic_Results.png).
The distribution of the disease types differed significantly between cognitive status groups (
p = 0.006), with NMOSD being more prevalent in the CI group (58.8%) than in the CN group (25.0%). This suggests that NMOSD patients may be more susceptible to cognitive impairment than MS patients, which aligns with reports of high cognitive impairment rates in NMOSD (up to 69%) compared to those in MS (40–65%) cohorts [
49].
3.2. The Dynamic Handwriting Feature Analysis
3.2.1. An Overview of the Extracted Features
Through the analysis of the nine tasks, we extracted 210 dynamic handwriting features characterizing the temporal, spatial, pressure, and kinematic dimensions of psychomotor performance. The features were distributed across the E-SDMT response timestamps (9 features), P-SDMT handwriting dynamics (31 features), the House–Tree–Person test (93 features), and standard drawing tasks (65 features). The initial data quality assessment revealed good overall completeness of the data, with 50.5% of the features having low missing rates (<30%) and no features exceeding 60% missing data.
3.2.2. The E-SDMT Response Time Analysis
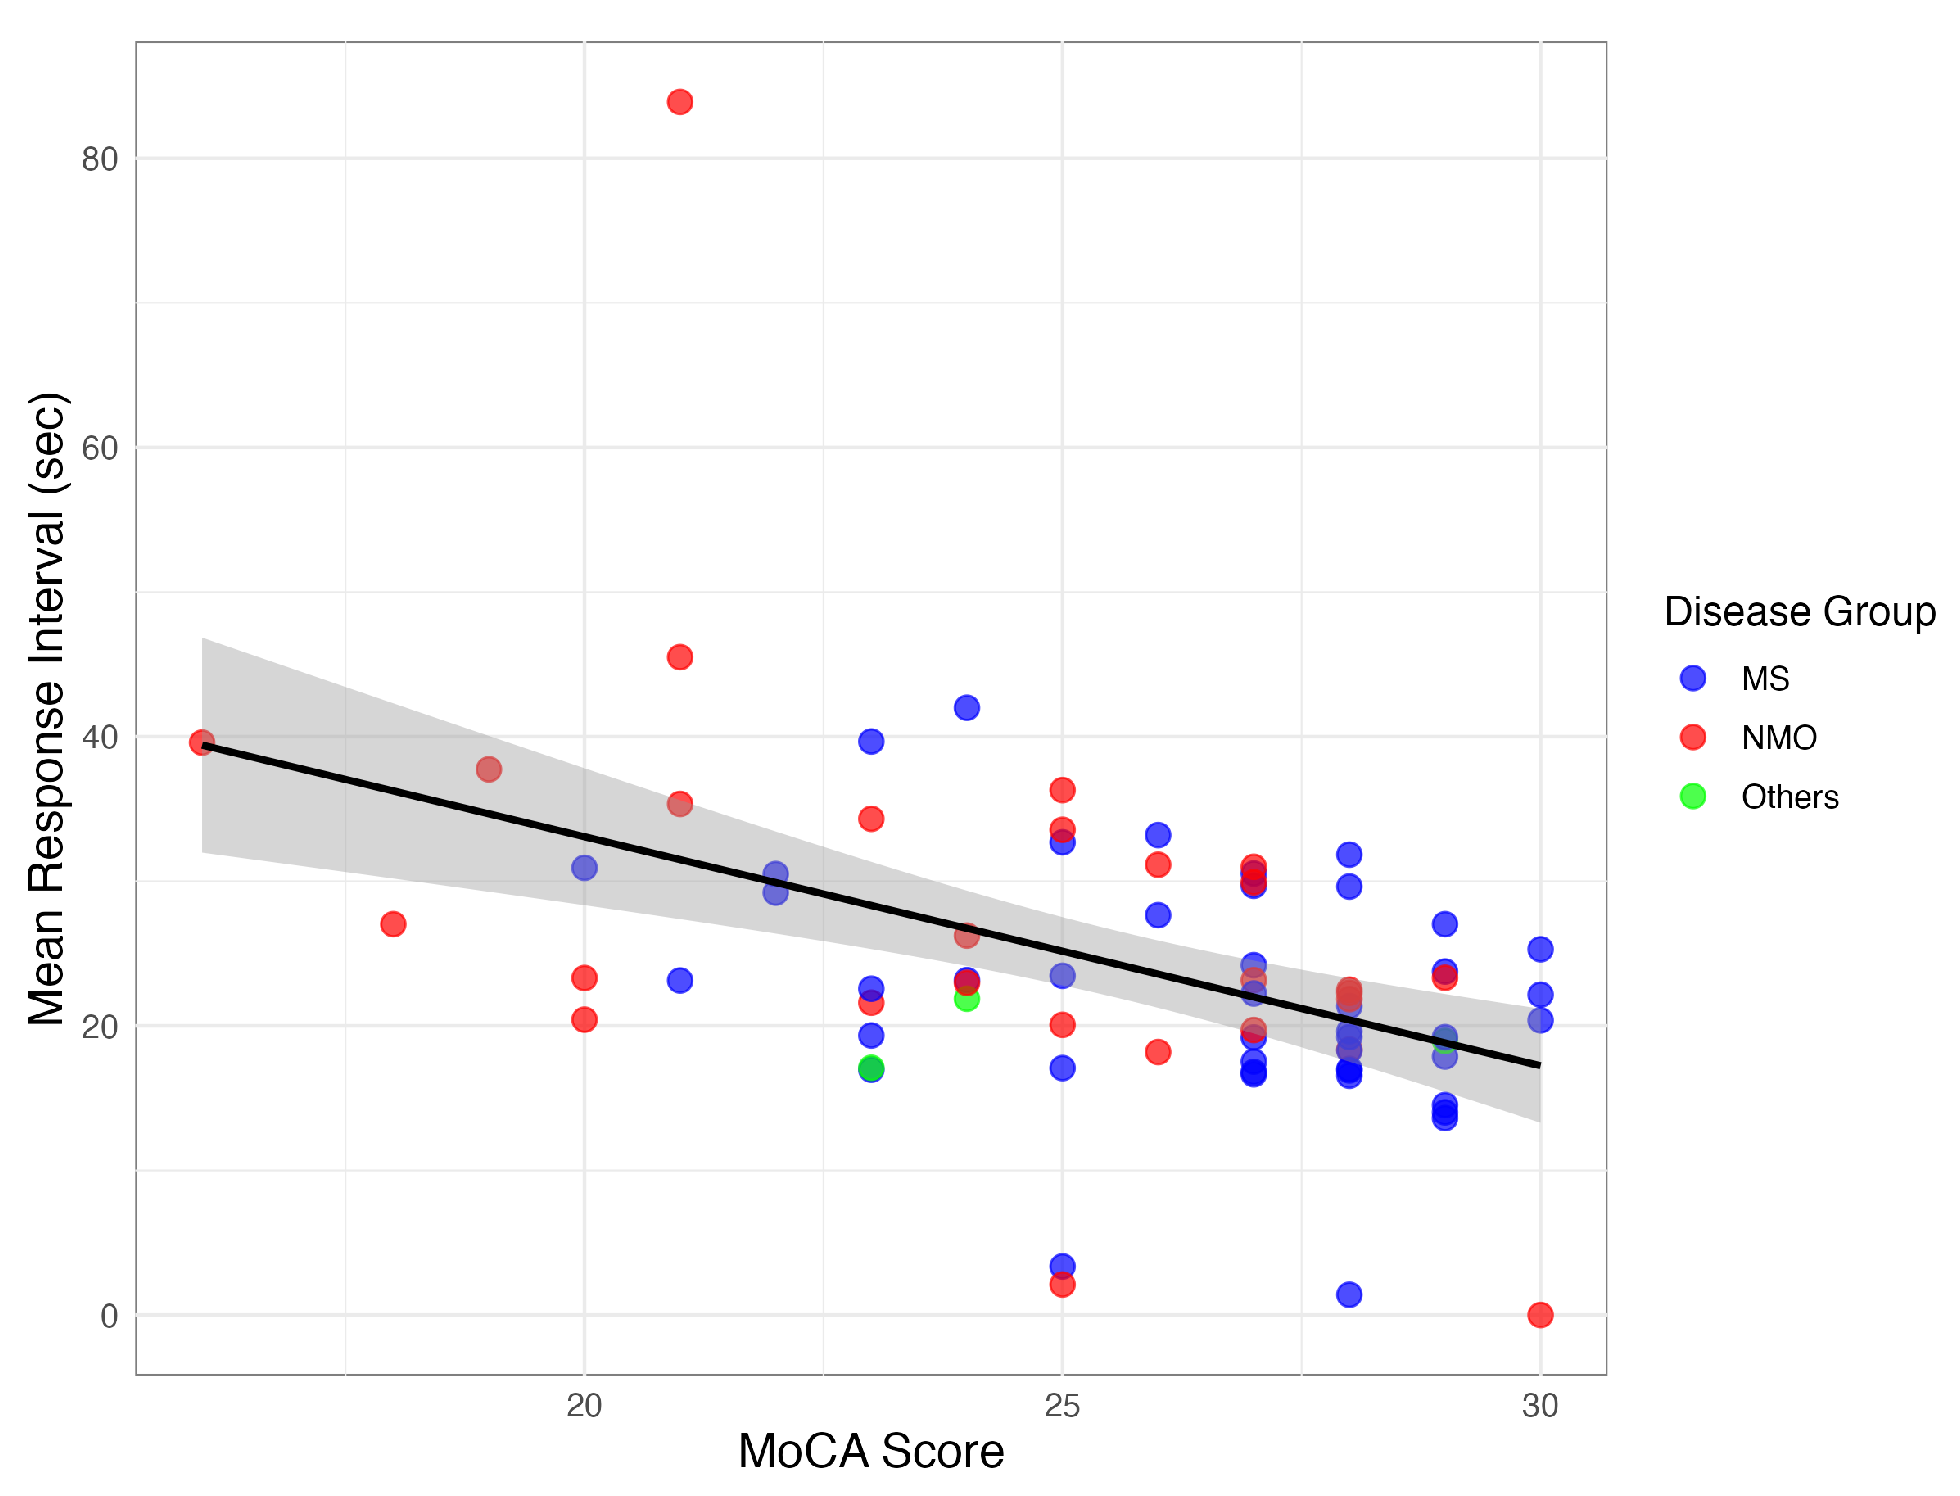
The E-SDMT response timing metrics demonstrated significant correlations with cognitive function. The mean response interval showed a strong negative correlation with the MoCA scores (, ), with the cognitively impaired (CI) patients exhibiting longer intervals (27.5 ± 14.1 s vs. 21.3 ± 6.7 s, ) and greater variability (SD: 13.6 ± 12.2 vs. 9.4 ± 4.8).
The response timing features also correlated with PASAT performance (, ), indicating these metrics captured the key aspects of information processing speed across different cognitive domains.
Figure 2 illustrates the consistent pattern of longer response intervals being associated with a lower cognitive performance across the IDD subtypes.
3.2.3. The P-SDMT Handwriting Dynamics
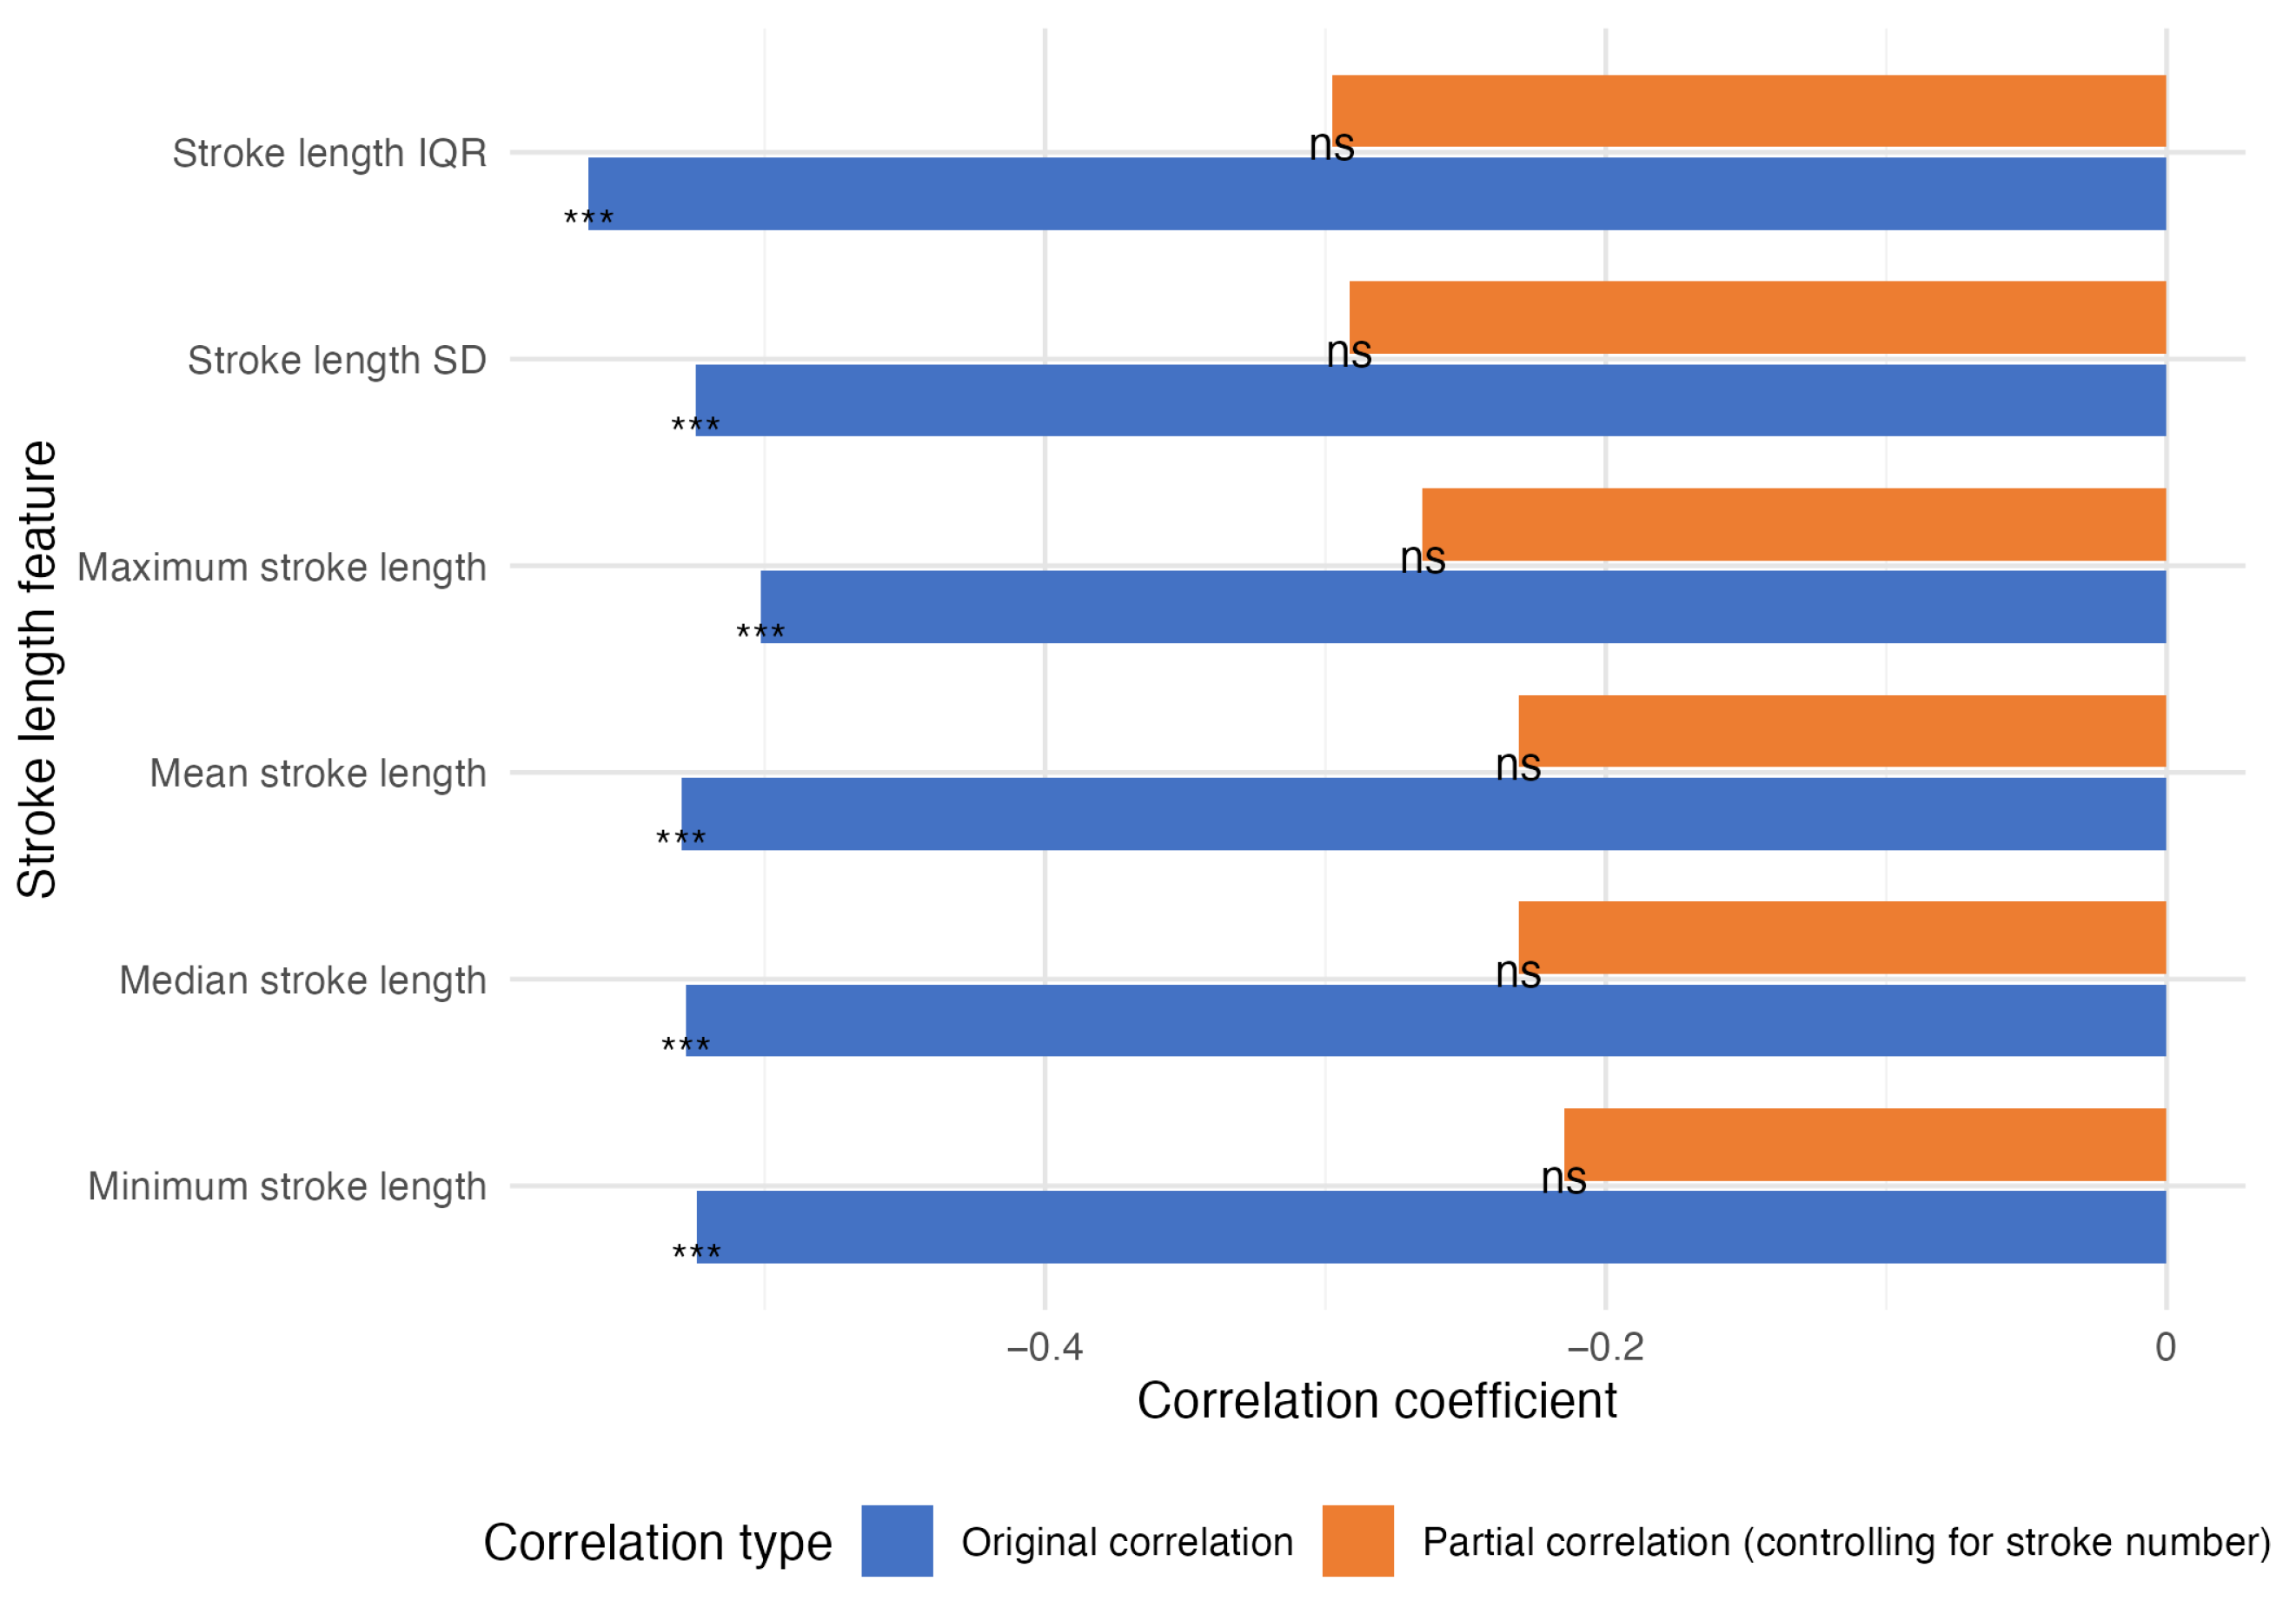
The analysis of the P-SDMT handwriting dynamics revealed stroke number as the strongest correlate of P-SDMT performance (, ). However, this reflects the inherent task structure, where higher completion rates generate more strokes.
All stroke length metrics significantly negatively correlated with P-SDMT scores ( to , all ) but showed no associations with MoCA scores (all ), suggesting specificity to information processing speed rather than general cognition.
A partial correlation analysis controlling for stroke number (
Figure 3) revealed that the stroke length metrics lost significance for the P-SDMT scores, indicating that stroke number explained ∼69% of the variance in the P-SDMT scores (adjusted
), with minimal additional information from other metrics.
The minimal correlation between stroke number and MoCA score (, ) further supports the task-specific nature of these relationships. These results demonstrate that P-SDMT handwriting dynamics primarily reflect completion rates rather than subtle motor–cognitive integration.
3.2.4. The Dynamic Drawing Feature Analysis
The analysis of handwriting features from multiple drawing tasks identified several patterns associated with cognitive function in IDD patients. Time-related features emerged as strong cognitive indicators, with pentagon total time (, ), cube-drawing time (, ), and pentagon paper contact time (, ) showing the strongest correlations with the MoCA scores.
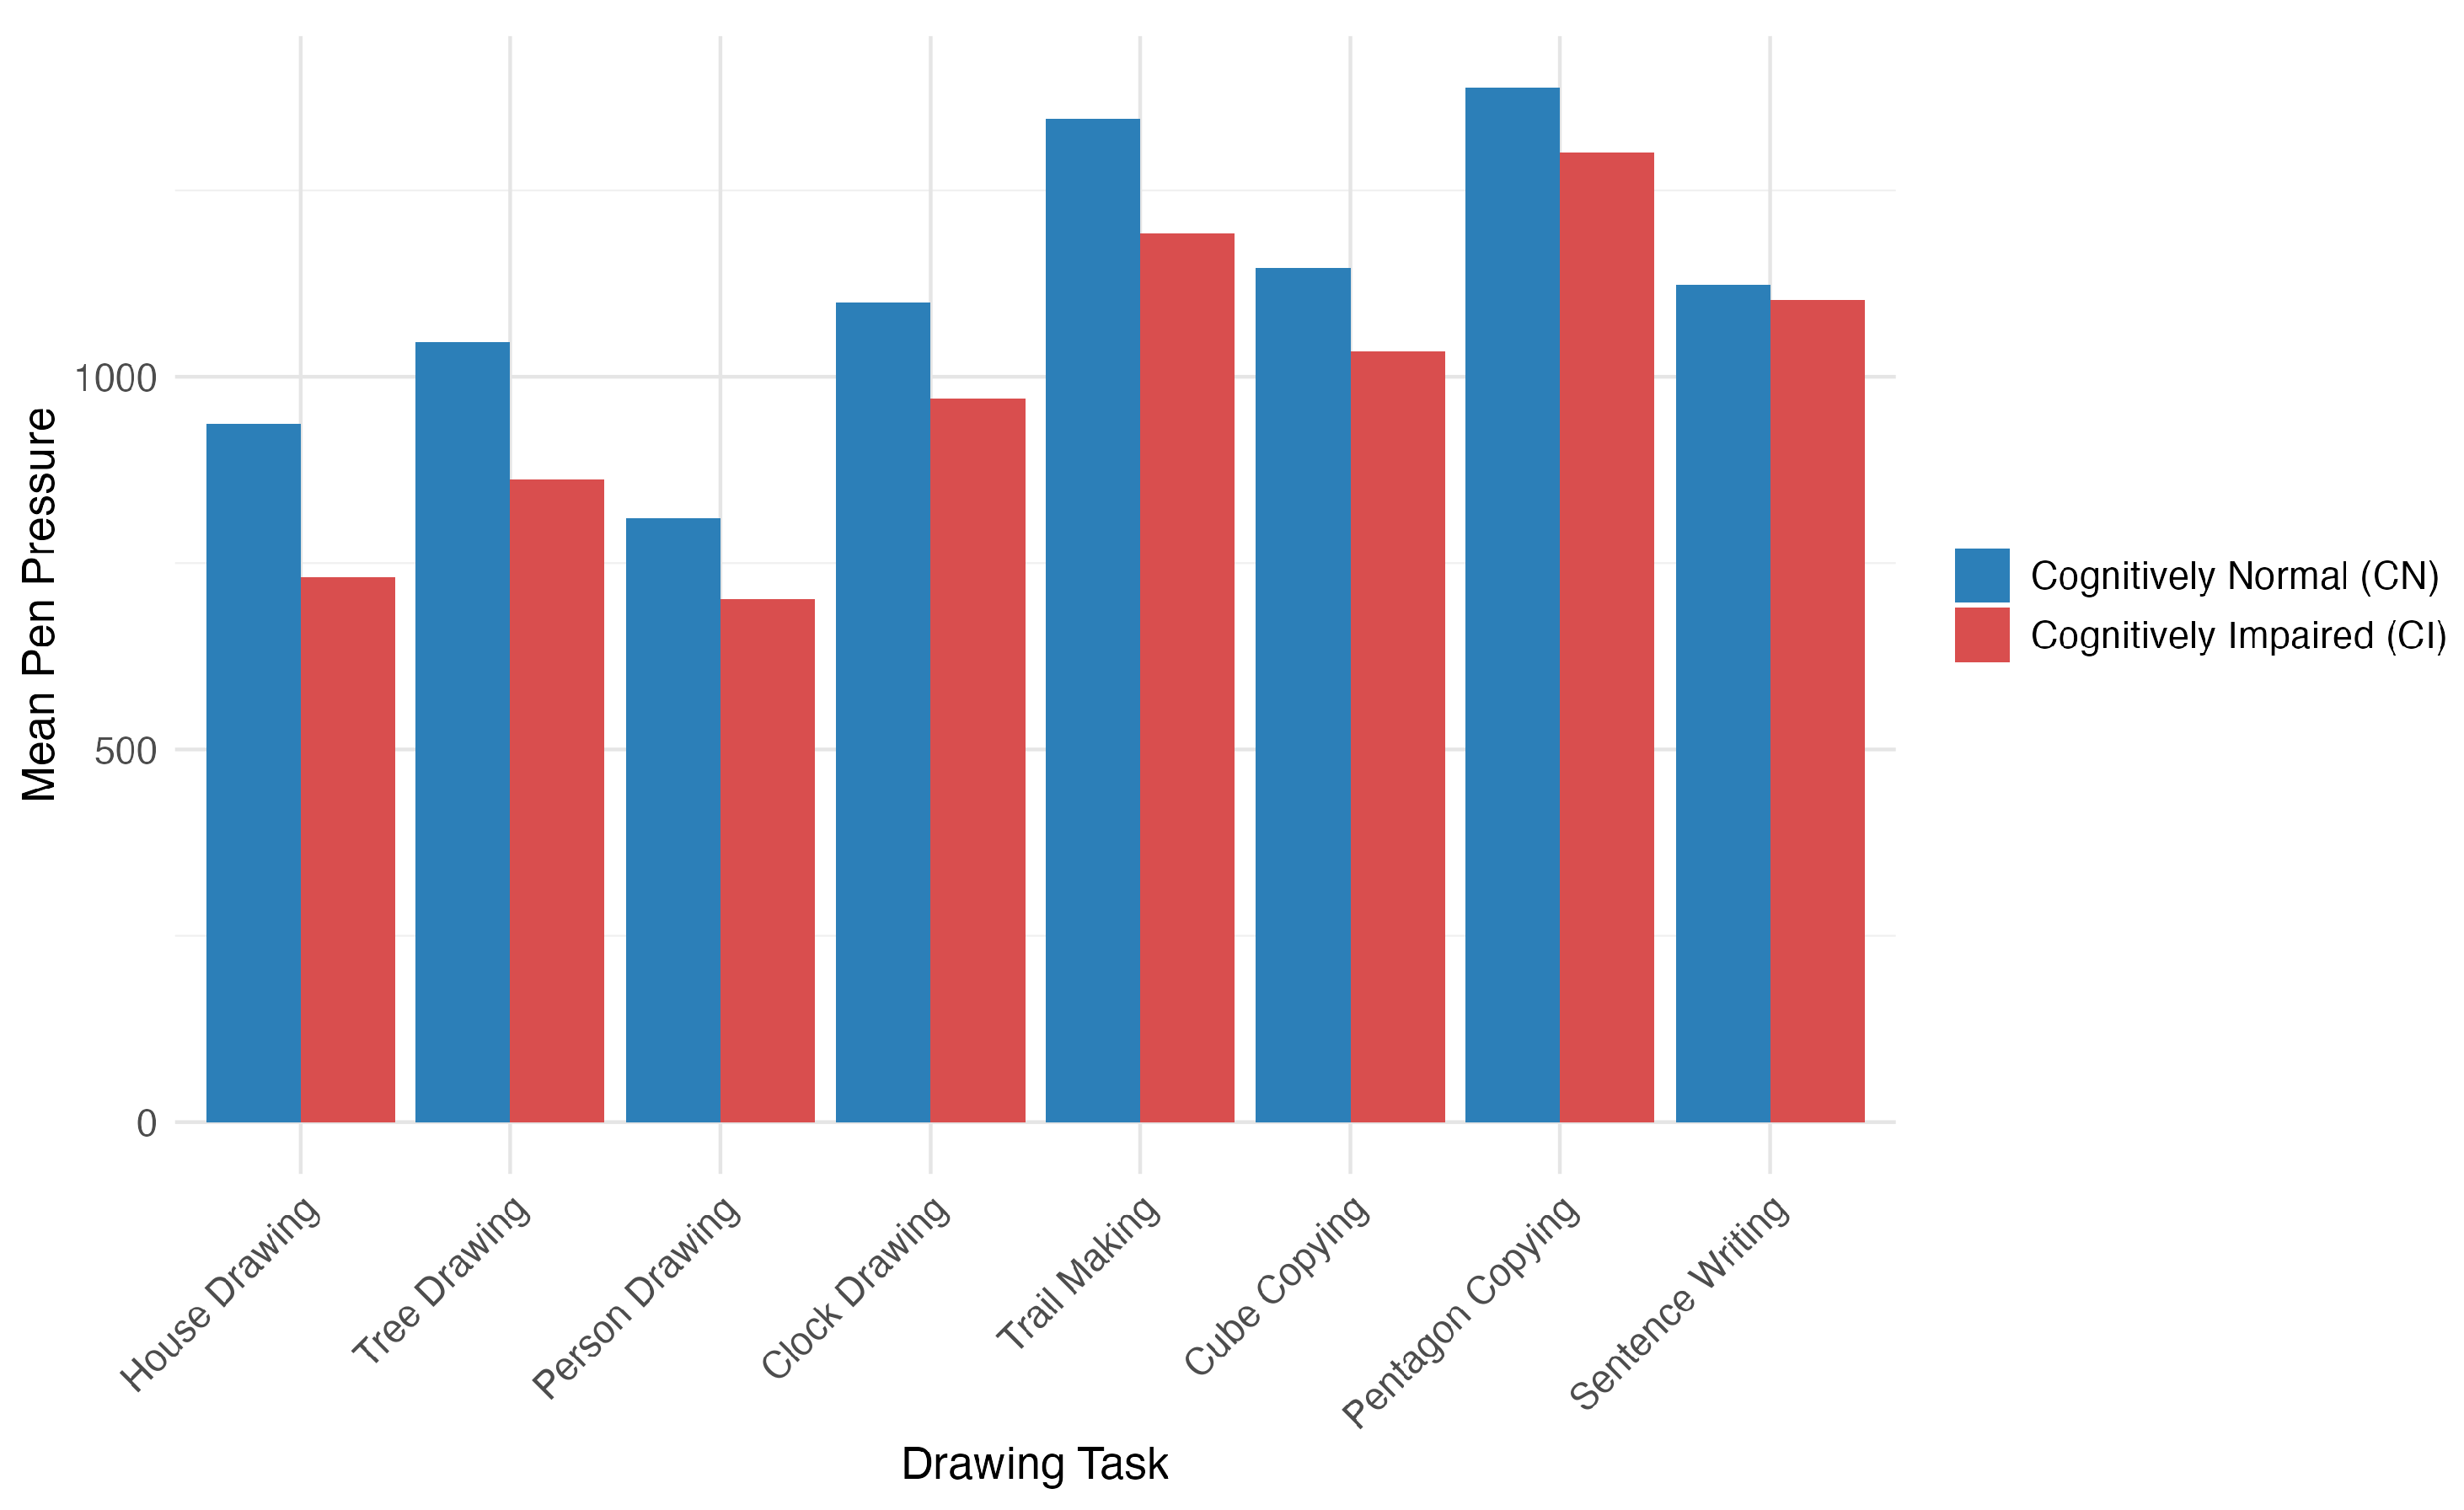
The House–Tree–Person test revealed pressure-related features as particularly informative biomarkers, with nine pressure characteristics significantly correlated with the MoCA scores. House-drawing showed the strongest cognitive associations, with maximum pen pressure (
,
), mean pressure (
,
), and median pressure (
,
) all being significantly related to cognitive function. Patients with cognitive impairment consistently demonstrated a lower pen pressure across all drawing tasks, with significant differences in house-drawing (1638.25 vs. 1846.55,
) (see
Figure 4).
Among the three HTP tasks, house-drawing provided the best discriminative power for cognitive assessments, showing stronger associations with the MoCA scores () compared to those for tree- () or person-drawing ().
The disease-specific analysis revealed 34 features with significant differences between the MS and NMOSD patients, with the NMOSD patients exhibiting greater variability in speed during the drawing tasks, while the MS patients demonstrated higher pen pressure values.
3.3. Feature Selection and Model Development
While the individual analyses revealed significant associations between handwriting features and cognitive function, advanced feature selection and machine learning methods were necessary to systematically identify the most robust predictive features and to optimize a model for clinical application.
3.3.1. Feature Selection Results
Our feature selection began with 210 handwriting dynamics features. Correlation screening against the MoCA scores identified 39 features (18.6%) with , and between-group tests flagged 31 features (14.8%) differing by cognitive status. After removing 86 highly correlated features (), 29 features remained for further modeling.
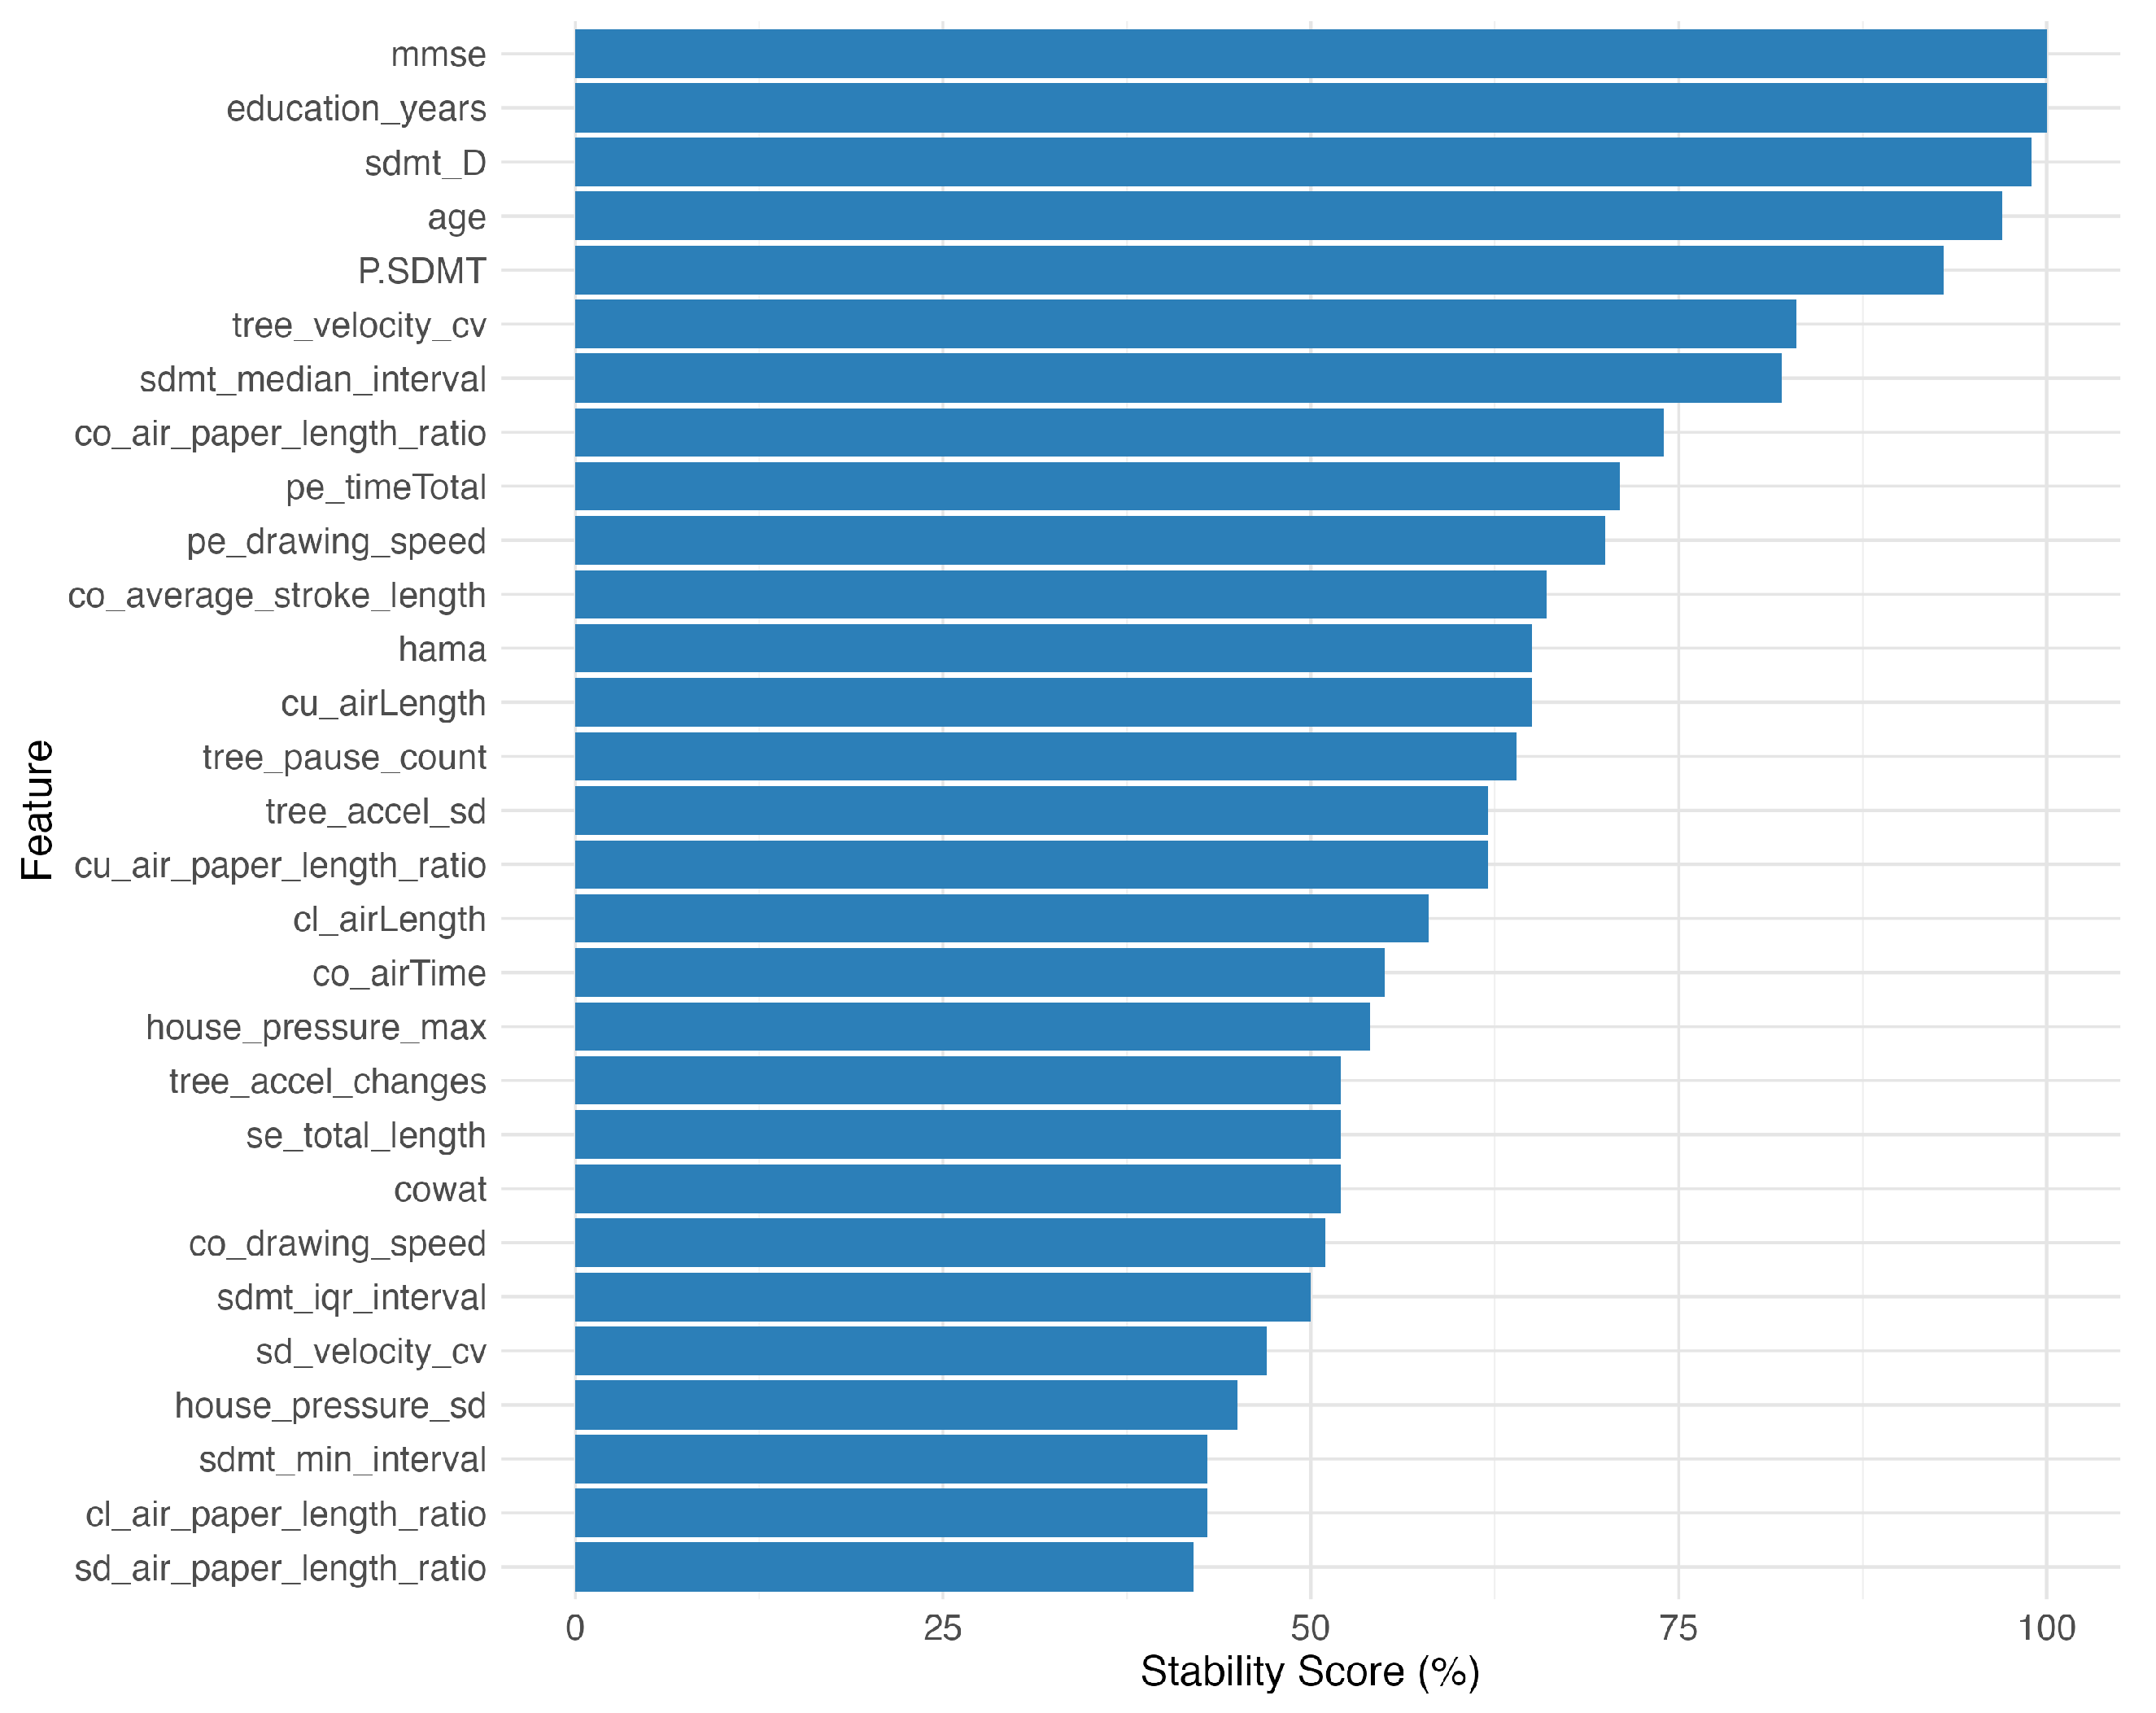
The bootstrap stability analysis using 100 resampled datasets revealed varying feature stability: 10 features (34.5%) showed high stability (≥70% selection frequency), 14 features (48.3%) medium stability (50–70%), and 5 features (17.2%) low stability (<50%). The most stable features included the traditional cognitive measures (the MMSE, years in education) and the SDMT performance metrics (
Figure 5).
The disease-specific analysis identified seven features that were significant in both MS and NMOSD patients, six features with MS-specific significance, and seven features with NMOSD-specific significance (
Figure 6), indicating both shared and disease-specific cognitive–motor integration patterns.
The ensemble of five methods—information gain, recursive feature elimination (RFE), Lasso, random forest importance, and SVM-RFE—returned six features that were unanimously selected: years in education, E-SDMT score, P-SDMT score, MMSE score, median response interval, and clock-drawing air length.
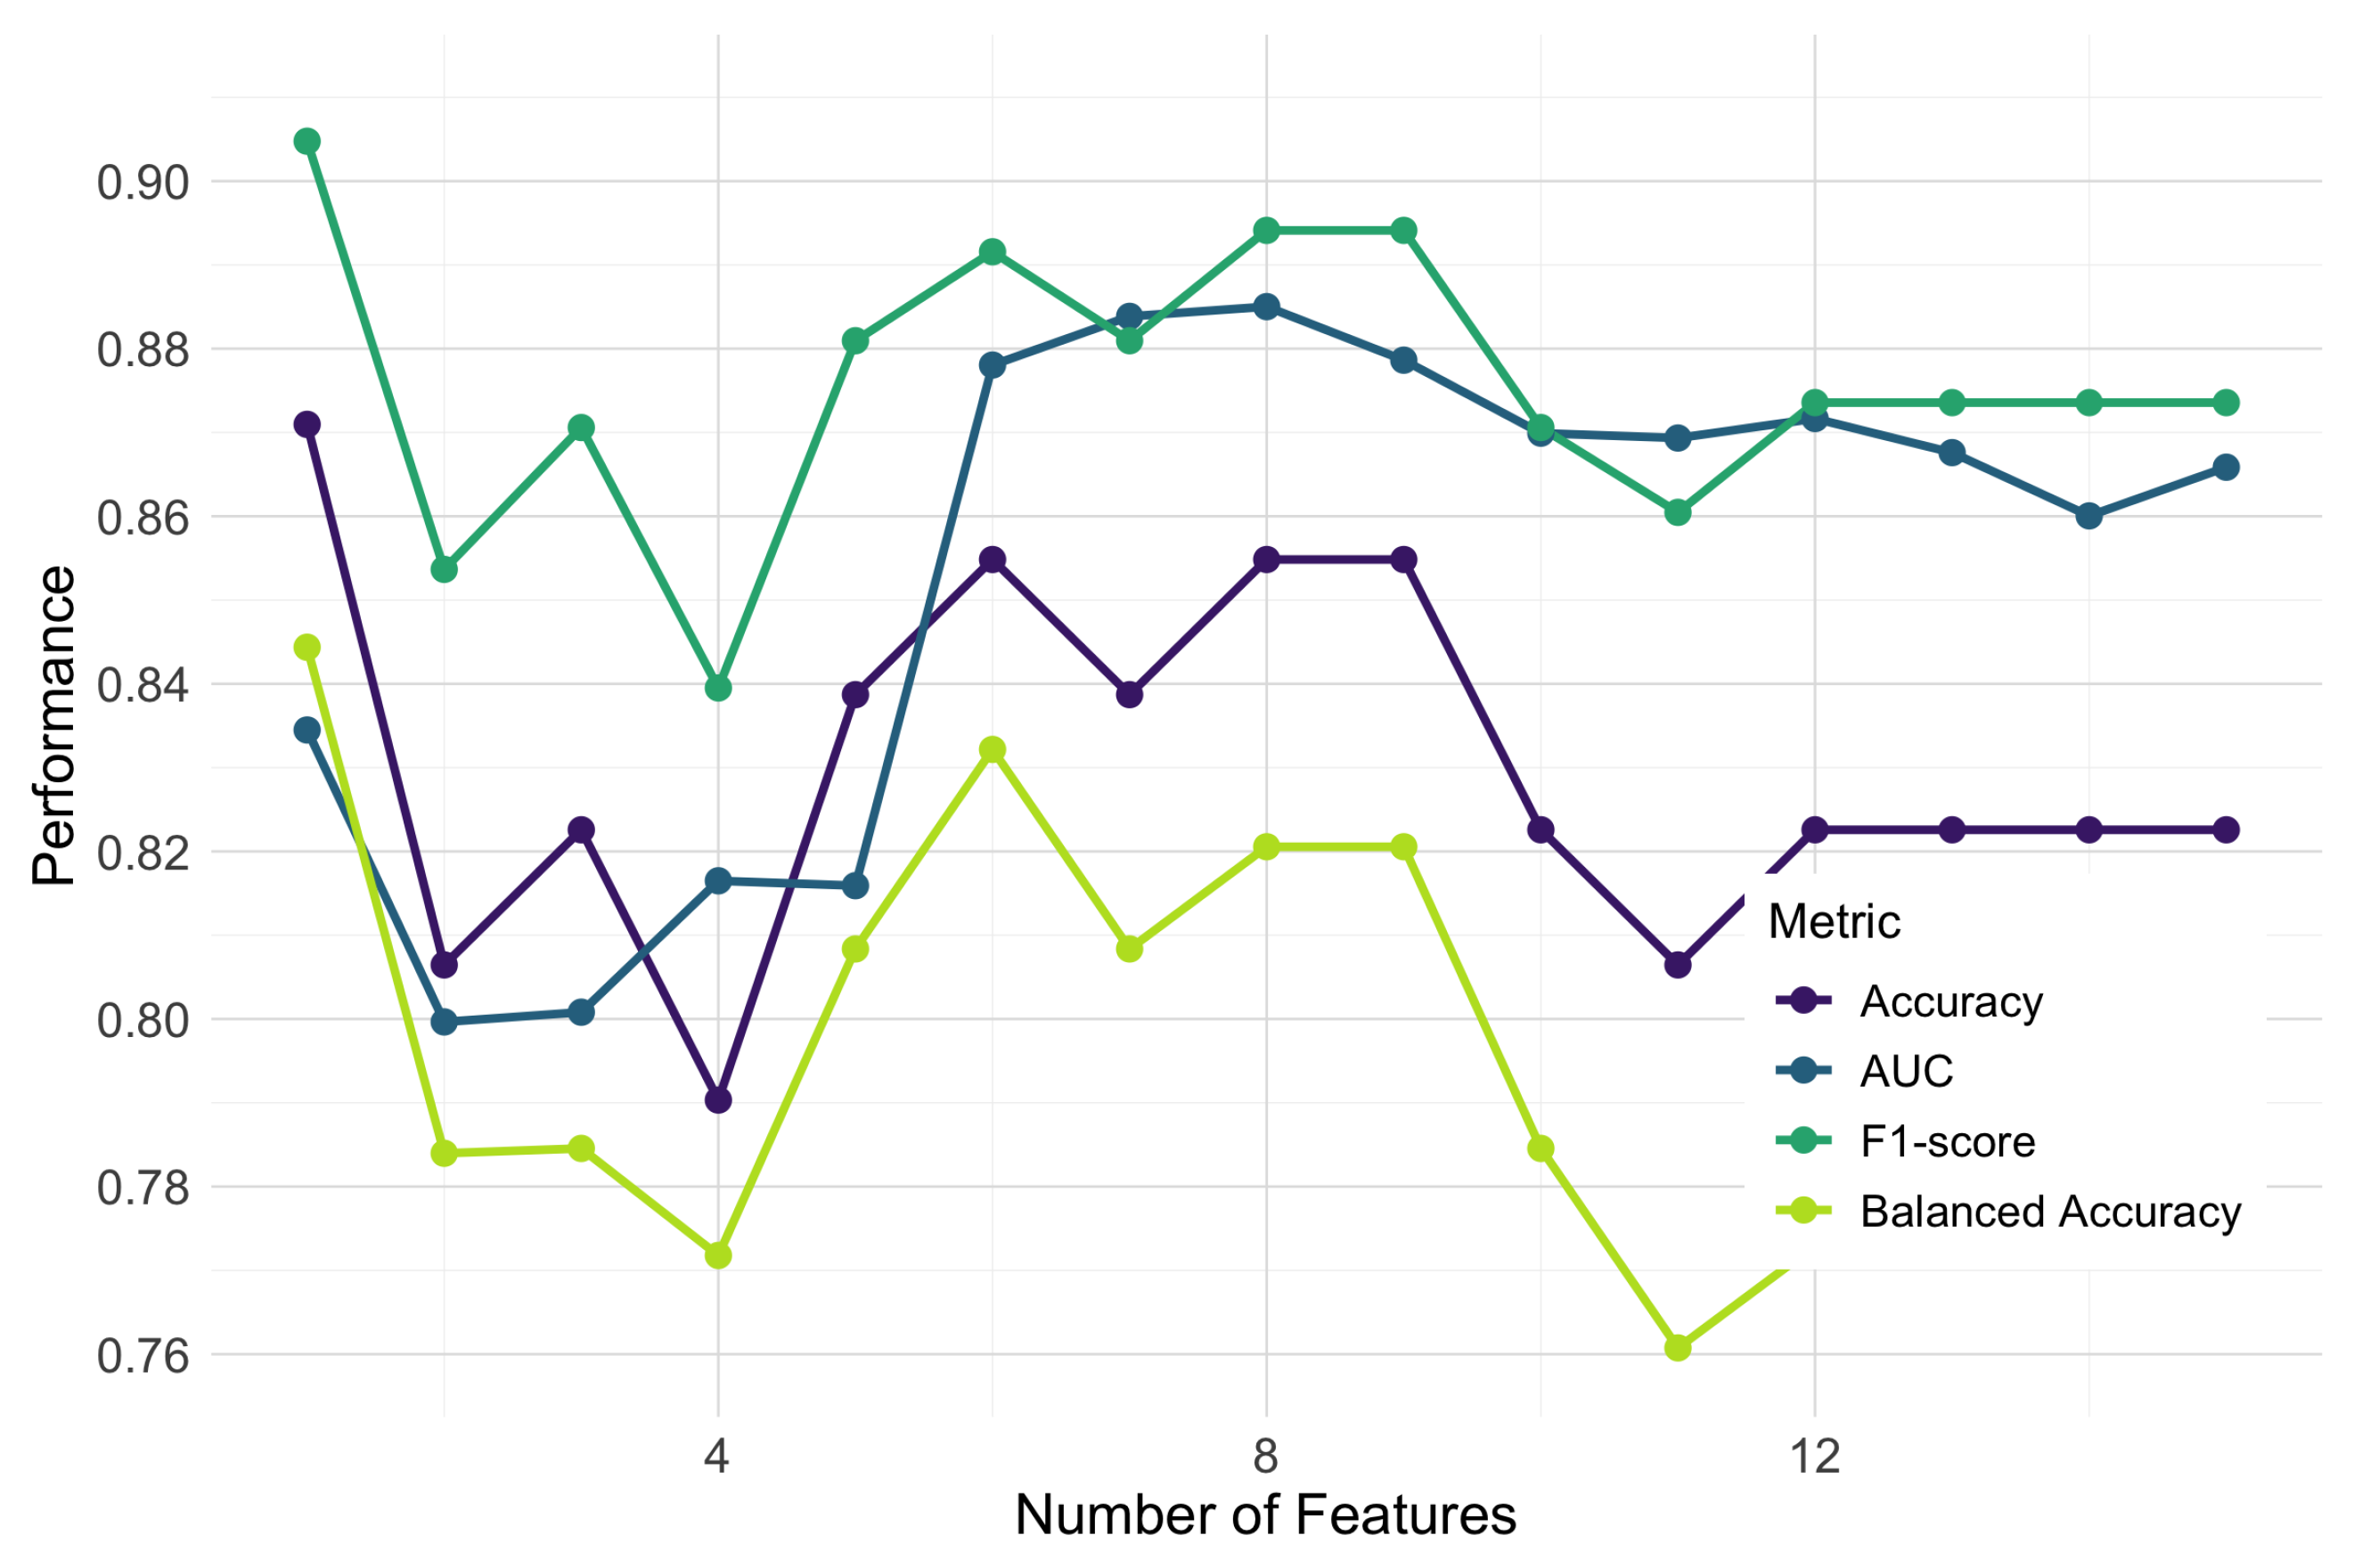
To determine the optimal feature subset size, we conducted a progressive feature addition analysis, sequentially incorporating features based on their consensus importance ranking and evaluating the performance using random forest classifiers with 5-fold cross-validation. We examined multiple performance metrics, including the AUC, F1-score, accuracy, and balanced accuracy, to ensure a comprehensive assessment of the classification performance. As shown in
Figure 7, the classification performance across all metrics improved substantially at up to eight features, after which point the gains diminished or the performance declined. The area under the ROC curve (AUC) peaked at 0.885 with eight features, while the F1-score reached its maximum value of approximately 0.89 in the same region. Although accuracy showed its highest value (0.871) with the first feature alone, it stabilized at around 0.855 with six to nine features, providing a more balanced performance when combined with other metrics.
Based on this multi-metric analysis, we identified an optimal subset of eight features: years in education, E-SDMT score, P-SDMT score, MMSE score, median response interval in E-SDMT, air length during clock-drawing, the coefficient of variation in the velocity during tree-drawing, and and the air-to-paper-length ratio in the trail-making task. Multiple metrics converged at this feature count, supporting the robustness of this selection. The final feature set included measures from four different drawing tasks, highlighting the unique contribution of different visuo-motor tasks to cognitive assessment (
Table 3).
3.3.2. The Performance of the Classification Model
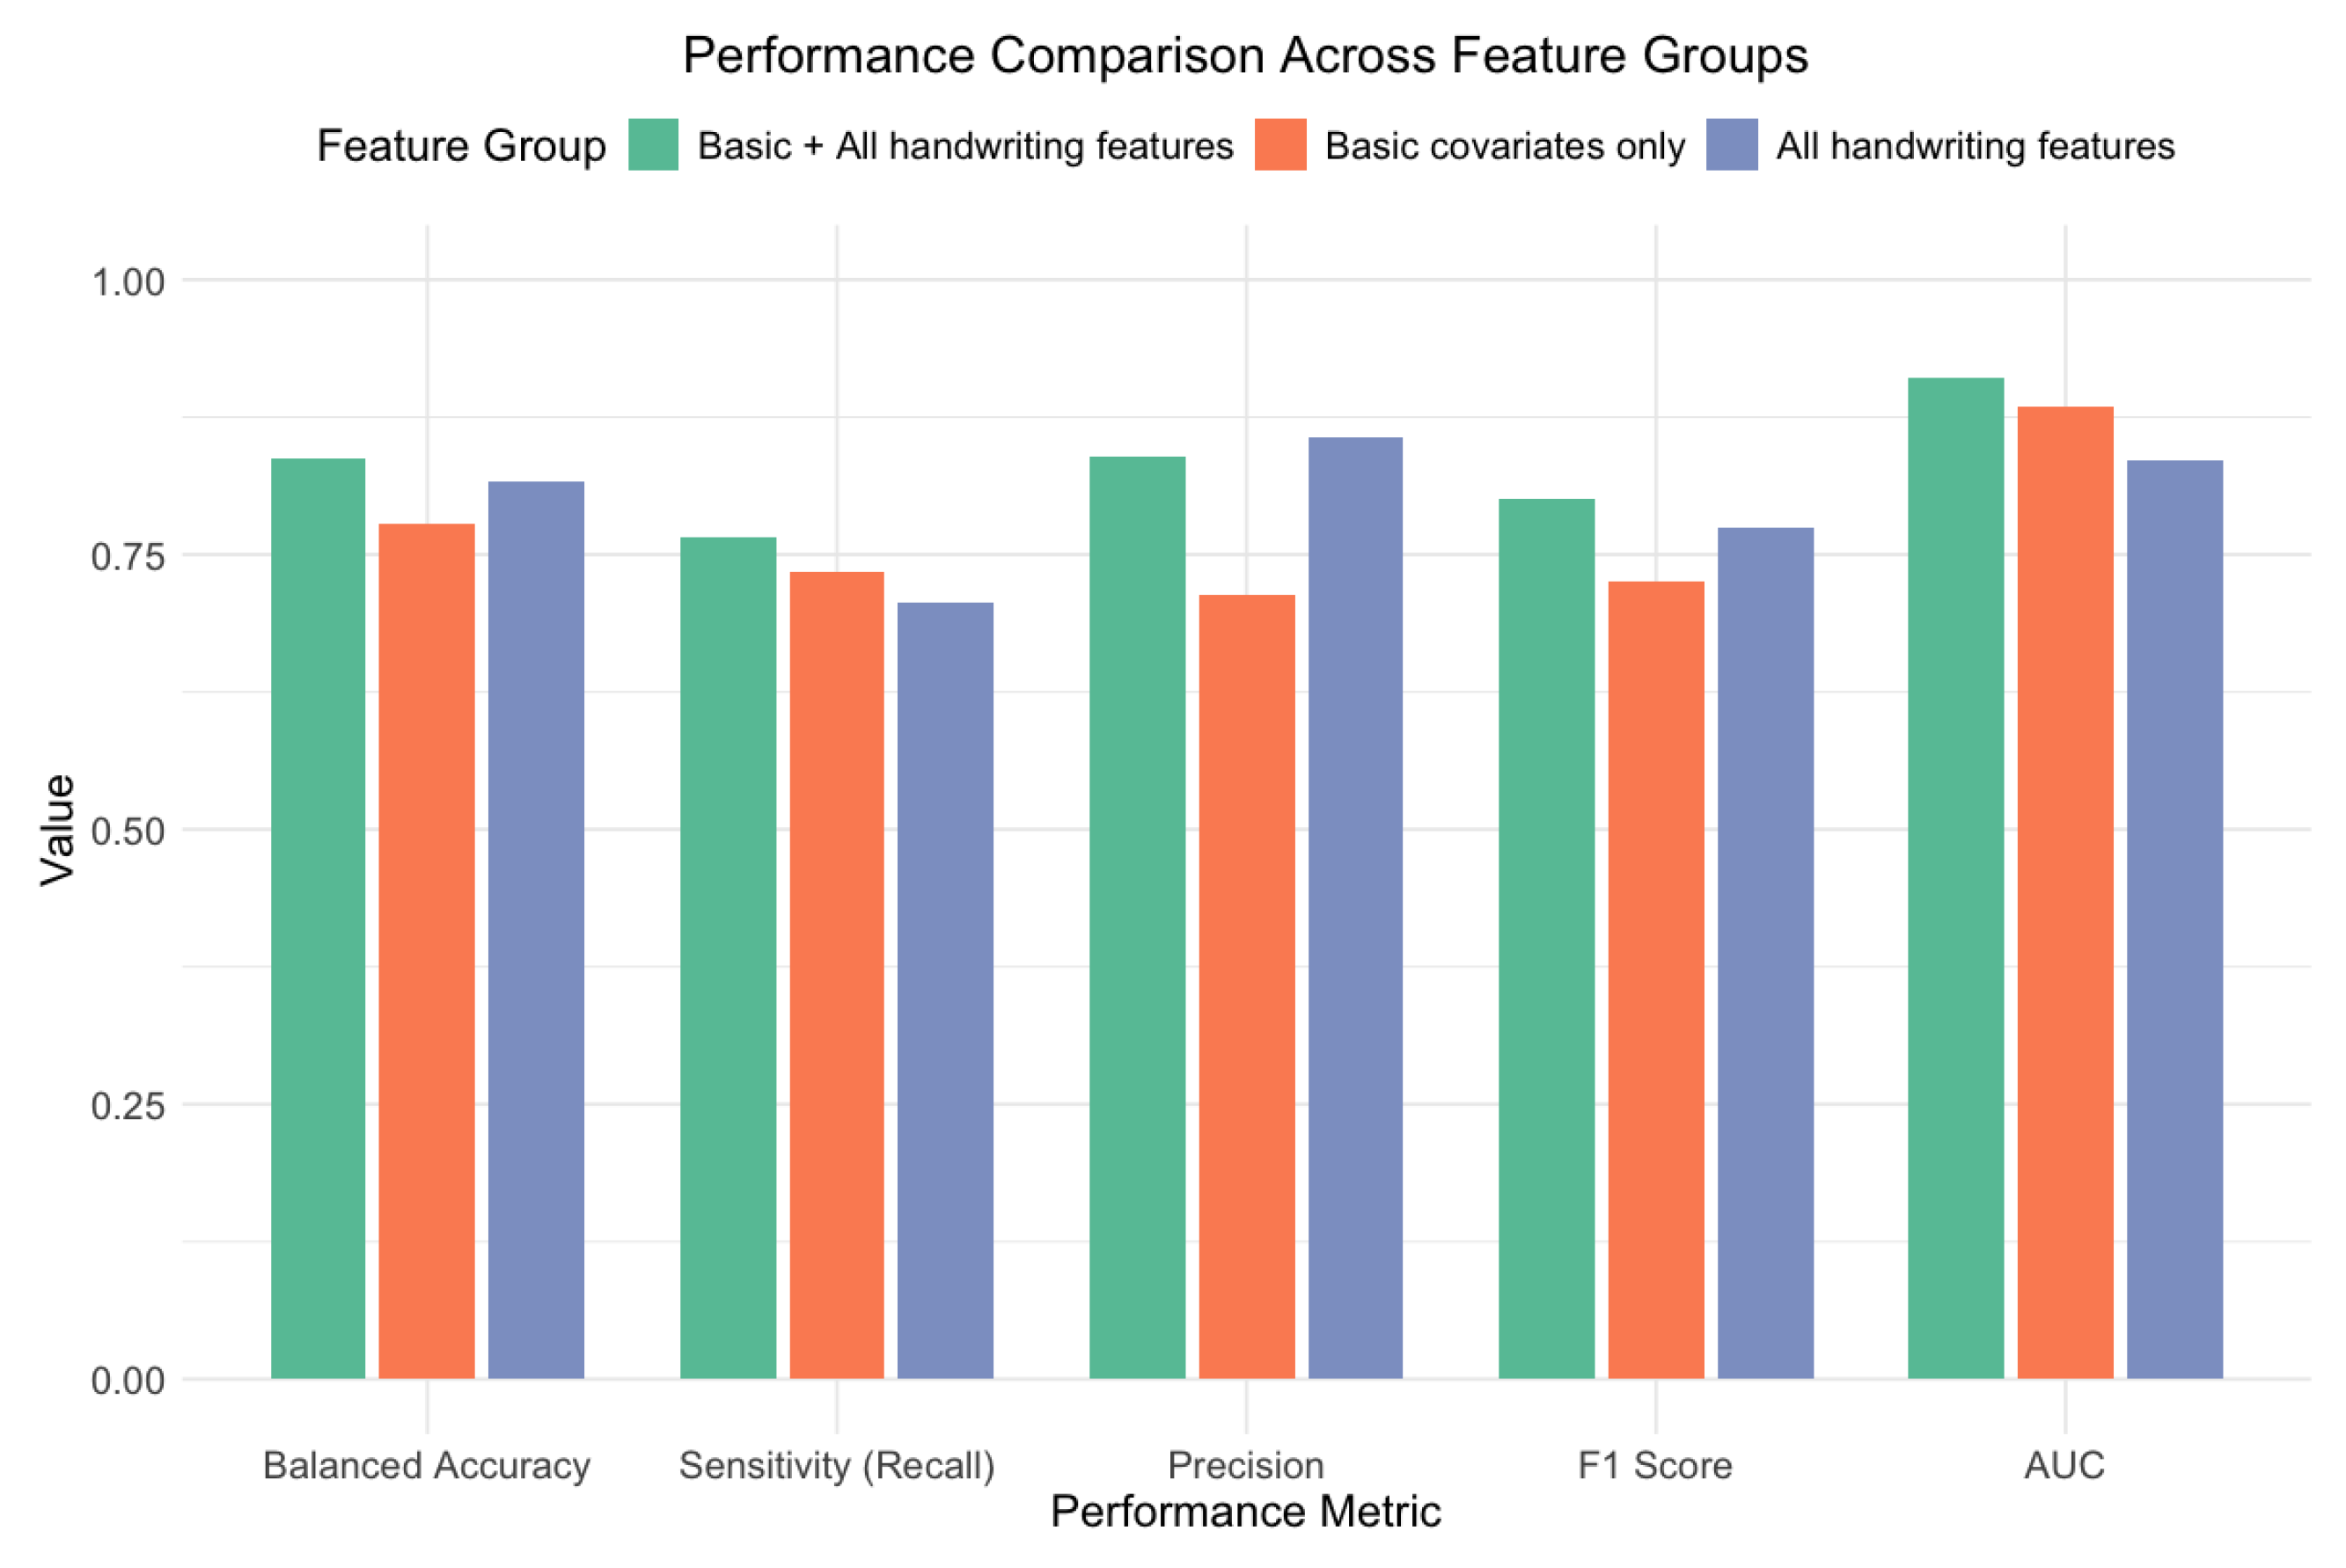
We trained four machine learning classifiers using 5-fold cross-validation with class weighting to evaluate different feature combinations. We compared three feature groupings: the basic covariates (years in education, MMSE, E-SDMT, P-SDMT scores), the handwriting dynamics (the median response interval, air length during clock-drawing, the CV in velocity during tree-drawing, and the air–paper ratio during trail-making), and the combined eight-feature set.
Table 4 presents comprehensive performance metrics, with the SVM-RBF model achieving the highest overall performance. Key metrics include an AUC = 0.910 (95% CI: 0.853–0.967) for the overall discrimination ability; a balanced accuracy = 0.838 (95% CI: 0.753–0.915) accounting for the class imbalance; and an F1-score = 0.800 (95% CI: 0.679–0.895), balancing precision and recall.
To understand the value of the handwriting features, we compared models trained on different feature subsets (
Figure 8). The combined model (with basic covariates plus handwriting features) outperformed both the model using basic covariates alone and the model using only handwriting features. Adding handwriting features to the basic covariates improved the performance across all metrics, with notable increases in the AUC (from 0.884 [95% CI: 0.817–0.952] to 0.910 [95% CI: 0.853–0.967]), balanced accuracy (from 0.778 [95% CI: 0.684–0.867] to 0.838 [95% CI: 0.753–0.915]), and precision (from 0.714 [95% CI: 0.537–0.854] to 0.839 [95% CI: 0.663–0.945]).
When analyzing each feature group independently, the traditional cognitive measures (years in education and MMSE and SDMT scores) provided a strong baseline performance (AUC = 0.884; 95% CI: 0.817–0.952). However, the handwriting dynamics features also demonstrated substantial discriminative ability on their own (AUC = 0.835; 95% CI: 0.756–0.914), suggesting that they captured important aspects of cognitive function that complemented the traditional assessments.
Figure 9 shows the confusion matrix for the best-performing SVM-RBF model. The model correctly classified 26 of 34 cognitive impairment cases (76.5% sensitivity) and 51 of 56 cognitively normal cases (91.1% specificity), demonstrating a good performance across both classes despite the class imbalance in our dataset.
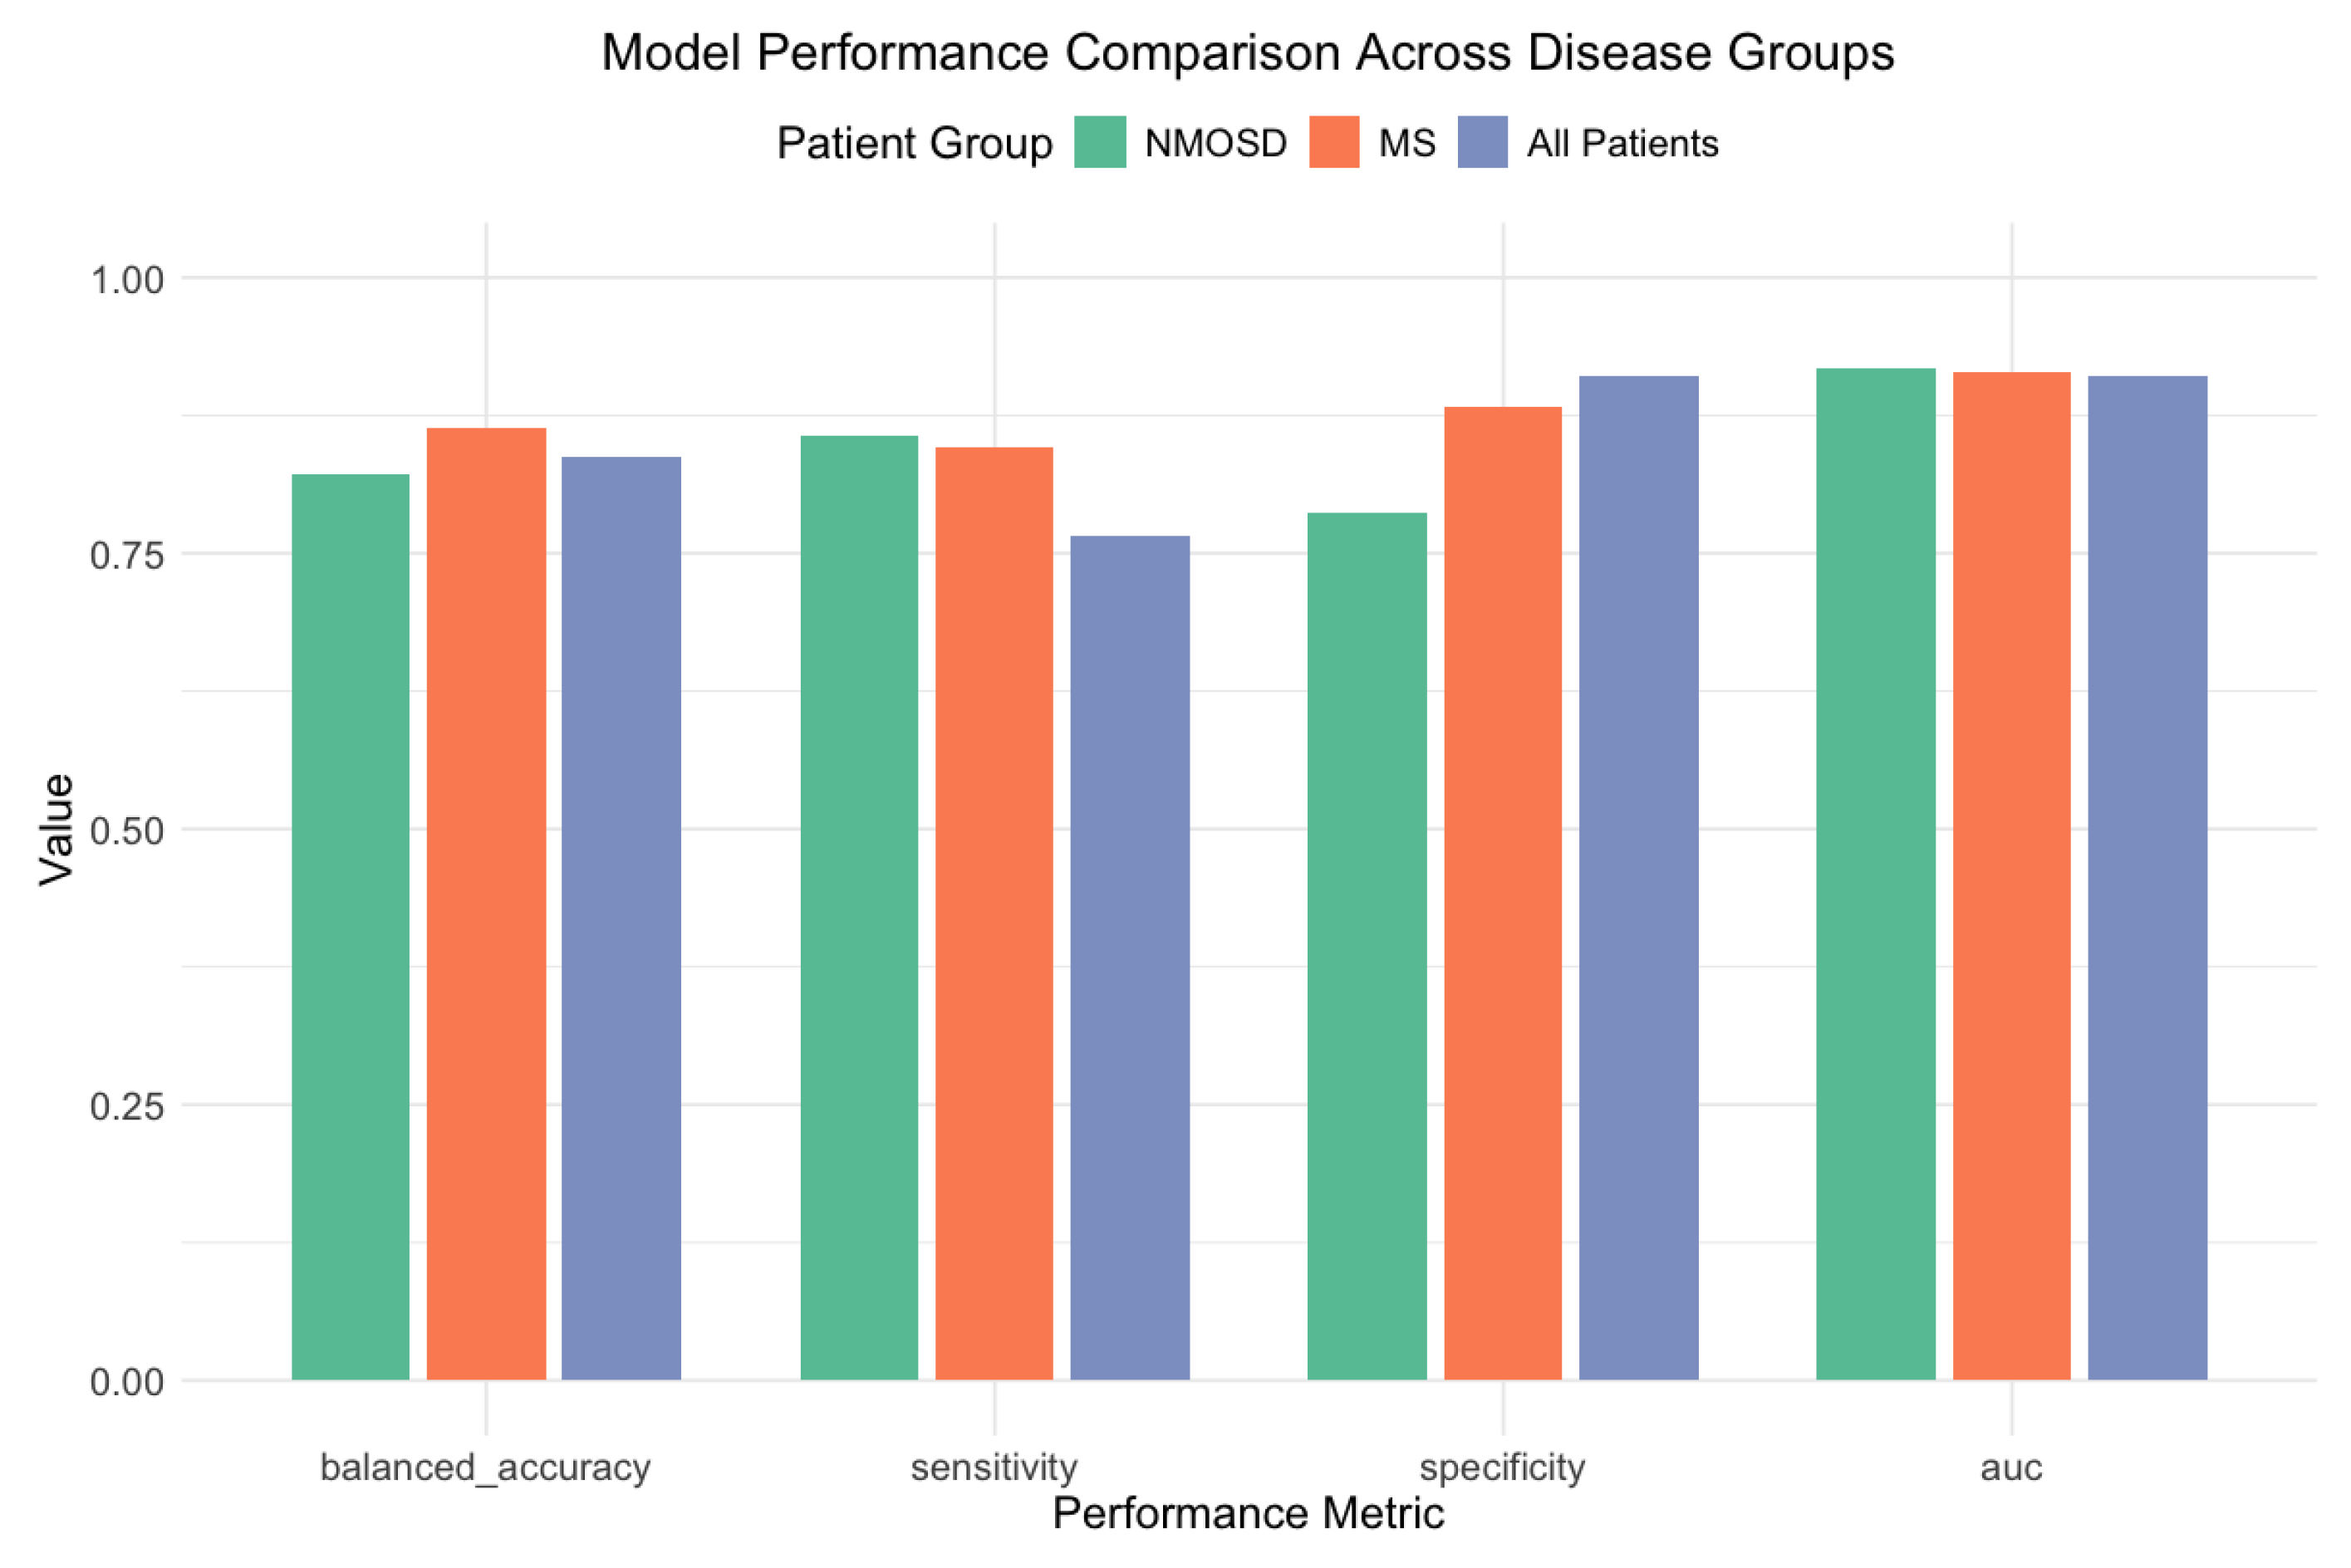
To examine the potential impact of disease heterogeneity on the classification performance, we conducted disease-specific subgroup analyses for the MS (
) and NMOSD (
) patients.
Figure 10 illustrates the model performance across different disease subgroups. Despite the uneven disease distribution between cognitive groups (MS: 60.7% CN patients vs. 32.4% CI patients,
), our approach maintained a robust performance in both subgroups.
The SVM-RBF model achieved robust discrimination in MS patients (AUC = 0.914; balanced accuracy = 0.864), with strong sensitivity (84.6%) and specificity (88.2%). For the NMOSD patients, the XGBoost model demonstrated a comparable performance (AUC = 0.918; balanced accuracy = 0.821), with similar sensitivity (85.7%) and slightly lower specificity (78.6%). The different optimal algorithms for each disease group suggest potentially distinct patterns of cognitive–motor integration across these IDD subtypes.
A further analysis revealed 27 handwriting features (13.5% of all of the features examined) that significantly differed between the MS and NMOSD patients (p < 0.05). The house-drawing task features accounted for the largest proportion of these differences (40.7%), followed by the connecting line task features (14.8%) and tree-drawing features (14.8%). The most discriminative feature was the air-to-paper-length ratio in the connecting line task (), which was substantially higher in the NMOSD patients (1.90 vs. 0.83).
A consistent pattern emerged across multiple tasks: NMOSD patients exhibited greater variability in velocity and acceleration fluctuations during drawing (e.g., the standard deviation in velocity during house-drawing: 5.86 vs. 4.45; ), while the MS patients demonstrated better information processing speeds (E-SDMT scores: 37.78 vs. 27.44, ) and higher pen pressure values. These disease-specific patterns suggest that handwriting features capture both general cognitive dysfunction and disease-specific neurophysiological mechanisms affecting fine motor control and cognitive–motor integration.
3.3.3. The Development of a Simplified Assessment Protocol
Based on our feature importance analysis, we developed a simplified assessment protocol that balanced the classification performance with clinical practicality. Through random forest feature importance ranking, we identified the five most influential features: air length during clock-drawing (importance score = 10.66), MMSE score (8.72), the air-to-paper-length ratio during the connecting line task (8.14), P-SDMT score (7.41), and years in education (6.70).
This simplified feature set requires only two drawing tasks (clock-drawing and connecting lines), alongside basic demographic information and the standard cognitive screening, potentially reducing the assessment time by approximately 35–40% compared to that for the complete protocol. To validate this approach, we developed an optimized SVM-RBF model using only these five features and compared its performance to that of the complete model using all eight features.
Table 5 presents the performance comparison between our complete model, the simplified model, and the baseline model, with 95% confidence intervals for key metrics. The simplified five-feature model achieved an AUC of 0.921 (95% CI: 0.853–0.989), which was comparable to—and slightly higher than—the complete eight-feature model’s AUC of 0.910 (95% CI: 0.853–0.967). While the simplified model showed a marginally lower sensitivity (75.0% vs. 76.5%) and specificity (82.8% vs. 91.1%), the overlapping confidence intervals suggested these differences were not statistically significant.
Figure 11 shows the confusion matrix for the simplified model, which correctly classified 24 of 32 cognitive impairment cases (75.0% sensitivity) and 48 of 58 cognitively normal cases (82.8% specificity). The F1-score decreased from 0.800 (95% CI: 0.679–0.895) in the complete model to 0.727 (95% CI: 0.590–0.836) in the simplified model, representing a non-significant 9.1% relative reduction.
Notably, the simplified model’s feature composition maintains diversity across assessment domains: traditional cognitive screening (MMSE score), cognitive processing speed (P-SDMT score), demographic information (years in education), and two handwriting dynamics measures from different drawing tasks. This balanced approach captures complementary aspects of cognitive–motor function while reducing the assessment burden.
The comparable performance of our simplified protocol, despite a 37.5% reduction in the feature count, suggests that a focused assessment of key handwriting dynamics alongside the traditional measures could provide an efficient approach to cognitive screening in clinical settings. This simplified protocol offers potential advantages in its reduced administration time and complexity while maintaining robust classification capabilities.
3.3.4. Statistical Power Considerations
Based on established guidelines, our sample size (n = 90, with 34 CI and 56 CN cases) provides adequate power for the primary classification analysis. The AUC of 0.910 achieved with narrow confidence intervals (0.853–0.967) demonstrates robust discrimination. Our nested cross-validation approach and bootstrap-derived confidence intervals further confirm the model’s stability despite the modest sample size.
For the secondary correlation analyses, the power calculations indicate that detecting moderate correlations (
) with 80% power at
= 0.05 requires approximately
n = 84 participants [
50]. Our sample of 90 participants therefore exceeds this threshold, though the detection of smaller effect sizes may be limited. However, the subgroup analyses (MS:
; NMOSD:
) may be underpowered for detecting moderate correlations within disease groups. While our results indicate robust discrimination, a larger, multi-center cohort would strengthen the reliability of these findings further.
4. Discussion
This study examined the dynamic handwriting features across nine cognitive and drawing tasks to assess cognitive function in IDD patients. The SVM model using eight features achieved an AUC = 0.910, and the five-feature variant maintained a comparable performance (AUC = 0.921) while reducing the assessment time by 35%. These results suggest that digital handwriting metrics may complement the standard screening by capturing temporal and motor characteristics not assessed in conventional testing.
Our findings relate to prior studies of handwriting kinematics in neurological disorders [
21,
22]. Previous work has shown altered movement patterns in MS patients during writing tasks. Our multi-task approach captured additional information beyond single-task assessments, though direct performance comparisons are limited by different study populations and methodologies. The differences in the prevalence of cognitive impairment observed between the MS (23.4%) and NMOSD (57.1%) patients align with emerging clinical observations of varying cognitive vulnerabilities across IDD subtypes.
These findings provide valuable insights into the potential utility of digital handwriting analyses in cognitive assessments of IDD patients. The simplified five-feature model we developed demonstrates the feasibility of integrating select handwriting metrics with the traditional cognitive screening measures to create efficient, multimodal assessment protocols. The inclusion of features from different drawing tasks highlights the complementary nature of various cognitive–motor challenges in revealing subtle impairments.
Our cross-sectional design with 93 patients (90 with complete data) limits the causal inference and statistical power for subgroup analyses (MS: ; NMOSD: ), although this cohort size is comparable to that in other exploratory digital handwriting studies in neurological populations. The narrow 95% confidence interval for our SVM model’s AUC (0.853–0.967) and the stable cross-validation performance indicate reliable discrimination, yet validation in larger, multi-center cohorts is needed before its clinical implementation.
The absence of healthy controls prevents an assessment of whether the observed features reflect disease-specific pathophysiology versus age-related changes in motor–cognitive integration. This limits our ability to establish normative handwriting baselines and distinguish IDD-specific cognitive–motor patterns from the variability in the general population. Additionally, our binary MoCA classification (<26) may lose information that continuous cognitive modeling could preserve by treating all scores below the threshold as equivalent regardless of severity.
We collected the patients’ medication histories but did not model the effects of specific drugs on their handwriting parameters. IDD treatments may influence fine motor control, representing a potential confounding factor. Furthermore, while we applied the EDSS inclusion criteria (<6.5), we did not analyze the full disability distribution within our cohort, limiting an examination of the motor versus cognitive contributions to the handwriting features.
Our sample was relatively young and highly educated, which may limit the generalizability. The temporal stability of these handwriting metrics and their performance in remote settings remain unknown, affecting potential clinical implementation.
Future research should examine the longitudinal changes in handwriting features, include healthy control groups, and incorporate the effects of medication into its analyses. Validation in larger, more diverse populations is needed to confirm clinical utility and establish the optimal implementation strategies for digital handwriting assessments in IDD care.
5. Conclusions
We evaluated dynamic handwriting metrics alongside the traditional screening tools and achieved an AUC of 0.910. A streamlined five-feature model maintained an equivalent performance (AUC = 0.921) while cutting the administration time by roughly 35%.
Rather than replacing the existing tests, digital handwriting features may complement them by capturing fine motor and temporal characteristics overlooked in the standard neuropsychological batteries. In particular, the response timing and pen pressure metrics correlated consistently with global cognition, suggesting that these measures tap into clinically meaningful neural processes. For clinical implementation, digital handwriting analyses require relatively minimal training and equipment. A standard tablet with a stylus and the analysis software are sufficient, making this approach feasible for routine use in neurology clinics.
It is important to acknowledge that the uneven distribution of MS and NMOSD patients across the cognitive status groups represents a limitation. Although we adjusted for disease type and ran subgroup analyses, larger and more balanced cohorts are needed to validate these findings. The inclusion of healthy controls would also clarify which features reflect IDD-specific impairments versus general cognitive decline.
Future work should use longitudinal cohorts to test whether handwriting metrics predict cognitive decline or treatment response, integrate medication status as a covariate, and explore continuous (regression-based) models of cognition. Linking these metrics with neuroimaging biomarkers may further reveal the neural substrates of handwriting alterations in IDD.
If confirmed in larger samples, handwriting-based assessments could offer scalable, remote-friendly tools for cognitive monitoring in neurological care.
Author Contributions
Conceptualization: M.L. and L.G.; Methodology: J.Y. and J.L.; Software: J.Y.; Validation: J.Y., Y.C. and Y.S.; Formal Analysis: J.Y.; Investigation: Y.C., Y.S. and S.Z.; Resources: M.L. and L.G.; Data Curation: J.Y., Y.C. and S.Z.; Writing—Original Draft Preparation: J.Y.; Writing—Review and Editing: J.L. and C.Y.; Visualization: J.Y.; Supervision: C.Y. and J.L.; Project Administration: C.Y.; Funding Acquisition: M.L. and L.G. All authors have read and agreed to the published version of the manuscript.
Funding
This research was funded by the National Natural Science Foundation of China (No. 62177010) and Beijing University of Posts and Telecommunications (BUPT)’s innovation and entrepreneurship support program (2025-YC-T045; 2025-YC-T046; 2025-YC-T047). The APC was funded by the authors.
Institutional Review Board Statement
This study was conducted in accordance with the Declaration of Helsinki and approved by the Ethics Committee of Beijing Tiantan Hospital, Capital Medical University (protocol code KY2021-150-02; date of approval: 27 April 2022).
Informed Consent Statement
Informed consent was obtained from all subjects involved in this study.
Data Availability Statement
The data presented in this study are available on request from the corresponding author. The data are not publicly available due to privacy and ethical restrictions related to patient confidentiality, as they contain information that could compromise the privacy of the research participants.
Conflicts of Interest
The authors declare no conflicts of interest. The funders had no role in the design of this study; in the collection, analyses, or interpretation of the data; in the writing of the manuscript; or in the decision to publish the results.
Abbreviations
The following abbreviations are used in this manuscript:
| IDD | Inflammatory Demyelinating Disease |
| MS | Multiple Sclerosis |
| NMOSD | Neuromyelitis Optica Spectrum Disorder |
| SDMT | Symbol Digit Modalities Test |
| P-SDMT | Paper-Based Symbol Digit Modalities Test |
| E-SDMT | Electronic Symbol Digit Modalities Test |
| MoCA | Montreal Cognitive Assessment |
| MMSE | Mini-Mental State Examination |
| COWAT | Controlled Oral Word Association Test |
| PASAT | Paced Auditory Serial Addition Test |
| HAMA | Hamilton Anxiety Scale |
| HAMD | Hamilton Depression Scale |
| MADRS | Montgomery–Åsberg Depression Rating Scale |
| HTP | House–Tree–Person |
| CI | Cognitive Impairment/Cognitively Impaired |
| CN | Cognitively Normal |
| SVM-RBF | Support Vector Machine with Radial Basis Function |
| AUC | Area Under the Curve |
References
- Rosenthal, J.F.; Hoffman, B.M.; Tyor, W.R. CNS Inflammatory Demyelinating Disorders: MS, NMOSD and MOG Antibody Associated Disease. J. Investig. Med. 2019, 68, 321–330. [Google Scholar] [CrossRef] [PubMed]
- Moghadasi, A.N.; Mirmosayyeb, O.; Mohammadi, A.; Sahraian, M.A.; Ghajarzadeh, M. The Prevalence of Cognitive Impairment in Patients with Neuromyelitis Optica Spectrum Disorders (NMOSD): A Systematic Review and Meta-Analysis. Mult. Scler. Relat. Disord. 2021, 49, 102757. [Google Scholar] [CrossRef] [PubMed]
- Benedict, R.H.B.; Amato, M.P.; DeLuca, J.; Geurts, J.J.G. Cognitive Impairment in Multiple Sclerosis: Clinical Management, MRI, and Therapeutic Avenues. Lancet Neurol. 2020, 19, 860–871. [Google Scholar] [CrossRef] [PubMed]
- McNicholas, N.; O’Connell, K.; Yap, S.M.; Killeen, R.P.; Hutchinson, M.; McGuigan, C. Cognitive Dysfunction in Early Multiple Sclerosis: A Review. QJM 2017, 111, 359–364. [Google Scholar] [CrossRef]
- Boringa, J.B.; Lazeron, R.H.; Reuling, I.E.; Adèr, H.J.; Pfennings, L.E.; Lindeboom, J.; de Sonneville, L.M.; Kalkers, N.F.; Polman, C.H. The Brief Repeatable Battery of Neuropsychological Tests: Normative Values Allow Application in Multiple Sclerosis Clinical Practice. Mult. Scler. J. 2001, 7, 263–267. [Google Scholar] [CrossRef]
- Langdon, D.; Amato, M.; Boringa, J.; Brochet, B.; Foley, F.; Fredrikson, S.; Hämäläinen, P.; Hartung, H.-P.; Krupp, L.; Penner, I.; et al. Recommendations for a Brief International Cognitive Assessment for Multiple Sclerosis (BICAMS). Mult. Scler. J. 2011, 18, 891–898. [Google Scholar] [CrossRef]
- Nasreddine, Z.S.; Phillips, N.A.; Bedirian, V.; Charbonneau, S.; Whitehead, V.; Collin, I.; Cummings, J.L.; Chertkow, H. The Montreal Cognitive Assessment, MoCA: A Brief Screening Tool for Mild Cognitive Impairment. J. Am. Geriatr. Soc. 2005, 53, 695–699. [Google Scholar] [CrossRef] [PubMed]
- Cooley, S.A.; Heaps, J.M.; Bolzenius, J.D.; Salminen, L.E.; Baker, L.M.; Scott, S.E.; Paul, R.H. Longitudinal Change in Performance on the Montreal Cognitive Assessment in Older Adults. Clin. Neuropsychol. 2015, 29, 824–835. [Google Scholar] [CrossRef]
- Koshimoto, B.H.B.; Brandão, P.R.P.; Borges, V.; Ferraz, H.B.; Schumacher-Schuh, A.F.; Rieder, C.R.M.; Olchik, M.R.; Mata, I.F.; Tumas, V.; Santos-Lobato, B.L. Floor and Ceiling Effects on the Montreal Cognitive Assessment in Patients with Parkinson’s Disease in Brazil. Dement. Neuropsychol. 2023, 17, e20230022. [Google Scholar] [CrossRef]
- Loring, D.W.; Lah, J.J.; Goldstein, F.C. Telehealth Equivalence of the Montreal Cognitive Assessment (MoCA): Results from the Emory Healthy Brain Study (EHBS). J. Am. Geriatr. Soc. 2023, 71, 1931–1936. [Google Scholar] [CrossRef]
- Sumowski, J.F.; Benedict, R.; Enzinger, C.; Filippi, M.; Geurts, J.J.; Hämäläinen, P.; Hulst, H.; Inglese, M.; Leavitt, V.M.; Rocca, M.A.; et al. Cognition in Multiple Sclerosis. Neurology 2018, 90, 278–288. [Google Scholar] [CrossRef] [PubMed]
- Sandry, J.; Simonet, D.V.; Brandstadter, R.; Krieger, S.; Katz Sand, I.; Graney, R.A.; Buchanan, A.V.; Lall, S.; Sumowski, J.F. The Symbol Digit Modalities Test (SDMT) Is Sensitive but Non-Specific in MS: Lexical Access Speed, Memory, and Information Processing Speed Independently Contribute to SDMT Performance. Mult. Scler. Relat. Disord. 2021, 51, 102950. [Google Scholar] [CrossRef] [PubMed]
- Fuchs, T.A.; Gillies, J.; Jaworski, M.G.; Wilding, G.E.; Youngs, M.; Weinstock-Guttman, B.; Benedict, R.H. Repeated Forms, Testing Intervals, and SDMT Performance in a Large Multiple Sclerosis Dataset. Mult. Scler. Relat. Disord. 2022, 68, 104375. [Google Scholar] [CrossRef] [PubMed]
- Tombaugh, T.N. A Comprehensive Review of the Paced Auditory Serial Addition Test (PASAT). Arch. Clin. Neuropsychol. 2006, 21, 53–76. [Google Scholar] [CrossRef] [PubMed]
- Oreja-Guevara, C.; Ayuso Blanco, T.; Brieva Ruiz, L.; Hernández Pérez, M.Á.; Meca-Lallana, V.; Ramió-Torrentà, L. Cognitive Dysfunctions and Assessments in Multiple Sclerosis. Front. Neurol. 2019, 10, 581. [Google Scholar] [CrossRef]
- White, R.F.; James, K.E.; Vasterling, J.J.; Marans, K.; Delaney, R.; Krengel, M.; Rose, F. Interrater Reliability of Neuropsychological Diagnoses: A Department of Veterans Affairs Cooperative Study. J. Int. Neuropsychol. Soc. 2002, 8, 555–565. [Google Scholar] [CrossRef]
- Vessio, G. Dynamic Handwriting Analysis for Neurodegenerative Disease Assessment: A Literary Review. Appl. Sci. 2019, 9, 4666. [Google Scholar] [CrossRef]
- Planton, S.; Jucla, M.; Roux, F.-E.; Démonet, J.-F. The “Handwriting Brain”: A Meta-Analysis of Neuroimaging Studies of Motor versus Orthographic Processes. Cortex 2013, 49, 2772–2787. [Google Scholar] [CrossRef]
- Pham, L.; Harris, T.; Varosanec, M.; Morgan, V.; Kosa, P.; Bielekova, B. Smartphone-Based Symbol-Digit Modalities Test Reliably Captures Brain Damage in Multiple Sclerosis. npj Digit. Med. 2021, 4, 36. [Google Scholar] [CrossRef]
- Impedovo, D.; Pirlo, G.; Vessio, G.; Angelillo, M.T. A Handwriting-Based Protocol for Assessing Neurodegenerative Dementia. Cogn. Comput. 2019, 11, 576–586. [Google Scholar] [CrossRef]
- Bisio, A.; Pedullà, L.; Bonzano, L.; Tacchino, A.; Brichetto, G.; Bove, M. The Kinematics of Handwriting Movements as Expression of Cognitive and Sensorimotor Impairments in People with Multiple Sclerosis. Sci. Rep. 2017, 7, 17730. [Google Scholar] [CrossRef] [PubMed]
- Bonzano, L.; Sormani, M.P.; Tacchino, A.; Abate, L.; Lapucci, C.; Mancardi, G.; Uccelli, A.; Bove, M. Quantitative Assessment of Finger Motor Impairment in Multiple Sclerosis. PLoS ONE 2013, 8, e65225. [Google Scholar] [CrossRef]
- Chen, S.; Stromer, D.; Alabdalrahim, H.A.; Schwab, S.; Weih, M.; Maier, A. Automatic Dementia Screening and Scoring by Applying Deep Learning on Clock-Drawing Tests. Sci. Rep. 2020, 10, 20854. [Google Scholar] [CrossRef] [PubMed]
- Li, A.; Li, J.; Chai, J.; Wu, W.; Chaudhary, S.; Zhao, J.; Qiang, Y. Detection of Mild Cognitive Impairment through Hand Motor Function under Digital Cognitive Test: Mixed Methods Study. JMIR Mhealth Uhealth 2024, 12, e48777. [Google Scholar] [CrossRef] [PubMed]
- Smits, E.J.; Tolonen, A.J.; Cluitmans, L.; van Gils, M.; Conway, B.A.; Zietsma, R.C.; Leenders, K.L.; Maurits, N.M. Standardized Handwriting to Assess Bradykinesia, Micrographia and Tremor in Parkinson’s Disease. PLoS ONE 2014, 9, e97614. [Google Scholar] [CrossRef]
- Kazzi, C.; Alpitsis, R.; O’Brien, T.J.; Malpas, C.B.; Monif, M. Cognitive and Psychopathological Features of Neuromyelitis Optica Spectrum Disorder and Myelin Oligodendrocyte Glycoprotein Antibody-Associated Disease: A Narrative Review. Mult. Scler. Relat. Disord. 2024, 85, 105596. [Google Scholar] [CrossRef] [PubMed]
- Guo, H.; Feng, B.; Ma, Y.; Zhang, X.; Fan, H.; Dong, Z.; Chen, T.; Gong, Q. Analysis of the Screening and Predicting Characteristics of the House-Tree-Person Drawing Test for Mental Disorders: A Systematic Review and Meta-Analysis. Front. Psychiatry 2023, 13, 1041770. [Google Scholar] [CrossRef]
- Kurtzke, J.F. Rating Neurologic Impairment in Multiple Sclerosis: An Expanded Disability Status Scale (EDSS). Neurology 1983, 33, 1444. [Google Scholar] [CrossRef]
- Thomann, A.E.; Berres, M.; Goettel, N.; Steiner, L.A.; Monsch, A.U. Enhanced Diagnostic Accuracy for Neurocognitive Disorders: A Revised Cut-off Approach for the Montreal Cognitive Assessment. Alzheimers Res. Ther. 2020, 12, 39. [Google Scholar] [CrossRef]
- Malek-Ahmadi, M.; Powell, J.J.; Belden, C.M.; O’Connor, K.; Evans, L.; Coon, D.W.; Nieri, W. Age- and Education-Adjusted Normative Data for the Montreal Cognitive Assessment (MoCA) in Older Adults Aged 70–99. Aging Neuropsychol. Cogn. 2015, 22, 755–761. [Google Scholar] [CrossRef]
- Freitas, S.; Batista, S.; Afonso, A.C.; Simões, M.R.; de Sousa, L.; Cunha, L.; Santana, I. The Montreal Cognitive Assessment (MoCA) as a Screening Test for Cognitive Dysfunction in Multiple Sclerosis. Appl. Neuropsychol. Adult 2016, 25, 57–70. [Google Scholar] [CrossRef] [PubMed]
- Yu, J.; Li, J.; Huang, X. The Beijing Version of the Montreal Cognitive Assessment as a Brief Screening Tool for Mild Cognitive Impairment: A Community-Based Study. BMC Psychiatry 2012, 12, 156. [Google Scholar] [CrossRef] [PubMed]
- Buck, J.N. The H-T-P Technique. A Qualitative and Quantitative Scoring Manual. J. Clin. Psychol. 1948, 4, 317. [Google Scholar] [CrossRef]
- Potticary, H.; Langdon, D. A Systematic Review and Meta-Analysis of the Brief Cognitive Assessment for Multiple Sclerosis (BICAMS) International Validations. J. Clin. Med. 2023, 12, 703. [Google Scholar] [CrossRef] [PubMed]
- Wacom. Introduction|Wacom Developer Documentation. Wacom.com. Available online: https://developer-docs.wacom.com/docs/sdk-for-ink/overview/ (accessed on 18 May 2025).
- Drotár, P.; Mekyska, J.; Rektorová, I.; Masarová, L.; Smékal, Z.; Faundez-Zanuy, M. Evaluation of Handwriting Kinematics and Pressure for Differential Diagnosis of Parkinson’s Disease. Artif. Intell. Med. 2016, 67, 39–46. [Google Scholar] [CrossRef] [PubMed]
- Buuren, S.V.; Groothuis-Oudshoorn, K. Mice: Multivariate Imputation by Chained Equations in R. J. Stat. Softw. 2011, 45, 1–67. [Google Scholar] [CrossRef]
- Morris, T.P.; White, I.R.; Royston, P. Tuning Multiple Imputation by Predictive Mean Matching and Local Residual Draws. BMC Med. Res. Methodol. 2014, 14, 75. [Google Scholar] [CrossRef] [PubMed]
- Konietschke, F.; Schwab, K.; Pauly, M. Small Sample Sizes: A Big Data Problem in High-Dimensional Data Analysis. Stat. Methods Med. Res. 2020, 30, 687–701. [Google Scholar] [CrossRef]
- Salman, R.; Alzaatreh, A.; Sulieman, H.; Faisal, S. A Bootstrap Framework for Aggregating Within and Between Feature Selection Methods. Entropy 2021, 23, 200. [Google Scholar] [CrossRef]
- Pudjihartono, N.; Fadason, T.; Kempa-Liehr, A.W.; O’Sullivan, J.M. A Review of Feature Selection Methods for Machine Learning-Based Disease Risk Prediction. Front. Bioinform. 2022, 2, 927312. [Google Scholar] [CrossRef]
- Hosmer, D.W.; Lemeshow, S. Applied Logistic Regression; John Wiley & Sons, Inc.: Hoboken, NJ, USA, 2000. [Google Scholar] [CrossRef]
- Breiman, L. Random Forests. Mach. Learn. 2001, 45, 5–32. [Google Scholar] [CrossRef]
- Cortes, C.; Vapnik, V. Support-Vector Networks. Mach. Learn. 1995, 20, 273–297. [Google Scholar] [CrossRef]
- Chen, T.; Guestrin, C. XGBoost: A Scalable Tree Boosting System. In Proceedings of the 22nd ACM SIGKDD International Conference on Knowledge Discovery and Data Mining (KDD ’16), San Francisco, CA, USA, 13–17 August 2016; pp. 785–794. [Google Scholar] [CrossRef]
- He, H.; Garcia, E.A. Learning from Imbalanced Data. IEEE Trans. Knowl. Data Eng. 2009, 21, 1263–1284. [Google Scholar] [CrossRef]
- Varma, S.; Simon, R. Bias in Error Estimation When Using Cross-Validation for Model Selection. BMC Bioinform. 2006, 7, 91. [Google Scholar] [CrossRef]
- Caruana, R.; Niculescu-Mizil, A. An Empirical Comparison of Supervised Learning Algorithms. In Proceedings of the 23rd International Conference on Machine Learning (ICML ’06), Pittsburgh, PA, USA, 25–29 June 2006; pp. 161–168. [Google Scholar] [CrossRef]
- Silva, R.; Andreão, F.; dos Santos, K.D.; Nascimento, L.; Lessa, L.; Filho, H.; Anselmi, L.A.; Santos, D.H. Cognitive Assessment in Neuromyelitis Optica Spectrum Disorders: A Systematic Review and Meta-Analysis (P7-8.014). Neurology 2025, 104 (Suppl. S1), 5820. [Google Scholar] [CrossRef]
- Cohen, J. Statistical Power Analysis for the Behavioral Sciences, 2nd ed.; Routledge: New York, NY, USA, 1988. [Google Scholar] [CrossRef]
Figure 1.
Examples of the nine cognitive and drawing assessment tasks used in this study. From left to right, (A) the P-SDMT, (B) free sentence-writing, (Chinese text: “I love singing and dancing”) (C) pentagon-copying, (D) the Trail-Making Test, (MoCA Beijing version uses Chinese sequential characters, equivalent to A-B-C-D in English version) (E) cube-copying, (F) clock drawing, (G) house drawing, (H) tree drawing, and (I) person drawing.
Figure 2.
The relationship between MoCA scores and mean E-SDMT response intervals across different IDD subtypes.
Figure 2.
The relationship between MoCA scores and mean E-SDMT response intervals across different IDD subtypes.
Figure 3.
Comparison of stroke length feature correlations with P-SDMT scores before (blue) and after (orange) controlling for stroke number. Significance levels: *** p < 0.001, ns = not significant.
Figure 3.
Comparison of stroke length feature correlations with P-SDMT scores before (blue) and after (orange) controlling for stroke number. Significance levels: *** p < 0.001, ns = not significant.
Figure 4.
Mean pen pressure across eight drawing tasks: comparison between cognitively normal (CN) and cognitively impaired (CI) groups.
Figure 4.
Mean pen pressure across eight drawing tasks: comparison between cognitively normal (CN) and cognitively impaired (CI) groups.
Figure 5.
The bootstrap stability analysis of selected features. The graph shows the stability scores (the percentage of bootstrap iterations in which features maintained statistical significance) for top features. The traditional cognitive measures (MMSE, years in education) and SDMT metrics demonstrated the highest stability, while the handwriting dynamics features showed moderate to high stability.
Figure 6.
Disease-specific correlation patterns between selected features and MoCA scores in MS and NMOSD patients. Color intensity represents correlation strength, with blue indicating negative correlations and red indicating positive correlations. Several features show distinct correlation patterns between disease groups, suggesting disease-specific cognitive–motor integration mechanisms.
Figure 7.
Multi-metric performance with progressive feature addition. Four evaluation metrics (AUC, F1-score, accuracy, and balanced accuracy) demonstrate consistent improvement as features are added, with optimal performance converging at eight features.
Figure 7.
Multi-metric performance with progressive feature addition. Four evaluation metrics (AUC, F1-score, accuracy, and balanced accuracy) demonstrate consistent improvement as features are added, with optimal performance converging at eight features.
Figure 8.
A performance comparison across different feature groupings. The combination of the basic covariates and handwriting features achieves the highest AUC, demonstrating the complementary value of these feature types.
Figure 8.
A performance comparison across different feature groupings. The combination of the basic covariates and handwriting features achieves the highest AUC, demonstrating the complementary value of these feature types.
Figure 9.
The confusion matrix for the SVM-RBF model using the combined feature set, showing the distribution of the classification outcomes.
Figure 9.
The confusion matrix for the SVM-RBF model using the combined feature set, showing the distribution of the classification outcomes.
Figure 10.
A model performance comparison across disease groups. The SVM-RBF model for MS patients and the XGBoost model for NMOSD patients both achieved high AUC values, with strong sensitivity and specificity.
Figure 10.
A model performance comparison across disease groups. The SVM-RBF model for MS patients and the XGBoost model for NMOSD patients both achieved high AUC values, with strong sensitivity and specificity.
Figure 11.
The confusion matrix for the simplified 5-feature model, showing slightly lower specificity but comparable sensitivity versus those of the complete model.
Figure 11.
The confusion matrix for the simplified 5-feature model, showing slightly lower specificity but comparable sensitivity versus those of the complete model.
Table 1.
An overview of the handwriting tasks administered in this study.
Table 1.
An overview of the handwriting tasks administered in this study.
| Abbr. | Task Description | Primary Domain * |
|---|
| Digital and Paper Symbol Digit Modalities Tests |
| E-SDMT | On a tablet, tap the digit that matches the symbol on screen (90 s). | Information processing speed |
| P-SDMT | On a printed grid, write the digit that matches each symbol (90 s). | Processing speed + fine motor skills |
| Standard Neuropsychological Drawing Tasks |
| Sentence-Writing (SE) | Write a complete sentence. | Language fluency |
| Pentagon-Copying (PE) | Copy overlapping pentagons. | Visuo-spatial |
| Trail-Making (CO) | Connect numbers/letters alternately (1-A-2-B-3-C-4-D-5-E). | Attention/set-shifting |
| Cube-Copying (CU) | Copy the outline of a 3D cube. | Visuo-constructive |
| Clock-Drawing (CL) | Draw a clock face, and set the hands to 11:10. | Executive planning |
| House–Tree–Person Projective Drawings |
| HTP | Draw a house, a tree, and a person on separate sheets; erase freely if needed [33]. | Visuo-affective integration |
Table 2.
Demographic and clinical characteristics by cognitive status.
Table 2.
Demographic and clinical characteristics by cognitive status.
| Characteristic | All (n = 90) | CN (n = 56) | CI (n = 34) | p-Value |
|---|
| Age, years | 37.8 ± 10.5 | 34.9 ± 9.7 | 42.7 ± 10.0 | <0.001 |
| Female sex, n (%) | 75 (83.3) | 45 (80.4) | 30 (88.2) | 0.331 |
| Disease type, n (%) | | | | 0.006 |
| MS | 45 (50.0) | 34 (60.7) | 11 (32.4) | — |
| NMOSD | 34 (37.8) | 14 (25.0) | 20 (58.8) | — |
| Others | 11 (12.2) | 8 (14.3) | 3 (8.8) | — |
| Education, years a | 15.0 ± 3.4 | 16.3 ± 2.4 | 12.9 ± 3.7 | <0.001 |
| MoCA score | 25.9 ± 3.2 | 28.0 ± 1.3 | 22.5 ± 2.3 | <0.001 |
| MMSE score | 28.7 ± 1.9 | 29.4 ± 0.9 | 27.6 ± 2.5 | <0.001 |
Table 3.
Final selected features for cognitive status classification.
Table 3.
Final selected features for cognitive status classification.
| Feature | Stability Score (%) | Correlation with MoCA | Selection Methods |
|---|
| Years in education | 97 | 0.43 ** | 5/5 |
| Digital SDMT score (sdmt_D) | 92 | 0.38 ** | 5/5 |
| Paper SDMT score (P-SDMT) | 94 | 0.35 ** | 5/5 |
| MMSE score | 90 | 0.67 ** | 5/5 |
| Median response interval | 86 | −0.37 ** | 5/5 |
| Air length during clock-drawing | 82 | −0.33 ** | 5/5 |
| CV in velocity during tree-drawing | 76 | −0.29 * | 3/5 |
| Air–paper ratio in trail-making | 71 | −0.28 * | 2/5 |
Table 4.
Performance comparison of the classification model using the combined feature set (95% confidence intervals shown for the SVM-RBF model only to conserve space).
Table 4.
Performance comparison of the classification model using the combined feature set (95% confidence intervals shown for the SVM-RBF model only to conserve space).
| Model | Accuracy | Balanced Acc. | Sensitivity | Specificity | Precision | F1-Score | AUC |
|---|
| SVM-RBF | 0.856 | 0.838 | 0.765 | 0.911 | 0.839 | 0.800 | 0.910 |
| | (0.766–0.921) | (0.753–0.915) | (0.588–0.893) | (0.804–0.970) | (0.663–0.945) | (0.679–0.895) | (0.853–0.967) |
| Logistic Regression | 0.811 | 0.790 | 0.706 | 0.875 | 0.774 | 0.738 | 0.871 |
| Random Forest | 0.789 | 0.767 | 0.676 | 0.857 | 0.742 | 0.708 | 0.885 |
| XGBoost | 0.767 | 0.743 | 0.647 | 0.839 | 0.710 | 0.677 | 0.884 |
Table 5.
Comparison of key models with 95% confidence intervals.
Table 5.
Comparison of key models with 95% confidence intervals.
| Metric | Complete Model (Eight Features) | Simplified Model (Five Features) | Baseline Model (Four Features) |
|---|
| AUC | 0.910 (0.853–0.967) | 0.921 (0.853–0.989) | 0.884 (0.817–0.952) |
| Sensitivity | 0.765 (0.588–0.893) | 0.750 (0.566–0.885) | 0.735 (0.556–0.871) |
| Specificity | 0.911 (0.804–0.970) | 0.828 (0.706–0.914) | 0.821 (0.696–0.911) |
| F1-Score | 0.800 (0.679–0.895) | 0.727 (0.590–0.836) | 0.725 (0.592–0.831) |
| Disclaimer/Publisher’s Note: The statements, opinions and data contained in all publications are solely those of the individual author(s) and contributor(s) and not of MDPI and/or the editor(s). MDPI and/or the editor(s) disclaim responsibility for any injury to people or property resulting from any ideas, methods, instructions or products referred to in the content. |
© 2025 by the authors. Licensee MDPI, Basel, Switzerland. This article is an open access article distributed under the terms and conditions of the Creative Commons Attribution (CC BY) license (https://creativecommons.org/licenses/by/4.0/).

 ,
, 


