1. Introduction
The global energy paradigm is shifting from fossil fuels to eco-friendly alternatives, with hydrogen energy gaining prominence due to its high energy density and zero-emission characteristics [
1]. For hydrogen fuel cell vehicle commercialization, 87.5 MPa ultra-high pressure hydrogen storage and control technology represents a critical enabling technology [
2]. Within these applications, ultra-high pressure hydrogen solenoid valves serve as core components responsible for stable hydrogen control in high-pressure environments [
3,
4].
Traditional sealing strategies in fluid control ㅁ valves have predominantly relied on hard-to-hard material combinations with conforming contact geometries (Rp < Rs), developed primarily through empirical field testing approaches. This conventional paradigm, while effective for moderate pressure applications, encounters fundamental limitations in ultra-high pressure hydrogen environments where neither traditional hard-to-hard sealing nor superelastic sealing elements can adequately address the conflicting requirements of low-pressure sealing effectiveness and high-pressure structural integrity. The emergence of ultra-high-pressure pilot-operated valves necessitates a paradigm shift toward soft-to-hard material combinations with hydrogen-resistant engineering plastics, coupled with systematic theoretical frameworks to replace empirical design practices.
These valves face a unique design challenge: operating reliably across pressure conditions from 2 MPa to 87.5 MPa. This broad operating range creates a fundamental design dilemma. At low pressures, sufficient contact pressure is necessary for effective sealing, while at high pressures, the maximum stress at the contact area must remain below the material’s compressive strength to prevent permanent deformation. These requirements, low-pressure sealing performance and high-pressure structural integrity, often conflict, presenting a key challenge in contact geometry design [
5,
6].
Conventional solenoid valve designs typically employ rectangular contact geometry, prioritizing manufacturability and cost-efficiency. This configuration, where plunger and seat meet at nearly right angles, provides effective sealing in low-pressure environments. However, under ultra-high-pressure conditions, severe stress concentration occurs at the edge, exceeding the material’s compressive strength. This results in permanent deformation of the plunger material, significantly reducing valve lifespan and reliability [
7,
8].
Hydrogen valve plungers commonly use engineering plastics such as polyamide-imide (PAI), which offer excellent hydrogen penetration resistance and dimensional stability but limited mechanical durability compared to metals. Under high-pressure conditions with stress concentration, these materials can easily exceed their compressive strength, leading to permanent deformation or cracking. Researchers have explored various approaches to address these limitations, including high-strength alloy materials, surface hardening treatments, and edge-rounding designs [
9]. Recent structural mechanics studies have demonstrated that curved surface designs can improve contact stress distribution and enhance structural durability, yet most remain within the framework of existing rectangular contact geometry, failing to achieve the fundamental balance between low-pressure sealing and high-pressure durability required across broad pressure ranges [
10,
11].
To fundamentally resolve this design challenge, we propose a novel soft-to-hard sealing approach that leverages hydrogen-resistant plastic materials in a non-conforming contact geometry (
Rp > Rs). This approach applies Hertzian contact theory principles in an unconventional configuration that challenges traditional contact mechanics wisdom, establishing the first systematic theoretical framework for ultra-high-pressure pilot-operated valve sealing and moving beyond empirical design practices toward predictive modeling. This foundational contact mechanics model quantitatively explains pressure distribution and contact area changes occurring between curved surfaces [
12,
13]. Its core principle lies in the mechanism of gradually expanding the contact area with increasing load, effectively dispersing stress. Curved contact geometry significantly reduces stress concentration and distributes contact pressure more uniformly compared to flat or rectangular contact geometries.
In this study, we compare and analyze two contact geometries. We refer to the existing design with near-rectangular contact shape as “rectangular contact geometry”, reflecting its geometric characteristics. We term the newly proposed curved contact geometry based on Hertzian contact theory as “concave contact geometry”, reflecting its concave shape.
We analyze the theoretical mechanics principles of both rectangular and concave contact geometries and compare their performance across the entire pressure range through finite element analysis (FEA). To efficiently explore the design space, we conduct an optimization process utilizing Latin hypercube sampling (LHS) and kriging metamodeling techniques [
14,
15]. Experimental validation quantitatively evaluates the actual performance improvement of the optimized design. Ultimately, we present a novel contact geometry design approach for ultra-high-pressure hydrogen valves that simultaneously satisfies the conflicting requirements of sealing performance at low pressure and durability at high pressure.
This paper is organized as follows:
Section 2 describes the operational principle of the pilot-operated solenoid valve and outlines the theoretical background related to Hertzian contact mechanics and the key design variables for contact geometries.
Section 3 presents the preliminary analysis conditions and initial results from finite element analysis, which inform the subsequent design direction.
Section 4 details the design optimization methodology, including Latin hypercube sampling, kriging metamodeling, sensitivity analysis, and Pareto optimality analysis, culminating in an optimized concave contact geometry.
Section 5 presents the experimental validation of the optimized design, comparing its sealing performance and structural integrity against the conventional rectangular geometry. Finally,
Section 6 summarizes the key findings of this study and discusses their implications.
2. Theoretical Background
2.1. Operational Principle of the Solenoid Valve
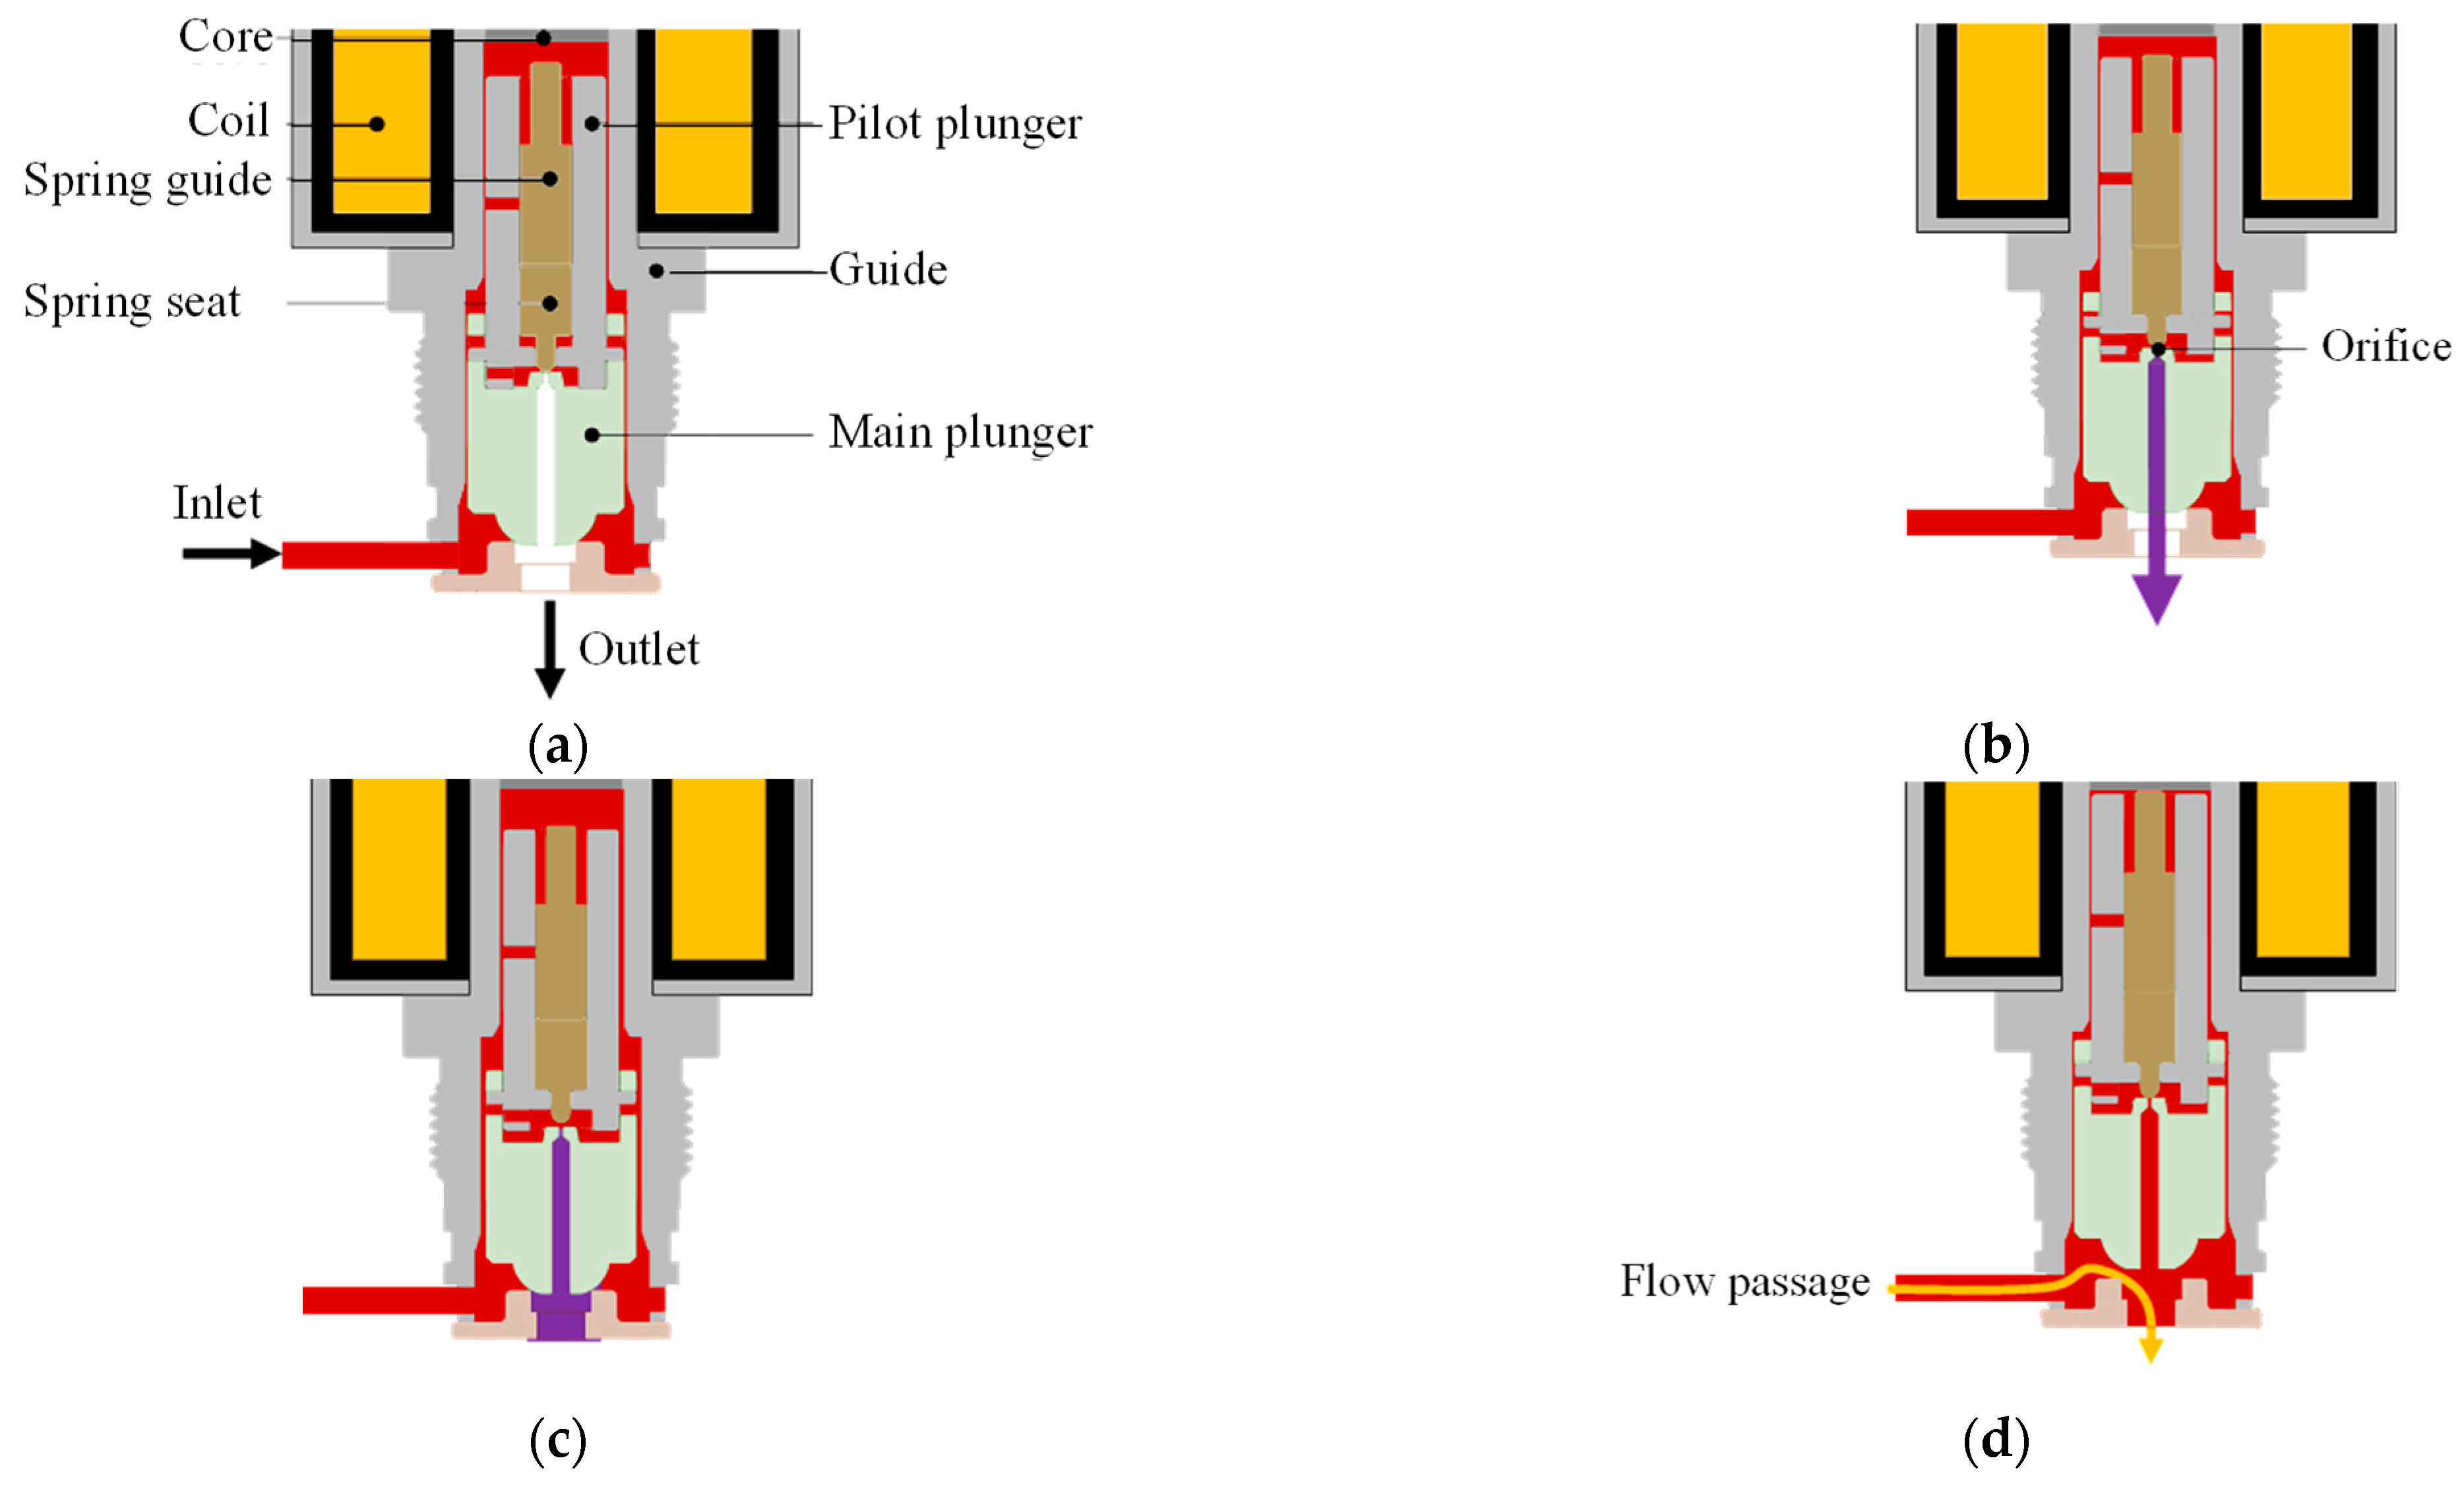
The ultra-high-pressure hydrogen solenoid valves discussed in this study employ a pilot-operated mechanism. This design is crucial for high-pressure applications as it allows for the control of large flow rates with a relatively small solenoid actuation force. Directly actuating a large main plunger against high inlet pressures would require an impractically large and power-consuming solenoid. The pilot stage effectively reduces the actuation force needed for the main stage. The operational sequence, as illustrated in
Figure 1, consists of several distinct stages [
16]:
(a) Initial state: As shown in
Figure 1a, the main plunger is firmly pressed against the valve seat by a spring force, effectively blocking any fluid flow. In this closed state, the high inlet pressure acts on the underside of the main plunger.
(b) Pilot stage opening: When electrical power activates the solenoid (
Figure 1b), the electromagnetic force lifts the pilot plunger. This opens a small pilot passage, allowing a limited flow of high-pressure hydrogen from the inlet side to a chamber typically located above the main plunger or to the outlet side. The primary purpose of this initial pilot flow is to begin reducing the significant pressure differential across the main plunger.
(c) Pressure equalization: As the pilot flow continues, the pressure in the chamber above the main plunger (or across the main plunger, depending on the specific design) starts to equalize with the downstream pressure or a reference pressure (
Figure 1c). This equalization process significantly reduces the net hydraulic force holding the main plunger against the seat.
(d) Main stage opening: Once the pressure differential across the main plunger is sufficiently reduced, the main plunger can be lifted with a much smaller force (either by the remaining pressure difference or assisted by the solenoid/spring assembly, depending on the design), as depicted in
Figure 1d. This results in the full opening of the main valve orifice, allowing secured and high-volume fluid flow.
Throughout this entire operational sequence, from fully closed to fully open, the integrity of the contact geometry between the main plunger and the seat is critical. It must ensure effective sealing, especially during the initial and pilot stages at varying pressure differentials, and maintain structural integrity under the extreme pressures experienced, particularly when fully pressurized. For clarity in subsequent discussions, the main plunger will be referred to simply as the “plunger”. The design of this critical contact interface is the central focus of this study.
2.2. Design Variables and Contact Geometries
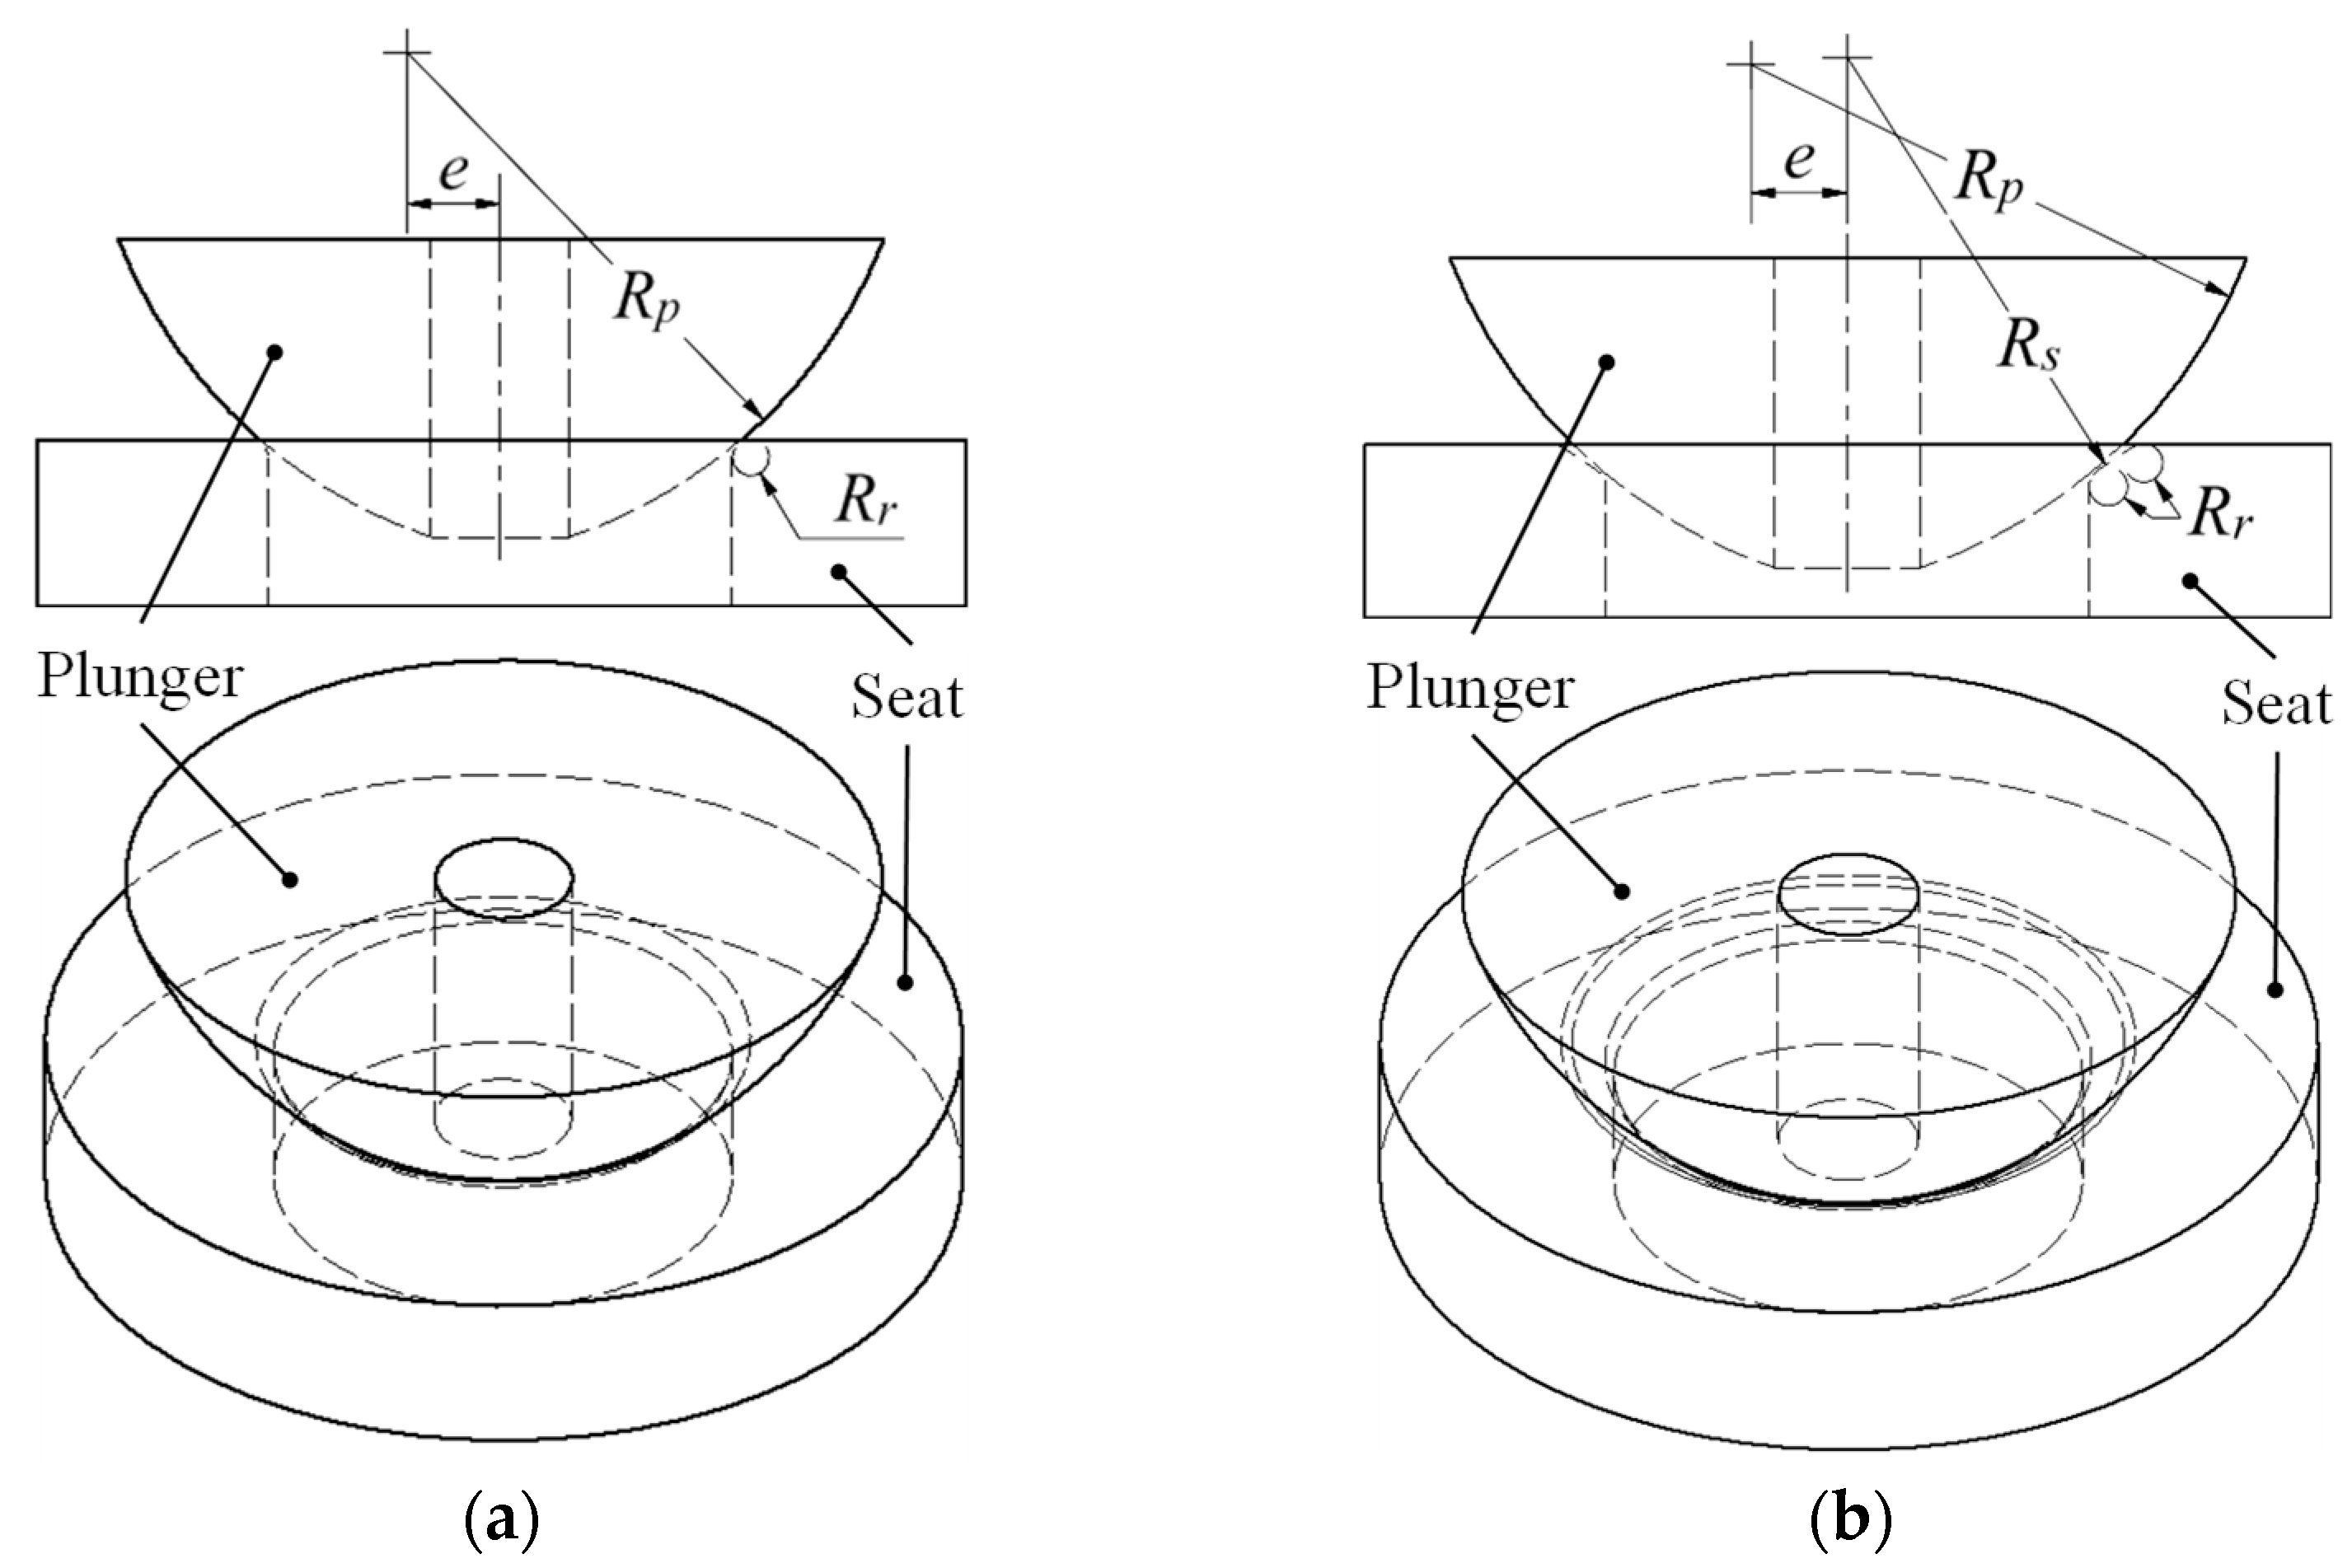
In ultra-high-pressure hydrogen valve design, the geometric characteristics of contact geometries critically determine sealing performance and maximum equivalent stress. We define these contact geometries through three principal design variables: plunger curvature radius (Rp), seat curvature radius (Rs), and eccentricity of the plunger curvature center (e).
Both the conventional rectangular contact geometry and our proposed concave contact geometry incorporate identical edge rounding with radius (Rr = 0.2 mm), conforming to manufacturing and machining standards. This rounding dimension represents an optimal value widely applied in precision fluid control components, mitigating stress concentration at edges while ensuring consistent precision machining.
The key difference between the two designs lies in their geometric configuration. The rectangular contact geometry features a flat plunger face with edge rounding
Rr, while the concave contact geometry incorporates curved surfaces defined by
Rp and
Rs, as illustrated in
Figure 2a,b. In both configurations, initial contact occurs at the edge-rounding portion. However, as load increases, their behaviors differ significantly. In the rectangular contact geometry, contact remains concentrated near the initial contact region, intensifying localized stress concentration. In the concave contact geometry, the curved configuration allows the contact area to gradually expand across the curved surfaces, effectively distributing stress over a wider region as pressure increases.
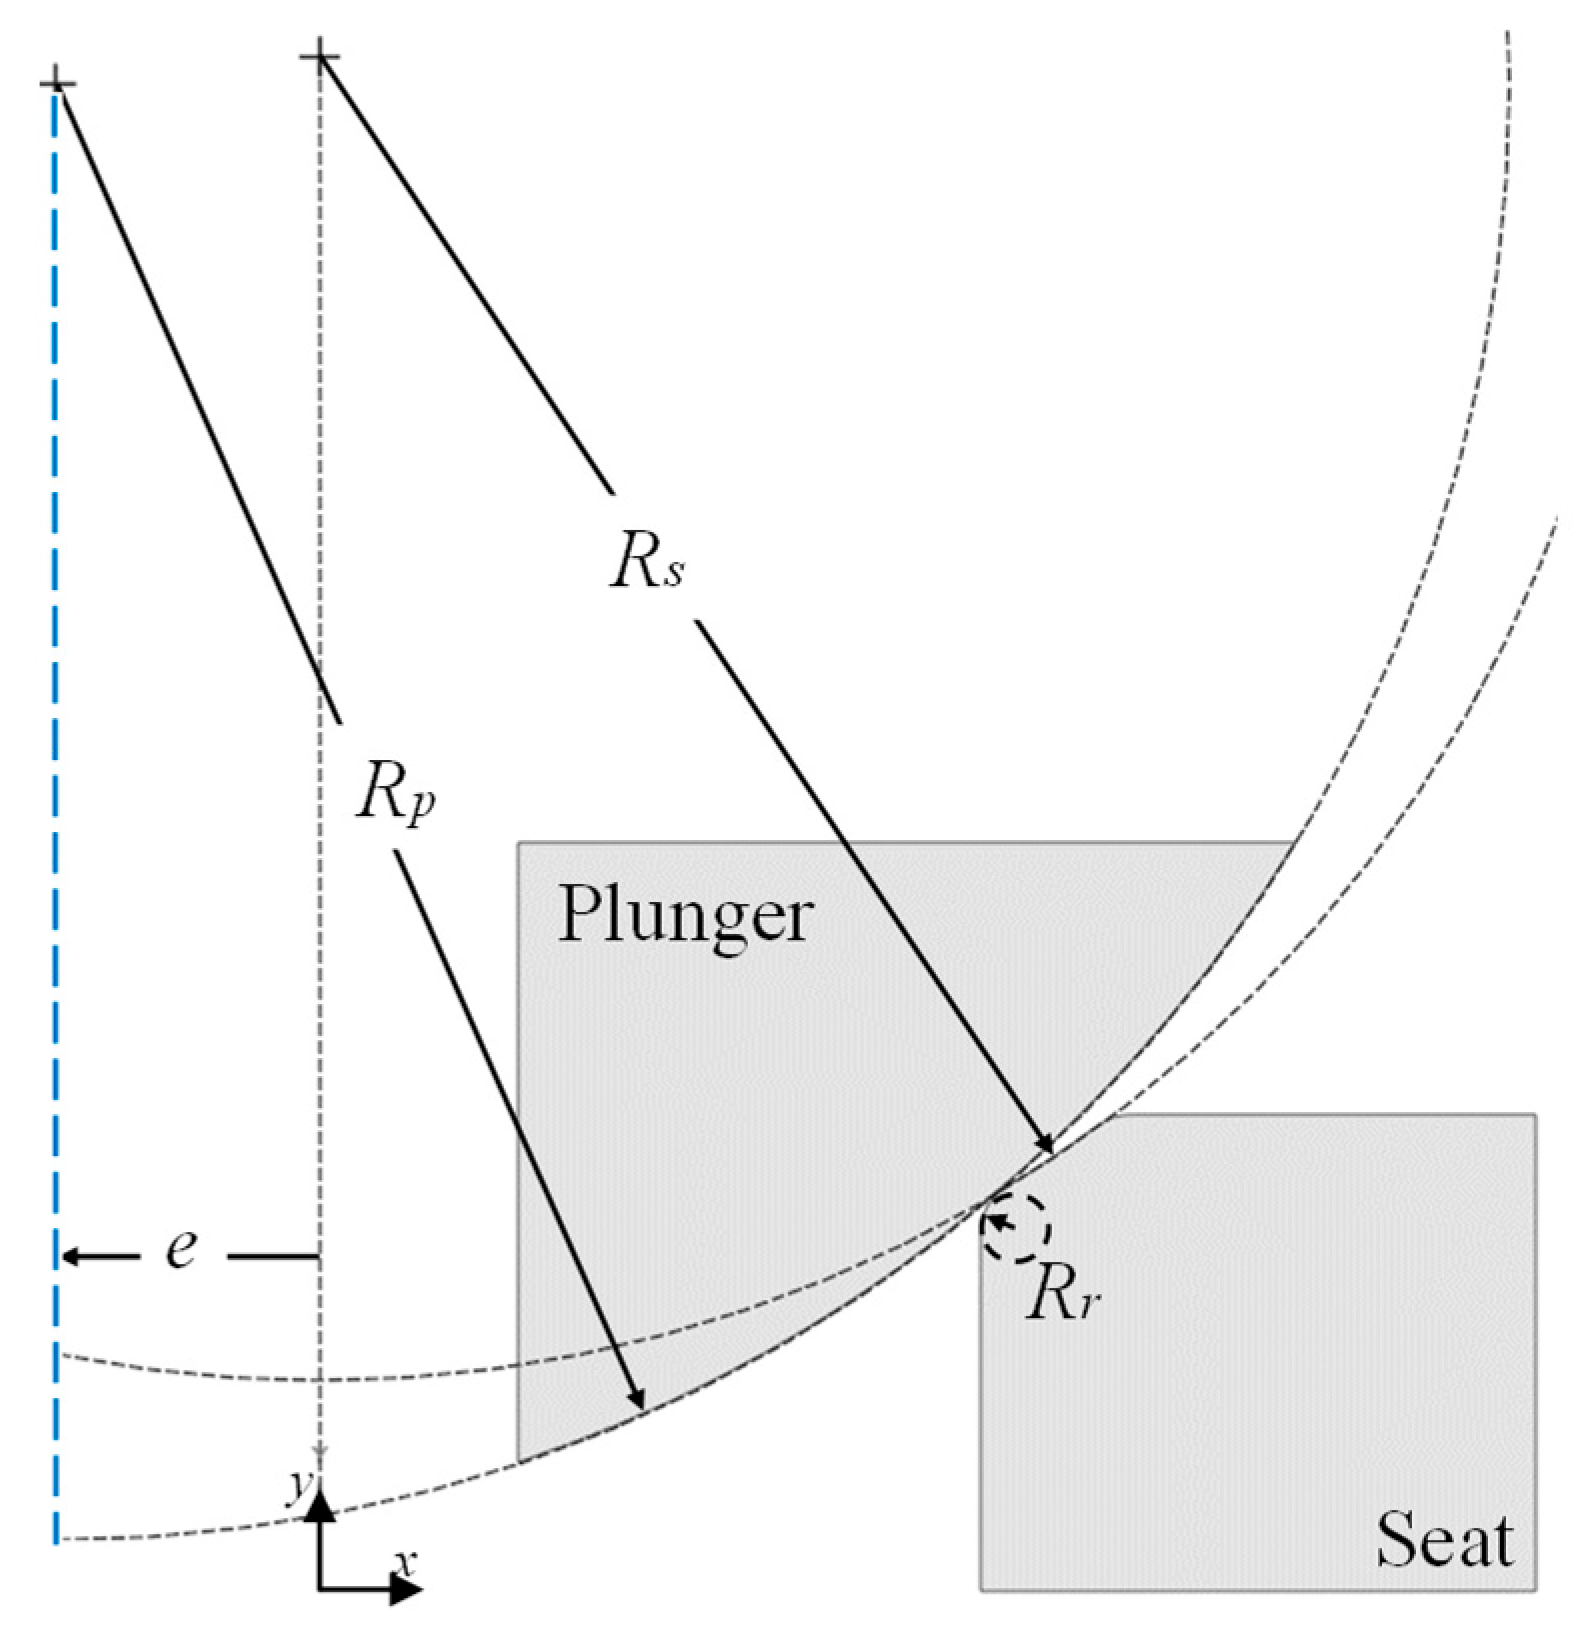
As shown in
Figure 3,
e determines the position of the plunger curvature center relative to the plunger axis, significantly affecting initial contact position and subsequent pressure distribution. Ultra-high-pressure valve design must simultaneously satisfy the conflicting requirements of low-pressure sealing performance and high-pressure durability. In the valve structure, the seat consists of aluminum bronze alloy (685 MPa compressive strength), while the plunger uses PAI material with relatively lower strength (186 MPa), making structural optimization of the plunger especially critical. Therefore, the key challenge is to derive optimal contact geometry by analyzing both contact pressure at low pressure conditions and maximum equivalent stress at high pressure conditions.
2.3. Contact Mechanics
Hertzian contact theory provides a fundamental model for quantitatively describing stress distribution and deformation characteristics occurring during contact between curved surfaces. The mathematical formulations presented in this section (Equations (1)–(8)) are based on classical Hertzian contact theory, as presented in comprehensive references [
17,
18]. These established relationships form the theoretical foundation upon which our contact geometry analysis is built. In the concave contact geometry, initial contact occurs between the curved surface of the plunger (
Rp) and the edge rounding of the seat (
Rr). The equivalent radius of curvature (
Req) at this initial contact stage is defined as follows:
The equivalent elastic modulus (
E*) considering the elastic properties of the two contacting materials is given by the following:
where
Ep and
Es are the elastic moduli of the plunger and seat, respectively, and
νp and
νs are their Poisson’s ratios.
In Hertzian contact, the pressure distribution follows a semi-elliptical distribution:
where
p(r) is the contact pressure at distance r from the center,
p0 is the maximum contact pressure at the center, and
a is the contact radius. The contact radius
a is determined as a function of the equivalent radius of curvature, equivalent elastic modulus, and contact force:
where
F is the contact force. The maximum contact pressure
p0 is calculated as follows:
Figure 4 illustrates this characteristic pressure distribution in Hertzian contact theory, showing how pressure maximizes at the center and gradually diminishes towards the contact boundaries. This is a fundamental aspect of the contact pressure equalization mechanism [
13].
A key characteristic of Hertzian contact theory is the nonlinear expansion of the contact area with increasing load. In curved surface contact, the relationship between contact area and load follows:
From this, the average stress per unit area
σavg is derived as follows:
Equation (7) demonstrates a self-limiting characteristic where the rate of stress increase diminishes as load increases. For example, when the load increases by a factor of 8, the average stress increases by only a factor of 2. This characteristic plays a crucial role in preventing maximum equivalent stress from exceeding the material’s compressive strength in high-pressure environments.
The maximum shear stress (
τmax) occurring under high-pressure conditions has the following relationship with the maximum contact pressure [
19]:
This equation predicts the magnitude of internal shear stress caused by contact pressure. The maximum shear stress typically occurs at a depth of approximately 0.48 below the surface and directly affects the yielding behavior of the material.
These principles of Hertzian contact theory are essential for understanding the relationship between contact pressure at low-pressure conditions (2.0 MPa), which determines valve sealing performance, and maximum equivalent stress at high-pressure conditions (87.5 MPa), which determines durability. Since these performance metrics conflict, especially in ultra-high-pressure hydrogen environments, we must quantitatively analyze the behavior of various contact geometries through finite element analysis.
2.4. Curvature Ratio and Conformity Effects
The seat curvature radius
Rs does not directly participate in initial contact but significantly influences the deformation pattern and stress distribution of the plunger as pressure increases. The geometric constraint effect and conformity relationships (Equations (9)–(12)) discussed in this section build upon classical contact mechanics principles, with similar formulations found in the established literature [
20].
Rs affects stress distribution through the “geometric constraint effect” in structural mechanics. This effect can be quantified by the following equation:
where
ηc is the contact constraint coefficient, which determines the contact pressure distribution and stress concentration phenomena.
In the conformity theory of contact mechanics, the ratio of
Rp to
Rs acts as a key factor determining the conformity of contact. The conformity coefficient (
γ) is defined as follows:
This conformity coefficient serves as a dimensionless parameter representing the geometric characteristics of the contact geometry, influencing the distribution of contact pressure and maximum equivalent stress. Contact area A varies with load F as follows:
Equation (11) presents the explicit formula for determining the circular contact area, A, which is derived from the contact radius a (as defined in Equation (4)) and incorporates the material properties E* and the equivalent radius of curvature Req. This formulation quantitatively expresses the general Hertzian principle, proportionally indicated by Equation (6), wherein the contact area exhibits a nonlinear expansion with increasing load. Such nonlinear expansion underpins the “self-adjustment” mechanism characteristic of the concave contact geometry. Consequently, the contact characteristics, which are influenced by this area expansion, vary depending on whether γ < 1 (Rp < Rs) and when γ > 1 (Rp > Rs).
A small R_s value can restrict lateral deformation of the plunger material, potentially causing stress concentration, while a large
Rs value allows the plunger material to deform over a wider area, contributing to stress distribution. PAI has a significantly lower elastic modulus (4.5 GPa) than aluminum bronze alloy (117 GPa), resulting in most deformation occurring on the plunger side during contact. This asymmetric deformation characteristic affects the strain compatibility condition expressed by the following equation:
where
δp and
δs are the deformation amounts of the plunger and seat, respectively. Substituting the material properties of PAI and aluminum bronze alloy yields
δp/δs ≈ 26, indicating that deformation on the plunger side is approximately 26 times greater than that of the seat.
The eccentricity e is another critical design variable determining contact pressure distribution and maximum equivalent stress location. Eccentricity determines the initial contact position, and as eccentricity increases, the contact point moves further outward toward the seat edge. It also influences the distribution pattern of contact pressure, and appropriate eccentricity induces the contact pressure concentration required at low-pressure conditions.
The proposed Rp > Rs configuration fundamentally challenges conventional contact mechanics principles. Traditional sealing approaches have assumed that conforming geometries (Rp < Rs) provide optimal stress distribution through geometric compliance, a paradigm validated primarily through empirical testing. However, this study demonstrates that strategic exploitation of material property asymmetry in non-conforming geometries can achieve superior performance under extreme conditions. This represents a theoretical advancement that extends Hertzian contact principles to dissimilar material combinations, establishing a new sealing model specifically designed for ultra-high-pressure pilot-operated valves and contributing to the fundamental understanding of extreme pressure contact mechanics.
While the mathematical models above quantitatively explain the influence of key design variables, they have several important limitations. Hertzian contact theory assumes ideal elastic contact, but in actual ultra-high-pressure environments, nonlinear material behavior and elastoplastic deformation occur. Additionally, the complex geometric shape of the concave contact geometry and the behavior changes across a wide pressure range (2.0 MPa to 87.5 MPa) are difficult to fully explain with a single theoretical model. Therefore, to overcome these theoretical limitations and precisely analyze the key performance metrics of contact pressure at low pressure and maximum equivalent stress at high pressure, numerical analysis through FEA is essential.
3. Preliminary Analysis and Design Direction
3.1. Preliminary Analysis Conditions
This section details the preliminary finite element analysis (FEA) performed to establish an initial design direction for the ultra-high-pressure hydrogen solenoid valve. The FEA aimed to compare the performance of the proposed concave contact geometry with that of a conventional rectangular contact geometry. Two configurations of the concave geometry were investigated: one with the plunger curvature radius greater than the seat curvature radius
Rp >
Rs, and another with
Rp <
Rs. For these initial simulations, eccentricity
e was maintained at 1.0 mm to isolate the influence of the curvature radii. The specific geometric design variables for these three initial contact configurations (conventional rectangular, concave
Rp >
Rs, and concave
Rp <
Rs) are detailed in
Table 1. The results of this preliminary analysis informed the subsequent optimization study presented in
Section 4.
The FEA was conducted using the commercial software ANSYS Mechanical 2023 R2 [
21]. The material properties assigned to the plunger (Polyamide-imide, PAI) and the seat (Aluminum Bronze) for the FEA are detailed in
Table 2.
PAI was selected for its favorable hydrogen penetration resistance and dimensional stability, while aluminum bronze offers good resistance to hydrogen embrittlement, corrosion, and wear. To accurately capture the elasto-plastic response of the PAI plunger under the anticipated high-stress conditions, a multilinear kinematic hardening (MKIN) model was adopted, defined using experimental stress-strain data. A summary of the key parameters for the numerical setup, including element type and meshing details, is provided in
Table 3.
A two-dimensional axisymmetric model was developed, for which 4-node structural solid elements (e.g., PLANE182 or an equivalent type in ANSYS Workbench) were employed. These lower-order quadrilateral elements were chosen for their balance of accuracy in stress analysis and computational efficiency, particularly for problems involving non-linear material behavior and contact under axisymmetric conditions.
The finite element model, including mesh details, contact definition, and applied boundary conditions, is illustrated in
Figure 5. As shown in
Figure 5a, the mesh was significantly refined in the critical contact area between the plunger and seat, with a minimum element size of approximately 4.29 µm. An average element quality metric of 0.93 was maintained. This level of mesh refinement and element quality in the critical contact zone is considered sufficient to yield reliable stress and contact pressure results for the geometries analyzed.
The frictional contact interface between the plunger and seat surfaces, highlighted in
Figure 5b, was modeled using the augmented Lagrangian method. A friction coefficient of 0.2 was applied, reflecting typical values for the contact between polymer (PAI) and metallic (bronze) surfaces, assuming a conservative dry contact scenario for this study.
The applied boundary conditions and loading are depicted in
Figure 5c and summarized in
Table 3. A fixed support constraint was applied to the outer boundary of the seat. A uniformly distributed pressure, ranging from 0 MPa to 87.5 MPa, was applied to the upper surface of the plunger. The FEA simulations incorporated both material nonlinearity and large deflection effects. The combination of these modeling choices provides a comprehensive setup for the preliminary FEA.
3.2. Preliminary Analysis Results and Design Direction
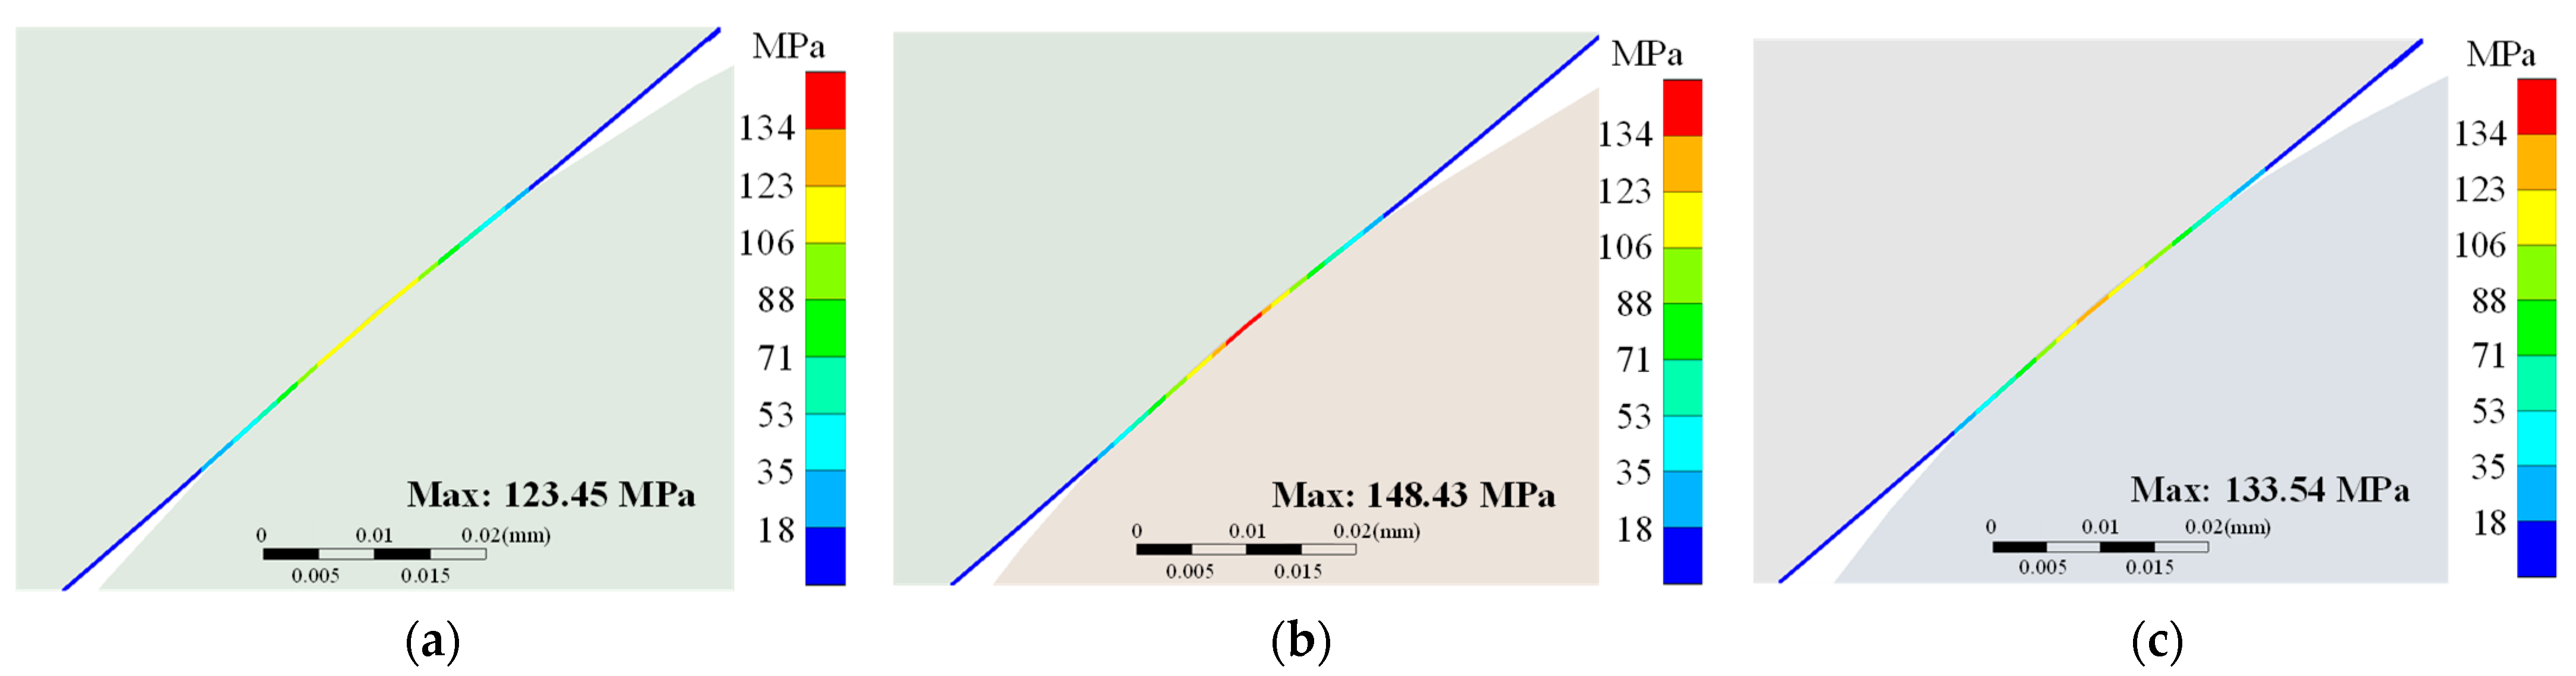
Finite element analysis of the three contact geometries revealed quantifiable performance differences. At low pressure (2.0 MPa), the maximum contact pressure was 123.45 MPa for rectangular contact geometry, 148.43 MPa for concave contact geometry with
Rp >
Rs, and 133.54 MPa for concave contact geometry with
Rp <
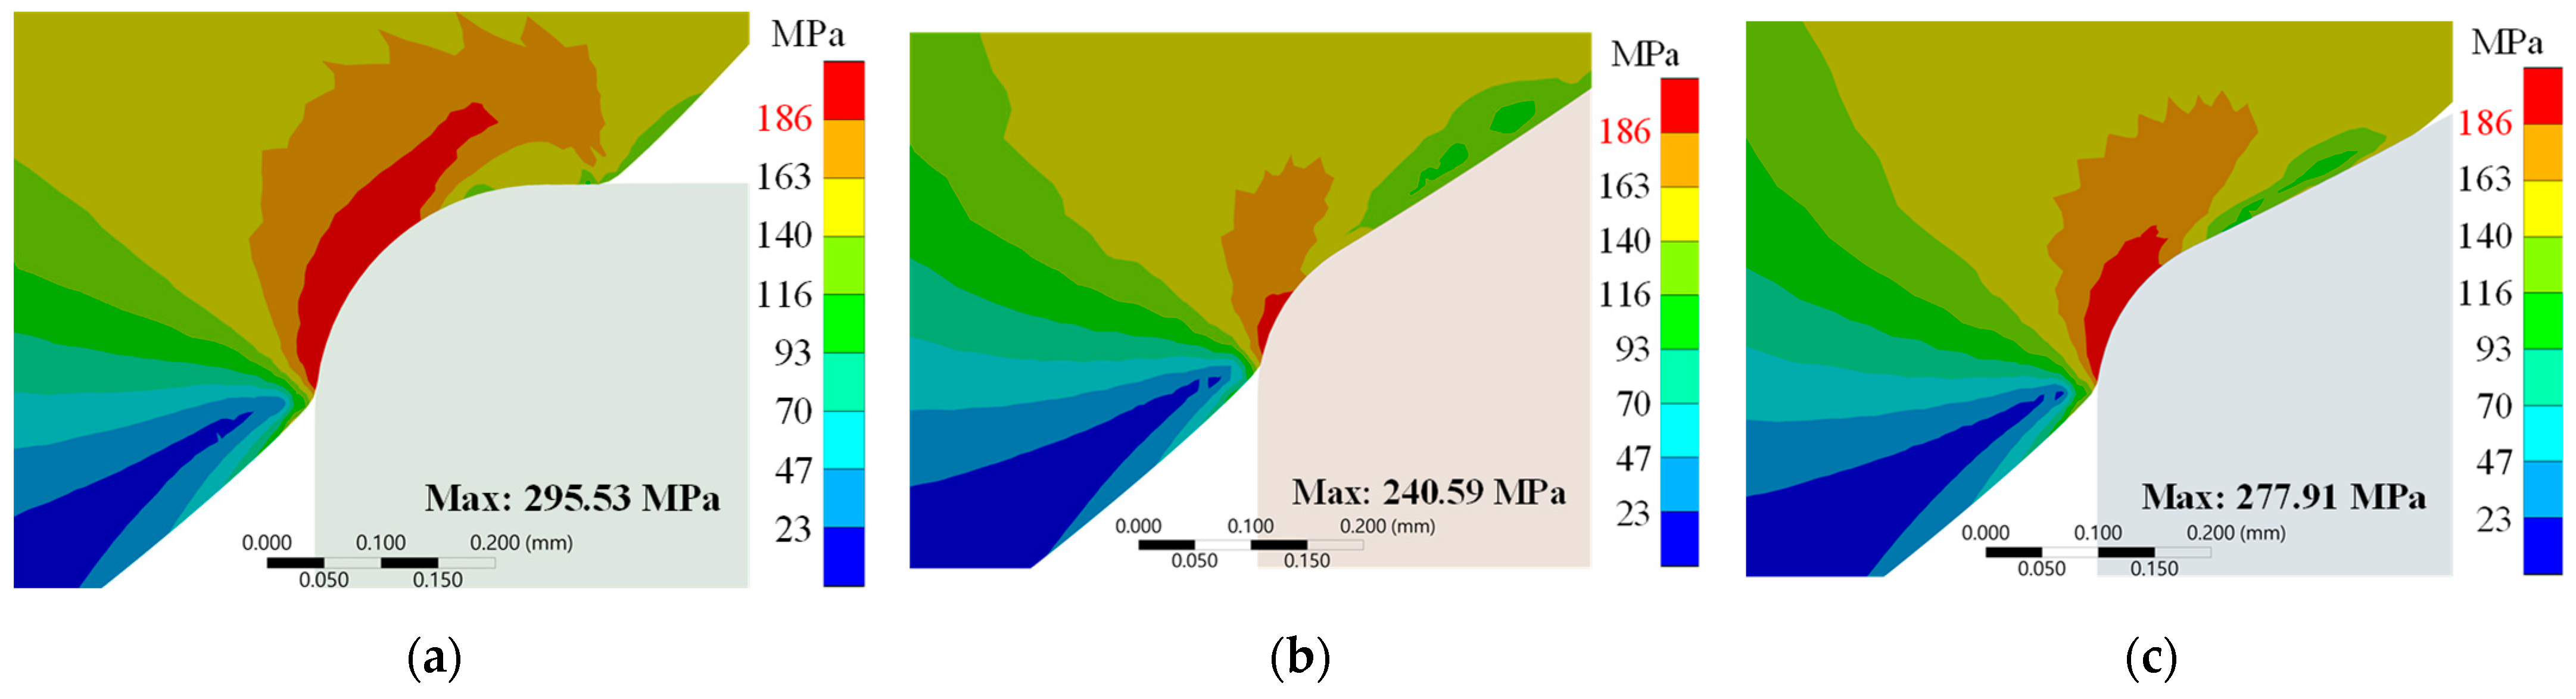
Rs. At high pressure (87.5 MPa), the maximum equivalent stress measured 295.53 MPa, 240.59 MPa, and 277.91 MPa for the respective designs.
Table 4 summarizes these quantitative performance comparisons across all three contact geometry configurations. These values indicate that concave contact geometry with
Rp >
Rs achieved 20.2% higher contact pressure at low pressure and 18.6% lower maximum equivalent stress at high pressure compared to rectangular contact geometry.
Contact pressure distributions depicted in
Figure 6 demonstrate distinct patterns across the three configurations. The rectangular contact geometry exhibits pressure concentration at the edge contact region. The concave contact geometry with
Rp >
Rs shows a contact pressure distribution with higher peak values localized at the initial contact zone. This increased pressure concentration correlates with the constraint coefficient (
ηc = 0.048) calculated from Equation (9), which quantifies the geometric relationship between the curved surfaces.
Stress distribution patterns at high pressure (87.5 MPa), illustrated in
Figure 7, demonstrate significant variations between designs. The rectangular contact geometry exhibits localized stress concentration at the contact edge, with values exceeding the compressive strength of PAI (186 MPa). The concave contact geometry with
Rp >
Rs displays more uniform stress distribution across the contact region. The concave contact geometry with
Rp <
Rs shows intermediate stress distribution characteristics. This behavior aligns with Hertzian contact theory predictions in Equation (7), which establishes that in curved contact geometries, stress increase rates diminish as load increases.
Deformation analysis indicates a substantial difference in material response between the plunger and seat components. The elastic modulus ratio between aluminum bronze alloy (117 GPa) and PAI (4.5 GPa) results in asymmetric deformation behavior. The strain compatibility condition in Equation (12) predicts a deformation ratio (δp/δs) of approximately 26, indicating that the plunger experiences significantly greater deformation than the seat. This deformation characteristic influences both contact pressure generation at low pressure and stress distribution at high pressure.
The conformity coefficient (γ = 1.1) of the concave contact geometry with Rp > Rs, as defined by Equation (10), quantifies the geometric relationship between the contacting surfaces. This value contrasts with conventional contact geometry approaches, where Rp < Rs configurations (γ < 1) are typical. The analysis data indicate that the Rp > Rs configuration provides a more effective balance between the opposing requirements of high contact pressure at low operating pressures and low maximum equivalent stress at high operating pressures.
Based on the analysis results, the concave contact geometry with Rp > Rs demonstrates the most favorable performance metrics for ultra-high-pressure hydrogen valve applications. However, the maximum equivalent stress (240.59 MPa) remains above the compressive strength of PAI (186 MPa), indicating further optimization is required. The subsequent optimization study will focus on adjusting the curvature radii Rp and Rs and eccentricity e parameters to reduce maximum equivalent stress below the material’s compressive strength while maintaining sufficient contact pressure for effective sealing at low-pressure conditions.
4. Design Optimization
4.1. Optimization Methodology
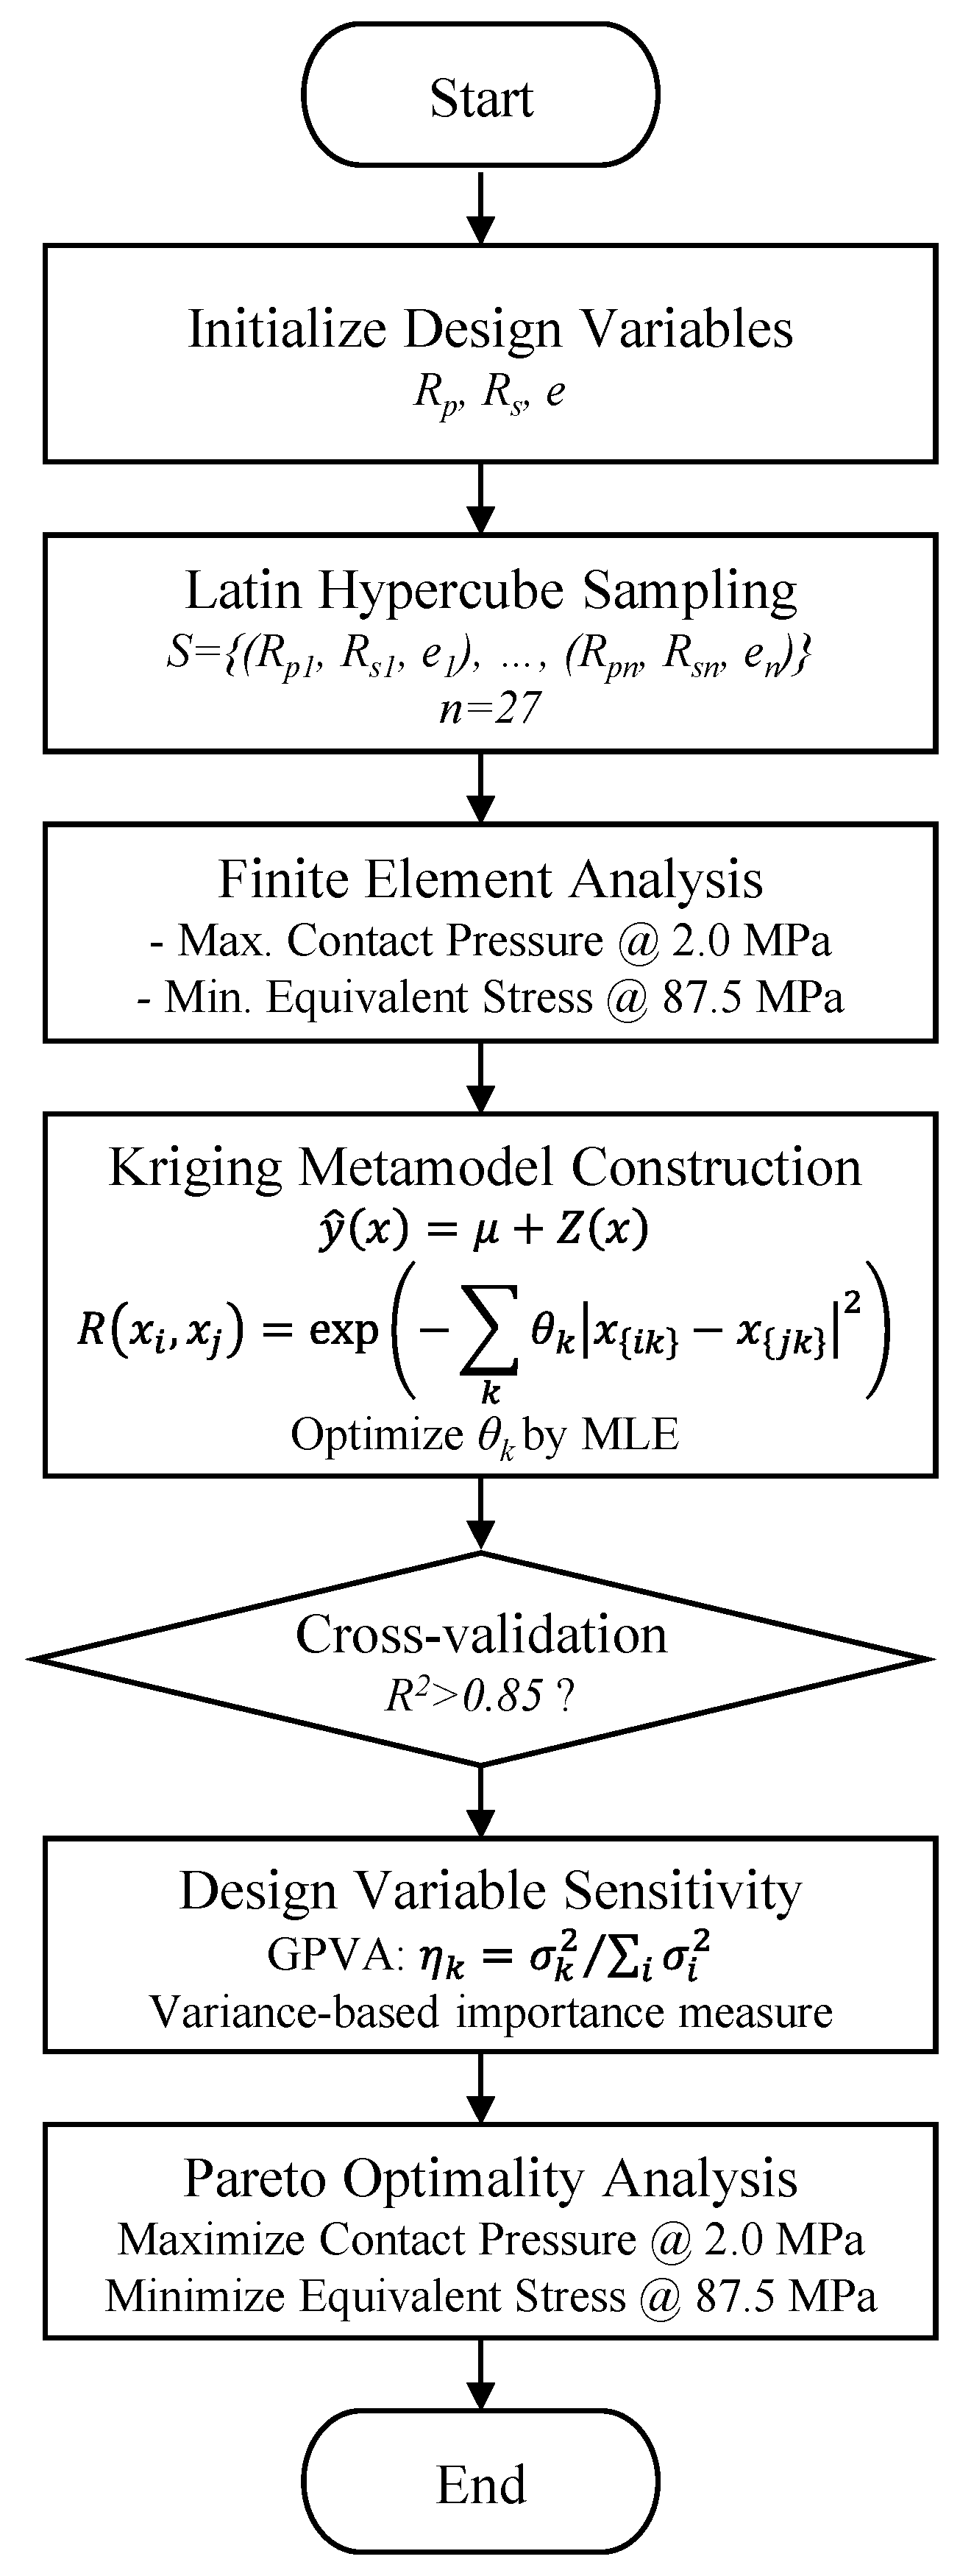
For contact geometry design optimization, we developed and implemented an Integrated Multi-stage Adaptive Sequential Optimization (IMASO) algorithm.
Figure 8 presents the comprehensive workflow of this algorithm, showing the systematic progression from initial sampling through metamodel construction to final optimization and validation.
To efficiently explore the design space, we employed a 3
3 LHS design consisting of 27 systematically distributed sampling points. We carefully selected the design variables and their ranges, as detailed in
Table 5, based on preliminary analysis and manufacturing constraints, ensuring practical implementability of the optimized design.
We subjected each of the 27 design configurations to detailed FEA to evaluate two critical performance metrics: maximum contact pressure at low pressure (2.0 MPa) and maximum equivalent stress at high pressure (87.5 MPa).
Table 6 presents these analysis results, revealing significant performance variations across the design space and highlighting the potential for substantial improvement through optimization.
Based on these results, we constructed a kriging metamodel using the established statistical framework commonly employed in the design optimization literature, expressed as follows [
14,
15]:
where
ŷ(x) is the predicted response at design point
x,
μ is the global trend function, and
Z(x) represents local deviations. The spatial correlation necessary for computing
Z(x) is quantified by the following:
where
θk are correlation parameters that determine how rapidly correlation decreases with distance in each dimension.
To determine optimal values for
θk, we maximized the log-likelihood function:
The correlation matrix R is constructed using Equation (14), and Y contains the observed responses at sampling points. By maximizing this function, we identified correlation parameters that best capture the data patterns, thus completing the kriging model. This sequence establishes a clear relationship between the three equations: Equation (13) defines the model structure, Equation (14) provides the correlation function needed to calculate Z(x), and Equation (15) optimizes the parameters of Equation (14).
The model demonstrated high prediction accuracy during 5-fold cross-validation, with R2 = 0.91 (RMSE = 5.42 MPa) for contact pressure and R2 = 0.88 (RMSE = 12.75 MPa) for equivalent stress. This validated metamodel was then used to identify optimal designs balancing the competing objectives.
4.2. Sensitivity Analysis of Design Parameters
Using the established kriging metamodel, we conducted Gaussian Process Regression Variance Analysis (GPVA) to quantitatively analyze the influence of design variables on contact pressure and equivalent stress, identifying optimal parameter ranges for design optimization.
GPVA quantifies input variables’ contribution to output variability by analyzing the variance structure of the stochastic process
Z(x) in Equation (13). Following standard variance analysis methodologies in metamodeling, the influence coefficient (
η) of each design variable is calculated as [
14]:
where
σk2 represents the variance contribution of the kth design variable, and
Σiσi2 is the sum of all variance contributions.
Table 7 summarizes these results.
Rp demonstrated the most significant influence on both contact pressure (63.5%) and equivalent stress (52.8%). This substantial contribution highlights Rp’s critical role in determining contact area and stress distribution characteristics.
Rs showed moderate impact, contributing 24.3% to contact pressure and 32.4% to equivalent stress. The nonlinear influence suggests complex interactions within the mechanical system.
Eccentricity e had the least influence, accounting for 12.2% of contact pressure and 14.8% of equivalent stress variations. Despite its minimal contribution, variations in e consistently affected both contact pressure and equivalent stress.
4.3. Design Space Exploration
The sensitivity analysis provided crucial insights into the influence of design variables on valve performance. We leveraged this information to efficiently explore the design space and identify optimal configurations.
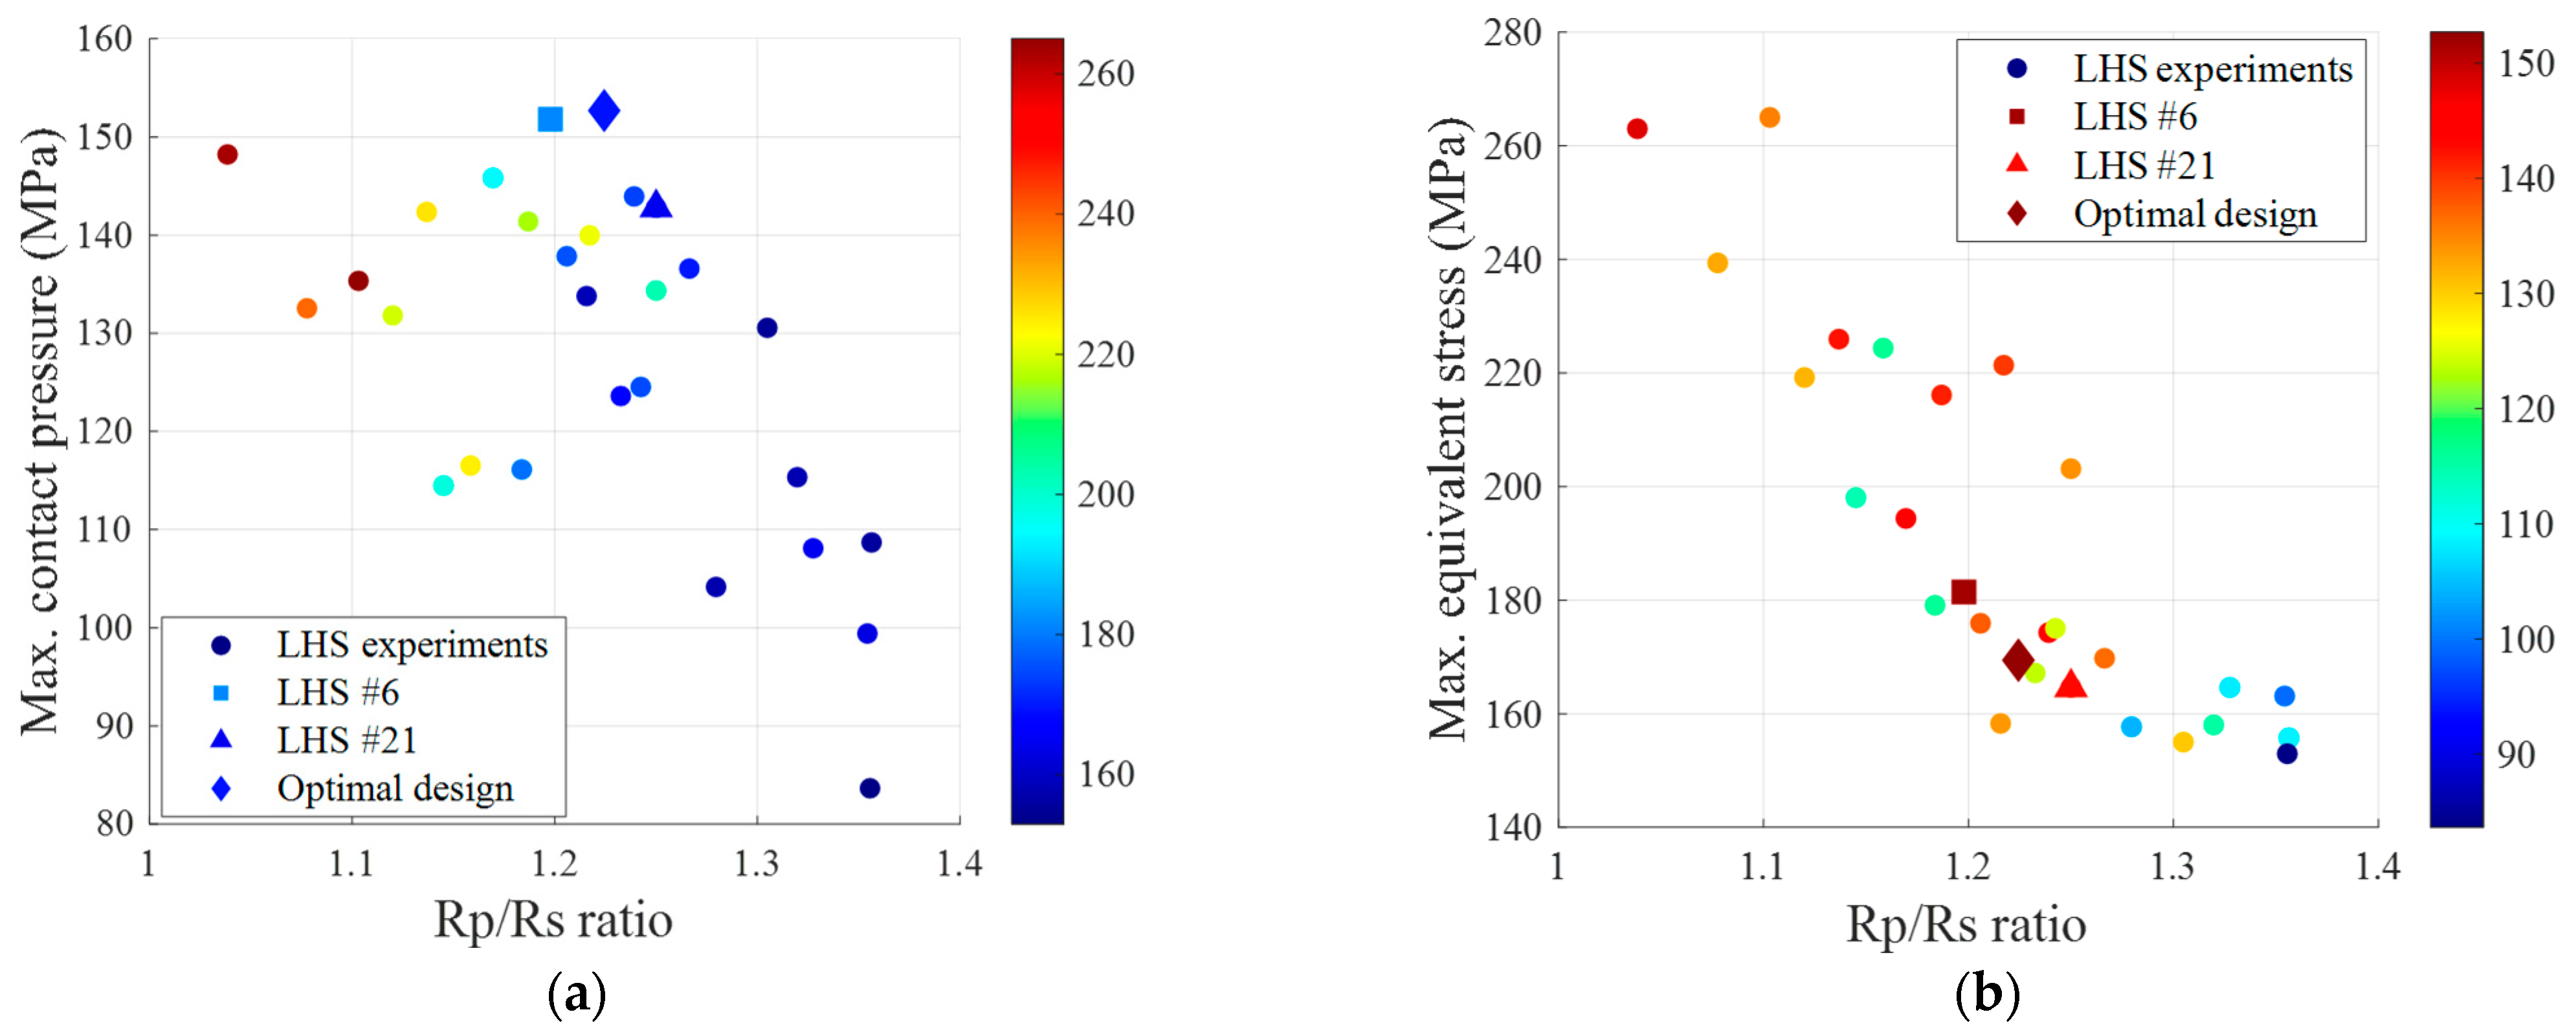
Figure 9 illustrates the relationship between the
Rp/Rs ratio and performance metrics. In
Figure 9a, contact pressure reaches a maximum in the
Rp/
Rs range of 1.2–1.3, indicating the optimal operation window for the sealing mechanism. Simultaneously,
Figure 9b demonstrates the decrease in equivalent stress with increasing
Rp/Rs ratio, validating the stress distribution effect predicted by Hertzian contact theory. This behavior aligns with the geometric constraint effect quantified by
ηc from Equation (9), which influences contact pressure distribution and stress concentration phenomena.
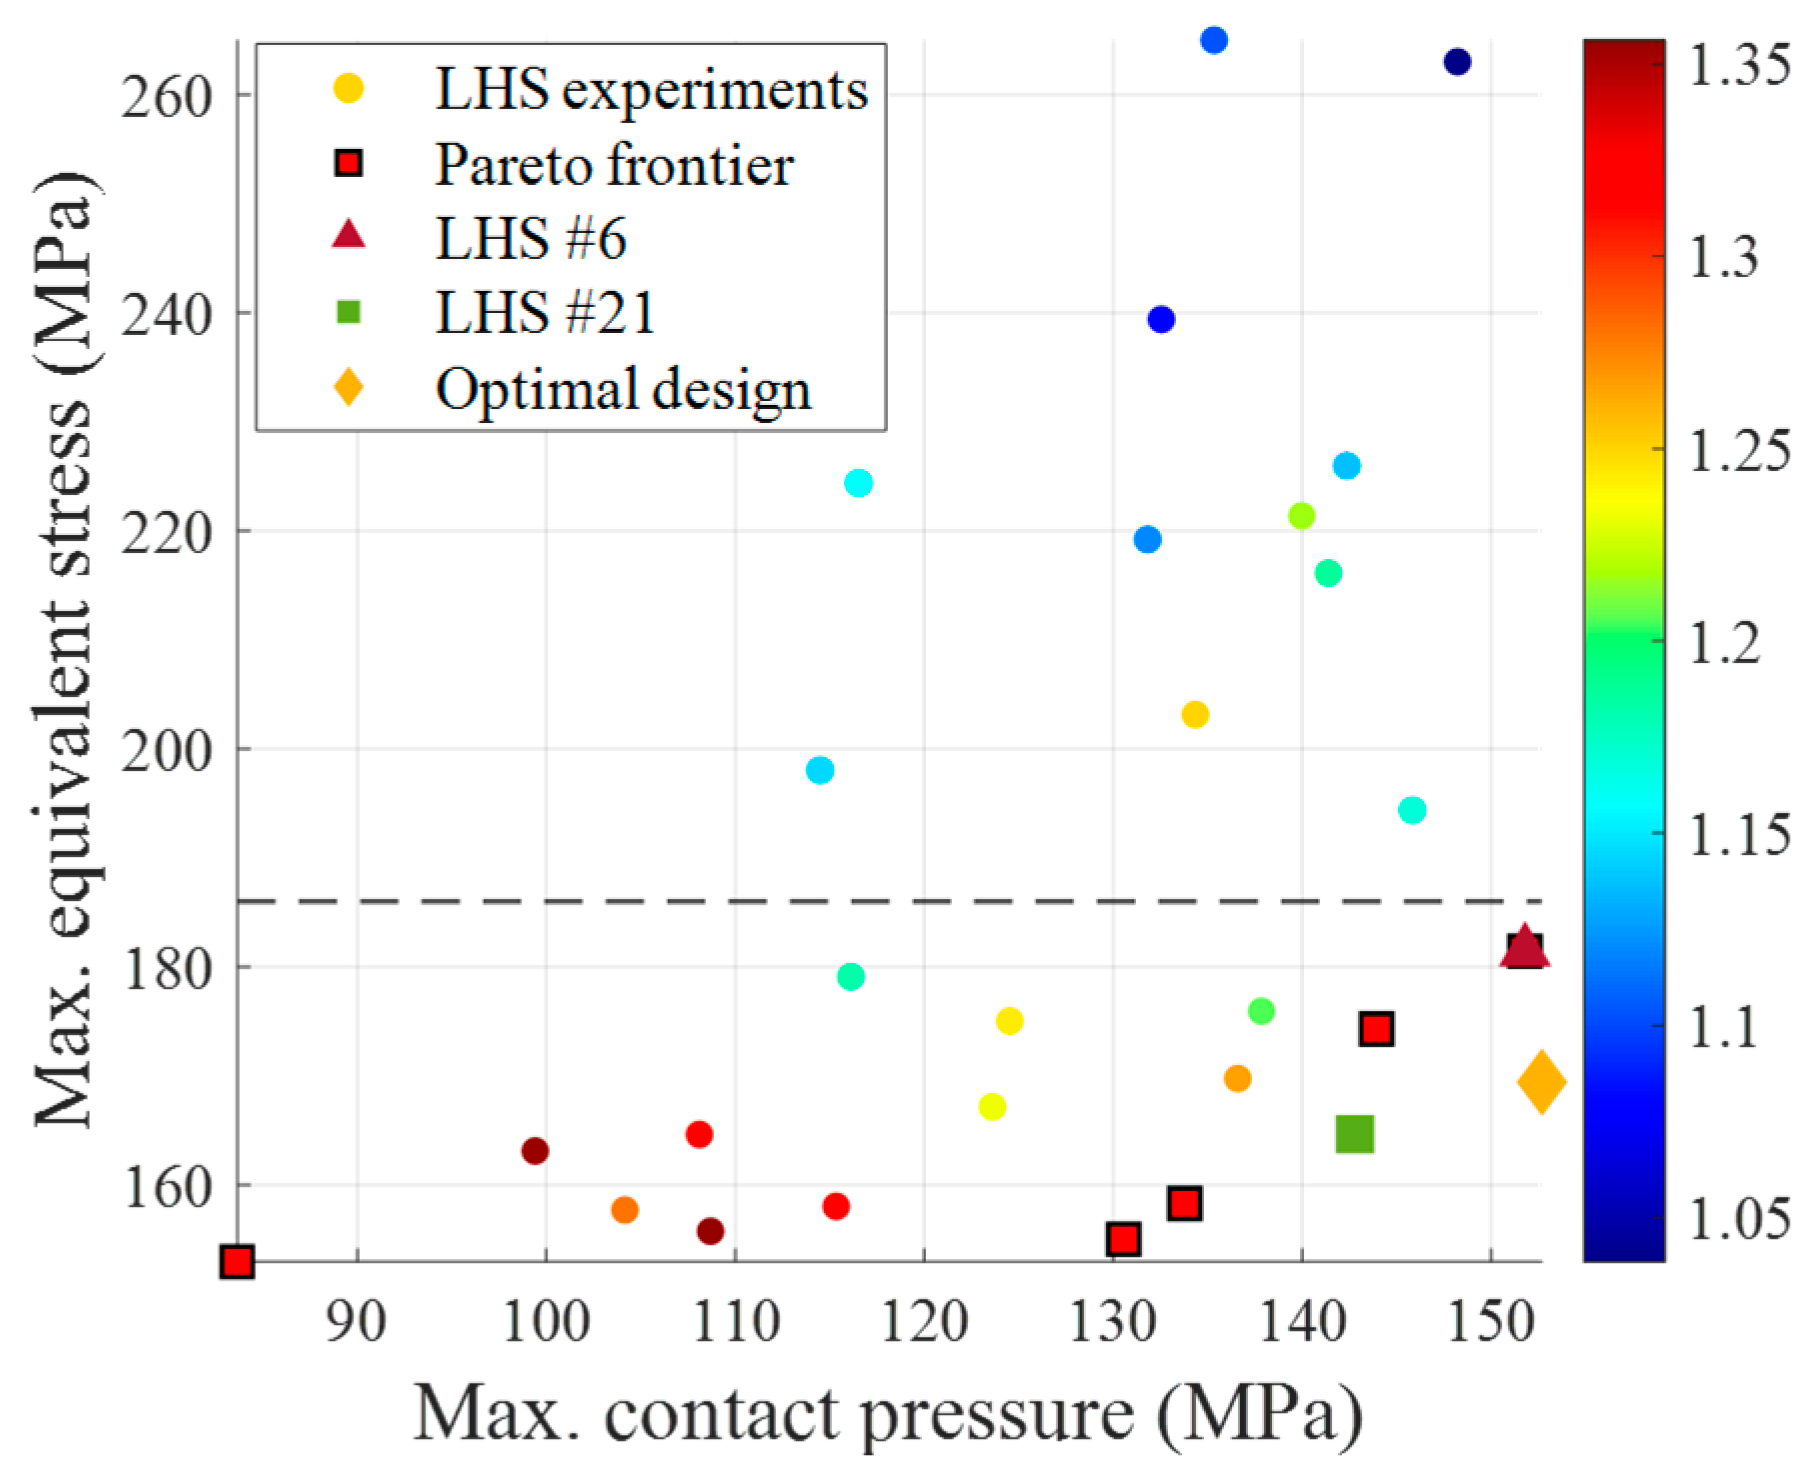
The Pareto frontier, represented by the red squares in
Figure 10, encompassed the designs offering the best compromise between contact pressure and equivalent stress. We identified two representative high-performance design points near this frontier, exhibiting distinctive performance characteristics as shown in
Table 8.
LHS Sample #6 (Rp/Rs = 1.20) demonstrated excellent sealing capability with high contact pressure (151.79 MPa) but higher equivalent stress (181.43 MPa). In contrast, LHS Sample #21 (Rp/Rs = 1.25) prioritized structural integrity with lower equivalent stress (164.65 MPa) at the expense of reduced contact pressure (142.80 MPa). This comparison underscores the inherent trade-off between sealing performance and durability, highlighting the importance of balancing these competing objectives in pursuit of an optimal design.
To leverage the advantages of these design points, we conducted an optimization process utilizing kriging metamodeling. The resulting optimal design (Rp = 5.73 mm, Rs = 4.68 mm, e = 0.95 mm) features an Rp/Rs ratio of 1.22, aligning with the theoretically optimal point from a performance perspective.
FEA validation revealed exceptional performance characteristics. As presented in
Table 9, the optimal design achieved a contact pressure of 152.69 MPa and equivalent stress of 169.42 MPa, representing improvements of 3.66% and 2.07% over the metamodel predictions (147.30 MPa, 173.04 MPa), respectively. The error between metamodel predictions and FEA results remained below 5%, confirming the high accuracy of the kriging metamodel.
The convergence of theoretical analysis and numerical results suggested that the optimal balance between low-pressure sealing performance and high-pressure durability was achieved within the Rp/Rs range of 1.2–1.25. These precise predictions and performance enhancements can be attributed to the nonlinear characteristics of Hertzian contact mechanics, effectively realizing the theoretical advantages of curved surface contact in ultra-high-pressure valve design.
4.4. Comparative Performance of Optimized Design
Comparative analysis of the optimized concave contact geometry against conventional rectangular contact geometry revealed significant performance improvements.
Figure 11 illustrates the contact pressure distribution at 2.0 MPa. The rectangular contact geometry shown in
Figure 11a exhibits concentration primarily at the edge rounding region, while the concave contact geometry presented in
Figure 11b demonstrates higher pressure with more effective distribution along the contact interface.
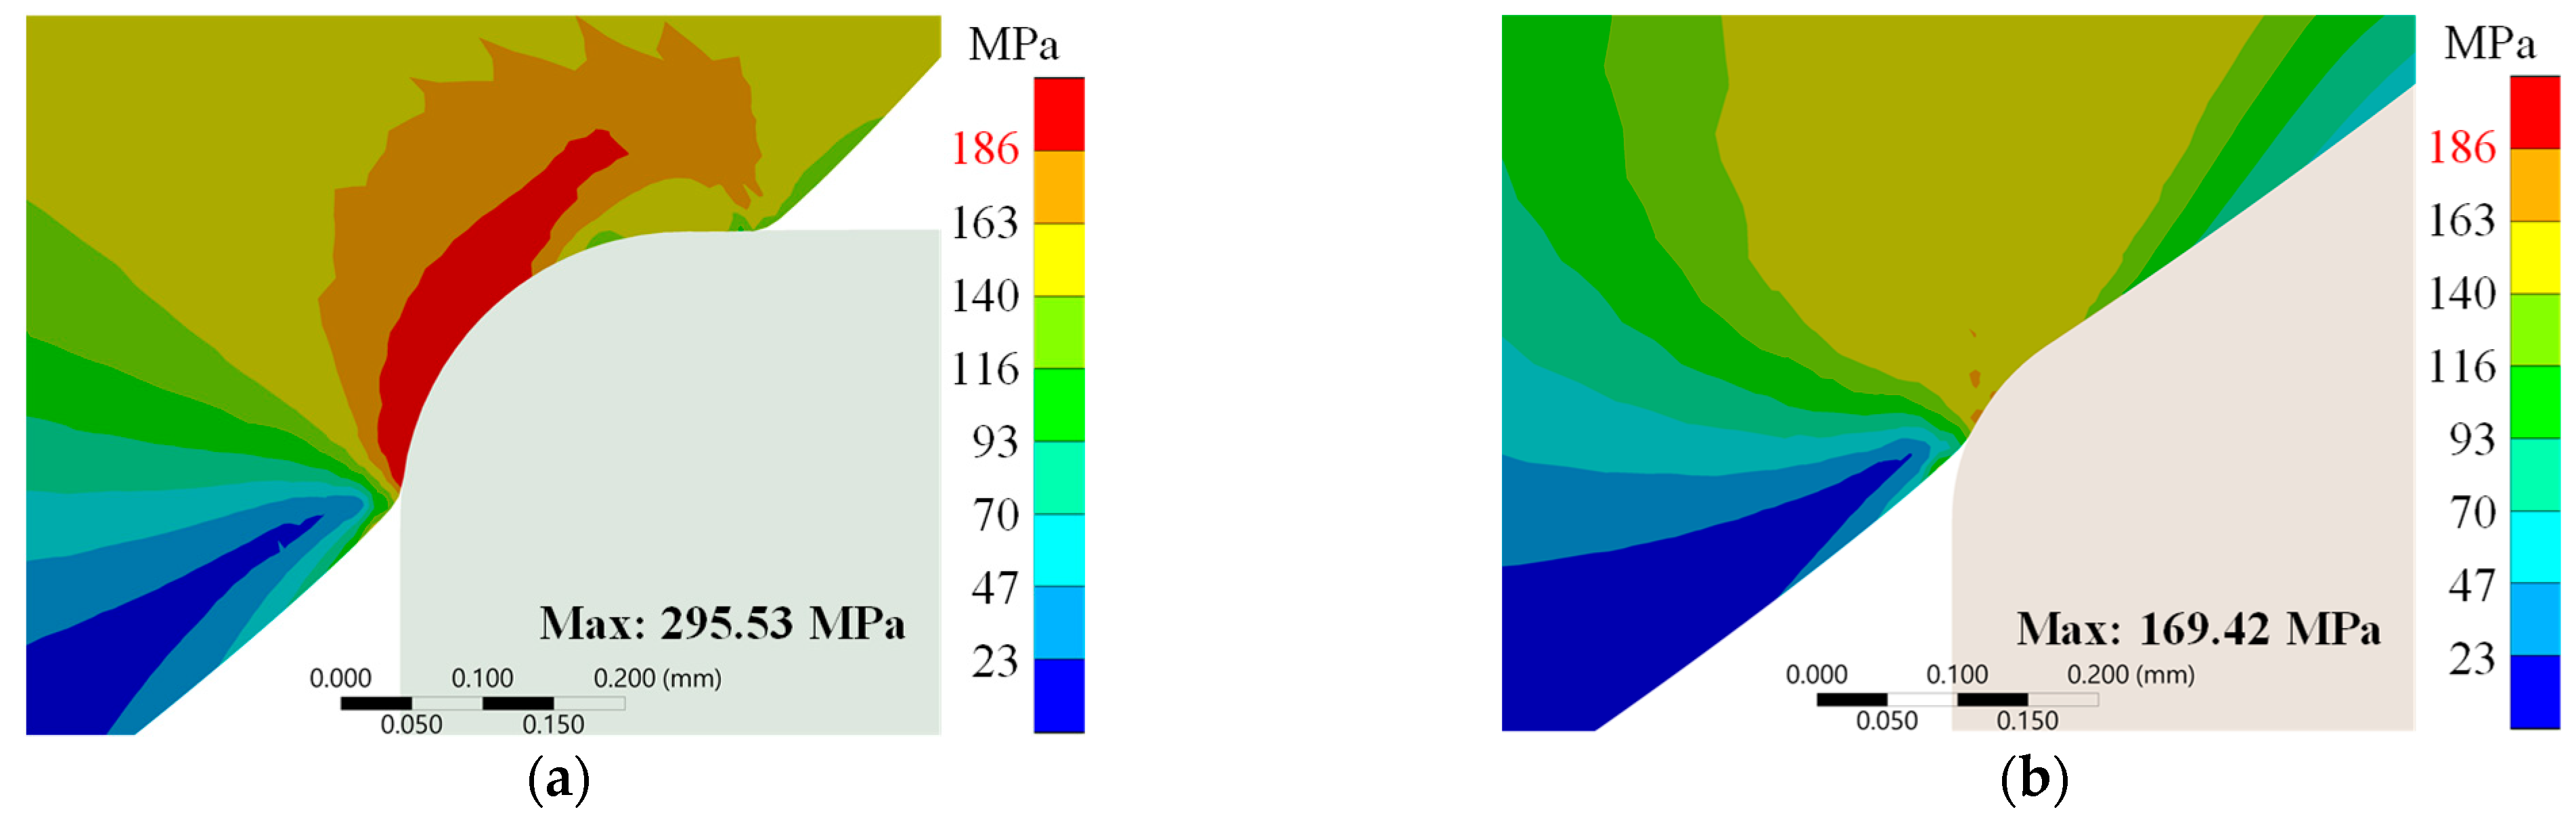
Figure 12 displays the equivalent stress distribution at 87.5 MPa. The rectangular contact geometry illustrated in
Figure 12a shows concentrated stress at the contact edge exceeding the PAI material’s compressive strength (186 MPa). The concave contact geometry shown in
Figure 12b distributes stress more uniformly, maintaining values below the compressive strength threshold.
Table 10 quantifies these performance differences. At 2.0 MPa, the concave contact geometry generates a maximum contact pressure of 152.69 MPa, 23.7% higher than the rectangular contact geometry’s 123.45 MPa. At 87.5 MPa, the concave contact geometry limits maximum equivalent stress to 169.42 MPa, 42.7% lower than the rectangular contact geometry’s 295.53 MPa.
The safety factor analysis further confirms this improvement. The concave contact geometry achieves a safety factor of 1.10, operating below the PAI material’s compressive limit, while the rectangular contact geometry’s safety factor of 0.63 indicates operation beyond compressive limits. This represents a 74.6% improvement in structural safety.
These improvements directly address the dual requirements for ultra-high-pressure hydrogen valves: effective low-pressure sealing and high-pressure structural integrity. The optimized concave contact geometry with an Rp/Rs ratio of 1.22 implements Hertzian contact principles to achieve this balance.
The stress reduction mechanism corresponds to the nonlinear expansion of contact area with increasing load as described in Equation (11). The conformity coefficient (γ = 1.22) creates optimal geometric constraint conditions that distribute stress while maintaining adequate contact pressure.
These results validate our optimization methodology and demonstrate that appropriate application of contact mechanics principles can resolve the contradictory requirements in ultra-high-pressure applications.
6. Conclusions
This study addressed the fundamental design challenge in ultra-high-pressure hydrogen solenoid valves: achieving effective sealing at low pressures while maintaining structural integrity at high pressures. We developed a novel concave contact geometry based on Hertzian contact theory that outperforms conventional rectangular designs across the entire operating pressure range.
Theoretical analysis established that concave contact geometries with Rp/Rs > 1 fundamentally alter stress distribution patterns, contradicting traditional design approaches. Finite element analysis confirmed that this configuration reduces stress concentration while increasing contact pressure.
The design was optimized using Latin hypercube sampling with 27 systematically distributed points to efficiently explore the three-dimensional design space. The kriging metamodel constructed from these simulations demonstrated high prediction accuracy (R2 > 0.88) for both performance metrics. Pareto analysis identified optimal trade-offs between contact pressure and equivalent stress, revealing that an Rp/Rs ratio between 1.2 and 1.25 yields the optimal balance. The optimized geometry (Rp = 5.73 mm, Rs = 4.68 mm, e = 0.95 mm) with Rp/Rs = 1.22 achieved 23.7% higher contact pressure at 2.0 MPa and 42.7% lower maximum equivalent stress at 87.5 MPa, improving the safety factor from 0.63 to 1.10.
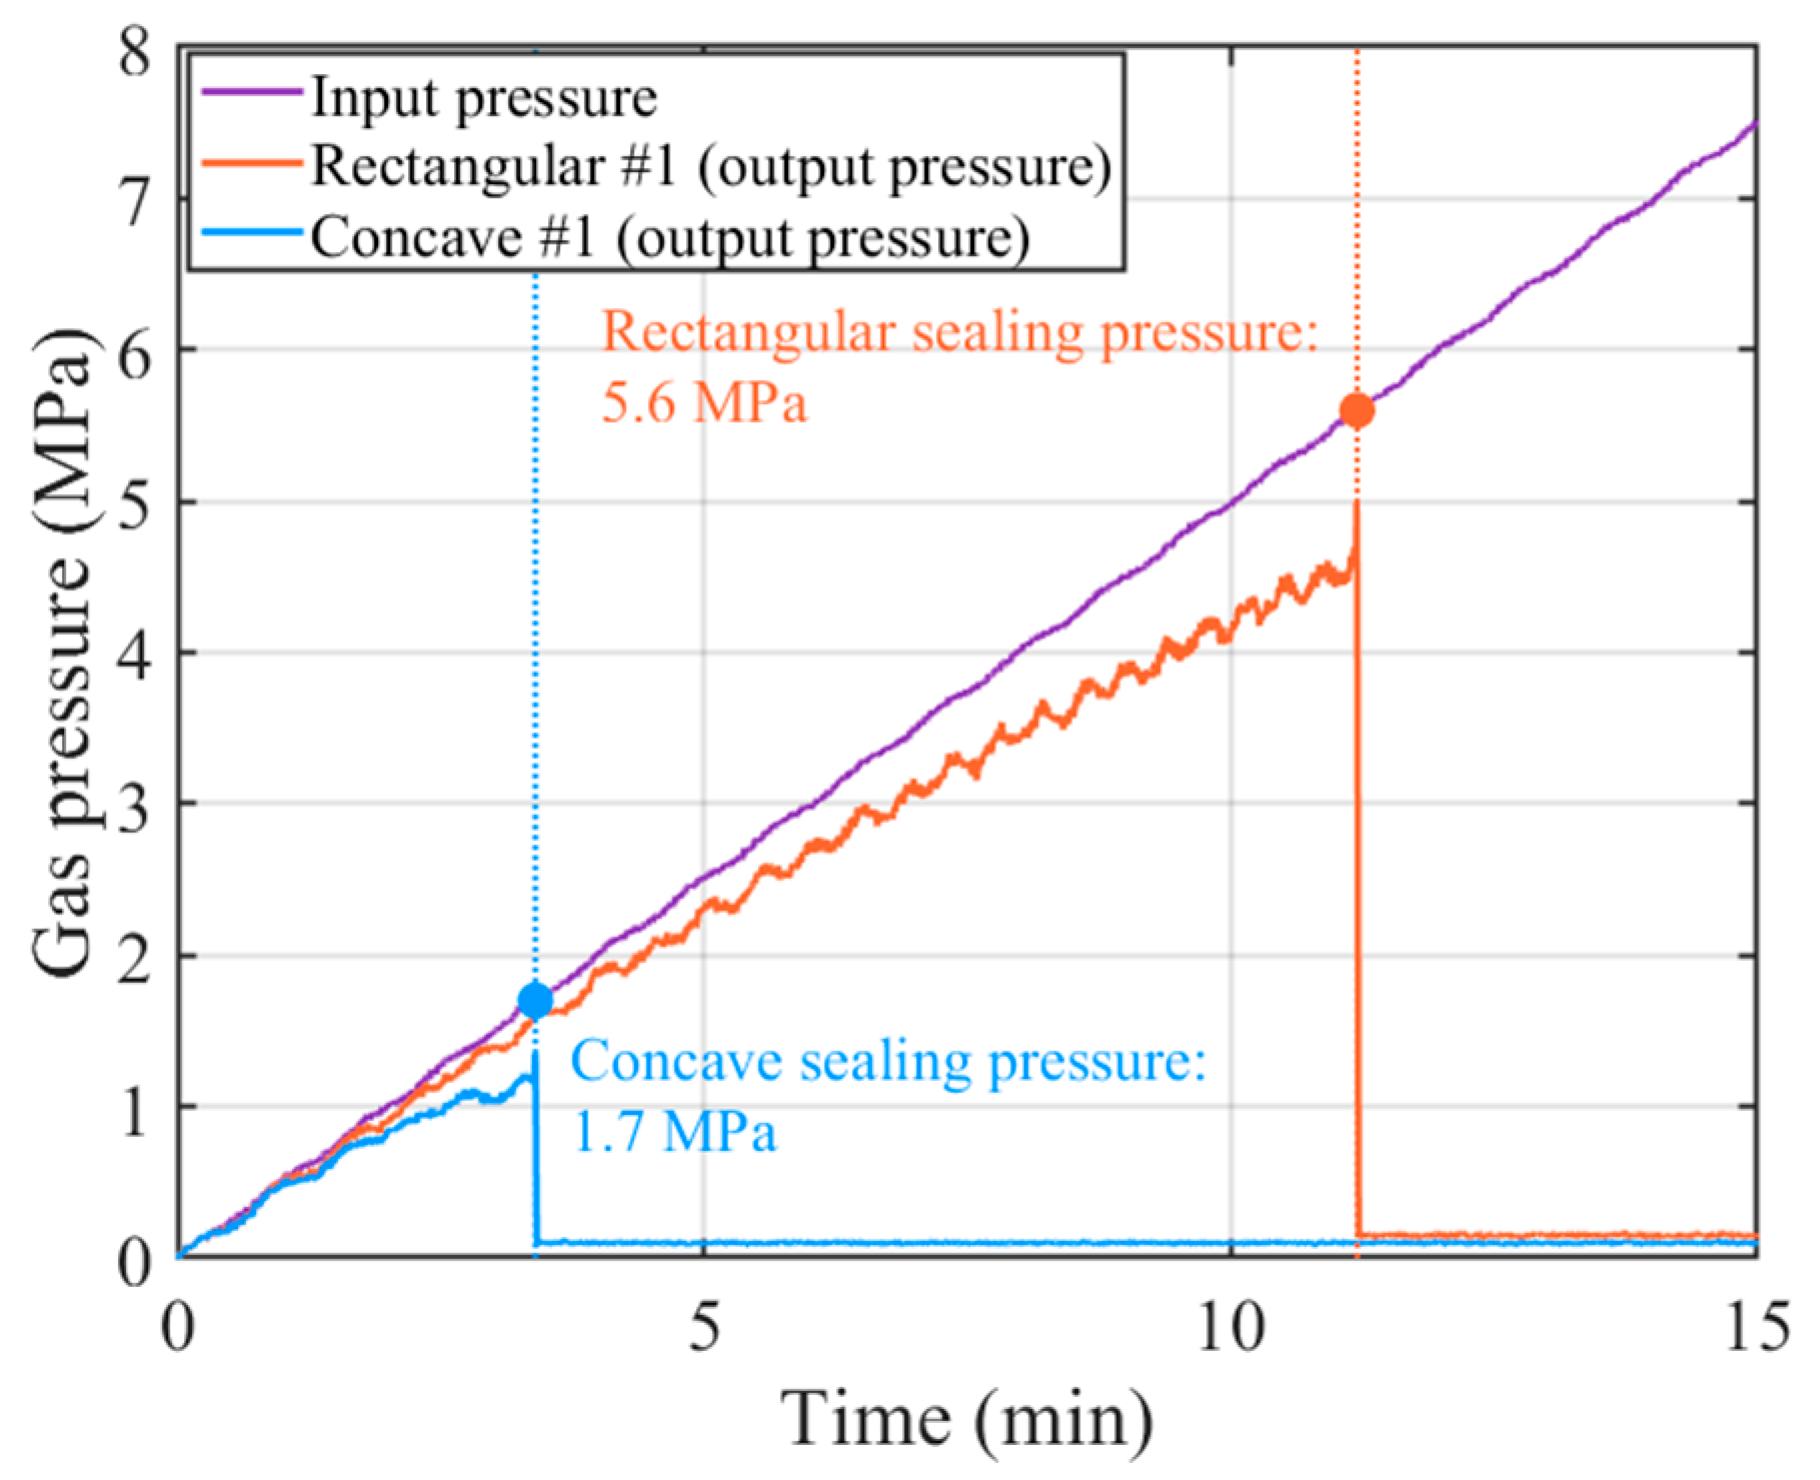
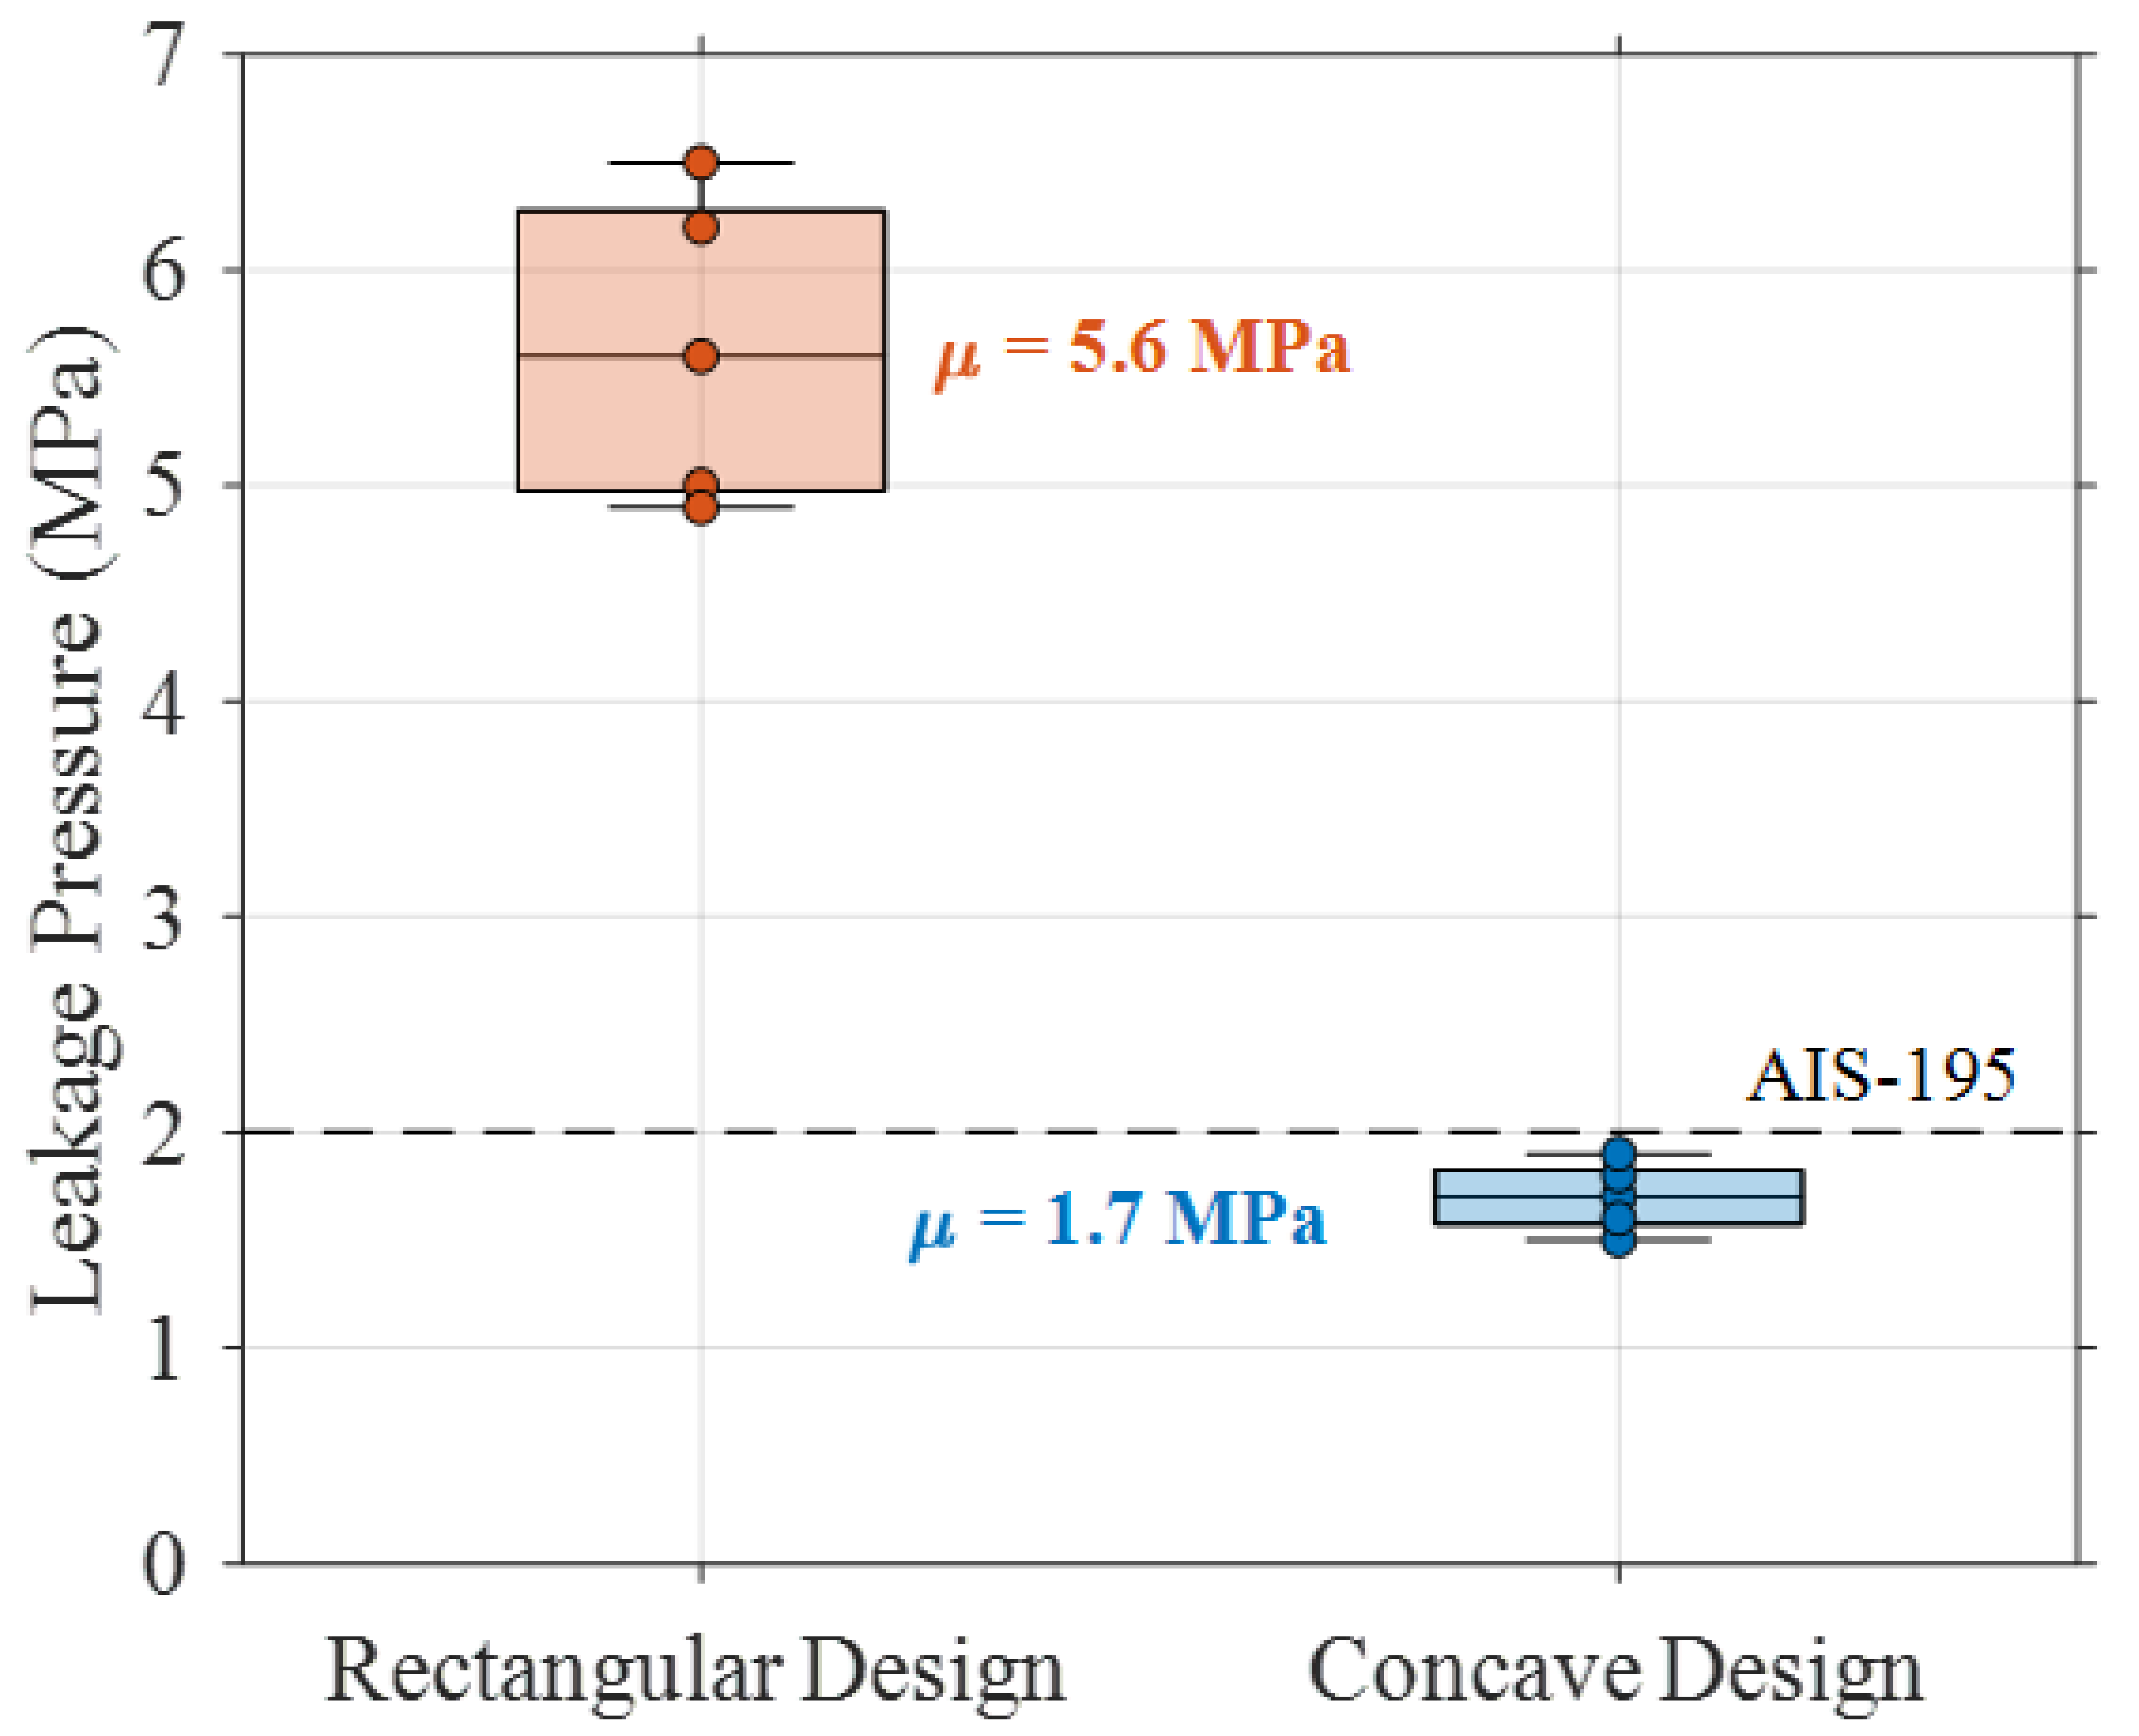
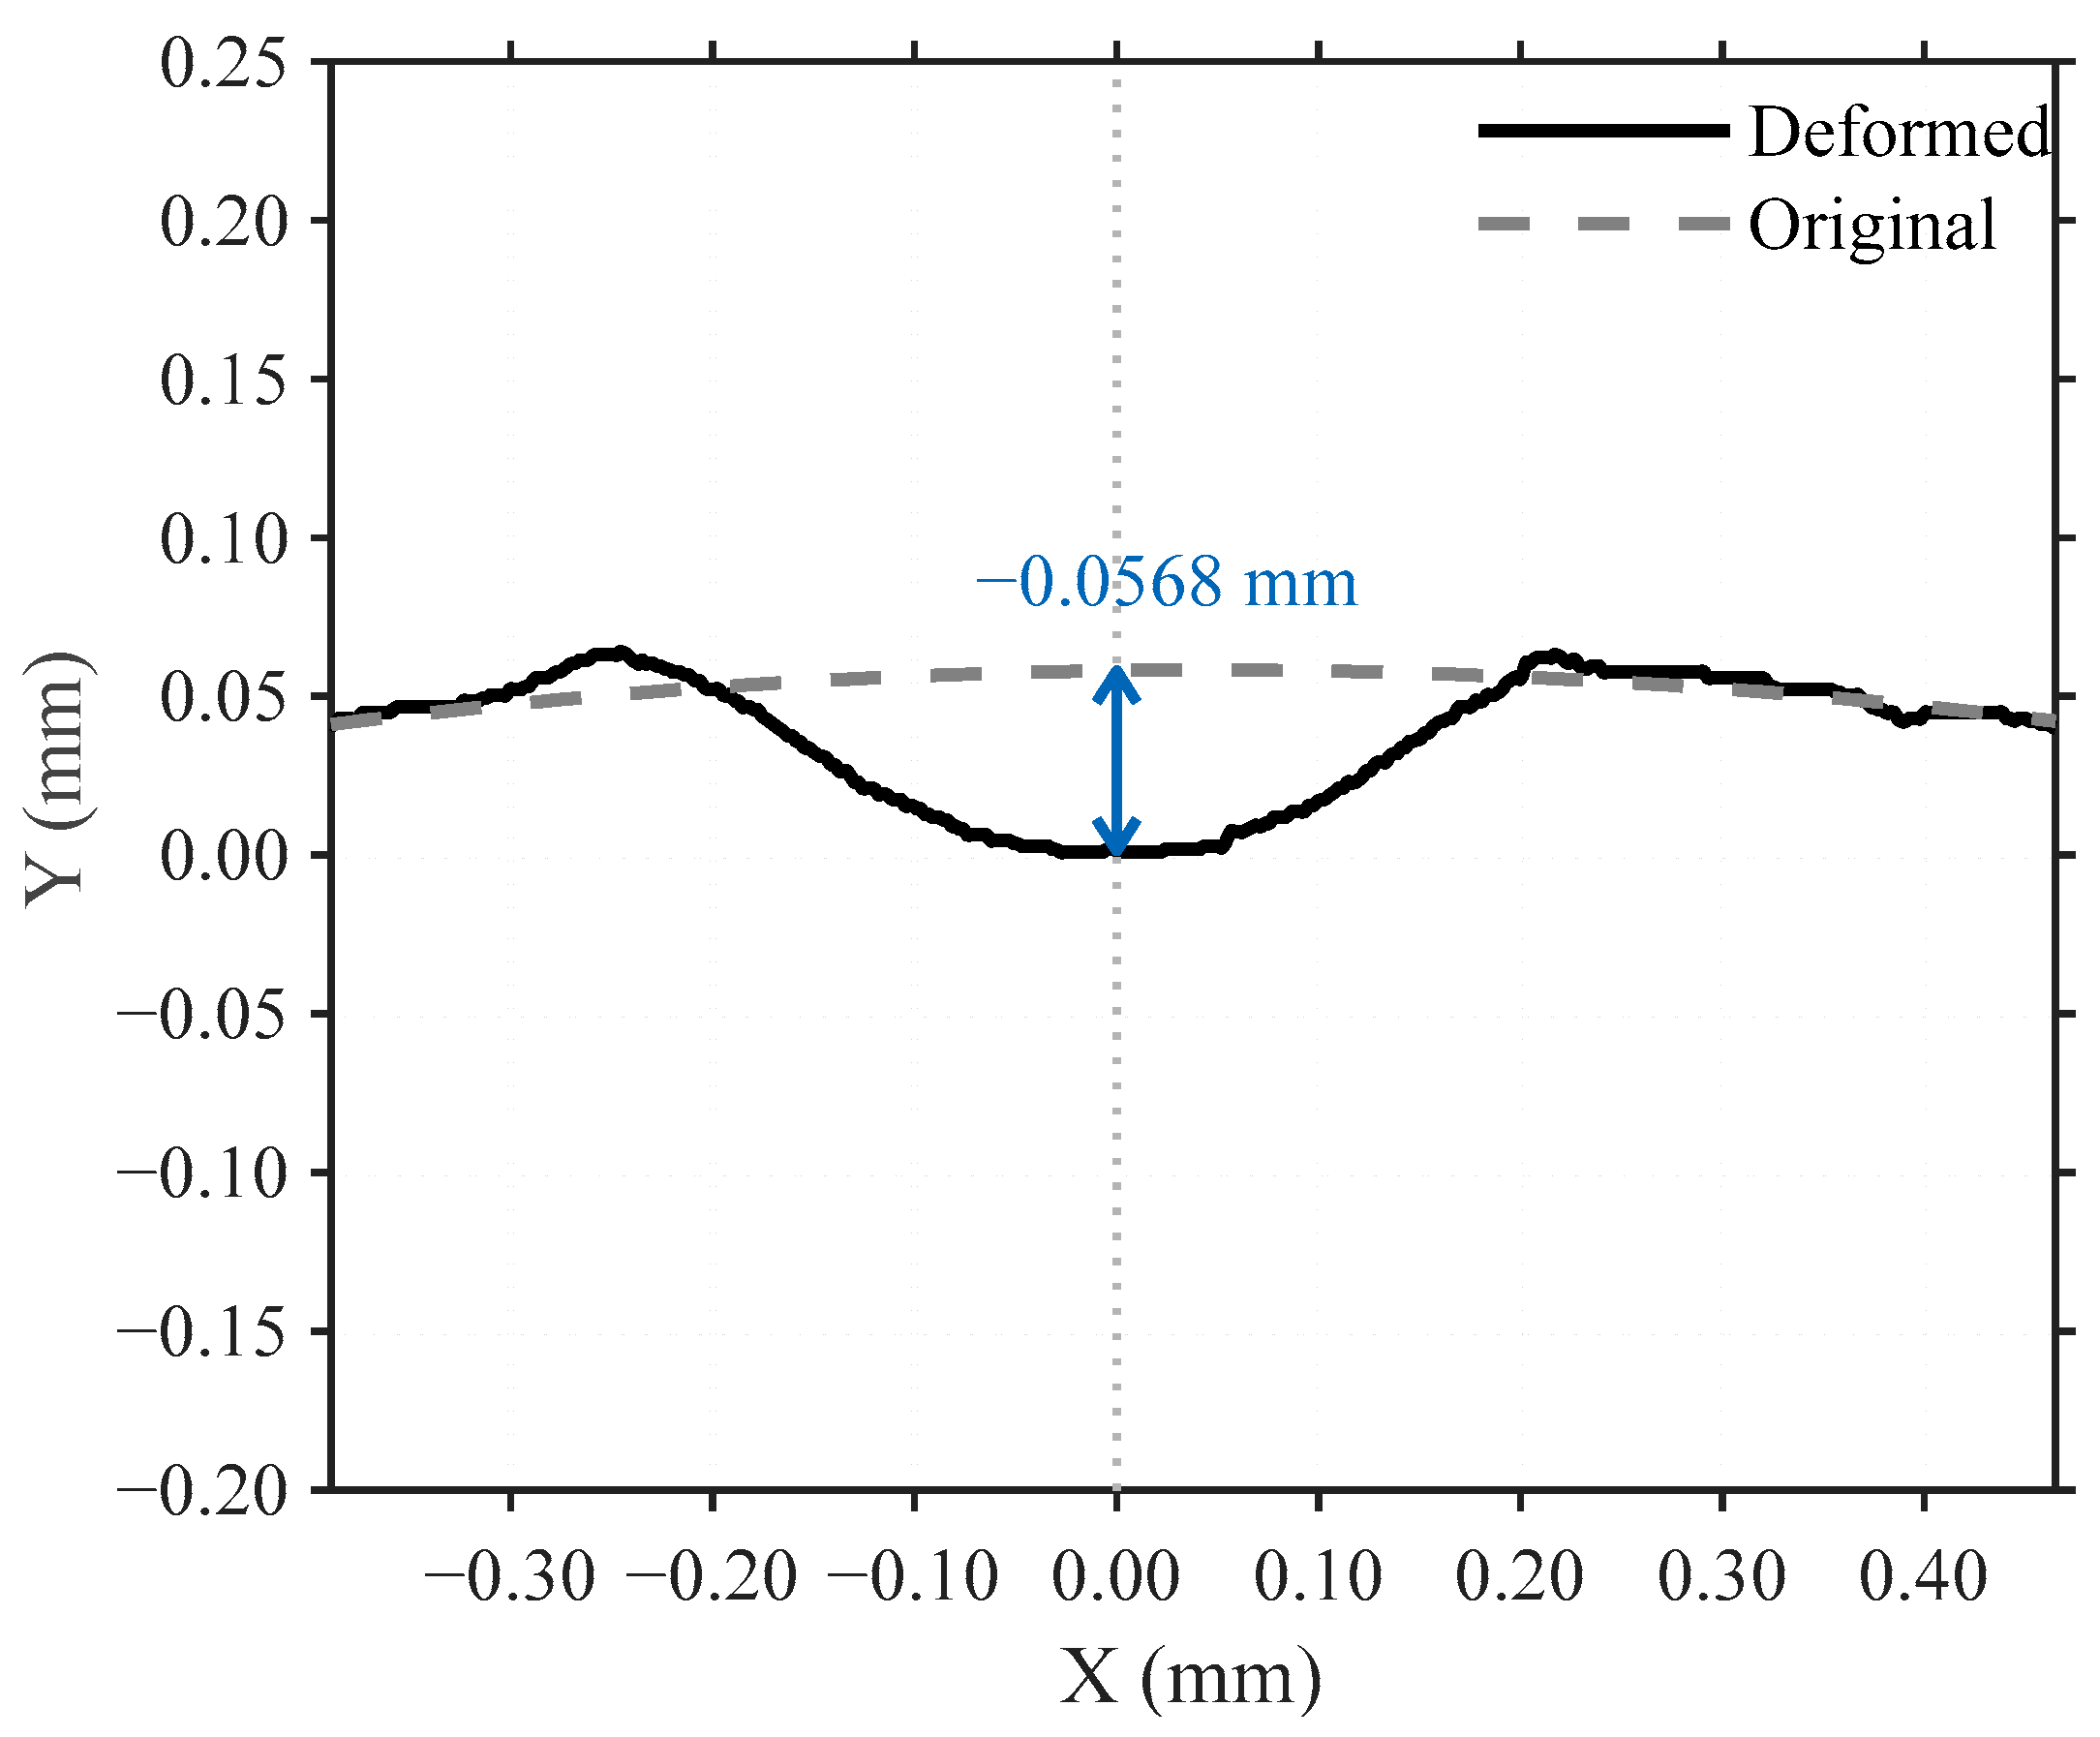
Experimental validation quantitatively confirmed the computational predictions. The concave geometry demonstrated sealing capability at 1.7 ± 0.2 MPa, well below the threshold specified by the AIS-195 standard (2.0 MPa), whereas the rectangular geometry exhibited sealing only at 5.6 ± 0.7 MPa, exceeding the standard limits. This 69.6% reduction in required sealing pressure indicates significantly enhanced low-pressure performance. Post-exposure analysis after 87.5 MPa testing revealed no detectable deformation in the concave geometry specimens, while rectangular specimens exhibited permanent deformation averaging 0.0580 ± 0.007 mm at the contact edge. These findings corroborate the stress distribution mechanism predicted by Hertzian contact theory and confirm that the optimized geometry successfully reconciles the contradictory requirements across the entire pressure range.
The integrated computational–experimental methodology established in this study combines theoretical contact mechanics, systematic design optimization, and experimental validation to resolve contradictory design requirements in high-pressure applications. This research contributes to the fundamental understanding of contact mechanics by demonstrating that conventional hard-to-hard sealing paradigms can be challenged through strategic exploitation of material property asymmetry in non-conforming geometries. The soft-to-hard sealing framework developed extends beyond hydrogen applications to provide new insights for extreme-pressure mechanical systems across various engineering disciplines.
The practical implications extend to broader hydrogen fuel cell vehicle commercialization, potentially contributing to enhanced safety margins and improved system reliability in hydrogen infrastructure. Future research should focus on comprehensive validation under realistic operational conditions, including extended temperature ranges, actual hydrogen exposure, and long-term durability assessment under cyclic loading conditions.


