1. Introduction
Exosomes are extracellular vesicles that are 30–150 nm in size; they are derived from intracellular multivesicular bodies and secreted by all cells and are present in body fluids [
1,
2]. They contain various biomolecules including proteins, lipids, and nucleic acids (mRNA and miRNA), and specifically express membrane proteins of the tetraspanin family (CD9, CD63, CD81, etc.) [
3,
4]. These biological characteristics of exosomes play important roles not only in normal physiological processes but also in the development and progression of diseases.
Exosomes are present in various body fluids such as blood, urine, and saliva, and their composition and quantity change in several diseases including cancer, neurodegenerative disorders, and cardiovascular diseases [
5,
6]. According to the World Health Organization (WHO), cardiovascular diseases are responsible for approximately 17.9 million deaths annually, cancers are responsible for about 10 million deaths, and neurodegenerative diseases such as Alzheimer’s disease affect over 55 million people worldwide. Therefore, exosomes hold great potential as non-invasive diagnostic biomarkers for liquid biopsy [
7]. Additionally, exosomes are gaining attention as potential drug delivery vehicles due to their excellent biocompatibility and high cell membrane permeability [
8]. Recently, research on therapeutic applications of stem cell-derived exosomes has also been actively conducted [
9,
10].
However, the development of efficient isolation and concentration techniques must precede the clinical utilization of exosomes. The currently most widely used ultracentrifugation method has limitations such as being time-consuming, requiring expensive equipment, and yielding low recovery rates [
11,
12]. Size exclusion chromatography and immunoaffinity-based methods also have disadvantages including limited throughput or high costs [
13]. Therefore, to use exosomes as markers for early diagnosis, the development of rapid, economical, and efficient exosome concentration techniques from large sample volumes is required.
Recently, the polyphenolic compound EGCG ((−)-epigallocatechin-3-gallate) has gained attention as a new approach for exosome isolation [
14]. EGCG, a major component of green tea that contains catechol and gallol functional groups, is known to strongly interact with biomolecules [
15]. In particular, it has the characteristic of aggregating exosomes by binding to phospholipids in the exosome membrane. It is being evaluated as a novel approach that can overcome the limitations of conventional ultracentrifugation or immunoaffinity methods [
16,
17,
18]. Additionally, the EGCG-based isolation method is simple, economical, and capable of isolating exosomes with high yield, making it promising for clinical diagnostic applications [
19].
In this study, we developed a composite material by combining EGCG with magnetic particles for application in automated systems [
20]. Using this approach, we present a novel automated extraction method that can efficiently and rapidly isolate and concentrate exosomes from various biofluids including plasma, serum, urine, and saliva. Furthermore, we established an automated extraction method that integrates the typical two-step process of exosome isolation followed by protein extraction into a single step, enabling the entire process, from exosome isolation to protein extraction, to be performed directly from samples. Finally, along with the characterization of the isolated exosomes, we evaluated their potential as biomarkers for cancer diagnosis [
21].
2. Materials and Methods
2.1. Synthesis and Characterization of EGCG-Modified Magnetic Beads (EGCG@T)
Magnetic beads (T-Fe3O4) were functionalized with epigallocatechin gallate (EGCG) by incubating various concentrations of EGCG (0.1×, 1×, 10×) with the beads with stirring for 2 h at room temperature. The resulting EGCG@T complexes were washed with deionized water and lyophilized for further use.
To evaluate the surface morphology, scanning electron microscopy (SEM; EM-30AX, Coxem, Daejeon, Republic of Korea) was performed at ×10,000~×30,000 magnification and with a 15 [KV] electron acceleration voltage rate after gold coating (Ion Coater; SPT-20, Coxem, Daejeon, Republic of Korea). The elemental composition (Fe, C, O) was analyzed using energy-dispersive X-ray spectroscopy (EDS; SCU, Bruker, Billerica, MA, USA). Fourier-transform infrared spectroscopy (FT-IR; Vertex 70, Bruker, Germany) was conducted over the 4000–500 cm−1 range using KBr-pelletized samples to identify EGCG-related functional groups. Optical absorbance profiles were obtained via UV–Vis spectroscopy (UV-2600, Shimadzu, Kyoto, Japan) from 200 to 900 nm to confirm EGCG conjugation. The zeta potential and hydrodynamic diameter were measured using a Zetasizer Ultra (ZSU3305, Malvern Instruments, Malvern, UK) to assess the colloidal stability and particle size distribution.
2.2. Preparation of Magnetic Bead + EGCG
EGCG (Tokyo Chemical Industry, Tokyo, Japan)-modified magnetic beads were synthesized through a two-step process. Initially, EGCG (500 mg) was dissolved in 500 mL of deionized water (DW) and sonicated for 10 min to ensure complete dispersion. Subsequently, T-Fe3O4 magnetic nanoparticles (500 mg) were added to the EGCG solution, which was further sonicated for 10 min to achieve uniform dispersion. The mixture was continuously stirred at room temperature at 1500 rpm for 1 h to facilitate the surface modification of the magnetic nanoparticles with EGCG. After the reaction, the EGCG-modified magnetic beads were separated using a magnetic field and centrifuged at 5000 rpm for 5 min. The supernatant was carefully removed while maintaining the magnetic field. The precipitated beads were washed three times with 400 mL of DW to remove unbound EGCG. Each washing step consisted of sonication for 10 min followed by magnetic separation and centrifugation at 5000 rpm for 5 min. Finally, the purified EGCG@T core beads were thinly spread on a tray and dried in a vacuum oven at 60 °C until completely dry. The synthesized magnetic beads and EGCG complex were analyzed using scanning electron microscopy (SEM), energy-dispersive X-ray spectroscopy (EDS), a Zetasizer, Fourier-transform infrared spectroscopy (FT-IR), and Thermogravimetry Differential Thermal Analysis (TG-DTA).
2.3. Optimization of Magnetic Bead + EGCG Complex Concentration
Various EGCG:T-Fe3O4 weight ratios were investigated to determine the optimal composition of EGCG-modified magnetic beads. The synthesis was performed using the same protocol described above but with adjusted relative concentrations of EGCG and the T-Fe3O4 magnetic nanoparticles. Three different weight ratios (10:1, 0.1:1, and 1:1) were evaluated. For the 10:1 ratio, 1 mg of EGCG and 0.1 mg of T-Fe3O4 were used. The 0.1:1 ratio utilized 0.1 mg of EGCG and 1 mg of T-Fe3O4, while the 1:1 ratio employed equal amounts of EGCG and T-Fe3O4 (1 mg each). All other synthesis conditions remained consistent across the different ratio preparation processes.
The optimal concentration of EGCG-modified magnetic beads for exosome isolation was investigated using urine samples. Three different magnetic bead concentrations were evaluated: 0.1× (1 mg EGCG and 0.1 mg T-Fe3O4), 1× (1 mg each of EGCG and T-Fe3O4), and 10× (0.1 mg EGCG and 1 mg T-Fe3O4). During the isolation process, urine samples were mixed with the magnetic beads at different concentrations under identical conditions (room temperature incubation, constant rotation speed, and fixed incubation time). The only variable was the concentration ratio of the magnetic beads. The comparative analysis of the exosome isolation efficiency among the three different bead concentrations revealed that the 10× ratio (0.1 mg EGCG and 1 mg T-Fe3O4) yielded the optimal exosome capture efficiency.
2.4. Optimization of Exosome Isolation and Protein Extraction Using EGCG + Beads
Various experimental parameters were evaluated to determine the optimal conditions for exosome isolation using the EGCG-modified magnetic beads (EGCG@T). First, bead concentrations of 2 mg and 12 mg were compared. For urine samples, a bead concentration of 12 mg/mL (1.2 mL) was applied at a ratio of 1.2:1 relative to the sample volume.
To optimize the bead binding time, conditions of 10 and 20 min were compared for urine samples, while 5, 10, 20, and 30 min conditions were compared for plasma and serum samples. At each time point, samples and beads were incubated at room temperature without mixing. To assess the impact of the washing step, conditions with and without a 1X PBS wash were compared, and elution times were evaluated at 10, 20, and 30 min intervals.
All comparative experiments were performed with PEG precipitation as a control. The quality and quantity of exosomes obtained from each condition were evaluated by comparing the expression of key exosomal marker proteins (THP, ALB, TSG101, CD9, CD63, CD81, and ALIX) through Western blot analysis. Various parameters including bead concentration, binding time, temperature, number of washing steps, and elution buffer composition were systematically evaluated, confirming that the protocol presented here provides the most efficient conditions for isolating exosomes from various types of biological specimens.
2.5. Exosome Isolation from Multiple Biofluids Using EGCG-Modified Magnetic Beads
The optimized EGCG@T core beads (12 mg/mL) were used to isolate exosomes from four human-derived biological fluids. The isolation protocols for each biofluid are detailed below.
2.6. Plasma Exosome Isolation
Plasma (200 μL) was mixed with the EGCG@T beads (1 mL) and incubated at room temperature for 10 min. The magnetic bead–exosome complexes were separated by magnetic separation and then eluted with 50 μL of elution buffer at room temperature for 20 min.
2.7. Serum Exosome Isolation
Serum (200 μL) was incubated with the EGCG@T beads (1 mL) at room temperature for 30 min. After magnetic separation, the complexes were eluted with 50 μL of elution buffer at room temperature for 10 min.
2.8. Urine Exosome Isolation
Urine (1 mL) was pretreated by centrifugation at 2000× g for 30 min at room temperature. The pretreated sample was incubated with the EGCG@T beads (1 mL) at room temperature for 10 min. After magnetic separation, the complexes were eluted with 50 μL of elution buffer with sonication at room temperature for 20 min.
2.9. Saliva Exosome Isolation
Saliva (1 mL) was pretreated by centrifugation at 2000× g for 10 min at room temperature. The pretreated sample was incubated with the EGCG@T beads (1 mL) at room temperature for 10 min. After magnetic separation, the complexes were eluted with 50 μL elution buffer at room temperature for 30 min.
For all sample types, the magnetic bead complexes were transferred to new tubes after each separation step to maintain sample purity.
2.10. Optimization of Protein Extraction Buffer Composition
The lysis buffer (10 mL) for protein extraction was composed of 7 M urea (4.2 g), 2 M thiourea (1.5 g), 1 mM EDTA (1 mL of a 10 mM EDTA solution), 150 mM NaCl (1.5 mL of a 1 M NaCl solution), and 50 mM Tris (500 μL of a 1 M Tris (pH 7.5) solution). This buffer composition was optimized based on previous research [
22] that demonstrated effective protein extraction for proteomic analysis.
To determine the optimal extraction conditions, experiments were conducted with various mixture ratios of RIPA buffer (Thermo Fisher Scientific, Waltham, MA, USA) and the prepared lysis buffer for protein extraction. Five different mixing ratios were tested as follows: Sample 1 only used 50 μL of RIPA buffer, Sample 2 only used 50 μL of the lysis buffer, Sample 3 used a 1:1 ratio (25 μL:25 μL) of RIPA and lysis buffers, Sample 4 employed a 2:1 ratio (33.3 μL RIPA buffer:16.7 μL lysis buffer), and Sample 5 applied a 3:1 ratio (37.5 μL RIPA buffer:12.5 μL lysis buffer).
2.11. Application of Reagents to the NX-Jr Instrument
Protein extraction was performed using a Nextractor NX-Junior automated nucleic acid extraction instrument (Genolution Inc., Seoul, Korea). To compare the efficiency of the various extraction buffer conditions (RIPA buffer alone, lysis buffer alone, and mixtures of RIPA and lysis buffers (2:1 and 33.3 μL RIPA buffer:16.7 μL lysis buffer)) were applied. Sample extraction was conducted using dedicated cartridges for the Nextractor NX-Junior as follows: EGCG-modified magnetic beads mixed with urine samples were dispensed into the first well, the respective extraction buffer was dispensed into the second well, and then the bead binding and protein elution steps were carried out by the automated system. All extraction processes were performed at room temperature, using the speed and time settings in the built-in automated program of the instrument.
2.12. Assessment of Exosome Marker Protein Levels via Western Blot
Proteins (15–20 μg) were separated by SDS-PAGE using 4–15% Mini-Protean TGX gradient gels (Bio-Rad) and transferred to PVDF membranes. The membranes were blocked with TBST containing 5% skim milk for 1 h at room temperature, and then incubated overnight at 4 °C with primary antibodies against THP (1:200; sc-271022), ALB (1:200; sc-271604), α-AMY (1:1000; #4017), CD81 (1:200; NBP2-53318), CD63 (1:500; NBP2-32830), TSG101 (1:500; ab125011), and CD9 (1:500; ab263019). After washing with TBST, the membranes were incubated with HRP-labeled goat anti-mouse IgG (1:1000 or 1:500; #31430, Invitrogen) for detection of CD63, CD81, ALB, and THP and goat anti-rabbit IgG H&L (1:1000 or 1:500; A120-101P) for detection of α-AMY, TSG101, and CD9 for 2 h at room temperature. Protein bands were detected using an ECL solution.
2.13. Enzyme-Linked Immunosorbent Assay (ELISA)
The CD63 protein levels in biofluids including urine, plasma, serum, and saliva were measured using two commercially available ELISA kits.
For urine and saliva samples, a human CD63 ELISA kit (Cusabio, Wuhan, China) was used following the manufacturer’s instructions. Briefly, diluted standards (0.625–40 ng/mL) and samples (100 μL/well) were incubated at 37 °C for 2 h. Without washing, biotin-conjugated detection antibody was added and the mixture was incubated at 37 °C for 1 h. After three washes, HRP-avidin was added and the mixture was incubated at 37 °C for another hour. Following five washes, a TMB substrate was added and the mixture was incubated in the dark for 15–30 min at 37 °C. Stop solution (50 μL) was added, and the absorbance was measured at 450 nm with wavelength correction at 540 nm. The concentrations were calculated using a four-parameter logistic (4-PL) curve-fitting model.
For plasma and serum samples, the Human AN30 (Tetraspanin 30) ELISA Kit (ELK Biotechnology, Denver, CO, USA) was used. The experimental procedure was performed according to the manufacturer’s instructions, including sample and standard preparation, incubation, washing, and detection steps. Absorbance was measured at 450 nm, and CD63 concentrations were calculated based on the provided standard curve.
3. Results
3.1. Surface Morphological Analysis of Magnetic Beads Before and After EGCG Modification
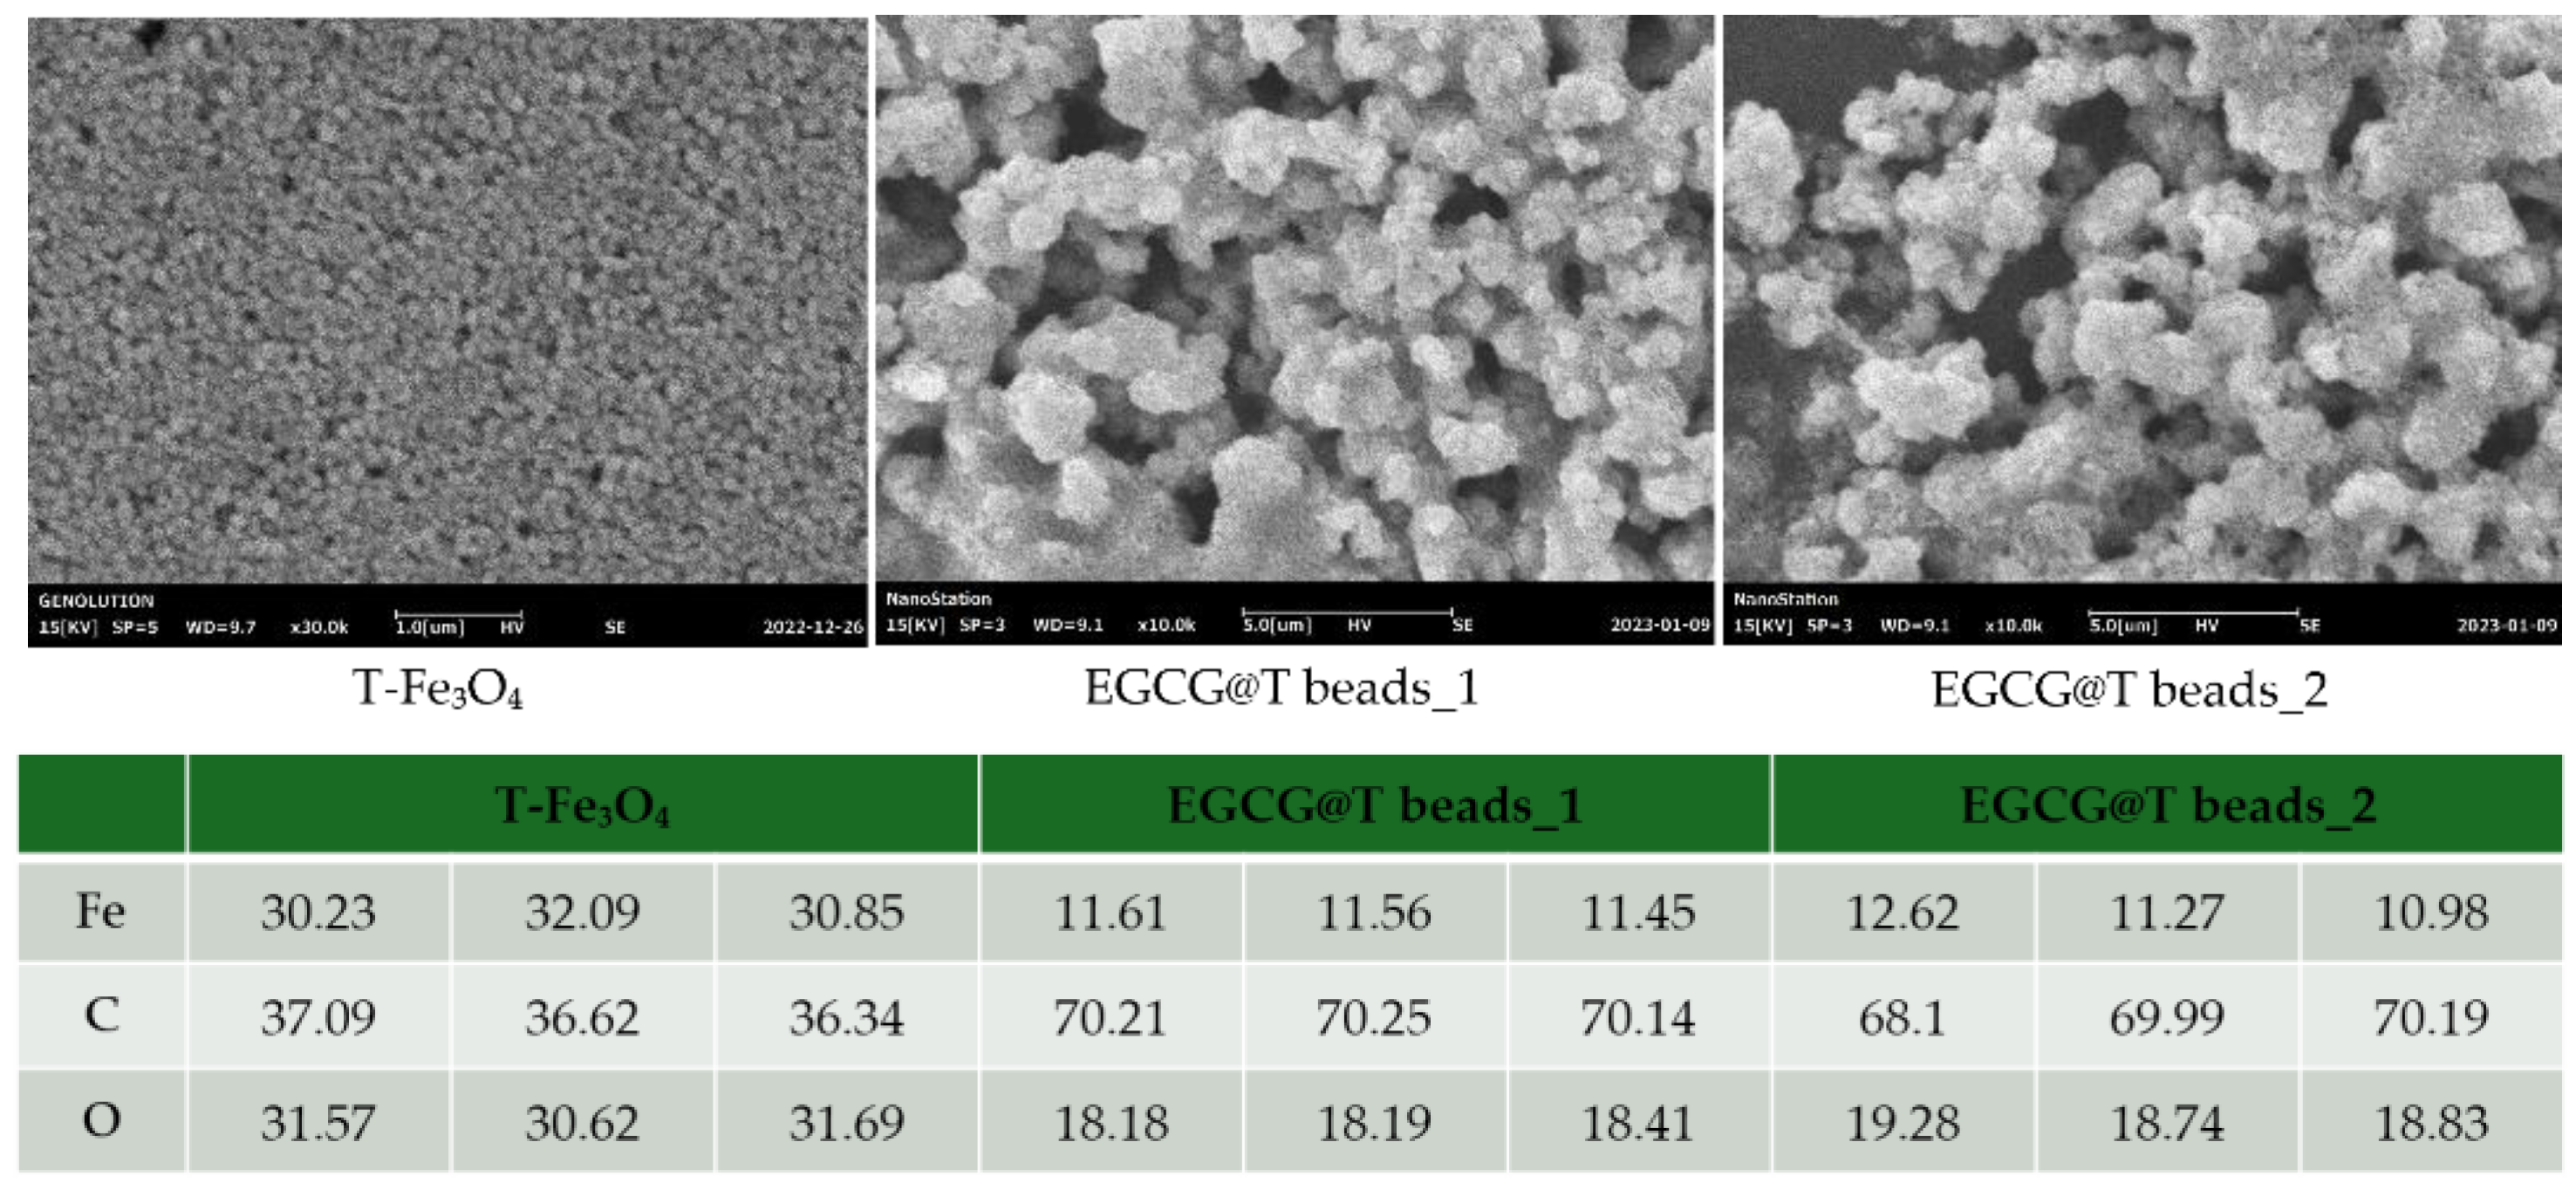
The surface morphology of the magnetic beads was observed using scanning electron microscopy (SEM) to evaluate the effect of EGCG surface modification (
Figure 1). SEM images at a magnification of ×30,000 (unmodified) and ×10,000 (EGCG-modified beads) revealed clear differences between the unmodified and EGCG-modified beads.
The unmodified magnetic beads (T-FE3O4) exhibited a relatively smooth and compact surface structure with densely packed spherical particles. In contrast, the EGCG-modified magnetic beads (EGCG@T beads_1 and EGCG@T bead_2) showed a more irregular and rough surface morphology, with increased surface texture and apparent aggregation of particles. This morphological change suggests successful surface functionalization with EGCG, which may enhance the binding capacity and interaction with target biomolecules during exosome isolation.
These observations confirm that the EGCG coating alters the physical surface of the beads, potentially contributing to the improved isolation efficiency observed in the subsequent functional assays.
The synthesized magnetic beads and EGCG complex (EGCG@T) were analyzed using scanning electron microscopy (SEM) and energy-dispersive X-ray spectroscopy (EDS). It was confirmed that EGCG aggregated with the spherical magnetic beads to form clusters. In addition, the EDS analysis results showed that T-Fe3O4 was composed of 31.06% Fe, 36.68% C, and 31.69% O. On the other hand, EGCG@T bead_1 was composed of 11.54% Fe, 70.20% C, and 18.26% O, and EGCG@T bead_2 was composed of 11.62% Fe, 69.43% C, and 18.95% O, confirming that the magnetic beads and EGCG were present and mixed since the composition ratio of C increased.
3.2. Fourier-Transform Infrared Spectroscopy (FT-IR) Analysis of EGCG-Modified Magnetic Beads
To confirm the chemical bonding and surface modification of the magnetic beads with EGCG, Fourier-transform infrared (FT-IR) spectroscopy was performed on T-Fe
3O
4 (bead only, blue peak), pure EGCG (red peak), and two different EGCG-coated bead preparations (EGCG@T beads_1 (green peak) and EGCG@T beads_2 (purple peak)) (
Figure 2).
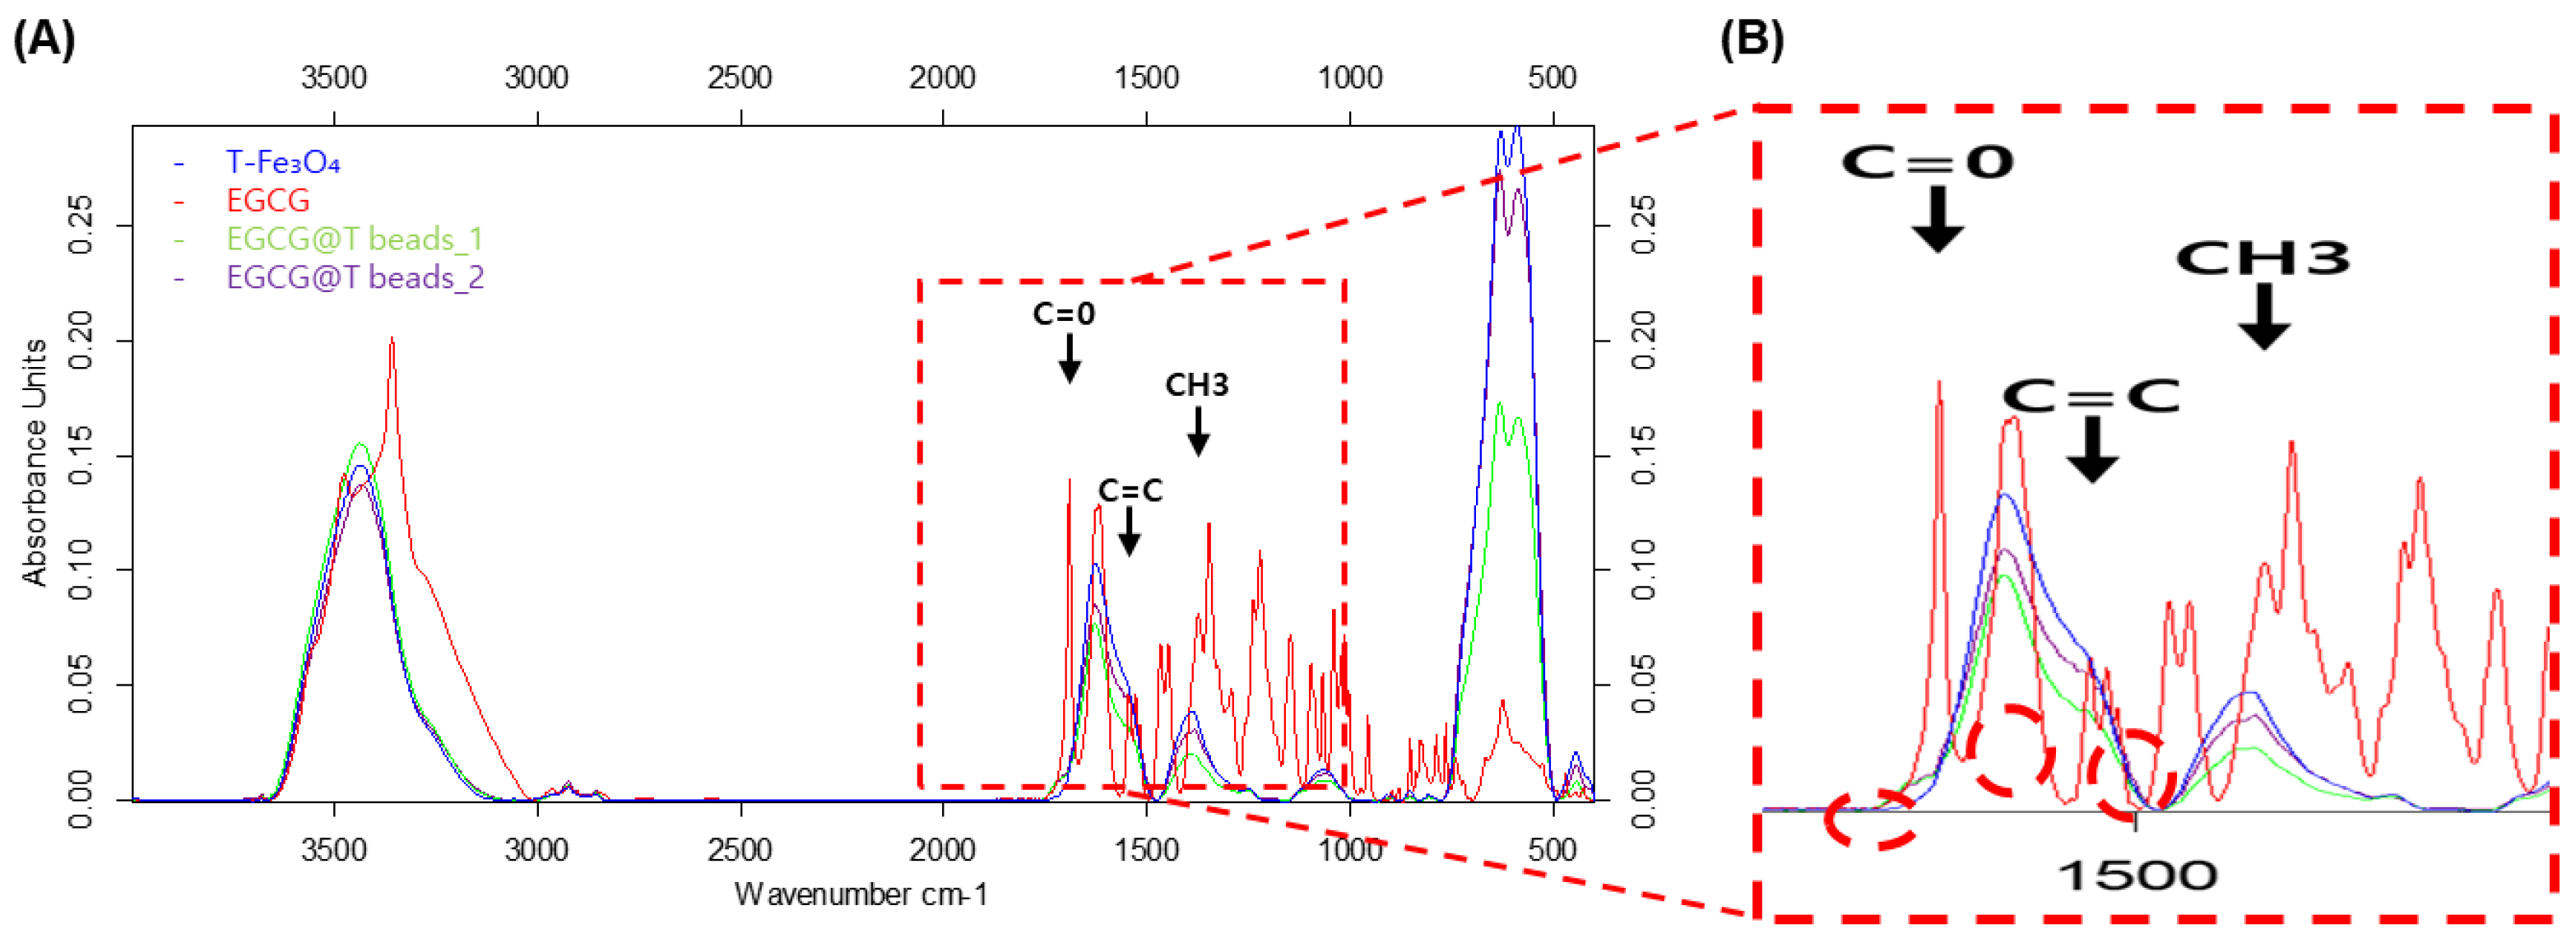
In the FT-IR spectrum between 3000 and 3500 cm−1, the three magnetic bead samples showed similar patterns, while EGCG (red) showed a different pattern. The FT-IR spectrum of pure EGCG displayed characteristic absorption peaks corresponding to carbonyl stretching (C=O) near 1691 cm−1, alkene C=C stretching at 1545 cm−1, and methyl group (CH3) deformation at 1375 cm−1. These signals are consistent with the polyphenolic structure of EGCG (red peak). In contrast, the T-Fe3O4 sample lacked these distinct organic peaks, exhibiting only the typical metal-oxide-related bands.
Upon modification with EGCG, both EGCG@T beads_1 and EGCG@T beads_2 exhibited new peaks in the 1300–1700 cm−1 region that correspond to those observed in the pure EGCG spectrum. The appearance of the C=O-, C=C-, and CH3-related peaks in the coated beads indicates successful surface functionalization of the magnetic beads with EGCG molecules.
These findings confirm the chemical incorporation of EGCG onto the bead surface, which may contribute to enhanced binding interactions with exosomal components in downstream applications.
The T-Fe3O4, EGCG, and EGCG@T complexes were analyzed using FT-IR at the Korea Basic Science Institute (KBSI). As a result, the C=O peak of EGCG in the EGCG@T mixture was confirmed at the peak position of 1691 [cm−1]. The C = C peak at 1545 [cm−1], and the CH3 peak at 1375 [cm−1] were also confirmed. Thus, EGCG was combined with T-Fe3O4.
3.3. UV–Vis Spectral Analysis of EGCG-Modified Magnetic Beads22
To investigate the optical properties and confirm the surface modification of the magnetic beads with EGCG, UV–Vis absorption spectroscopy was performed on T-Fe
3O
4, pure EGCG, and the two types of EGCG-coated magnetic beads (EGCG@T beads_1 and EGCG@T beads_2) (
Figure 3).
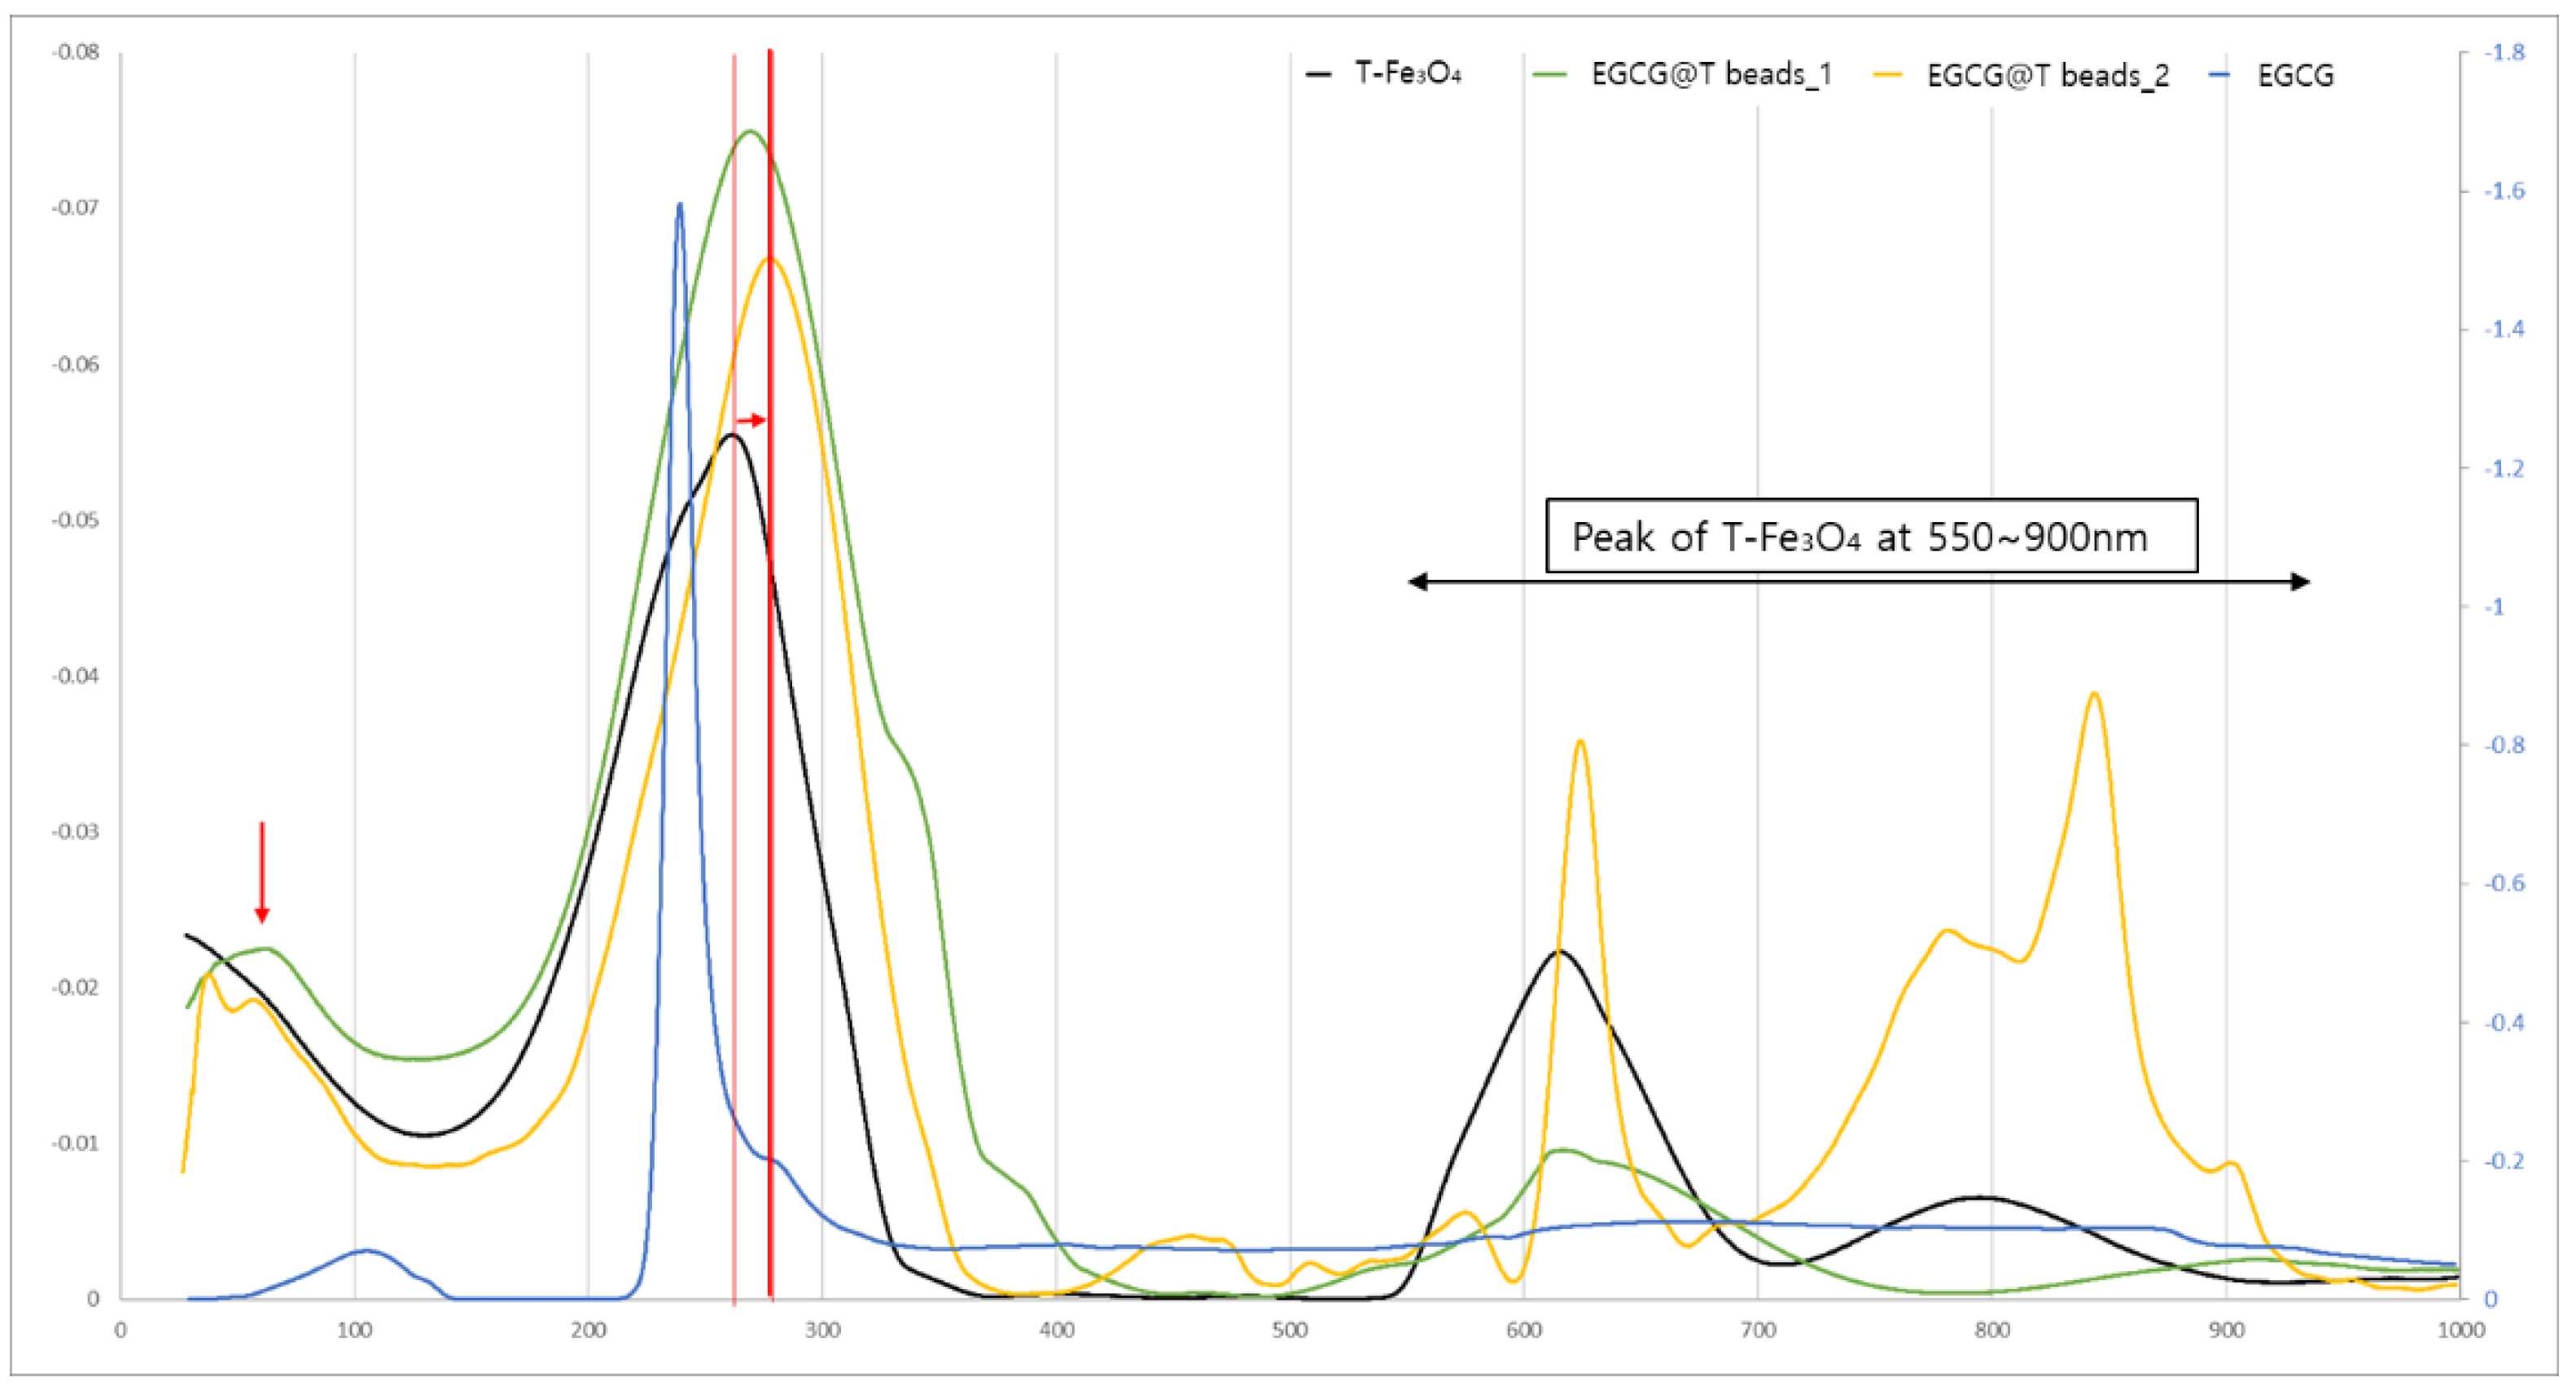
The T-Fe3O4 sample exhibited a broad absorption band in the 550–900 nm region, which is characteristic of iron oxide nanoparticles. This peak was retained in both EGCG@T beads_1 and EGCG@T beads_2, indicating that the core magnetic properties of Fe3O4 were maintained after EGCG surface modification.
Pure EGCG showed a sharp and intense absorption peak near 270–280 nm, corresponding to the π–π* transition of aromatic rings in its polyphenolic structure. This prominent peak was also observed in both EGCG@T bead samples, confirming the presence of EGCG molecules on the bead surface.
Notably, EGCG@T beads_1 showed a relatively higher absorption intensity at ~280 nm compared to EGCG@T beads_2, suggesting a denser or more homogeneous EGCG coating. Meanwhile, EGCG@T beads_2 displayed enhanced absorbance in the visible region (600–900 nm), likely due to changes in the nanoparticle aggregation state or surface plasmon interactions after modification.
These UV–Vis spectral features collectively support the successful conjugation of EGCG onto the magnetic beads and the retention of optical properties from both EGCG and T-Fe3O4 components.
The T-Fe3O4, EGCG, and EGCG@T complexes were analyzed using TG-DTA at NICEM.
It was confirmed that the peak in EGCG@T bead spectra was due to the 100 nm peak of EGCG. In addition, it was confirmed that the EGCG@T beads’ peaks were shifted compared to the T-Fe3O4 peak due to the 280 nm peak of EGCG. Therefore, it was confirmed once again that T-Fe3O4 and EGCG were present in a complex form.
3.4. Effect of EGCG Concentration on Surface Morphology, Elemental Composition, and Colloidal Properties of Magnetic Beads
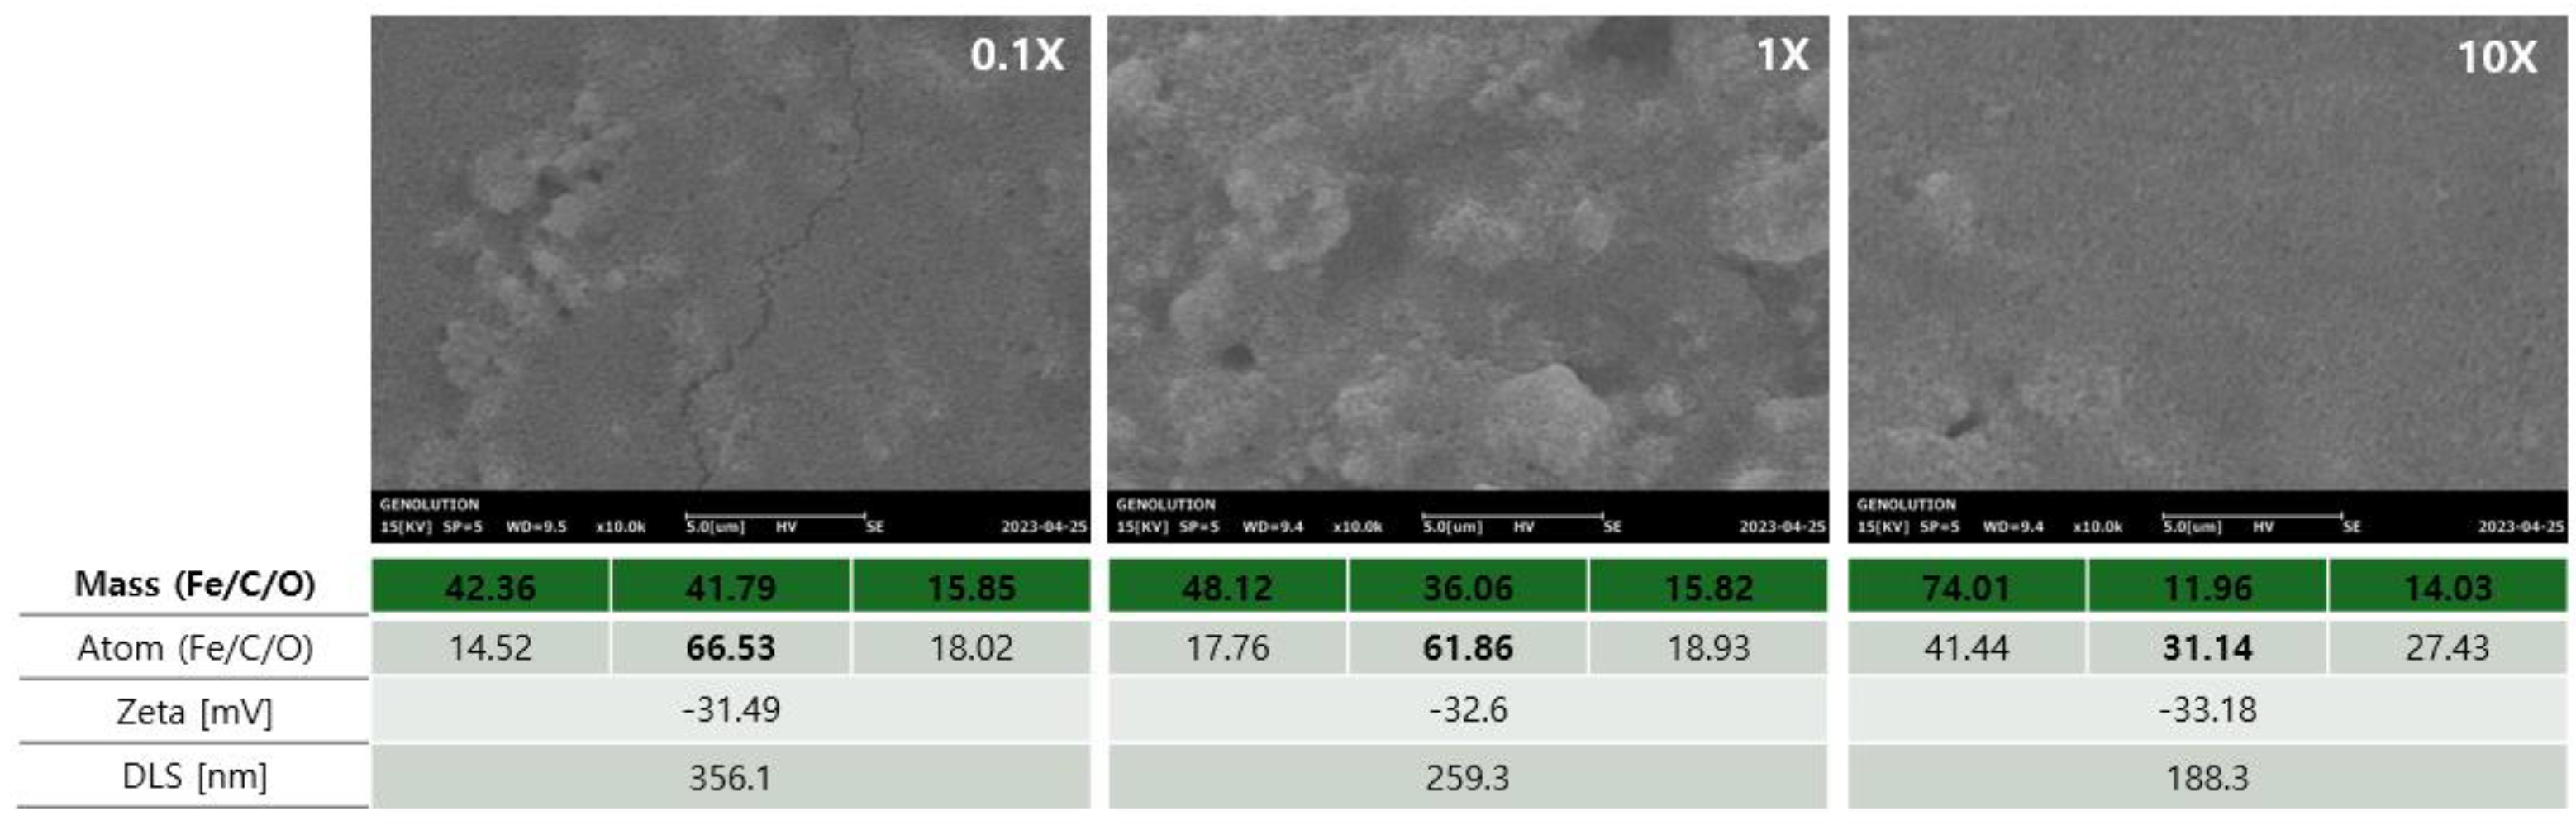
To evaluate the influence of the EGCG concentration on the bead surface characteristics and physicochemical properties, scanning electron microscopy (SEM), elemental analysis, zeta potential, and dynamic light scattering (DLS) measurements were performed under three conditions: 0.1×, 1×, and 10× EGCG treatment (
Figure 4).
It is difficult to distinguish between the different concentrations in the SEM image, but it can be confirmed that the overall shape showed a globular geometry for the nanoparticle beads. While specific comparative studies between beads with spherical and other nanoparticle shapes (like cubic or rod-shaped) in the context of exosome isolation are limited, the general consensus in the literature suggests that spherical magnetic beads offer superior performance due to their uniform magnetic field distribution and improved colloidal stability. These characteristics are advantageous for reproducible bead recovery and consistent exosome isolation performance.
The elemental analysis showed a clear decrease in carbon content (C) with decreasing EGCG concentration, confirming successful coating of the surface. At the atomic level, the C content peaked at 66.53% in the 0.1× condition and gradually decreased with higher concentrations of beads (61.86% at 1× and 31.14% at 10×). Meanwhile, the Fe and O signals shifted accordingly, reflecting changes in the surface exposure of the magnetic core.
The zeta potential measurements revealed increasingly negative surface charges from −31.49 mV (0.1×) to −33.18 mV (10×), indicating enhanced colloidal stability with increasing EGCG modification. The DLS analysis showed a consistent reduction in hydrodynamic particle size with increasing EGCG concentration, from 356.1 nm (0.1×) to 188.3 nm (10×), supporting the notion of improved dispersion and reduced aggregation.
These results collectively suggest that increasing the EGCG concentration enhances the surface coverage and colloidal stability of the magnetic beads while modulating the surface chemistry and particle size in a concentration-dependent manner.
In the EGCG and T-Fe3O4 magnetic bead complex, it was confirmed that the % C content was relatively high at 0.1× and decreased as it increased to 1× and 10×. Conversely, the % Fe content was confirmed to be highest at 10× and lowest at 0.1×. In addition, it was confirmed that the aggregation frequency was low at low EGCG contents, resulting in a smaller size at 10× and an increased zeta potential.
3.5. Optimization of Magnetic Bead + EGCG Complex Concentration: Comparative Efficiency Analysis
Western blot analysis was performed to evaluate the effect of different concentration ratios of EGCG and T-Fe
3O
4 magnetic beads (0.1×, 1×, and 10×) on the efficiency of exosome isolation from plasma samples (
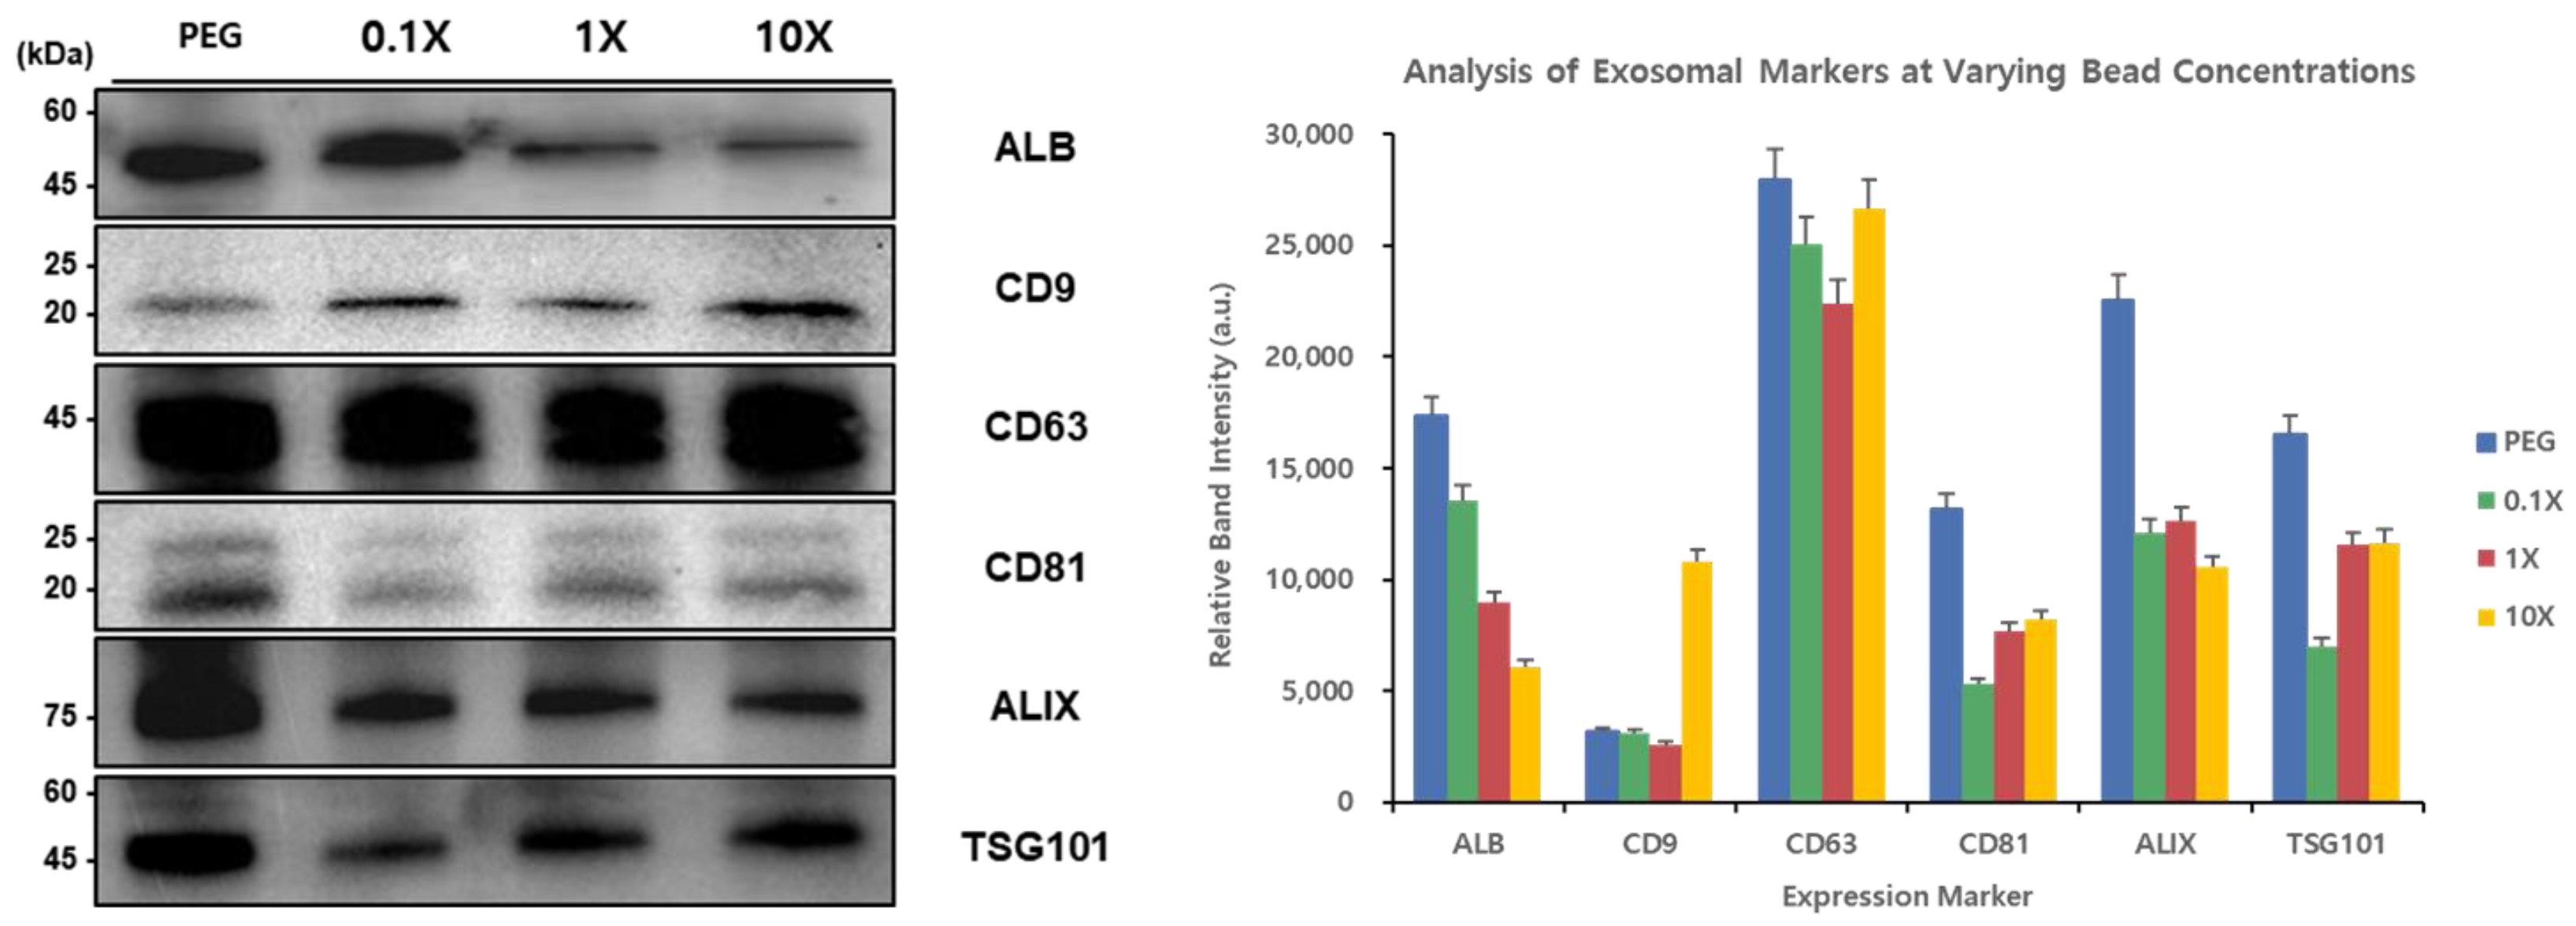
Figure 5). The detected levels of exosomal marker proteins were analyzed in comparison with those obtained using the conventional PEG precipitation method.
The Western blot results showed that high levels of albumin (ALB, ~50 kDa) were detected in the PEG method samples and the 0.1× concentration samples, but low levels were found in the 1× and 10× concentration samples. This suggests that high concentrations of EGCG may reduce the isolation of non-specific proteins such as albumin. The tetraspanin family protein CD9 (~22 kDa) showed stronger bands using the beads at all concentrations (0.1×, 1×, and 10×) compared to the PEG method, with the most pronounced band observed with 0.1×. CD63 (~45 kDa) showed high and similar levels across all the samples. CD81 (~20–25 kDa) levels were the highest in the PEG method samples and lower in the magnetic bead samples. ALIX (~75 kDa) levels were the highest using the PEG method and showed similar levels across the magnetic bead samples (0.1×, 1×, and 10×). For TSG101 (~45 kDa), the highest level was observed using the PEG method, while among the magnetic bead samples, the 1× and 10× samples showed somewhat higher levels than the 0.1× samples.
These results demonstrate that the EGCG-modified magnetic bead method can be particularly effective for isolating specific exosomal markers such as CD9, while the detection efficiency of other marker proteins may vary depending on the bead concentration ratio.
A Western blot analysis of the exosomal marker proteins isolated from urine samples using the conventional PEG precipitation method and EGCG-modified magnetic beads at three different concentration ratios (0.1×, 1×, and 10×) was performed. The levels of typical exosomal markers (CD9, CD63, CD81, ALIX, and TSG101) and albumin (ALB) were compared across the different isolation methods. The molecular weights are indicated on the left in kilodaltons (kDa).
3.6. Optimization of Exosome Isolation Conditions from Various Biological Specimens
To establish optimized protocols for exosome isolation from urine, plasma, and serum samples, we evaluated various conditions, including the magnetic bead concentration, incubation time, washing procedure, and elution duration, based on the levels of key exosomal markers (
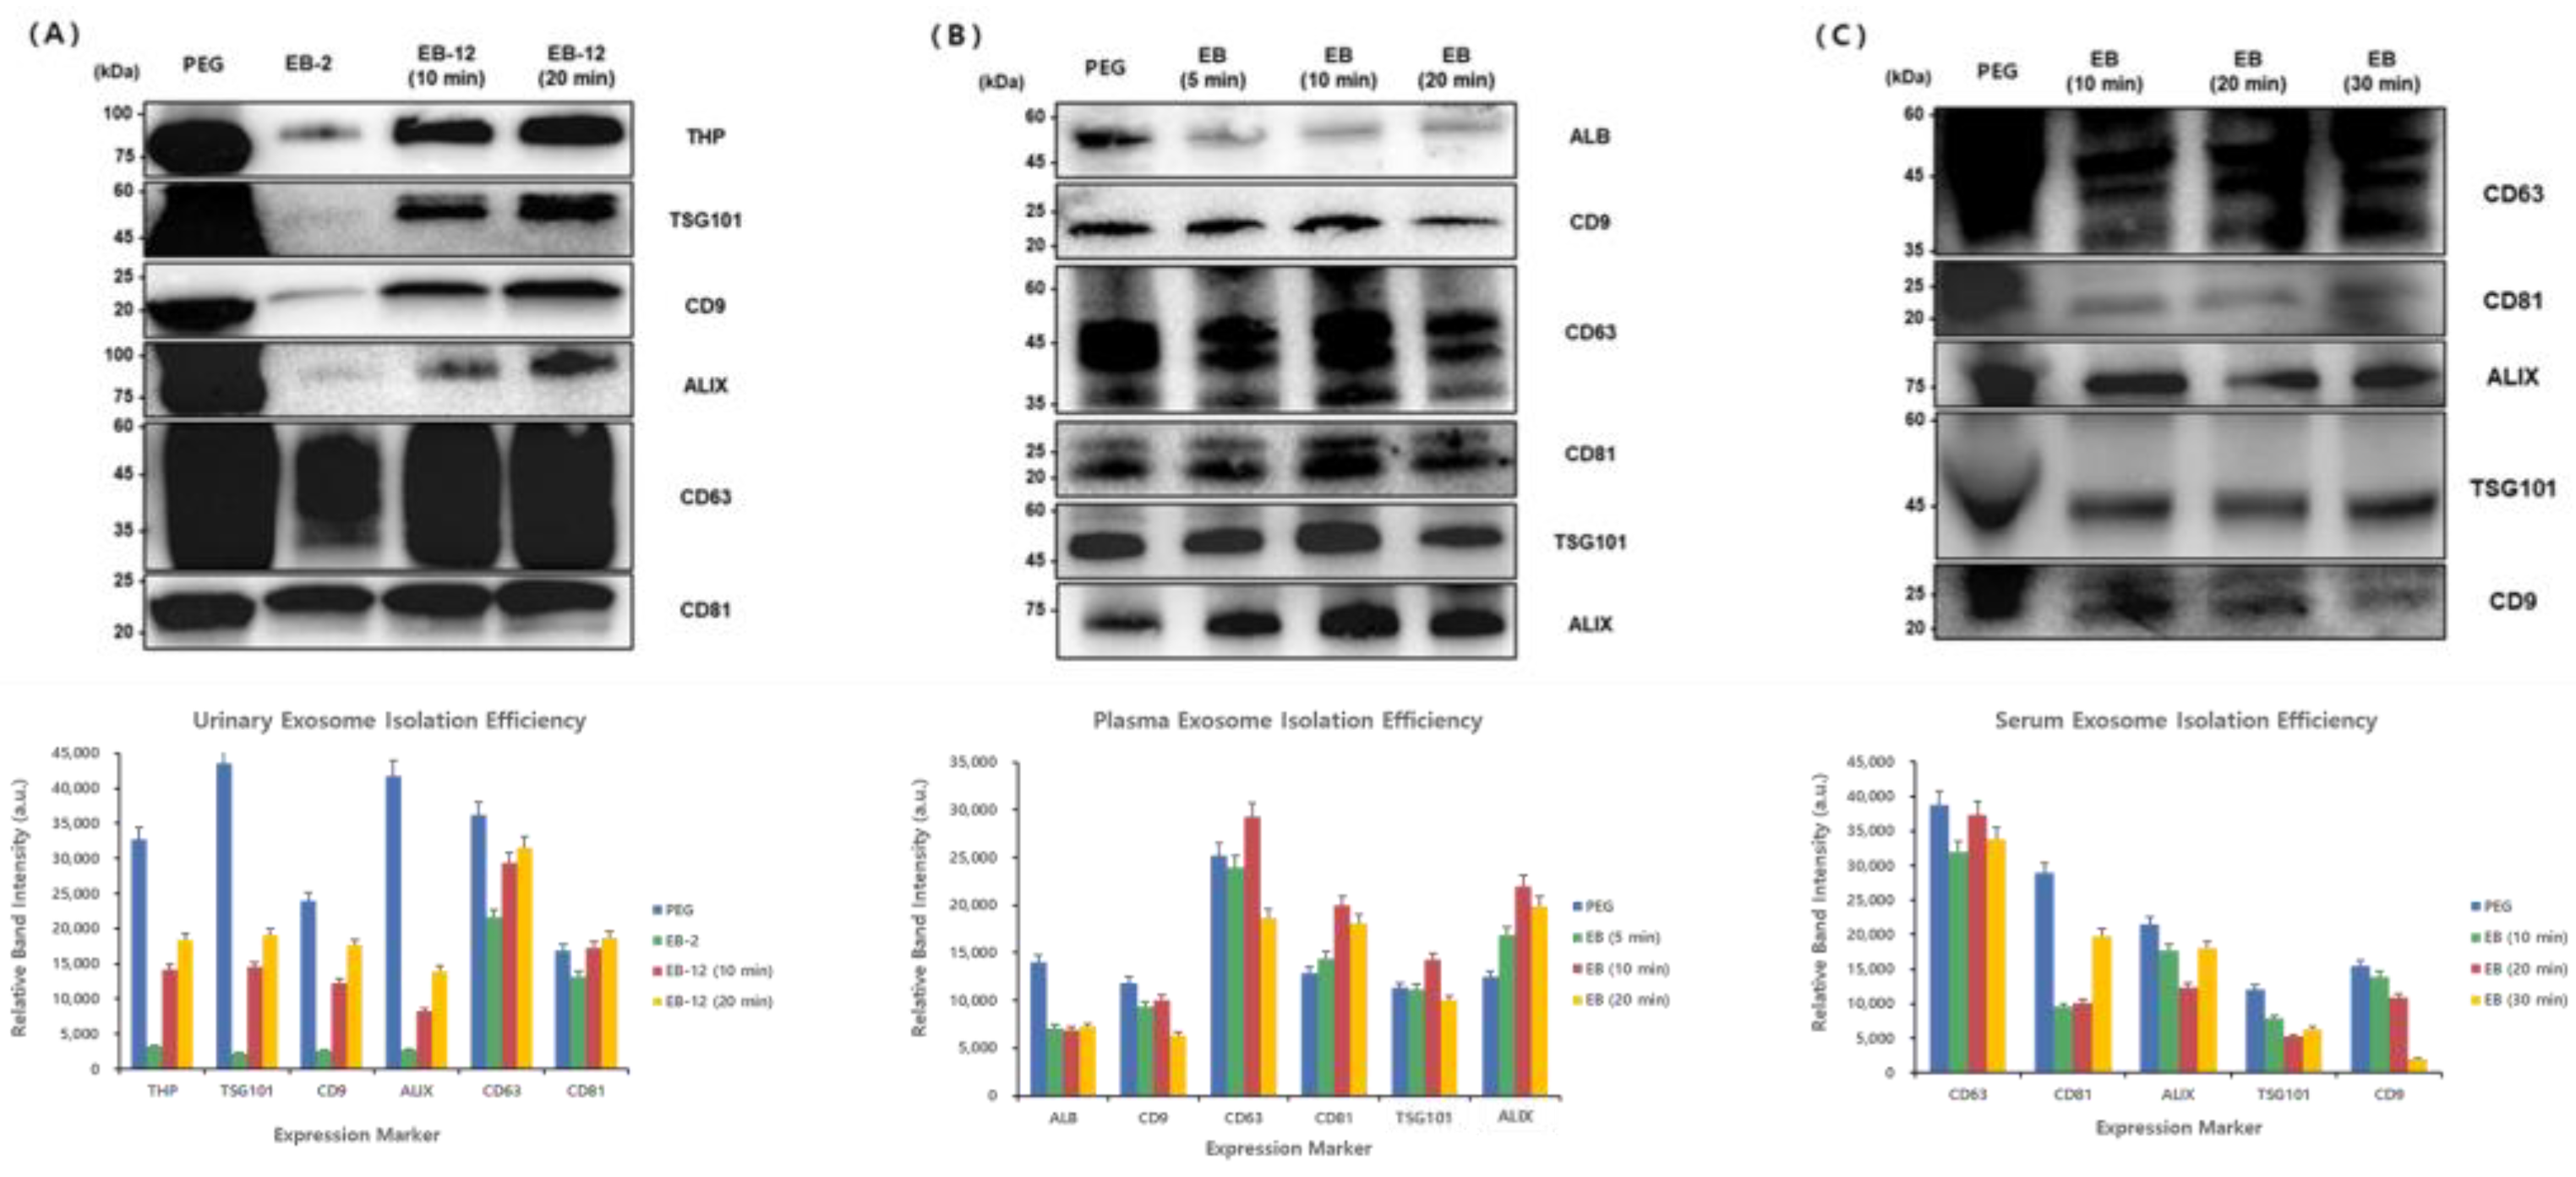
Figure 6).
For urine samples, marker levels in samples prepared using different bead concentrations and incubation times were compared. Compared with the 2 mg bead condition, the 12 mg bead condition resulted in significantly higher levels of all exosomal markers, including THP, TSG101, CD9, ALIX, CD63, and CD81. Extending the incubation time from 10 to 20 min further enhanced marker levels. Notably, TSG101 levels were lowest for the 2 mg bead condition but reached levels comparable to those obtained by the conventional PEG method under the 12 mg/20 min condition. Additionally, omitting the washing step consistently increased the expression of all markers compared to the conventional method. Therefore, the optimal conditions for urine-derived exosome isolation were defined as follows: a bead concentration of 12 mg/mL (1.2 mL), representing a 1.2-fold increase relative to the sample volume, a bead binding time of 10 min, omission of the washing process, and a 20 min elution time.
For plasma samples, we assessed exosomal marker levels in samples prepared using bead binding times of 5, 10, and 20 min. The Western blot analysis indicated high ALB (50.66 kDa) levels using the PEG method, whereas the EGCG-modified magnetic bead method resulted in significantly lower ALB levels, suggesting a reduced co-isolation of non-specific proteins such as albumin. Tetraspanin markers (CD9 at 22 kDa, CD63 at 35–60 kDa, and CD81 at 22–24 kDa) exhibited optimal levels with a 10 min bead binding time, with CD63 and CD81 levels surpassing those obtained using the PEG method. Internal markers such as ALIX (95 kDa) and TSG101 (47.52 kDa) showed increased levels with extended binding times, achieving greater levels than the PEG method with the 20 min binding condition. Based on these results, the optimal conditions for plasma-derived exosome isolation were determined as a bead binding time of 30 min with a 10 min elution period.
Similarly, serum samples were analyzed at bead binding times of 10, 20, and 30 min. CD63 (35–60 kDa) displayed the highest levels using the PEG method but showed increased levels with longer bead binding durations when using the magnetic beads. CD81 (22–24 kDa) reached levels comparable to those using the PEG method with the 30 min binding condition. ALIX (96 kDa) levels were highest with a 10 min binding time, while TSG101 (47.52 kDa) maintained consistent levels regardless of the binding duration. Conversely, CD9 (22 kDa) levels slightly decreased with prolonged incubation. Comparing elution durations, a 10 min elution consistently yielded the optimal results. Therefore, for serum-derived exosome isolation, the ideal conditions were defined as a bead binding time of 30 min combined with a 10 min elution period.
A Western blot analysis of exosomal markers from (A) urine, (B) plasma, and (C) serum samples isolated using PEG precipitation (PEG) and EGCG-modified magnetic beads under varying conditions was performed. The molecular weights (kDa) are shown on the left. The optimal isolation conditions were determined based on marker band intensity.
3.7. Optimization of Protein Extraction Buffer
In this study, we evaluated the efficiency of exosome isolation from urine under various elution conditions (elutions 1–5) using the PEG method and RIPA buffer as controls. To assess the characteristics of exosomes isolated under each condition, we examined the levels of key exosomal marker proteins through Western blot analysis (
Figure 7).
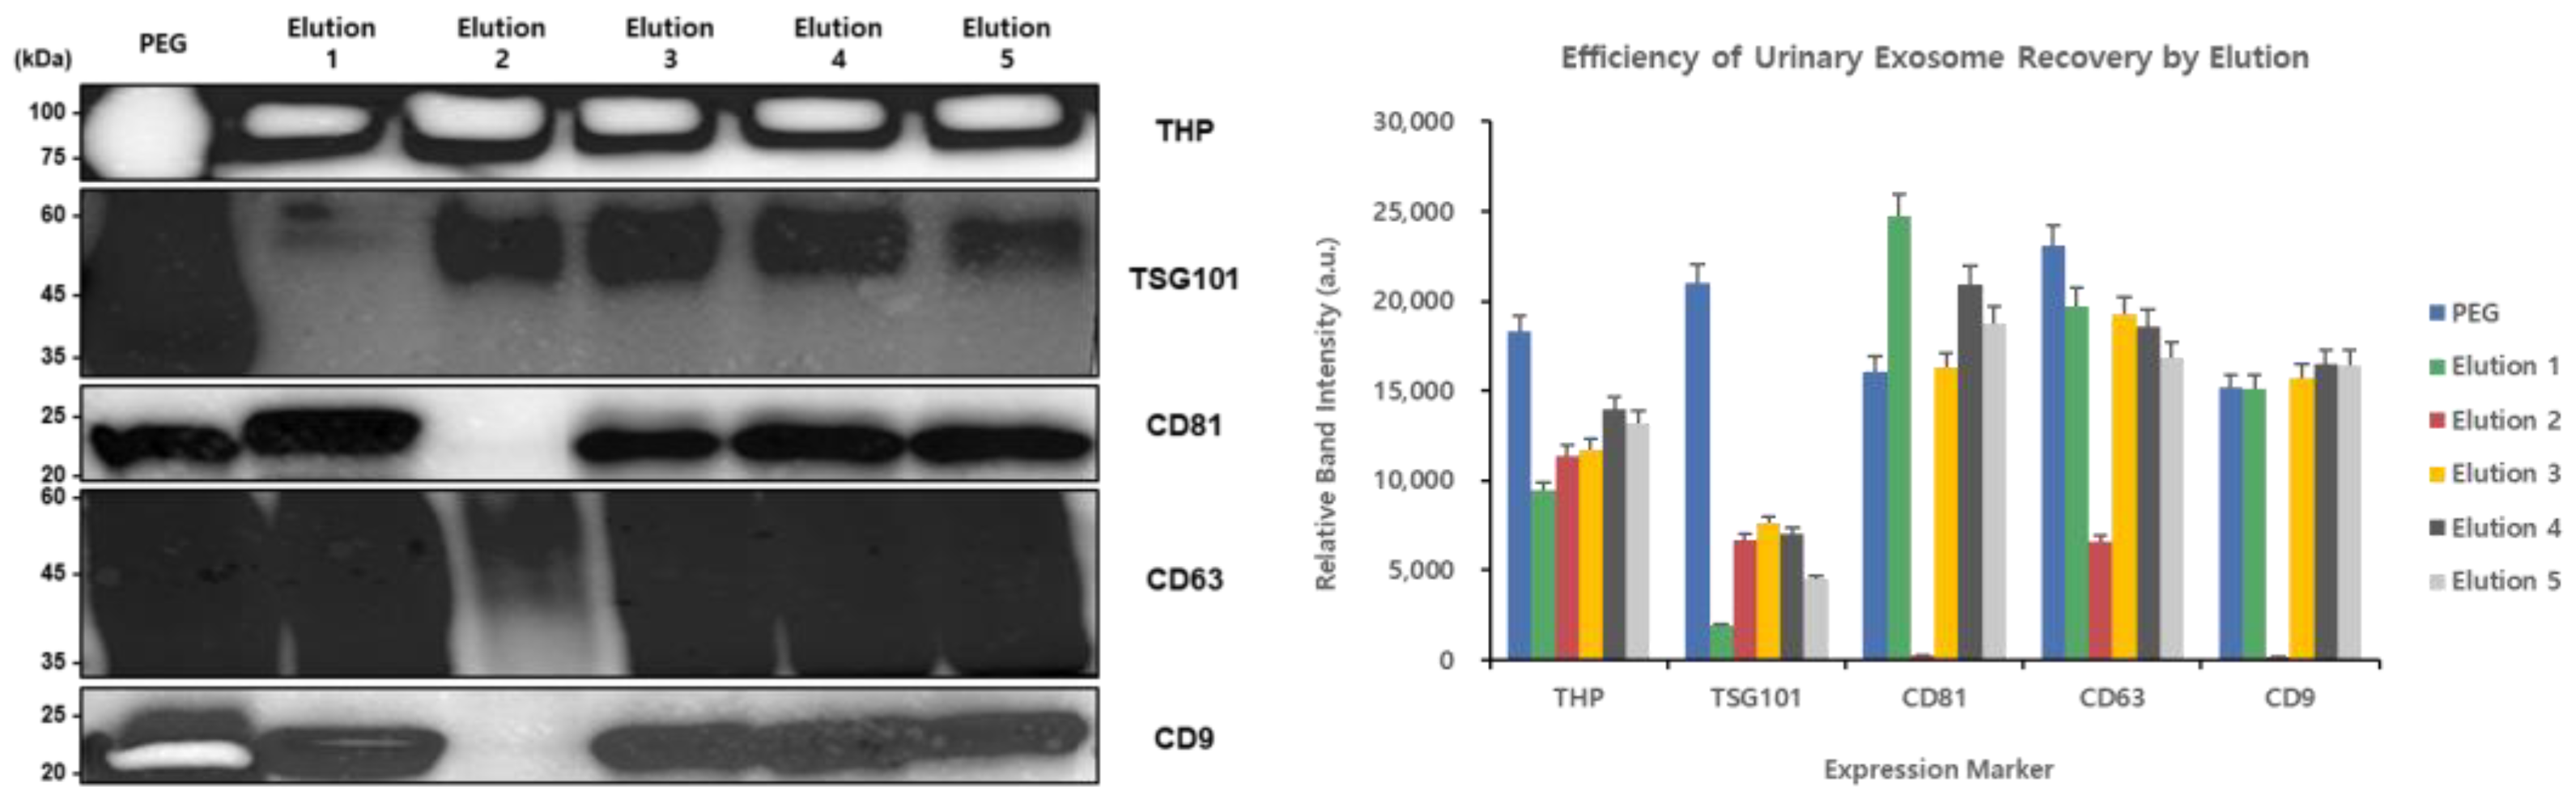
The Western blot results showed that THP exhibited significantly higher levels with all the bead-based extraction conditions (elutions 1–5) compared to the PEG precipitation method and RIPA buffer control. This indicates that bead-based extraction methods can effectively concentrate THP from urine samples. For TSG101, it was barely detectable in the PEG precipitation method and RIPA buffer samples, but showed the highest levels in the elution 2 and 3 samples for the bead-based extraction method. This suggests that the bead-based approach, particularly the elution 2 and 3 conditions, is effective for isolating TSG101-positive exosomes. CD81 showed a clear presence in the PEG precipitation method samples, RIPA buffer samples, and Sample 1, but was barely detectable in the elution 2 samples. In contrast, strong expression was observed in the elution 3, 4, and 5 samples. CD63 exhibited low levels under most conditions, but a uniquely strong band was observed in the elution 2 samples for the bead-based extraction method. CD9 showed high levels in the PEG precipitation method samples that were used as a control, while among the bead-based extraction method samples, it showed moderate levels in the elution 1 samples and minimal levels in the elution 2 samples. However, high levels were observed in the elution 3, 4, and 5 samples.
Collectively, these results demonstrate that bead-based extraction methods and various elution conditions can affect the selective isolation of exosomes from urine. In particular, TSG101 and CD63 were effectively isolated using the elution 2 conditions, while CD81 and CD9 were effectively isolated using the elution 3, 4, and 5 conditions. This suggests that the optimal elution conditions can be selected for specific target exosomal markers.
A Western blot analysis of exosomal markers (THP, TSG101, CD81, CD63, and CD9) isolated from urine samples using PEG precipitation (control), RIPA buffer, and five different elution conditions with varying RIPA/lysis buffer ratios (elution 1—RIPA only; elution 2—lysis buffer only; elution 3—1:1; elution 4—2:1; and elution 5—3:1) was performed. The different elution conditions showed distinct enrichment patterns of exosomal markers suggesting that the buffer composition affects the isolation of specific exosome subpopulations.
3.8. Automated Exosome Isolation: Evaluation of Buffer Systems Using the NX-Jr Platform
To effectively isolate exosomes from various types of biological samples, the buffer conditions were optimized using the automated Nextractor NX-Junior platform and the EGCG-modified magnetic beads. A Western blot analysis was used to compare the exosomal marker profiles obtained using the different extraction conditions against those obtained using the conventional PEG precipitation method (
Figure 8).
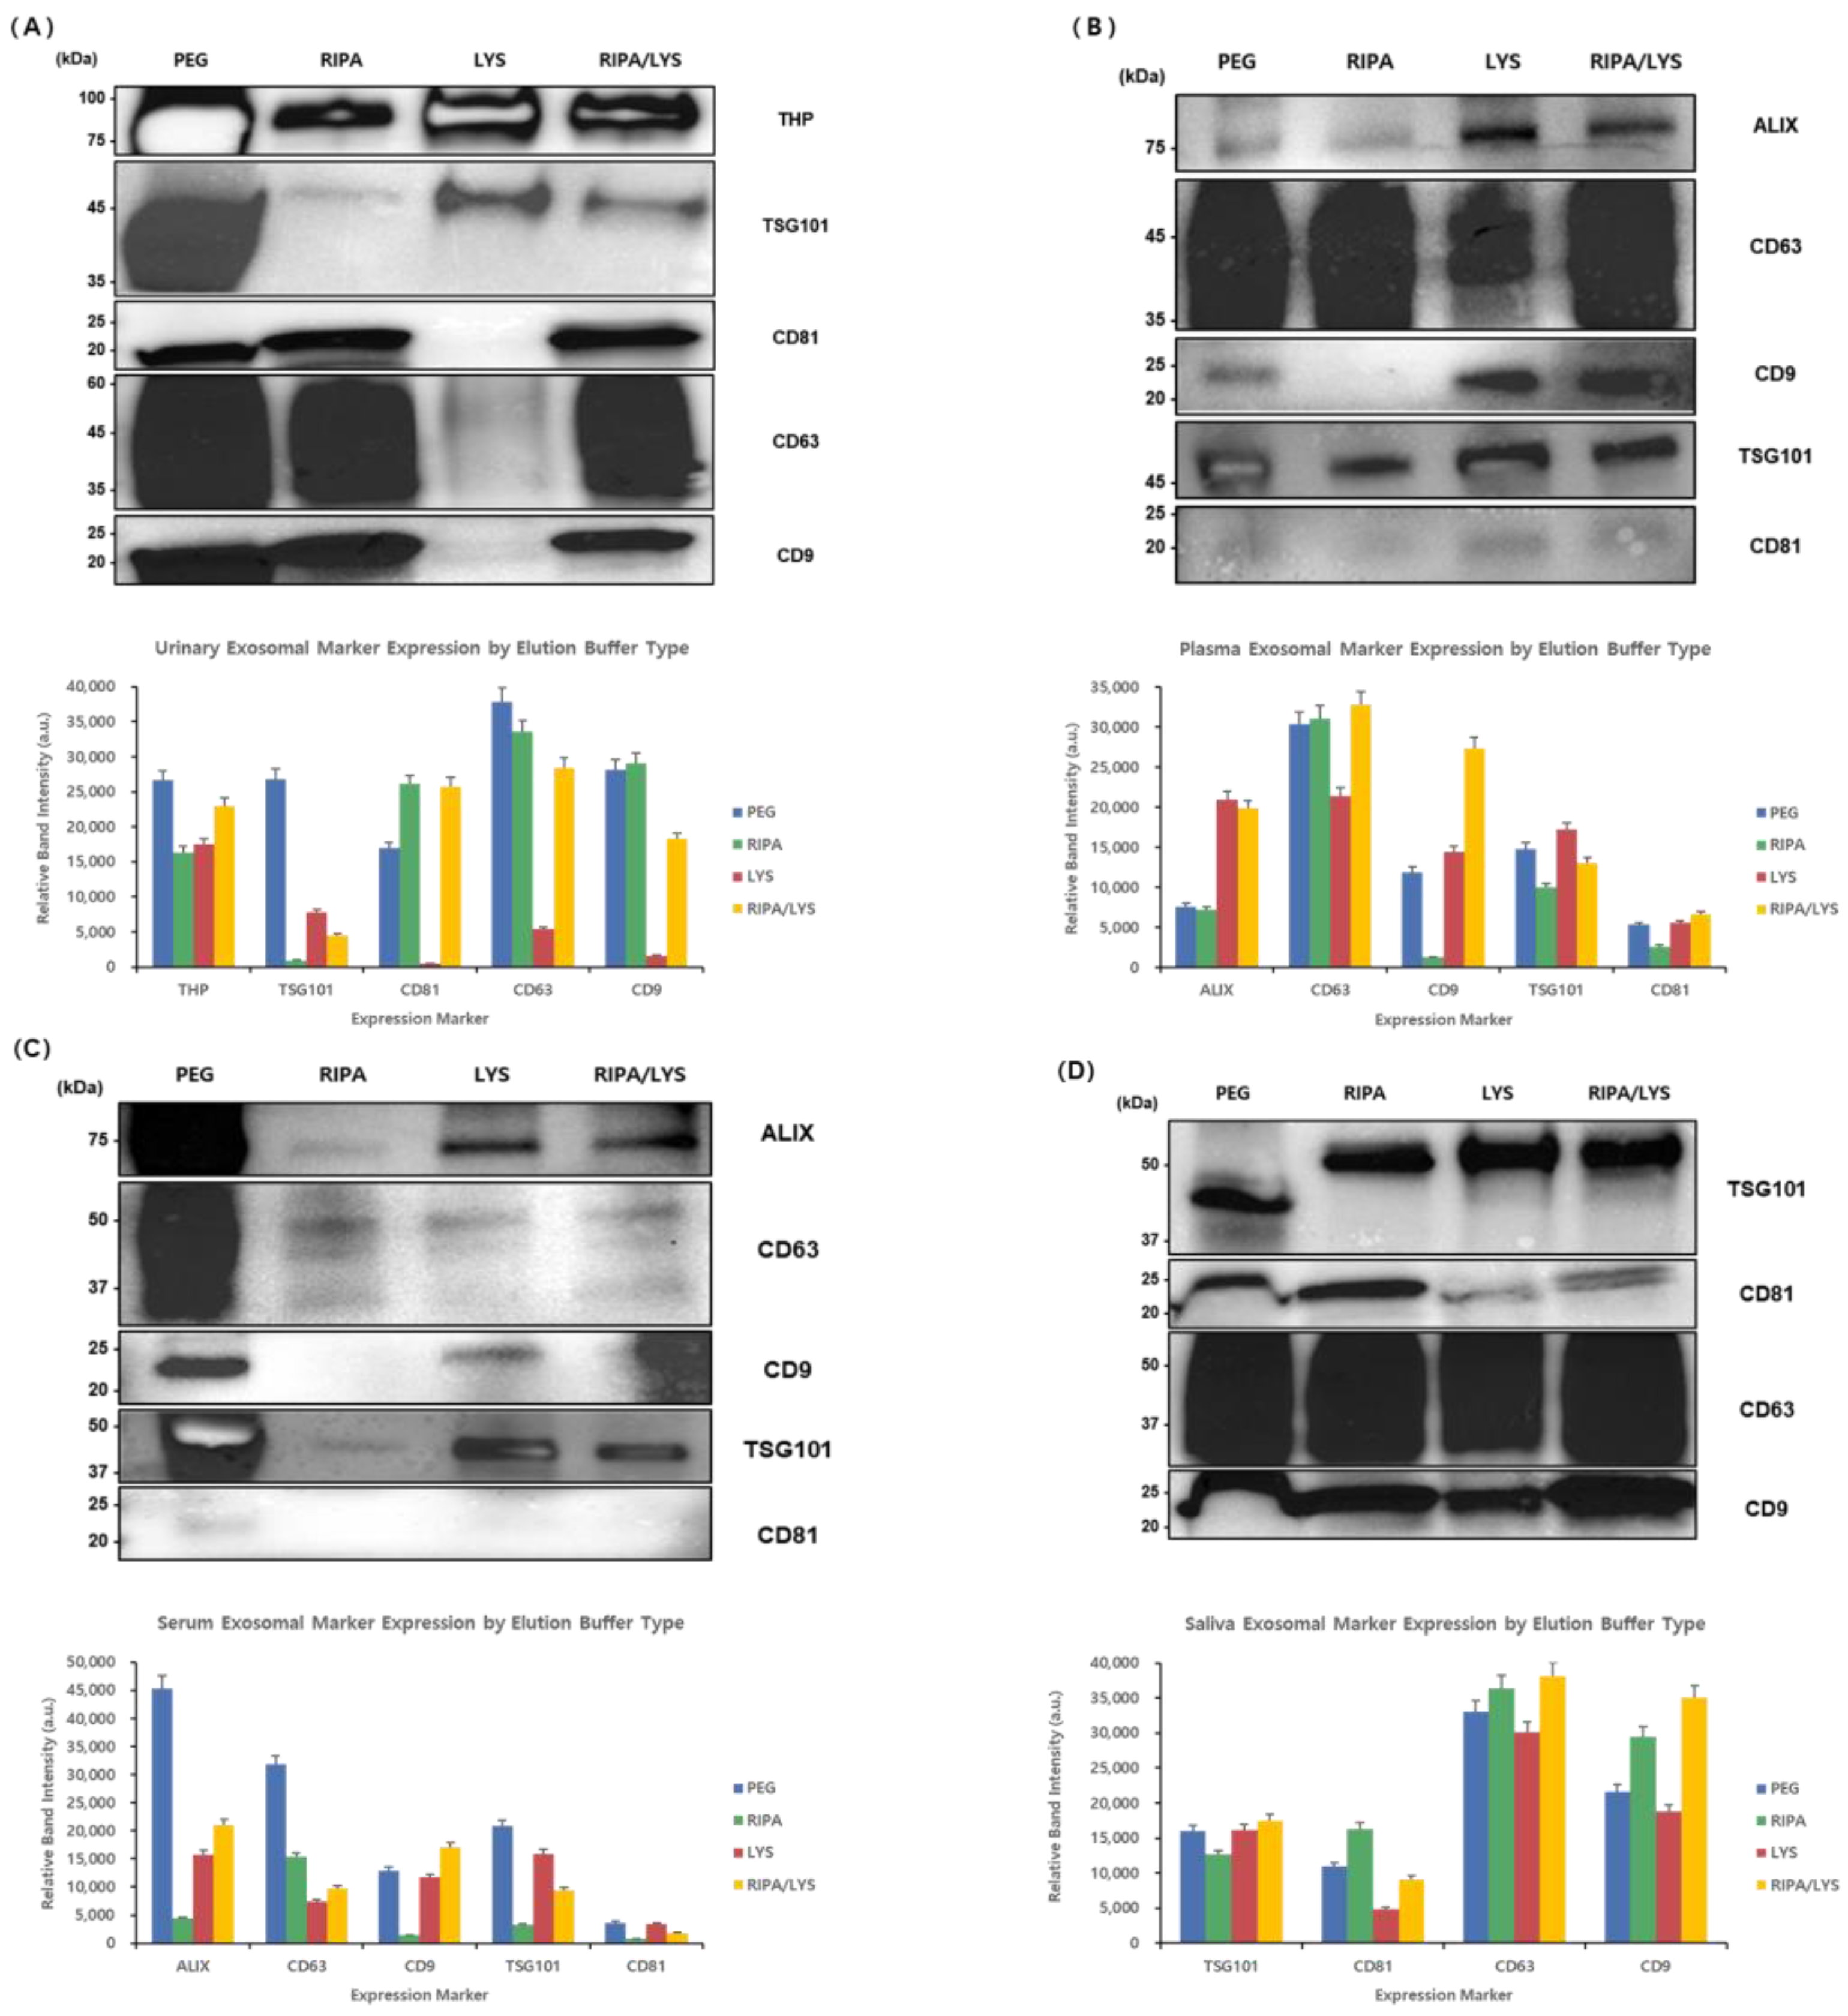
For urine samples, the buffers evaluated included RIPA buffer, lysis buffer, and a mixed buffer (RIPA + Lysis). THP (~100 kDa) levels were high using the beads and all the NX-Jr conditions compared to PEG. TSG101 (~45 kDa) showed the highest levels using PEG and was detectable in the lysis and mixed buffer samples, but not in the RIPA buffer alone sample. Tetraspanins CD81, CD63, and CD9 (~20–60 kDa) showed high levels in the PEG, RIPA buffer, and mixed buffer condition samples but lower levels with the lysis buffer alone. Thus, the mixed buffer (RIPA + Lysis) provided the optimal extraction of urine-derived exosomes.
For plasma samples, ALIX (~75 kDa) levels were highest with the lysis buffer and moderate with the mixed buffer, but it had weak levels with PEG and RIPA buffer alone. CD63 (~45 kDa) showed high levels with RIPA buffer and the mixed buffer and moderate levels with PEG. CD9 (~20–25 kDa) levels were highest with lysis buffer and lowest with RIPA buffer alone. TSG101 (~45 kDa) had high levels with PEG and RIPA buffer and moderate levels with the mixed buffer. Therefore, the mixed buffer condition offered balanced extraction; however, specific buffer choices can be used to selectively concentrate specific markers.
In serum samples, ALIX (~75 kDa) and TSG101 (~45 kDa) exhibited the highest levels in the PEG samples, with moderate levels in the lysis and mixed buffer samples, but weak levels with RIPA buffer alone. CD63 (~50 kDa) had the highest levels with PEG and lower levels in all the bead samples. CD9 (~22 kDa) showed high levels with PEG and the lysis buffer, but minimal levels with RIPA buffer and the mixed buffer. CD81 was undetectable in all the samples. Overall, PEG yielded the highest levels of most markers, with the lysis and mixed buffers performing best among the bead samples.
For saliva samples, TSG101 (~50 kDa) levels were significantly higher in all the bead samples compared to the PEG samples, indicating their effectiveness. CD81 (~25 kDa) showed the highest levels with RIPA buffer, moderate levels with the mixed buffer, and weak levels with the lysis buffer. CD63 (~50 kDa) and CD9 (~22 kDa) displayed consistently high levels across all the samples, with slightly better results with RIPA buffer and the mixed buffer. Thus, saliva-derived exosomes exhibited stable extraction patterns across the different buffer conditions, with the mixed buffer being most practical.
In conclusion, the RIPA + Lysis mixed buffer provided balanced and effective extraction from urine, plasma, serum, and saliva samples, with selective buffer adjustments recommended for targeted marker enrichment.
A Western blot analysis of exosomal markers isolated from (A) urine, (B) plasma, (C) serum, and (D) saliva samples using conventional PEG precipitation (PEG) and automated extraction with an NX-Jr instrument with different buffers (RIPA, LYS, and mixed RIPA/LYS) was performed. The molecular weights (kDa) are indicated on the left. The optimal buffer conditions varied depending on the sample type and target marker.
3.9. Comparative Analysis of CD63 Expression in Exosomes Isolated from Urine, Saliva, Plasma, and Serum Samples Using Different Methods
To evaluate the differences in CD63 levels based on the exosome isolation method, both Western blot and ELISA analyses were performed for four types of biological samples: urine, saliva, plasma, and serum (
Figure 9). For urine samples, exosomes were isolated using PEG precipitation, an EGCG solution (EGCG Sol.), the EGCG-modified magnetic beads (EGCG@T), and the magnetic bead core (T core). The Western blot analysis showed detectable CD63 (~45–60 kDa) levels using all the methods, with particularly strong bands observed in the PEG, EGCG@T, and T core samples. The EGCG Sol. group showed relatively weak levels. The EGCG@T method yielded the most intense and distinct CD63 bands. ELISA quantification confirmed this trend, revealing the highest CD63 levels with EGCG@T (0.29 ng/mL), over twice that with PEG (0.13 ng/mL), EGCG Sol. (0.12 ng/mL), and T core (0.13 ng/mL). These results suggest a synergistic effect of EGCG and magnetic beads in enhancing CD63-positive exosome isolation from urine.
Building on these findings, plasma samples were tested using PEG and EGCG@T. The Western blot analysis demonstrated stronger CD63 bands with the EGCG@T method than with PEG. The ELISA quantification supported this result, with the EGCG@T method yielding a CD63 level of approximately 5.7 ng/mL, compared to 3.4 ng/mL for PEG. This indicates that EGCG@T has significantly better isolation efficiency for CD63-positive exosomes from plasma.
In serum samples, both the PEG and EGCG@T methods showed strong CD63 bands in the Western blot, with similar intensities. The ELISA results showed comparable CD63 levels using both methods, with 5.6 ng/mL for PEG and 5.8 ng/mL for EGCG@T. These findings suggest that while both methods are effective for serum-derived exosome isolation, EGCG@T provides a slightly better performance.
Saliva samples were also analyzed using the PEG and EGCG@T methods. The Western blot results showed broad and strong CD63 bands (~37–75 kDa) using both methods, suggesting the presence of abundant CD63-positive exosomes in saliva. The ELISA analysis indicated a higher CD63 level with the EGCG@T method (0.13 ng/mL) compared to PEG (0.10 ng/mL), which is consistent with the trend observed in urine, though with a smaller difference. This may reflect matrix effects or intrinsic differences in salivary exosome characteristics.
In summary, across all four types of biological samples, the EGCG@T method consistently demonstrated better or comparable isolation efficiency for CD63-positive exosomes compared to the PEG method. The difference was most pronounced for urine and plasma samples, indicating that EGCG-modified magnetic beads are a promising tool for high-efficiency exosome isolation from diverse biological fluids.
Western blot and ELISA analyses were performed to compare CD63 expression in exosomes isolated from urine, saliva, plasma, and serum samples. Four different isolation methods were evaluated for urine samples: PEG precipitation (PEG), an EGCG solution (EGCG sol), the EGCG-modified magnetic beads (EGCG@T), and the magnetic bead core (T core). EGCG@T demonstrated the highest CD63 expression in both the Western blot and ELISA results (0.29 ng/mL). For saliva, plasma, and serum samples, exosomes were isolated using the PEG and EGCG@T methods. The Western blot results showed comparable or stronger CD63 expression with EGCG@T, and the ELISA confirmed higher CD63 levels in EGCG@T-treated samples compared to PEG samples, particularly for plasma. These results indicate that EGCG@T is a broadly effective method for isolating CD63-positive exosomes from diverse biofluids.
4. Discussion
The collective physicochemical analyses confirmed the successful surface modification of magnetic beads with EGCG. The SEM and elemental analyses revealed increased surface coverage and carbon contents with higher EGCG concentrations, indicating efficient surface coating. The FT-IR and UV–Vis spectra further supported the presence of EGCG-specific functional groups while preserving the optical characteristics of Fe
3O
4, suggesting stable composite formation. In addition, the zeta potential and DLS measurements demonstrated enhanced colloidal stability and reduced aggregation with increasing EGCG concentration. These findings are consistent with those of previous studies that reported that polyphenol-based nanoparticle functionalization can improve biomolecular interactions and isolation performance [
23].
Building upon these physicochemical properties, we developed a novel EGCG-modified magnetic bead-based method (EGCG@T) for efficient isolation and concentration of exosomes from diverse biofluids. The EGCG@T complex demonstrated superior performance in capturing exosomes compared to conventional methods, with optimization of the composition ratio (10× ratio of 0.1 mg EGCG:1 mg T-Fe
3O
4) yielding the highest efficiency. Our approach addresses several limitations of existing isolation techniques such as ultracentrifugation, which is time-consuming and equipment-intensive [
24,
25], and precipitation methods, which often co-isolate non-specific proteins [
26]. The automated protocol developed using the Nextractor NX-Junior platform successfully integrated exosome isolation and protein extraction into a single workflow, significantly reducing the processing time while maintaining or enhancing the isolation efficiency for multiple biofluid types.
We demonstrated that biofluid-specific optimization of the isolation protocol is essential, as the physicochemical properties of exosomes vary between sample types. For urine samples, a bead concentration of 12 mg/mL with a 10 min binding and 20 min elution without washing steps proved optimal. In contrast, plasma and serum samples required longer binding times (30 min) and shorter elution times (10 min) to maximize the recovery of various exosomal markers. The combination of RIPA and lysis buffer (RIPA + Lysis) consistently showed a balanced extraction of diverse exosomal markers (CD9, CD63, CD81, TSG101, and ALIX) across sample types, although the efficiency varied by biofluid. These findings align with those of previous studies that reported heterogeneity in exosome populations across different biofluids [
27,
28] and the importance of optimizing isolation conditions according to the sample characteristics [
29,
30].
One of the key findings of our study is that exosomal marker expression patterns vary significantly depending on the biofluid type. In urine samples, CD9 and CD63 showed high expression in the EGCG@T samples, while TSG101 and ALIX expression was more prominent in plasma and serum samples. These differences likely reflect the heterogeneity of the exosome subpopulations present in each biofluid [
31]. Kowal et al. reported that extracellular vesicles can be classified into several subpopulations based on the expression of tetraspanins and ESCRT complex components [
32]. Our results confirmed that this heterogeneity exists across different biofluids and suggest that isolation methods targeting specific markers should be optimized according to the biofluid type.
Notably, the samples obtained using the EGCG@T method on saliva samples showed stable and consistent levels of all exosomal markers. This suggests that salivary exosomes may have more homogeneous physicochemical properties compared to other biofluids. Han et al. reported that salivary exosomes possess distinct membrane compositions and surface properties that could affect isolation efficiency [
33]. Additionally, the lower protein complexity of saliva may facilitate interactions between EGCG and exosome membranes, enhancing isolation efficiency [
11]. In contrast, plasma and serum samples may require longer binding times for optimal isolation due to interference from abundant proteins such as albumin that interact with EGCG. Li et al. reported that protein–EGCG interactions in plasma could affect exosome isolation efficiency [
34]. The optimized protocols developed in this study have been adjusted for these biofluid-specific differences, providing an important methodological advancement for exosome research and diagnostic applications using various biofluids.
In this study, we systematically evaluated the impact of various extraction buffer compositions on the recovery of exosomal marker proteins. Testing RIPA buffer, lysis buffer, and various combinations of the two revealed that the buffer composition critically influences the levels of specific exosomal markers. Notably, we found that a 2:1 ratio mixture of RIPA and lysis buffers provided a balanced recovery of diverse exosomal markers from most biofluids. This aligns with the findings reported by Shao et al. who demonstrated that composite buffer systems may be more effective for extracting various membrane and cytosolic proteins than single lysis buffers [
1].
Interestingly, ESCRT (Endosomal Sorting Complex Required for Transport) complex-associated proteins such as TSG101 and ALIX were more sensitive to the lysis buffer components, while tetraspanin proteins including CD9, CD63, and CD81 were more effectively extracted with RIPA buffer. This suggests differences in protein composition and membrane characteristics among exosome subpopulations. Zhang et al. reported that tetraspanins are predominantly located in lipid rafts, and these membrane microdomains may be more effectively solubilized by the detergents included in RIPA buffer [
35].
In contrast, Urabe et al. demonstrated that ESCRT-related proteins could be more effectively extracted using buffers containing denaturants such as urea [
36]. The RIPA + Lysis mixed buffer system developed in this study leverages these properties to efficiently and simultaneously extract a broad range of marker proteins from various exosome subpopulations. This could be an important advantage for future clinical applications such as disease diagnosis through liquid biopsy. Peterson et al. showed that analyzing diverse exosomal markers simultaneously could significantly improve diagnostic accuracy compared to relying on single markers [
37].
In this study, we established an integrated workflow for efficient exosome isolation from various biofluids using a combination of the Nextractor NX-Junior automated system and EGCG-modified magnetic beads. One of the major advantages of this automated platform is the integration of exosome isolation and protein extraction steps, which have traditionally been performed as separate processes, into a single procedure. This not only significantly reduces the sample processing time but also minimizes the sample loss that can occur during multi-step isolation processes. Whiteside et al. reported that additional exosome isolation steps can substantially reduce the final recovery rates [
5].
The quantitative assessment using ELISA confirmed that the automated system using the EGCG@T method isolated CD63-positive exosomes from urine samples more than twice as efficiently as the conventional PEG precipitation method. This suggests that the synergistic effect of EGCG’s specific binding to exosome membrane phospholipids [
38] and the efficient magnetic separation characteristics of magnetic beads enables high-efficiency exosome isolation. Moreover, the system can be used for various biofluids and can isolate exosomes from small sample volumes (200–1000 μL), indicating its high potential for application in clinical diagnostic settings. Kosaka et al. emphasized that effective exosome isolation from small volumes of biofluids could make liquid biopsy using exosomes an innovative tool for early diagnosis and monitoring of various diseases including cancer [
39].
Particularly noteworthy is that in saliva samples, the system detected various exosomal markers such as CD9, CD63, CD81, and TSG101 at uniformly high levels. According to Raposo et al., saliva is a non-invasively obtained sample that can contain biomarkers for not only oral diseases but also systemic diseases, making it diagnostically valuable [
40]. The automated system developed in this study can effectively isolate various exosome subpopulations in saliva, which is expected to greatly enhance the potential clinical application of saliva-based liquid biopsy in the future.
While this study validated the efficiency of exosome isolation using EGCG-modified magnetic beads for various biofluids, several limitations exist. First, we primarily evaluated exosome isolation efficiency based on protein marker expression. However, to fully understand the integrity and functional characteristics of exosomes, additional characterization through morphological analysis via electron microscopy, size distribution measurements via nanoparticle tracking analysis (NTA), and analysis of RNA content in the isolated exosomes is necessary. Witwer et al. emphasized the importance of diverse characterization methods in exosome research [
41]. Second, follow-up studies comparing healthy controls and patient samples with various disease states are needed to further clarify the clinical utility of the method developed in this study. In particular, analyzing differences in exosome profiles across various pathological conditions such as cancer, neurodegenerative diseases, and cardiovascular diseases is crucial for demonstrating the diagnostic value of this method. Zhang et al. reported that serum exosome profiles from cancer patients could show significant differences compared to those of healthy controls [
42]. Third, while the current automated system is optimized for small-scale research environments, scaling up to systems with a higher throughput and reproducibility is necessary for large-scale clinical applications. Gardiner et al. emphasized that the development of standardized high-throughput isolation methods is essential for the clinical application of exosome-based biomarkers [
43].
Future research should focus on improving the chemical stability of the EGCG@T complex and developing techniques for the selective isolation of specific exosome subpopulations through surface functionalization. In particular, the development of EGCG@T complexes conjugated with antibodies or aptamers that can selectively capture exosomes related to specific cancers or diseases could greatly enhance the specificity and sensitivity of liquid biopsy. Zhao et al. reported a method for selectively isolating specific cancer-related exosomes using magnetic beads coupled with targeting antibodies [
9]. These types of studies are expected to further expand the potential clinical applications of EGCG-modified magnetic bead-based exosome isolation methods.
Given the exploratory nature of this study, statistical comparisons were not performed at this stage. However, future work will incorporate a greater number of biological replicates and statistical analyses (e.g., ANOVA) to validate the reproducibility and significance of the observed trends.
Despite the absence of formal statistical tests, we evaluated exosome enrichment using known high-abundance non-exosomal proteins. Although THP and albumin are not classical negative markers, they serve as representative contaminants in urine and plasma, respectively. Their reduced presence in the eluted fraction supports the selectivity of our isolation method.


