Article

RML-YOLO: An Insulator Defect Detection Method for UAV Aerial Images

Guangxi Key Laboratory of Images and Graphics Intelligent Processing, Guilin University of Electronic Technology, Guilin 541004, China
*
Author to whom correspondence should be addressed.
Appl. Sci. 2025, 15(11), 6117; https://doi.org/10.3390/app15116117
Submission received: 12 April 2025 / Revised: 23 May 2025 / Accepted: 26 May 2025 / Published: 29 May 2025
(This article belongs to the Special Issue Deep Learning in Object Detection)

Abstract

The safety of power transmission lines is crucial to public well-being, with insulators being prone to failures such as self-detonation. However, images captured by unmanned aerial vehicles (UAVs) carrying optical sensors often face challenges, including uneven object scales, complex backgrounds, and difficulties in feature extraction due to distance, angles, and terrain. Additionally, conventional models are too large for UAV deployment. To address these issues, this paper proposes RML-YOLO, an improved insulator defect detection method based on YOLOv8. The approach introduces a tiered scale fusion feature (TSFF) module to enhance multi-scale detection accuracy by fusing features across network layers. Additionally, the multi-scale feature extraction network (MSFENet) is designed to prioritize large-scale features while adding an extra detection layer for small objects, improving multi-scale object detection precision. A lightweight multi-scale shared detection head (LMSHead) reduces model size and parameters by sharing features across layers, addressing scale distribution imbalances. Lastly, the receptive field attention channel attention convolution (RFCAConv) module aggregates features from various receptive fields to overcome the limitations of standard convolution. Experiments on the UID, SFID, and VISDrone 2019 datasets show that RML-YOLO outperforms YOLOv8n, reducing model size by 0.8 MB and parameters by 500,000, while improving AP by 7.8%, 2.74%, and 3.9%, respectively. These results demonstrate the method’s lightweight design, high detection performance, and strong generalization capability, making it suitable for deployment on UAVs with limited resources.

1. Introduction

With the acceleration of industrialization, the demand for electric power continues to grow, and higher requirements are put forward for the reliability, safety, and stability of transmission lines. As critical components in power infrastructure, insulators perform the dual functions of mechanical support and electrical insulation. Subjected to prolonged exposure to extreme environmental conditions, these components face degradation risks, including spontaneous fracturing and surface flashover. Such failures will not only trigger power outages, but also may lead to conductor damage, fire, and other serious consequences, resulting in huge economic losses and security risks. Therefore, the regular inspection of insulators is absolutely necessary to ensure the stable operation of the power grid [1,2,3,4].
The traditional manual inspection method faces problems such as complicated terrain, low efficiency, and high personal risk [5]. In recent years, with the development of drones and computer vision technology [6], the use of drones carrying optical sensors to obtain images, and then through the vision algorithm to identify insulator defects, has gradually become the mainstream method [7,8,9,10].
Nowadays, with the continuous development of computer vision, a variety of computer vision-based methods have been applied to insulator image detection over the past few years, including image-processing-based and deep-learning-based ones, achieving remarkable results. Traditional methods such as Histogram of Oriented Gradients (HOG) [11], Scale-Invariant Feature Transform (SIFT) [12], and Local Binary Patterns (LBPs) [13] rely on manual feature design, making them susceptible to shooting angles and lighting changes. Consequently, they have poor generalization ability and low detection accuracy. In contrast, deep-learning-based object detection methods like Faster R-CNN [14], SSD [15], and the YOLO series [16,17,18,19,20,21,22,23,24] offer higher robustness and detection performance. While two-stage algorithms boast high accuracy, their computational complexity is significant. In comparison, single-stage algorithms, with their lighter structure and faster speed, are more suitable for deployment on resource-constrained drone platforms.
Although the above research work has addressed some of the difficulties in inspecting insulators by UAVs to a certain extent, there are still more challenges that have not been effectively addressed. Most of these problems arise from the practical engineering applications to which they are oriented.
The significant variation in insulator and defect sizes poses a major challenge to conventional detection algorithms. Drones, equipped with high-precision cameras, capture high-resolution images from afar, making the objects seem quite small relative to the overall image. Moreover, variations in shooting distance and angle further amplify these size discrepancies, thus undermining the effectiveness of standard detection methods. In existing research on power line insulator defects, a strategy of constructing a multi-scale fusion network is typically employed for multi-scale objects. Han et al. [25] integrated an scSE attention mechanism with PA-Net to address multi-scale detection challenges. However, their approach merged features from only two levels and utilized numerous lightweight Ghost modules, which lessened the model’s overall detection performance. In contrast, He et al. [26] put forward ResPANet, a multi-scale feature fusion framework that leverages residual jump connections to integrate high- and low-resolution features, thereby improving multi-scale detection capability without adding to the computational cost. Despite this progress, the method did not incorporate a 160 × 160 feature map that contains rich information, limiting its effectiveness for small objects. Similarly, Li et al. [27] concentrated on large-scale feature maps through a Bi-PAN-FPN approach, enhancing the frequency and duration of multi-scale feature fusion to lower false and missed detections in aerial images. As can be seen from the above literature, employing the method of fusing features of different levels can boost the detection ability for multi-scale objects to a certain extent. These detection methods offer references for multi-scale object detection.
Current deep learning implementations face a critical efficiency–accuracy tradeoff, where computational complexity escalates alongside precision enhancement, severely impeding deployment feasibility on edge devices like UAVs with constrained resources. To address this challenge, Han et al. [25] developed a context-streamlined convolutional framework (C2fGhost) that achieves 75.7% parametric compression through architectural pruning. Qu et al. [28] developed a lightweight insulator feature pyramid network (LIFPN) alongside a compact insulator-oriented detection head (LIHead) to trim model parameters. Aiming to preserve accuracy while drastically cutting parameters, Li et al. [29] created a new lightweight convolution module, EGC; built the backbone network around it; and employed a lightweight EGC-PANet in the neck section for efficient feature fusion and further parameter reduction. From the above reference, it is evident that the mainstream methods for reducing parameter volume generally involve modifications to network architecture, often at the expense of some degree of accuracy.
The detection accuracy of insulators is often limited by complex backgrounds and insufficient feature extraction capabilities.The extensive distribution of high-voltage power lines, along with varied terrain, causes a high degree of resemblance between objects and their backgrounds, posing a tough challenge for detection. Zhou et al. [30] proposed a cascaded structure as the backbone network, yet this increased model complexity considerably. Zhao et al. [31] enhanced the Faster R-CNN model by adding a feature pyramid network (FPN) to identify insulators in complex-background images. Nevertheless, combining the two-stage Faster R-CNN model with the FPN network further complicates the model, creating difficulties in both training and detection.
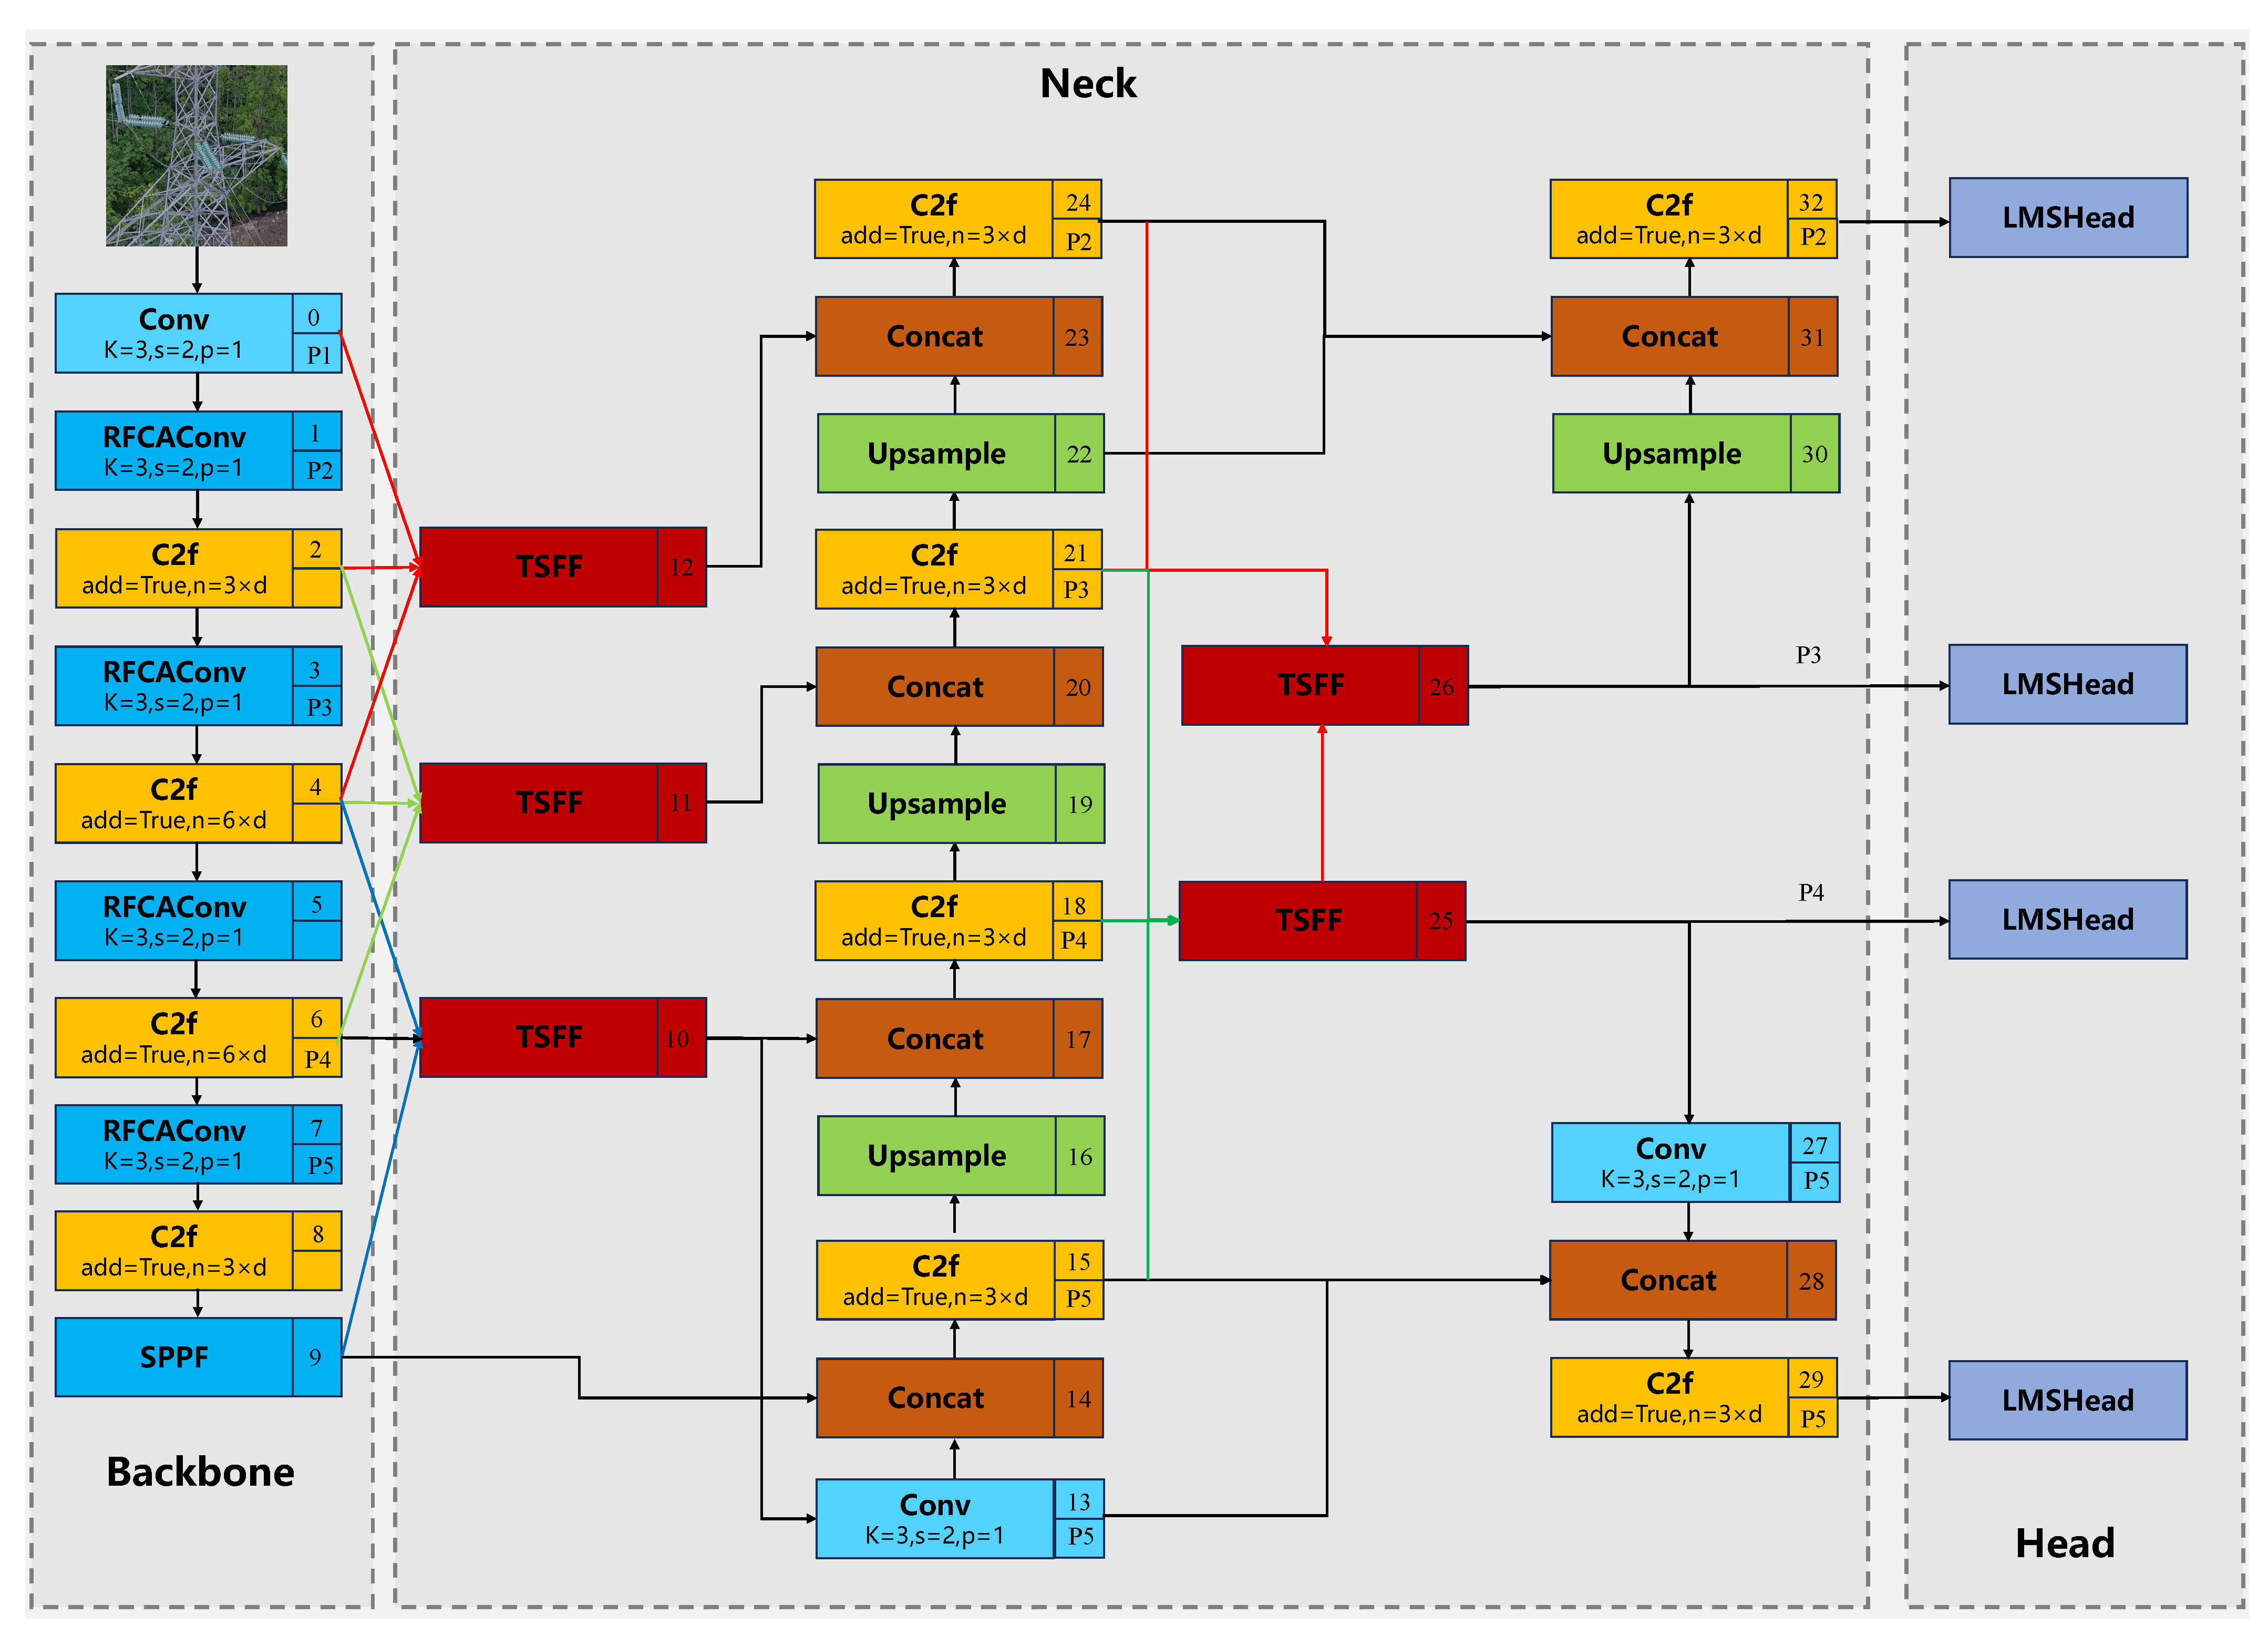
The referenced studies provide a foundation for our research. While existing detection algorithms address some challenges in drone-based insulator inspection, they fall short in handling issues like significant object size variation and high parameter volume. To address these challenges, this paper proposes RML-YOLO, a lightweight, multi-scale insulator defect detection method for drone-captured images. The core innovations are MSFENet and LMSHead, which enhance multi-scale object detection while reducing model parameters. The key contributions are as follows:
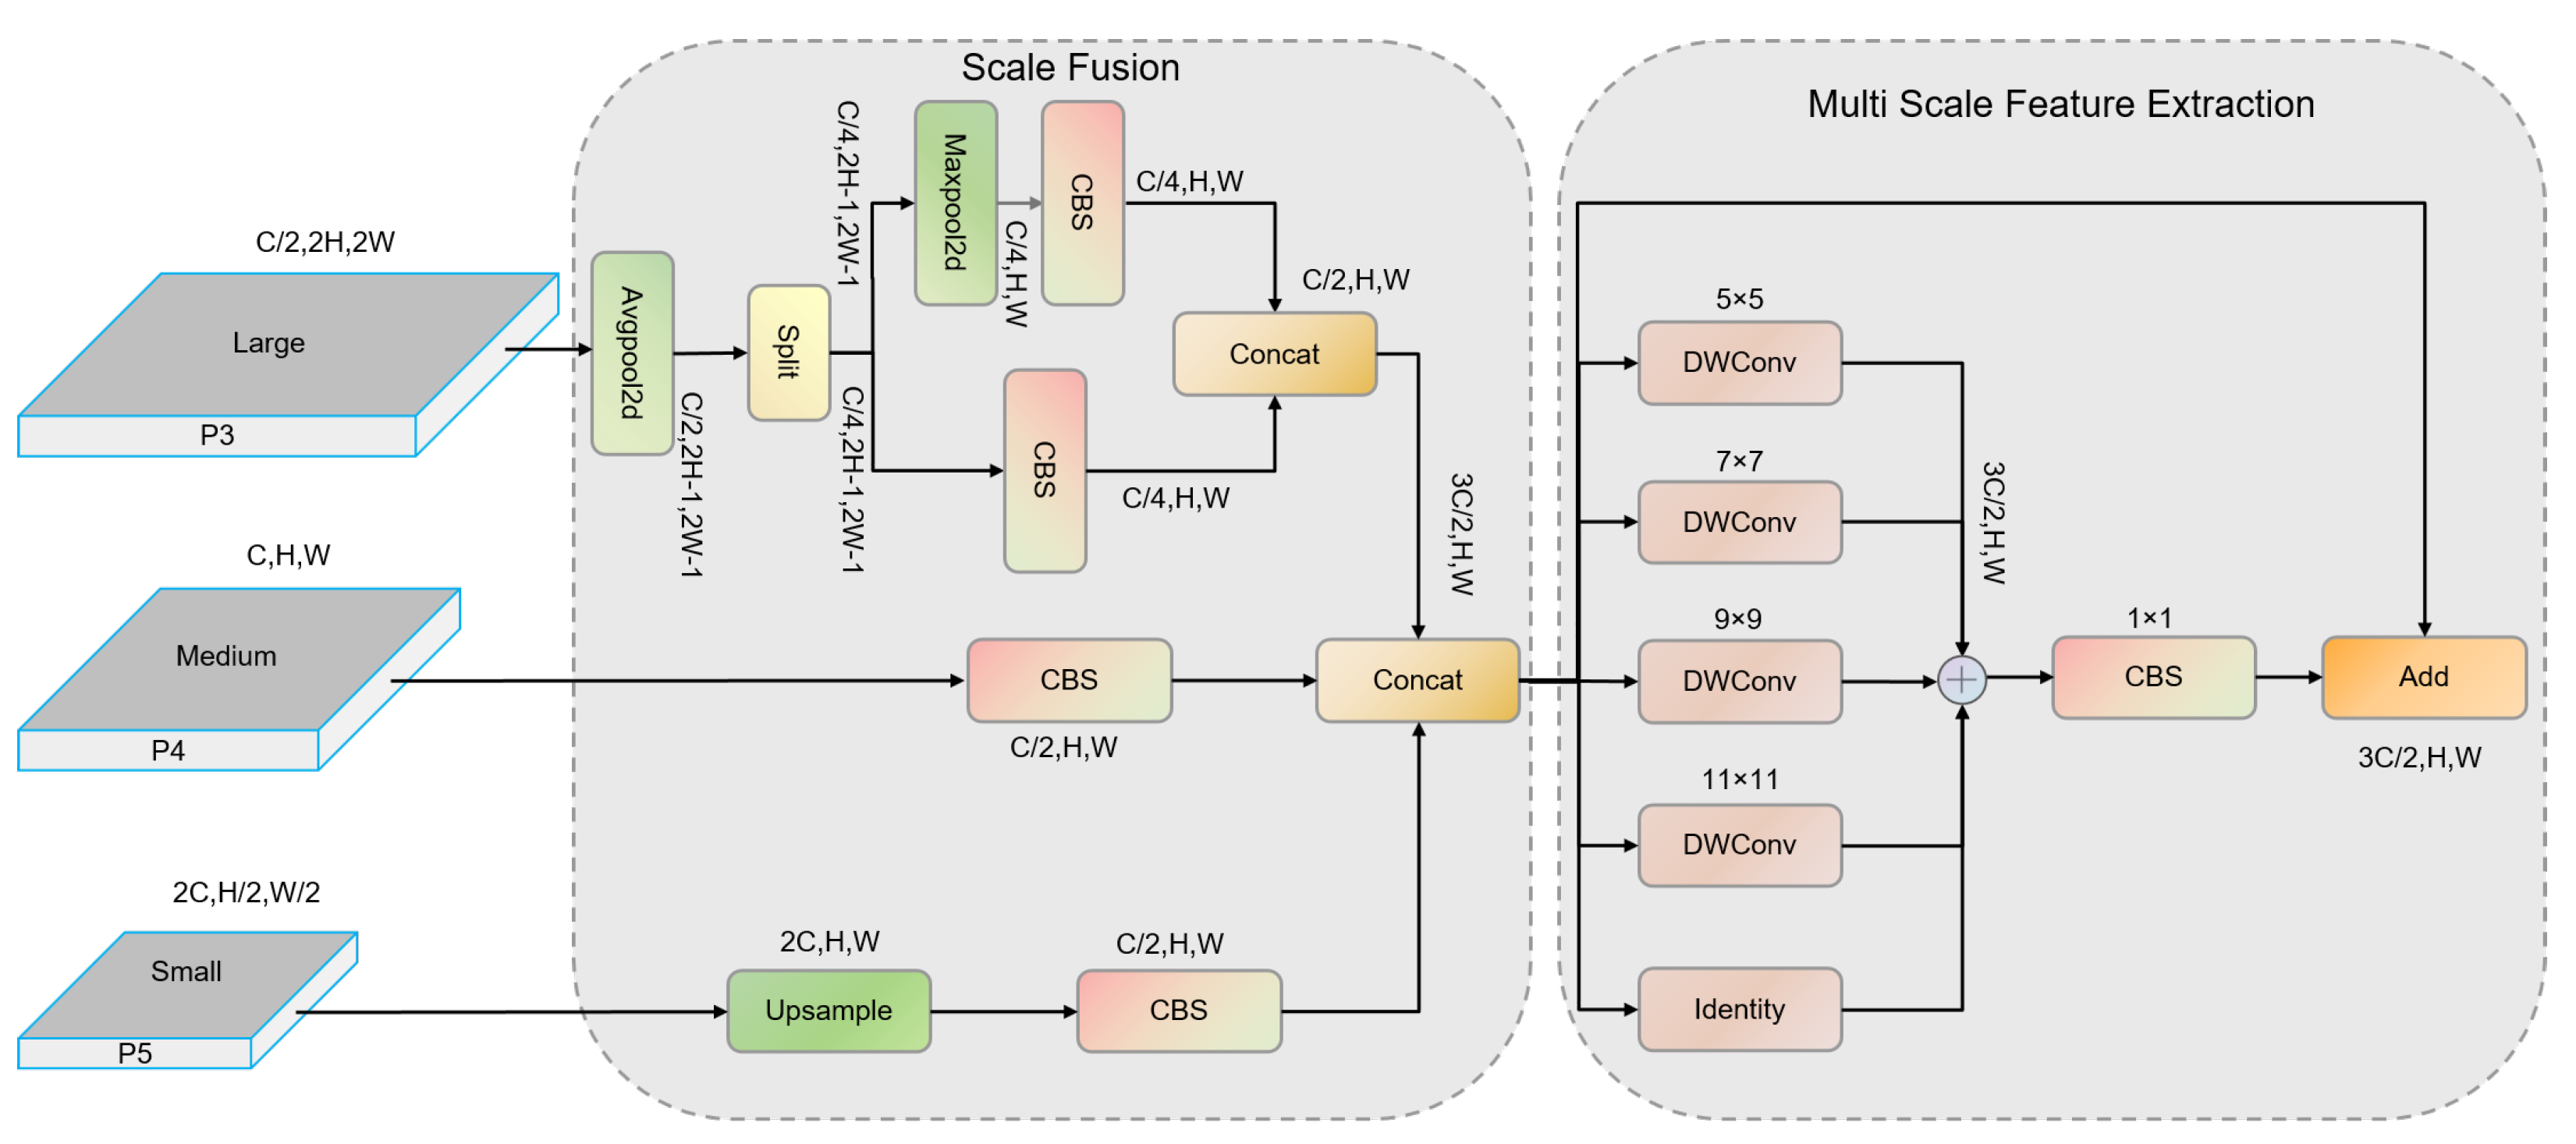
  • To address the challenges posed by the large variation in insulator and defect sizes, we propose MSFENet. This network improves upon traditional FPN by proposing a TSFF module to better fuse features across different layers. A multi-head detection strategy is employed to enhance the model’s ability to detect multi-scale objects.
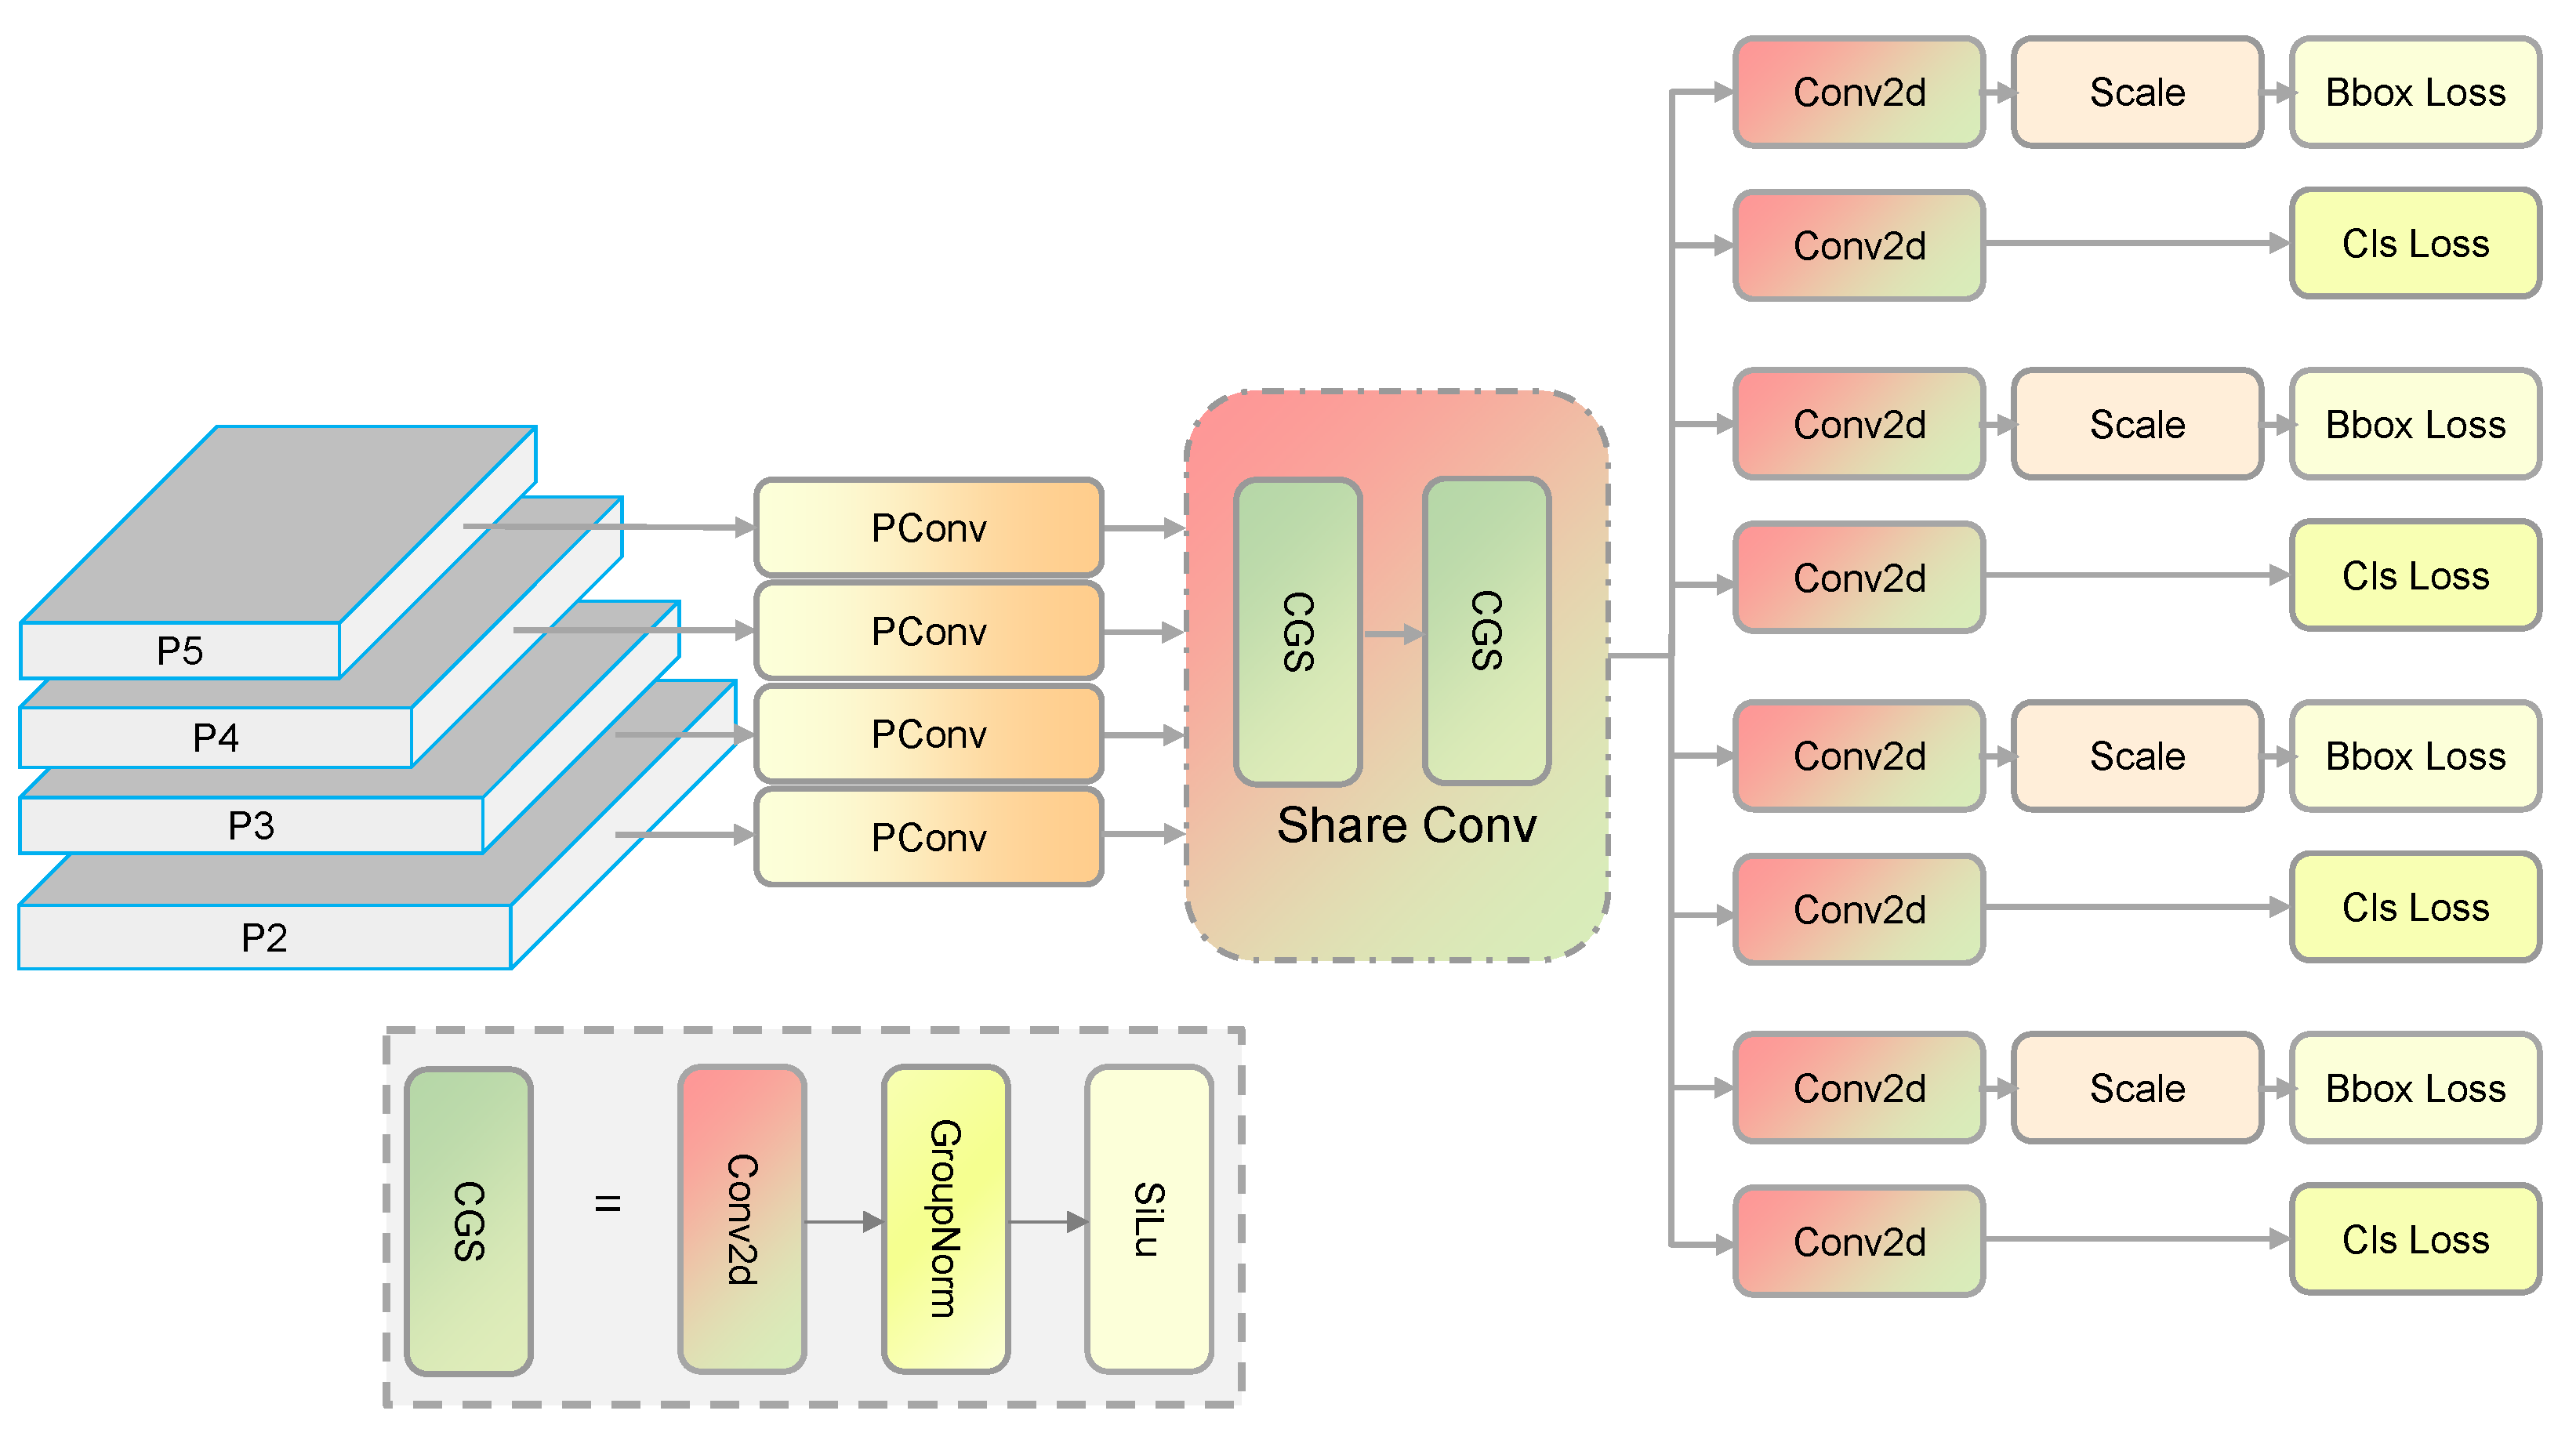
  • To mitigate the issue of high parameter volume in existing detection algorithms, we propose LMSHead, a lightweight multi-scale shared detection head. This head utilizes partial convolutions to extract features from various levels and applies shared convolutions to reduce model size and parameter count, while addressing the uneven distribution of objects across scales.
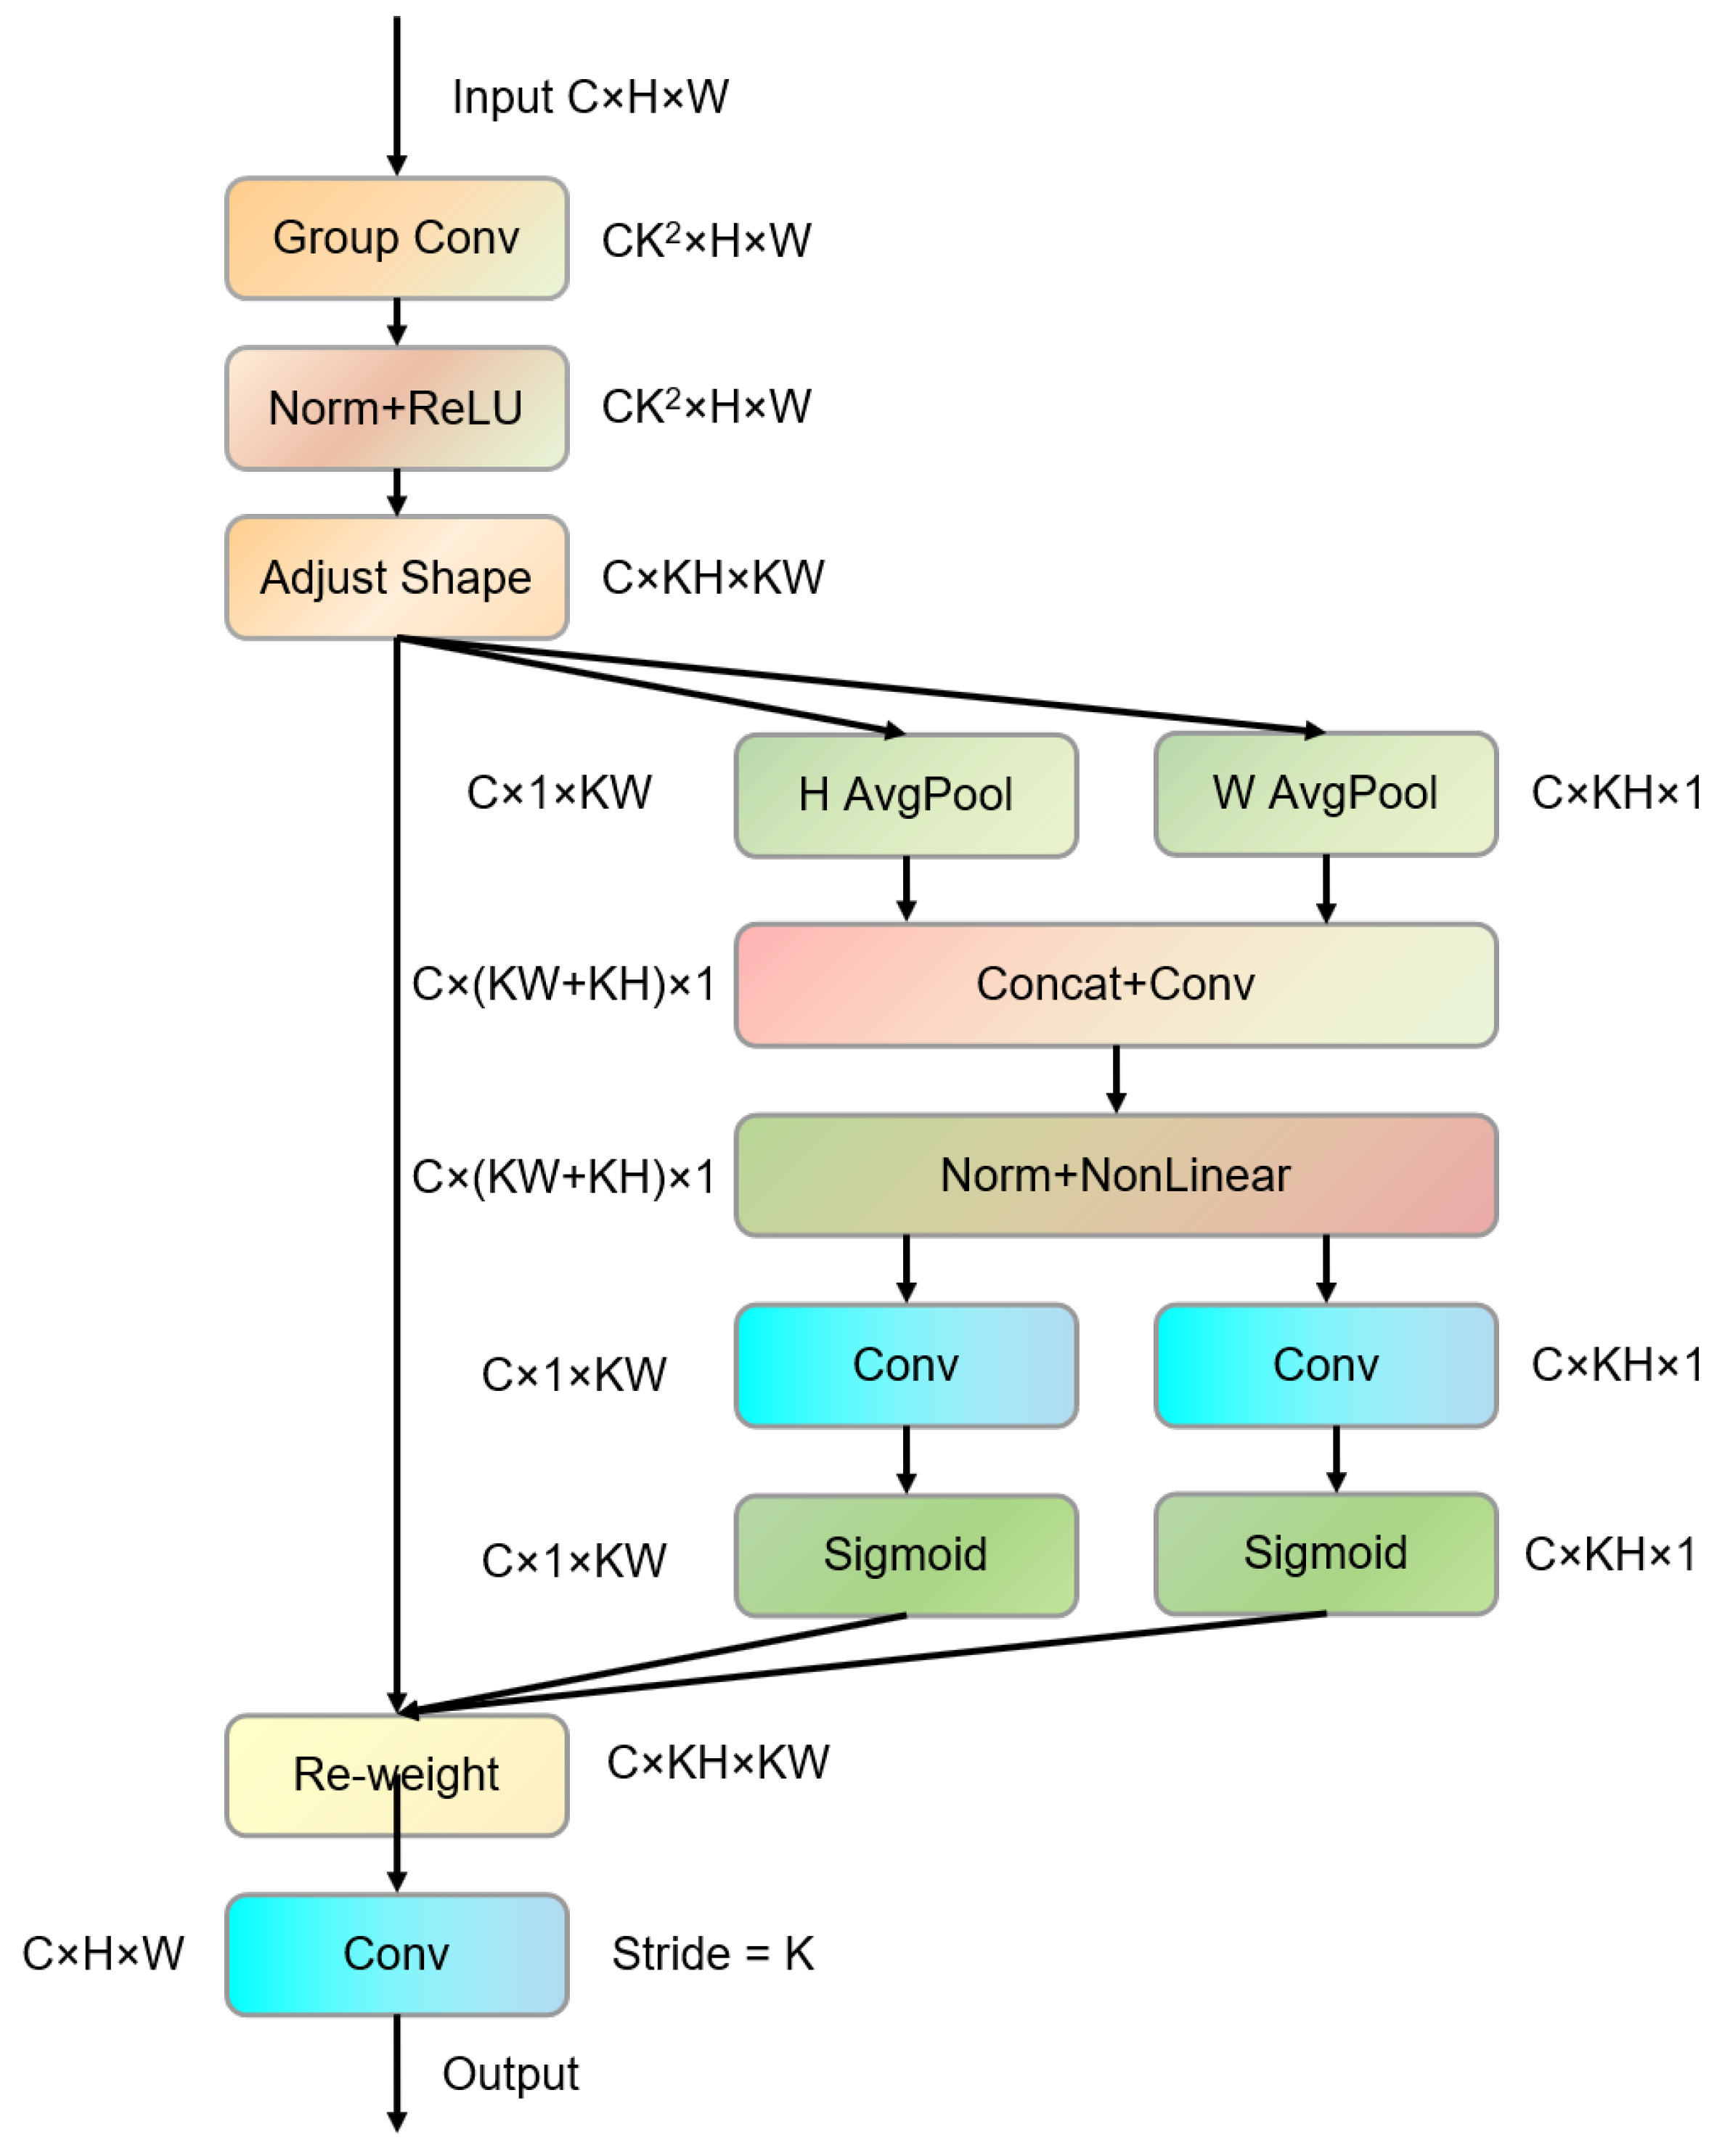
  • To improve detection performance in complex backgrounds, we incorporate RFCAConv, which enhances feature extraction by aggregating information from different receptive fields. This convolution, combined with CA attention mechanisms, allows the model to effectively capture features from various positions, overcoming the limitations of standard convolutions.
These innovations collectively improve detection accuracy, reduce computational complexity, and enhance the model’s robustness in challenging environments.
The remainder of this paper is organized as follows: Section 2 of this paper provides a comprehensive overview of the methods employed in this study, with a detailed description of the proposed MSFENet and LMSHead architectures. Section 3 introduces the datasets used in the research, along with the experimental environment, parameter settings, evaluation metrics, and experimental results, followed by an in-depth analysis of these results. Section 4 discusses the strengths and limitations of the current study, explores the potential for applying the proposed improvements to other models, and outlines future research directions. Finally, Section 5 presents a summary of the main research content and findings of this paper.

2. Materials and Methods

2.1. Design of Multi Scale Feature Extraction Pyramid Network

When drones capture inspection images of power objects, significant changes in object size due to variations in shooting angle and distance present a challenge for detection algorithms. Although YOLOv8’s feature pyramid network (FPN) can perform some degree of multi-scale feature fusion, its simple top–down and lateral connections may fail to fully capture inter-level dependencies, leading to suboptimal information fusion. Furthermore, traditional FPNs, by upsampling smaller feature maps and merging them with previous layers, overlook the rich semantic information in larger feature layers. This approach limits the model’s ability to process small objects, ultimately constraining its multi-scale detection performance.
To address these issues, this paper introduces a novel multi-scale feature extraction network MSFENet, which integrates a tiered scale fusion feature (TSFF) module at its core. As shown in Figure 1, MSFENet aims to overcome the limitations of traditional FPN by better exploiting large-scale feature information during fusion. Specifically, the network combines feature maps from multiple scales in a hierarchical manner: it fuses B1 (320 × 320), B2 (160 × 160), B3 (80 × 80), B4 (40 × 40), and B5 (20 × 20) into new feature maps of progressively smaller sizes. For example, B1, B2, and B3 are fused into a 160 × 160 feature map (T2), and so on, ensuring comprehensive information fusion. In contrast with traditional networks, MSFENet incorporates large-scale feature maps, such as B1 and B2, during the fusion process and feeds multi-scale feature levels (P2, P3, P4, and P5) into the detection head for multi-head detection, thereby enhancing small object detection.
The core of MSFENet is the TSFF module. In the first half of the module, a scale fusion component is employed to merge multi-scale feature maps gathered from the backbone within the pyramid structure. The second half is composed of deep convolutions in parallel with the inception style, which can capture more extensive and more scale context information without affecting the integrity of local texture features. The detailed structure can be seen in Figure 2.
The initial segment of the network consists of a scale fusion module. First, divide the features into three different scales: large, medium, and small. For the input large-size feature map, perform an average pooling operation first. This operation can smooth the feature map, reduce the influence of noise, and also reduce the spatial size and computational cost of the feature map. Compared with maximum pooling, average pooling can retain more global information and avoid excessive attention to local maxima. Then, the average-pooled feature map is split into two parts along the channel dimension. Each branch contains half the original number of channels. In the two divided parts, one part first performs a 3 × 3 maximum pooling to retain the significant local information in the image, highlight important features, and reduce the spatial size, and then a 1 × 1 convolution operation is performed to adjust the channel count without altering the spatial resolution. The other part performs a 3 × 3 convolution operation with a stride of 2 to extract local features of the image and enhance the capture of details. As a result, both branches produce outputs that are reduced by half in both spatial size and channel count relative to the original large-scale feature input. Finally, the resulting feature maps from both branches are merged via channel-wise concatenation, generating a compact yet informative output feature map of size ( C / 2 , H , W ) . The entire process is described as Equations (1) and (2), where F l refers to the input large-size feature map, C refers to the number of channels, X 1 and X 2 refer to the two divided parts of features, A v g P o o l refers to average pooling, S p l i t refers to the feature splitting operation, C o n c a t refers to the feature concatenation operation, C o n v refers to convolution, and M a x P o o l 2 d refers to maximum pooling.
[ X 1 , X 2 ] = S p l i t ( A v g P o o l ( F l ) , C / 2 )
F l = C o n c a t ( C o n v ( X 1 ) , C o n v ( M a x P o o l 2 d ( X 2 ) ) )
For the medium-scale feature, perform pointwise convolution so that it can effectively mix the channel information together, which helps to enrich the feature expression. After processing, the size of the feature map becomes ( C / 2 , H , W ) . The entire process is described as Equation (3), where F m is the input medium-scale feature tensor, and F m refers to the feature tensor of F m after convolution processing.
F m = C o n v ( F m )
For the small-scale feature map, an upsampling operation is first applied. This step increases the spatial resolution, allowing the feature map to capture more detailed spatial information, which is beneficial for subsequent feature fusion. Following the upsampling, a 1 × 1 convolution is employed to modify the channel dimensionality while keeping the spatial dimensions unchanged. This adjustment aligns the feature map’s channel count with those of other scales, making it more compatible for fusion. Upon completion of these operations, the processed small-scale feature map has a final size of ( C / 2 , H , W ) . The mathematical formulation of this procedure is expressed as follows:
F s = C o n v ( U p s a m p l e ( F s ) )
where F s refers to the input small-size feature map, and F s refers to the feature map of F s after upsampling and convolution processing.
After processing the large-, medium-, and small-sized feature maps, perform concatenation.Through the concatenation operation, the model can leverage multi-scale information to create a more complete information representation and enhance its ability to handle complex scenes. The concatenated feature map contains information at different levels, enabling the model to more effectively capture the diversity of objects. The specific process is as follows:
X s f = C o n c a t ( F l , F m , F s )
The second half of the TSFF module is an inception-style network. It consists of a set of parallel depthwise convolutions. Each convolution kernel size corresponds to different receptive fields, enabling the model to capture spatial features of different scales. At the same time, using depthwise convolutions can effectively reduce the amount of calculation and parameters while retaining a strong feature extraction ability. Then use 1 × 1 convolution to integrate features of different receptive field sizes, thereby capturing broader contextual information without compromising the integrity of local textures. Finally, perform residual connection between the scale-fused features and the multi-scale extracted features. Through this residual connection, the network retains the original feature information while learning convolutional features, so that it can better capture and represent the details and high-level semantic information of the input data. The process is as follows:
Z d w = C o n v ( X s f + 4 m = 1 D W C o n v k m × k m X s f )
P = X s f + Z d w
D W C o n v k m × k m is the context feature extracted by the m-th k m × k m depthwise convolution (DWConv). In our experiment, we set k m = m + 1 × 2 + 1 , m = 1 , 4 . Z d w as the output feature after multi-scale feature extraction and P as the feature after residual concatenation.

2.2. Design of Lightweight Multi-Scale Shared Detection Head

Current object detection algorithms typically involve a vast number of parameters, which makes their deployment on devices such as drones difficult. In YOLOv8, its detection head uses independent detection heads on different feature levels. This architecture leads to low parameter utilization and high computational cost. The introduction of the FPN structure aims to predict objects of varying scales on specific feature maps. Each layer’s detection head extracts features for classification and regression tasks. However, training a detection head requires ample samples of diverse scales. Due to FPN’s inherent division of objects by scale, the samples in each layer of the neck component are imbalanced. This imbalance may cause overfitting when training the different detection heads separately.
To address the aforementioned issues, we have designed a new detection head structure called the lightweight multi-scale shared detection head (LMSHead). Its structure is shown in Figure 3. The design begins with the application of partial convolution (PConv) [32] to extract features from multi-scale feature maps’ output by the neck module. In PConv, standard convolution operations are applied only to a subset of input channels for spatial feature learning, while the remaining channels are passed through without modification. This mechanism enables enhanced feature extraction capability while maintaining low computational complexity. After that, a set of feature-sharing convolutional layers is used, which is iteratively used in each detection head. By sharing the convolutional layers, the model can further integrate the information between different detection layers to improve the robustness of feature extraction and reduce the number of parameters, and since the dataset is shared, the features at different scales can share the same object, which solves the problem of uneven distribution of objects at different scales and expands the data volume. The inner part of shared convolution consists of Conv, GroupNorm, and SiLU. Compared with batch normalization, GroupNorm overcomes the limitation of batch normalization in a small batch and distributed training and, at the same time, provides a more stable training process and a better generalization ability, assuming that the number of channels C is divided into G groups. The normalization calculation for each group is shown in Equation (8), where μ and σ 2 are the mean and variance of each set of channels, and ϵ is a small constant to prevent division by zero errors from occurring.
y g n = y μ σ 2 + ϵ
Given that object detection involves both classification and regression tasks, the regression task requires bounding boxes of different scales for objects of varying sizes. To accommodate this, we introduce a scaling factor that dynamically adjusts the object scales in the regression task. The scaling process formula is shown as Equation (9), where S i represents the scaling factor for each feature layer, c v 2 y i denotes the convolution operation applied to the features from different layers, and Z i represents the scaled feature map.
Z i = S i · c v 2 ( y i )
The detection head designed in this paper improves the efficiency of the model to utilize the features of different layers and relieve the problem of uneven distribution of objects at different scales. This improvement leads to better multi-scale detection performance. Additionally, the incorporation of parameter-sharing convolutional layers not only reduces both the number of parameters and computational cost, but also maintains a high level of detection accuracy. As a result, the model achieves efficient and lightweight performance without sacrificing effectiveness.

2.3. Convolution Combined with Receptive Field Attention Mechanism

One of the key reasons for suboptimal performance in object detection models is the limited feature extraction capability of standard convolution operations. In traditional convolutional operations, the same convolution kernel K is applied to all positions within the receptive field, causing the model to share parameters across spatial locations. This shared parameter approach fails to capture the variations in feature representations due to positional differences, which ultimately restricts the performance of convolutional neural networks. In the context of UAV-based insulator inspection, where objects can vary greatly in size and appearance due to perspective, a more powerful convolution operation is necessary to improve detection performance. To overcome this limitation, this paper introduces RFCAConv [33] as a replacement for standard convolution in the backbone network. RFCAConv integrates the Receptive Field Attention (RFA) mechanism with the channel attention (CA) module [34], as shown in Figure 4. The RFA component dynamically highlights the most informative regions within the receptive field, strengthening the model’s ability to capture spatially sensitive features and alleviating the constraints caused by shared weights in traditional convolutions. This enhancement significantly improves feature learning, especially in complex scenes with cluttered backgrounds. Meanwhile, the CA module embeds positional information into the channel attention mechanism, which further strengthens the representation power of learned features, particularly in mobile networks where feature diversity is crucial. By fusing RFA and CA, RFCAConv efficiently captures contextual and positional dependencies, elevating the network’s proficiency in extracting and modeling features from varied spatial locations within images. This advancement ultimately enhances the overall detection performance in challenging scenarios.
Given an input feature map of dimensions ( C , H , W ) , the initial processing stage employs grouped convolutions [35], treating each channel independently and expanding them spatially to increase the receptive field.This results in an intermediate feature map of size ( C K 2 , H , W ) , where K denotes the kernel size. Batch normalization and ReLU activation are subsequently applied to stabilize training and enhance non-linear representation. Next, the Adjust Shapeoperation increases spatial resolution by reshaping the feature map into ( C , K H , K W ) , facilitating finer processing in subsequent operations. To incorporate spatial attention, global average pooling is performed along both width and height dimensions, generating two feature vectors that capture global spatial information. These are concatenated and passed through a shared 1 × 1 convolution to produce a feature map of size ( C , K W + K H , 1 ) , followed by a non-linear activation function. The resulting feature map is then split into two parts corresponding to width and height, and Sigmoid activation generates attention weights. These weights modulate the original feature map to emphasize important spatial regions. Finally, a convolution applies these weights, yielding the output feature map. This attention mechanism mitigates parameter sharing issues and enables the model to selectively focus on critical spatial features, improving its representational capability.
Assuming that the input feature map has dimensions ( C , H , W ) , the feature maps are initially processed through grouped convolutions [35], where each channel is treated independently. This process expands each channel spatially to increase the receptive field, resulting in an intermediate feature map of size ( C K 2 , H , W ) , where K represents the kernel size. The feature map is then passed through batch normalization and a ReLU activation function to stabilize training and increase the model’s non-linear expressiveness.The next step, referred to as the Adjust Shape operation, enhances the spatial resolution of the feature map by expanding it along the spatial dimensions corresponding to the convolution kernel, resulting in a feature map of size ( C , K H , K W ) . This expansion enables the finer processing of features during subsequent pooling and attention operations, allowing for a better capture of spatial dependencies. To incorporate attention across both spatial dimensions (width and height), the feature map undergoes global average pooling along each of these dimensions. This step generates two feature maps—one for the width and one for the height. These pooled feature maps, which capture global receptive fields for both spatial directions, are concatenated for further feature extraction. The concatenated feature maps are then passed through a 1 × 1 convolution with shared weights, producing a feature map of size ( C , K W + K H , 1 ) . Non-linearity is introduced through an activation function. This concatenated feature map is then partitioned into two parts corresponding to the width and height dimensions, and a Sigmoid activation function is applied to generate attention weights. These weights modulate the intensity of the input feature map, allowing the network to focus more on important regions. Finally, a convolution operation applies these attention weights to the feature map, resulting in the final output feature map. This attention mechanism reduces the problem of parameter sharing and enables the network to more effectively focus on crucial spatial features, enhancing its ability to selectively amplify informative regions of the input.

2.4. RML-YOLO Network Structure

YOLOv8, one of the most widely used object detection algorithms, is known for its fast detection speed and relatively low computational complexity. Building upon YOLOv8, this paper introduces RML-YOLO, an improved algorithm that integrates MSFENet, LMSHead, and RFCAConv to enhance its performance, particularly in detecting insulators in complex environments. The overall structure of RML-YOLO is depicted in Figure 5. In the backbone network, the original convolutional layers of YOLOv8 are replaced with RFCAConv, which aggregates features with different receptive fields. This modification enables the model to effectively capture features from various locations, thereby enhancing its capability to detect insulators in complex background environments. In the neck layer, this study employs MSFEPNet, where the TSFF module is utilized to fuse features from the P1–P5 layers extracted by the backbone network, generating three feature maps of different scales: p2, p3, and p4. Unlike the traditional FPN structure in YOLOv8, which only upsamples small-scale feature maps, MSFEPNet incorporates abundant semantic information from large-scale feature layers (P1 and P2), significantly improving the detection performance for small objects.To ensure that the feature maps fed into the detection head retain rich detailed features, the TSFF module is also applied to the P2–P5 layers of the neck, resulting in two additional feature maps of different sizes: p3 and p4. The P2 and P5 layers are directly fused and processed. Finally, the fully fused multi-scale feature maps (P2–P5) in the neck are input into the detection head for final detection. Specifically, the P2 layer, containing abundant spatial information, is particularly advantageous for small object detection. The four different scale feature maps enhance the model’s multi-scale detection capabilities.

3. Results

3.1. Dataset

Tao et al. [36] collected and constructed a public dataset of insulators called Chinese Power Line Insulator Dataset (CPLID). This dataset includes normal insulator images and synthesized defective insulator images acquired via UAVs, showcasing diverse backgrounds of overhead insulators such as urban, riverine, field, and mountainous environments. Later, Andrel et al. [37] demonstrated the generalization capability of the proposed algorithm by means of stochastic affine transformation, Gaussian blurring, and lossless transformation to achieve further data enhancement for CPLID, which constructed the Unified Public Dataset for Insulators (UPID) with 6860 training and test images. Zhang et al. [38] enhanced the UPID dataset by using stochastic luminance and fog thickness, which constructed a new Synthetic Foggy Insulator Dataset (SFID), which contains 13,718 images. The dataset is more comprehensive and complex.
However, there are still many shortcomings in the SFID dataset, because most of the insulators and defective objects in the SFID dataset are enhanced and synthesized, which are different from the real UAV inspection images, and the defective objects in SFID are often much larger than those in the real aerial images, so it is difficult to adapt the trained model on the SFID dataset to the real scene of the inspection. Therefore, in this paper, insulator defect data obtained from real UAV inspection aerial photography are collected.
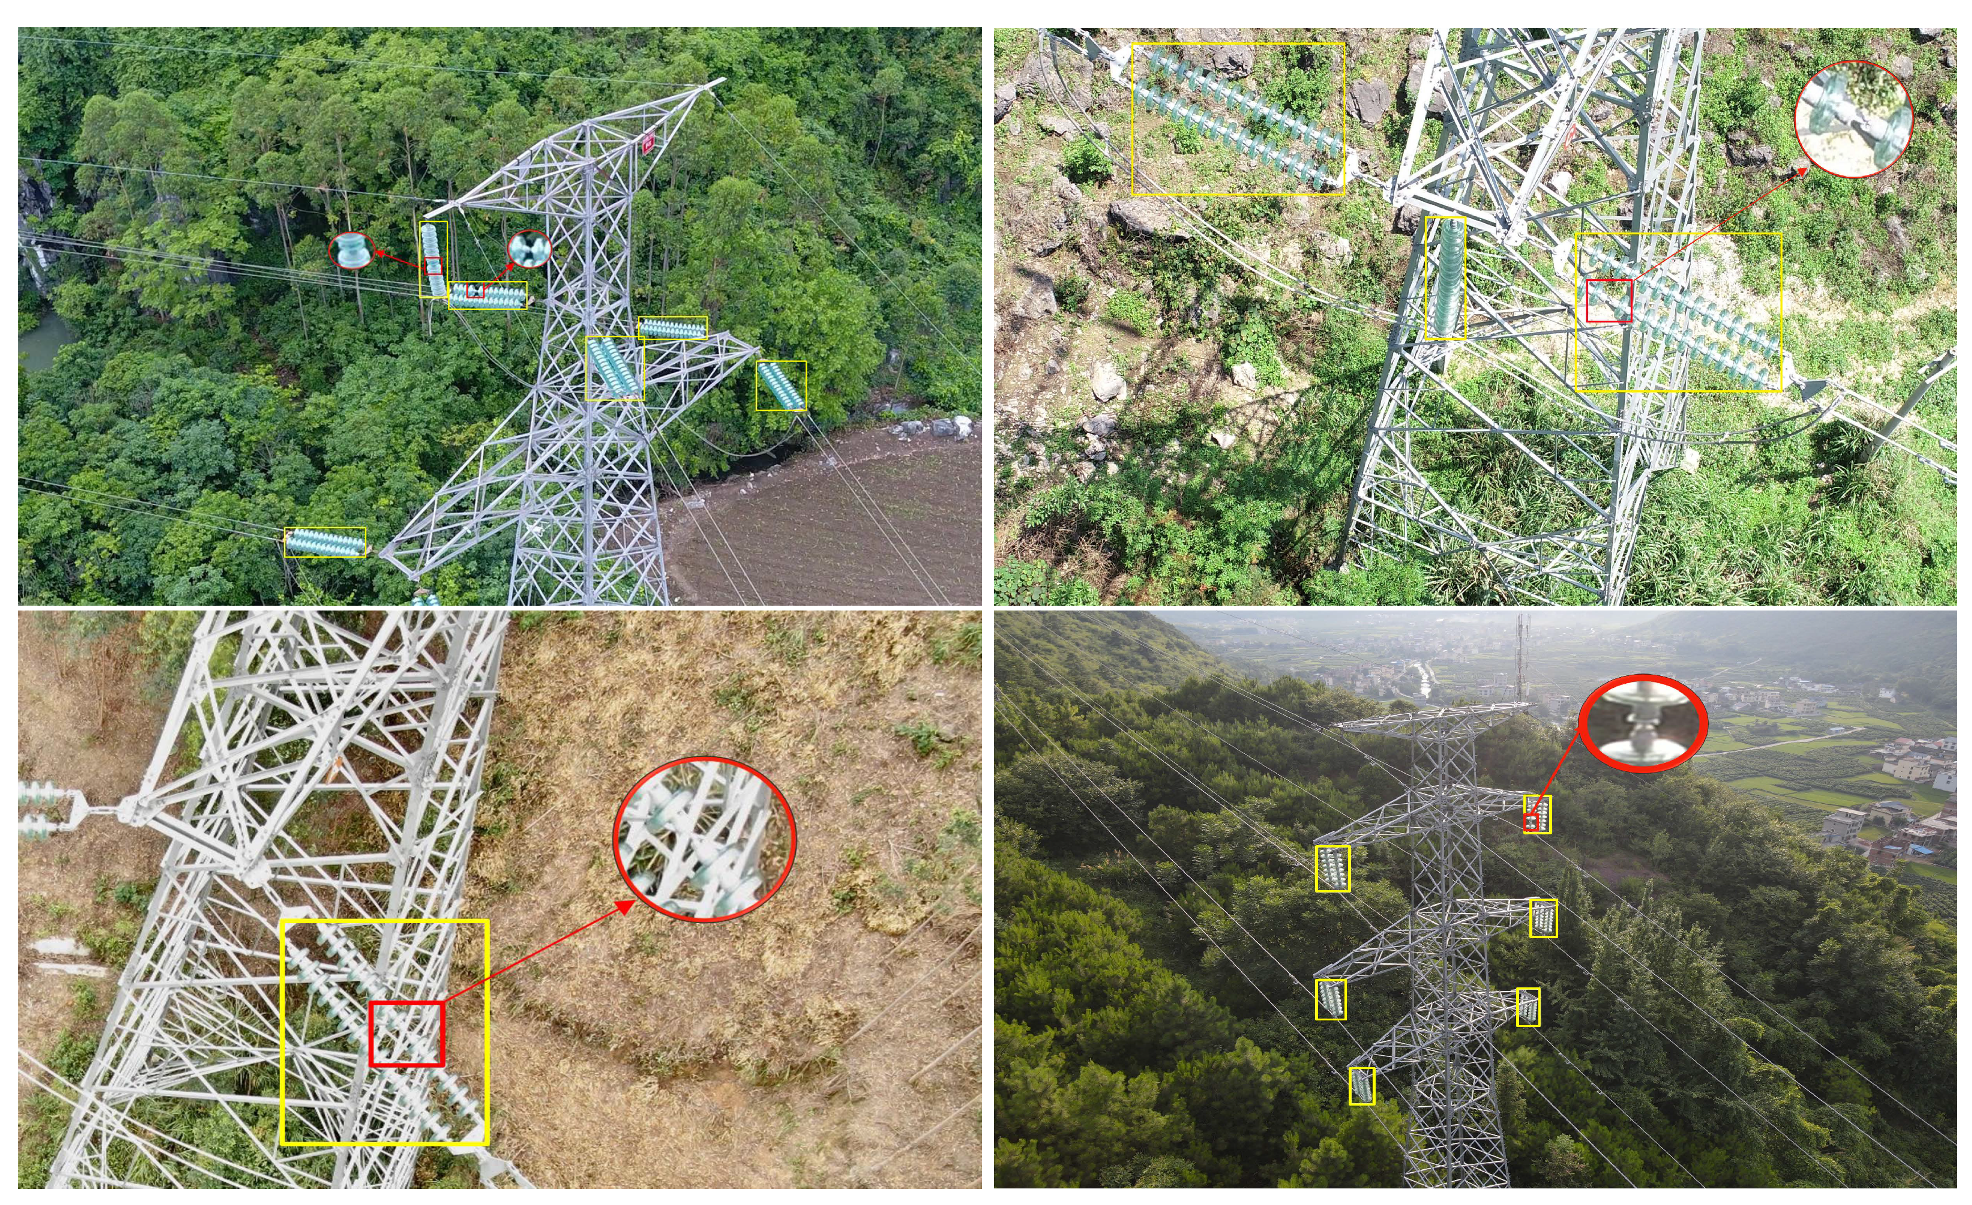
In this paper, the dataset mainly uses DJI multi-rotor UAV series (such as DJI Royal 2, Royal 3, and DJI M300RTK), unmanned helicopters, etc. By carrying dual-optical pods and other low-altitude image acquisition equipment to obtain image data of the power lines, we collected 563 pictures containing defective insulators, and labeled the data through LabelImg software, which contains multiple detection objects for each picture. Each picture in the dataset contains multiple object detection objects, and the object labeling is divided into two types: normal insulators and defective insulators. Randomly partition the dataset in an 8:2 ratio, and obtain an initial training set containing 450 images and an initial validation set containing 113 images. Then the data are enhanced based on the 563 pictures by random rotation, random luminance, rain, snow, fog, etc.; the pictures are scaled in equal proportions; the widest or the highest side of the scaled pictures is 640 pixels; and the enhanced pictures have 2250 pictures in the training set. After the picture, there are 2250 pictures in the training set and 452 pictures in the validation set data; we named this dataset as UID. Since the dataset collected in this paper originates from real detection scenarios, compared with other publicly available insulator datasets, the UID features complex object backgrounds and a high number of small objects, making this dataset more challenging. Figure 6 provides some UID dataset samples.
The detailed information of the dataset is shown in Figure 7, where a represents the number of labels for normal and defective insulators in the dataset, with the number of normal insulators being much higher than the number of defective insulators; b represents the size of the bounding box, indicating that there are more small- and medium-sized target boxes; c represents the center coordinate distribution of the bounding box, indicating that the bounding box distribution is relatively uniform; and d represents the aspect ratio of the target relative to the entire image. It can be seen that the scattered points in the lower-left corner are denser, indicating that there are more small- and medium-sized targets in the dataset.

3.2. Experimental Environment and Configuration

All experiments were conducted on the Windows 10 system, which was equipped with Intel Xeon Bronze 3104 CPU@1.70 GHz, 12 GB NVIDIA GeForce RTX 3060 GPU, Python 3.9, CUDA 12.1, and PyTorch 2.1.0. YOLOv8 is used as the base model, and the optimizer defaults to SGD. Other parameter settings are the same. 
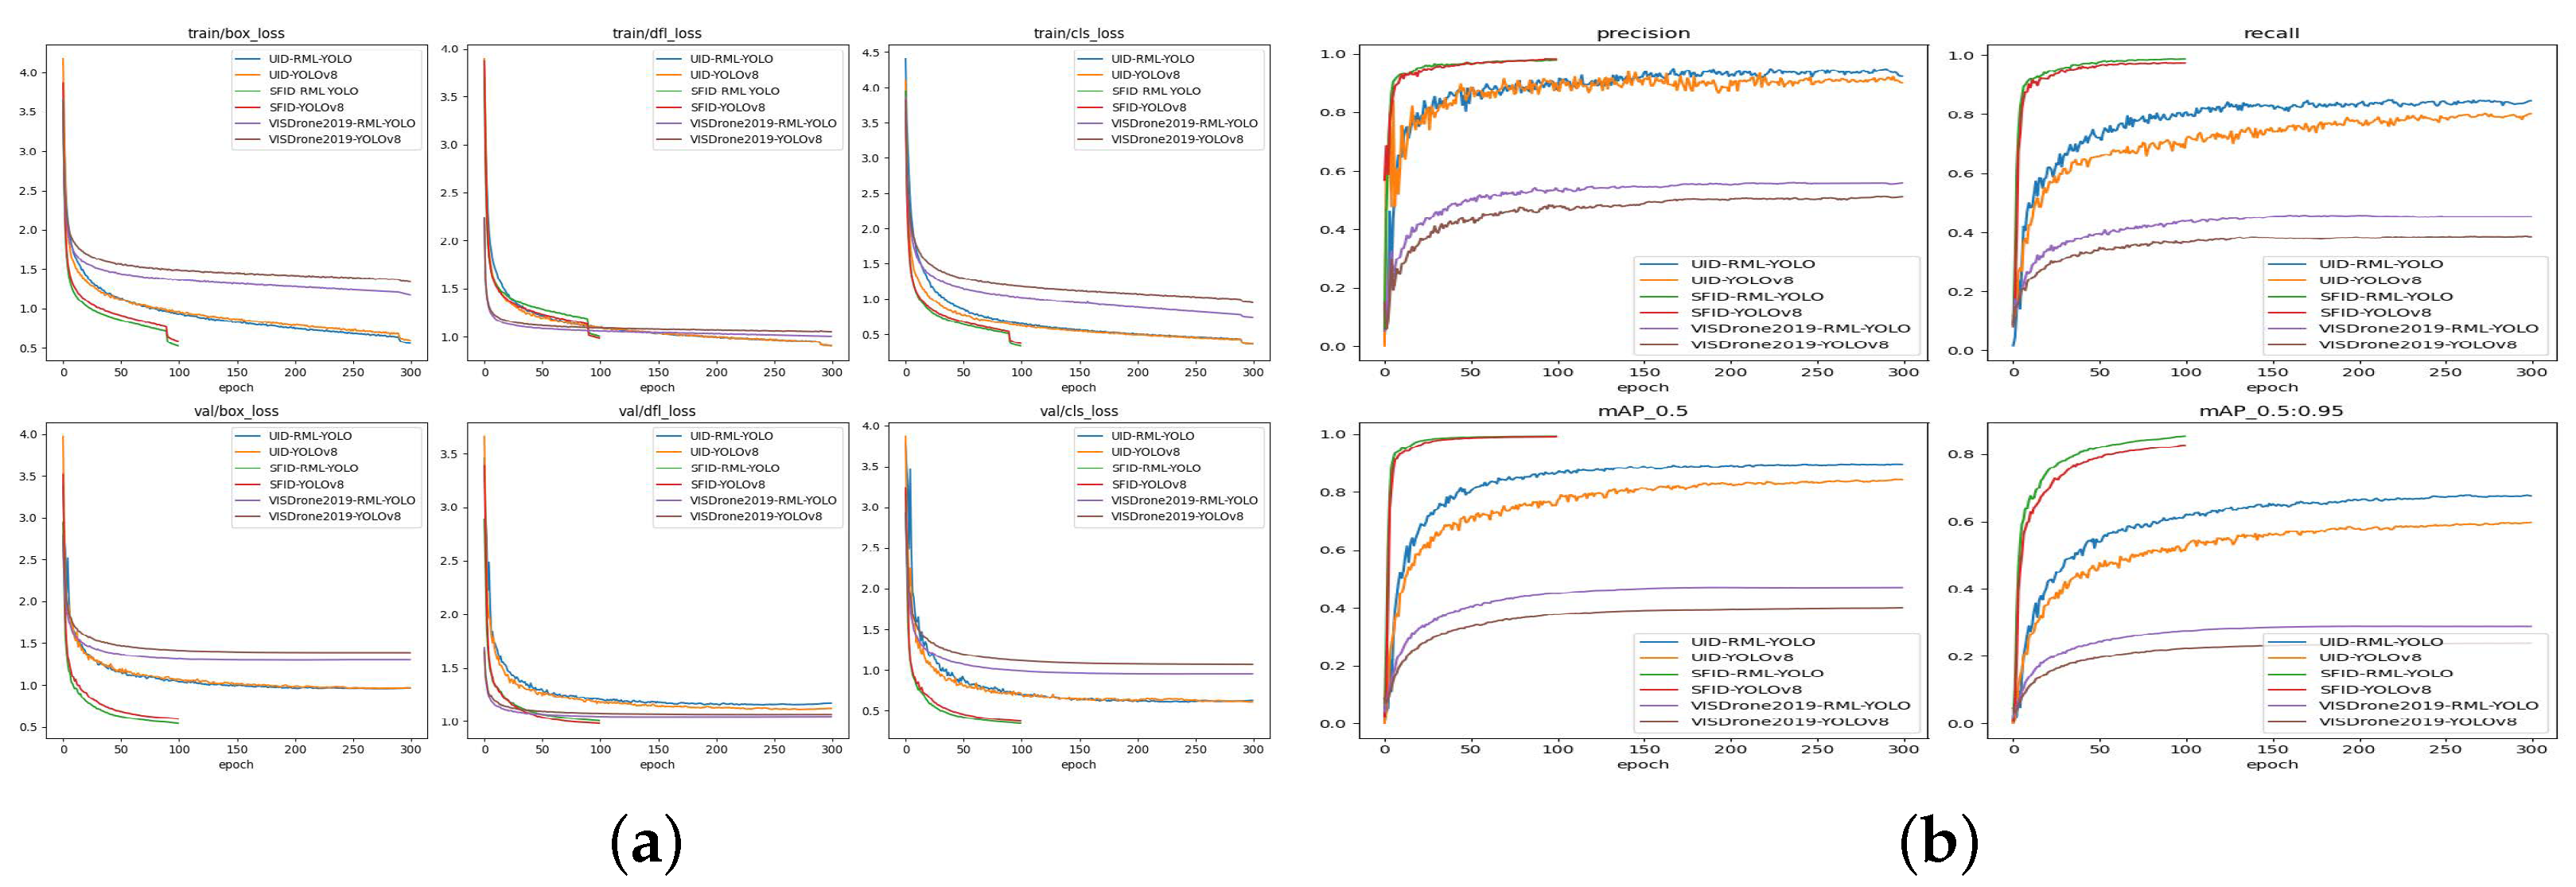
Figure 8a shows the loss plots of RML-YOLO and YOLOv8 trained on three different datasets. It can be seen that the training and validation losses of all models continue to decrease with the increase in iteration times. Among them, the SFID dataset has the fastest loss reduction rate and tends to stabilize at 100 epoch without overfitting problems. Figure 8b shows the training results of RML-YOLO and YOLOv8 on three different datasets. It can be seen that, on the SFID dataset, mAP50 has become extremely stable and tends to approach 1 after 50 epoch, while mAP50-95 also tends to stabilize at 100 epoch without overfitting. Therefore, setting the training epoch of the SFID dataset to 100 is a more appropriate choice in the article. On the UID and VISDrone2019 datasets, accuracy and recall, as well as mAP50 and mAP50-95, begin to stabilize after 250 epoch, and no overfitting occurs at 300 epoch. Therefore, the training epoch on the UID and VISDrone2019 datasets are set to 300.

3.3. Evaluation Metrics

Object detection algorithms often use the competitive evaluation metrics of PASCAL VOC and MS COCO [39]. Both VOC and COCO evaluation metrics use Mean Average Precision (mAP) to measure the detection performance of the model. The calculation of m A P involves the calculation of related indicators such as Precision and Recall. The following will introduce these evaluation metrics and parameters.
Unlike classification tasks, in object detection tasks, it is necessary not only to predict the category of the target, but also to accurately locate the position of the target. The commonly used evaluation parameter is the intersection to union ratio (IoU), which calculates the ratio of the intersection and union between the predicted box and the true box to measure the degree of overlap between the predicted result and the true result. The calculation formula is shown in Equation (10). Among them, B o x g t represents the real bounding box, B o x p r e d represents the predicted bounding box by the model, and the higher the IoU threshold, the closer the predicted result is to the real result. When I o U reaches 1, it represents that the predicted result completely overlaps with the actual result.
I o U = B o x p r e d B o x g t B o x p r e d B o x g t
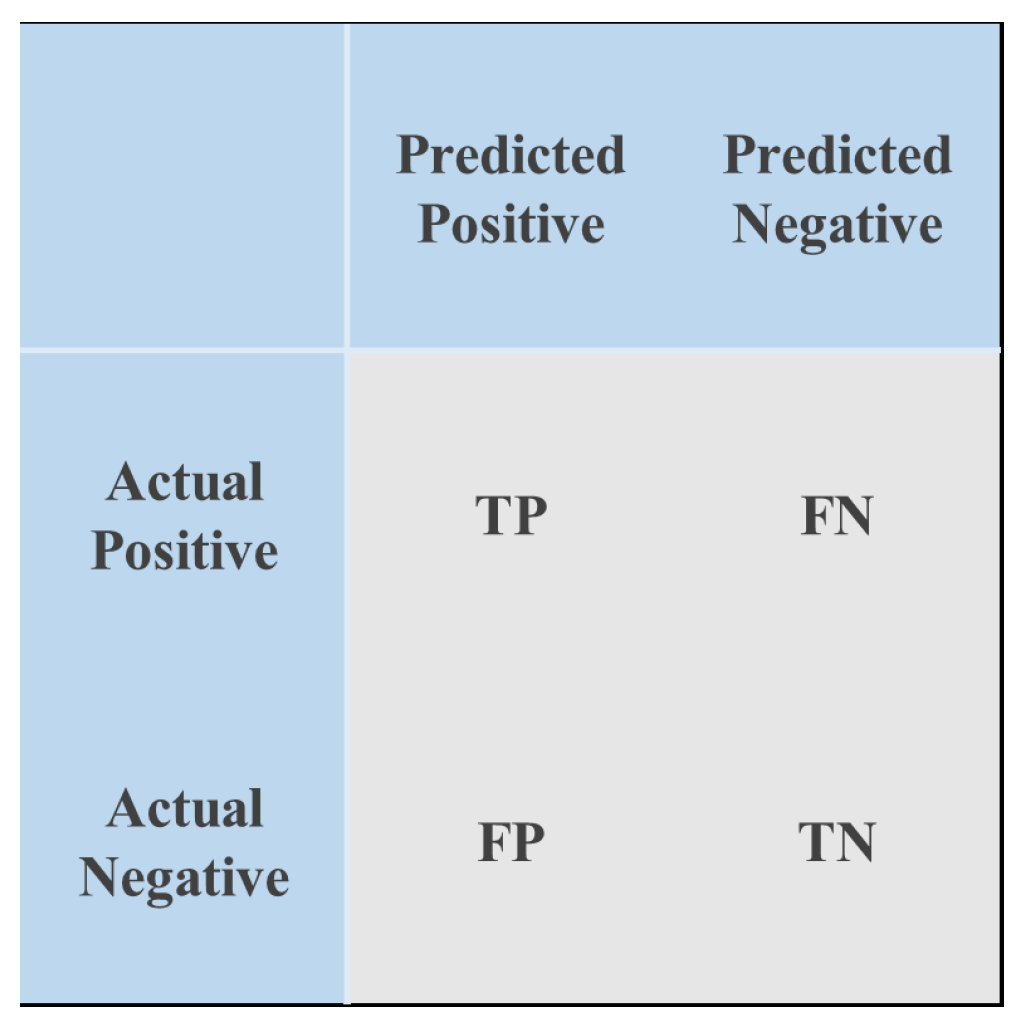
For the prediction of targets, it can be divided into four categories, as shown in Figure 9. Precision refers to the proportion of true-positive cases predicted to be correct among all predictions, used to measure the probability of positive cases being correctly predicted in the prediction results. The calculation formula is shown in Equation (11).
P r e c i s i o n = T P T P + F P
Recall refers to the proportion of predicted true-positive cases to the total number of actual positive samples, used to reflect missed detections. The calculation formula is shown in Equation (12).
R e c a l l = T P T P + F N
Through the formulas of Precision and Recall, it can be found that there is a certain degree of mutual exclusivity between Precision and Recall. When the IoU threshold is set high, the actual insulator may be predicted as the background, resulting in an increase in missed detections, an increase in FN, and a decrease in Recall. Similarly, when the IoU threshold is set low, false detections will increase, while missed detections will decrease, FP will increase, and therefore Precision will decrease. Therefore, evaluating network performance solely based on one evaluation metric is not comprehensive. Therefore, a PR curve is generally drawn to comprehensively evaluate detection performance. The horizontal axis of the PR curve represents the recall rate, the vertical axis represents the accuracy rate, and the area below the curve represents the AP value. The calculation formula for AP is shown Equation (13).
A P = 0 1 P R d R
In the VOC evaluation index, AP is the evaluation of a single category, while mAP represents the average AP of all categories in the dataset. The higher the mAP value, the better the detection performance of the model. The calculation method for mAP is shown in Equation (14).
m A P = 1 N i = 1 N A P i
Compared with VOC evaluation metrics, COCO evaluation metrics adopt stricter standards and incorporate considerations for the average precision of targets at different scales. There are six commonly used COCO evaluation metrics: A P , A P 50 , A P 75 , A P S , A P M , and A P L . AP50 and AP75 denote the evaluation results under different IoU thresholds, which correspond to m A P at I o U = 0.5 and I o U = 0.75 in the PASCAL VOC evaluation metrics. The A P metric is defined as the m A P calculated across IoU thresholds ranging from 0.5 to 0.95 in steps of 0.05, with the final result being the arithmetic mean of the m A P values across these thresholds within the interval. A P S , A P M , and A P L correspond to the mAP values for small-scale, medium-scale, and large-scale objects, respectively. Small-scale objects (S) refer to those with a pixel area smaller than 32 × 32 , medium-scale objects (M) have a pixel area within the range of [ 32 × 32 , 96 × 96 ] , and large-scale objects (L) refer to those with a pixel area larger than 96 × 96 .
Due to the possible differences in the calculation methods of the evaluation indicators inherent in each object detection algorithm, while the COCO evaluation indicator has stricter standards, in order to ensure fairness in comparative experiments, this article will uniformly use the COCO evaluation indicator to evaluate the detection performance of the model.
For lightweight indicators, parameter quantity and model size are selected for evaluation. The number of model parameters and the model size together reflect the complexity of the model, where parameter quantity specifically refers to the total number of parameters that the model needs to optimize and learn during the training phase. The model size refers to the actual size of the model file in the storage space. Generally, models with fewer parameters and smaller models have relatively lower storage and computational costs, which is beneficial for running on resource-constrained devices. However, most lightweighting comes at the cost of sacrificing model performance, so when designing and selecting models, a balance between model complexity and performance needs to be comprehensively considered.

3.4. Ablation Experiment

In order to analyze the degree of influence of different modules on the model, we performed ablation analysis on the model proposed in this paper on the UID dataset. Among them, R is the RFCAConv module, M is MSFENet, and L is LMSSPH, and the experimental results are shown in Table 1. In the article, the best results are shown in bold, and the second-best results are indicated with underline. After adding the RFCAConv module, the size of the model and the number of parameters increased slightly, and A P , A P 50 , and A P 75 increased by 2.6%, 2.8%, and 2.6% respectively, which fully demonstrates the RFCAConv module’s feature extraction capability. After adding MSFENet, A P increases by 3.9%, 2.2%, and 5.7% compared with the base model, and A P S , A P M , and A P L increase by 5.7%, 1.3%, and 3.2% compared with the base model, respectively, and the accuracy of object detection at the three scales is improved, with the effect of the detection of the small object being much better than that of the other scales, which proves the effect of the design for small object detection in MSFENet. Upon integrating the LMSHead module, a reduction of over 500,000 parameters and a model size decrease of 1.2 MB are achieved. Remarkably, these changes do not compromise performance; in fact, A P , A P 50 , and A P 75 show further gains of 3.4%, 2.6%, and 5.3% respectively, underscoring LMSHead’s role in optimizing efficiency without sacrificing detection accuracy.
The algorithm designed in this paper, RML-YOLO, compared with the base model YOLOV8, has a drop of 500,000 in the number of participants. With the model size decreasing by 0.8 M, A P , A P 50 , and A P 75 increased by 7.8%, 5.5%, and 11.1%, respectively, while A P S , A P M , and A P L increased by 10%, 2.7%, and 6.7%, respectively, which effectively proves the effectiveness of the improvements proposed in this paper.

3.5. UID Dataset Comparison Experiment

To demonstrate the superiority of the proposed algorithm, we conducted comparative experiments with several classic and state-of-the-art general-purpose object detection algorithms, including Faster R-CNN, YOLOv5, YOLOv7, YOLOv8, YOLOv9, YOLOv10, and Gold-YOLO. The YOLO series offers various versions of differing sizes (e.g., n, s, m, l, x). Given our focus on deployment in resource-constrained environments, we uniformly selected the most lightweight version of each model for comparison. All experimental codes were sourced from official implementations: YOLOv5 and YOLOv8 were obtained from the same version of Ultralytics, while Faster R-CNN was obtained from MMDetection (version: faster-rcnn_r50_fpn_1x). To ensure the fairness of the comparative experiments, all models were trained and evaluated on the same dataset, using identical hardware and experimental environments, and adhering strictly to the official model specifications and experimental settings.
As shown in Table 2, although YOLOv5-n has 0.01 million fewer parameters and a model size 0.2 MB smaller than the proposed RML-YOLO, RML-YOLO demonstrates superior detection performance across all metrics. Specifically, RML-YOLO achieves A P , A P 50 , and A P 75 values that are 7.45%, 4.87%, and 11.62% higher than those of YOLOv5-n, respectively, with A P S being 9.7% higher. YOLOv7-tiny exhibits strong performance in small object detection, achieving an A P S of 52.1%; however, this still falls 9.2% short of RML-YOLO. In terms of overall performance, YOLOv7-tiny ranks second to RML-YOLO. Compared with YOLOv7-tiny, RML-YOLO achieves improvements of 6.8%, 1.95%, and 10.82% in A P , A P 50 , and A P 75 , respectively, despite having only 41.7% of YOLOv7-tiny parameters and 44.7% of its model size.
To further validate the performance of RML-YOLO, we also conducted comparisons with other algorithms that have performed well in the field of insulator defect detection, including LiteYOLO-ID proposed by Li et al. [29] and CACS-YOLO proposed by CAO et al. [40]. Since LiteYOLO-ID is an improvement based on YOLOv5s, and CACS-YOLO is an enhancement built upon YOLOv8-m, to ensure a fair comparison of the performance among these algorithms, we not only compared them with the versions used in the original papers but also evaluated their performance when improved upon the most lightweight versions of the models.
The experimental results are summarized in Table 3. Both versions of the CACS-YOLO algorithm exhibit lower performance compared with RML-YOLO. RML-YOLO and CACS-YOLO are improvements based on YOLOv8. In the lightest n version, RML-YOLO has 8% higher A P and 11.1% higher A P S than CACS-YOLO-n, while RML-YOLO has 0.13 million fewer parameters than CACS-YOLO-n. Compared with CACS-YOLO-m, A P is 2.2% higher. LiteYOLO-ID-m demonstrates greater success in lightweight improvements. LiteYOLO-ID-n has a parameter count of only 0.94 million and a model size of 2.14 MB, but its performance is subpar, with A P , A P 50 , and A P 75 scores that are 16.7%, 11.7%, and 21.7% lower than those of RML-YOLO, respectively. In particular, LiteYOLO-ID-n performance in detecting small objects is 20.7% lower than that of RML-YOLO. Compared with its lighter n version, LiteYOLO-ID-m shows improved performance with an A P of 55.9%, but this comes at the cost of increased parameter count and model size, which are 1.25 million higher than those of RML-YOLO, while its A P is still 9.8% lower than that of RML-YOLO.
These results demonstrate that our model, RML-YOLO, can maintain high detection accuracy at a lower computational cost, making it particularly suitable for applications on devices with limited resources.

3.6. SFID Dataset Comparison Experiment

In order to further demonstrate the ability of the algorithm proposed in this paper for insulator detection, comparative experiments were conducted on the public insulator dataset SFID.
The comparative results of general object detection algorithms on the SFID dataset are presented in Table 4. Due to the relatively large object objects in the SFID dataset and the absence of tiny objects, the detection difficulty is comparatively low. Consequently, YOLOv7-tiny, which performs well on small object detection, achieves an A P of only 76.02% on SFID. The A P 50 values across different models show minimal variation; however, the proposed RML-YOLO model remains superior to all other algorithms. On the SFID dataset, YOLOv8-n achieves the second-best A P 50 and A P 75 , which are 0.32% and 1.18% lower than those of RML-YOLO, respectively. Faster R-CNN also performs notably well, achieving an A P of 83.1%, second only to RML-YOLO. However, Faster R-CNN comes with a significant drawback: its parameter count reaches 41.7 million, and its model size is 315 MB, which are several times larger than those of RML-YOLO. This substantial computational demand makes Faster R-CNN unsuitable for deployment on resource-constrained devices.
We also conducted comparisons with other algorithms that have performed well in the field of insulator defect detection. As shown in Table 5, it can be observed that CACS-YOLO has an A P that is 2.5% higher than that of RML-YOLO, and both models achieve an A P 50 of 99.3%. However, the number of parameters in CACS-YOLO is nearly eleven times that of RML-YOLO, and its model size is ten times larger. When comparing the lightweight n series models, it is evident that both CACS-YOLO and RML-YOLO have a model size of 5.5 MB, but the A P of CACS-YOLO-n is 3.4% lower than that of RML-YOLO. Meanwhile, although LiteYOLO-ID-n has a smaller parameter count and model size, its performance decreases correspondingly, with an A P that is 16.6% lower than that of RML-YOLO.
Overall, whether on the highly challenging UID dataset constructed in this study or on the publicly available large-scale insulator defect dataset SFID, RML-YOLO demonstrates excellent performance, ensuring high detection accuracy while maintaining a lightweight design. This makes it particularly suitable for applications on resource-constrained devices, such as drones, for the detection of insulator defects.

3.7. Comparative Experiments on Generalizability

In order to demonstrate that the algorithm proposed in this paper has some generalization ability, comparative experiments are conducted on the open-source insulator dataset SFID and the UAV dataset VISDrone 2019.
The VISDrone2019 dataset collects data from various drone cameras, including different cities, environments, and objects. Due to the effects of shooting angles, lighting, background, and other factors, detecting data from drones is more challenging than traditional computer vision tasks. The algorithm proposed in this paper will also be deployed on drones in the future; therefore, the VISDrone2019 dataset is chosen to further demonstrate the generality of the proposed algorithm.
As can be seen from Table 6 experimental results, in terms of performance, RML-YOLO is a little bit weaker for large object detection, but it is in the lead in all other performance metrics. The algorithm proposed in this paper improves by 3.9% in AP compared with the base model YOLOV8 AP, 6.2% in AP50, 4.7% in AP75, 4.3% in detection accuracy for small objects, 3.9% for meso-scale objects, and 3.2% for large objects. RML-YOLO compares with YOLOv7-tiny with the second-best overall performance, AP compares with YOLOv7-tiny, and 3.2% for large objects. objects by 3.9%, and large-scale objects by 3.2%. RML-YOLO compares with YOLOv7-tiny, which has the next best overall performance, with 3.5% higher AP and 2.3% higher AP50 than YOLOv7-tiny. In addition, this paper also compares specialized object detection algorithms for UAV scenarios including HIC-YOLO proposed by Tang et al. [41] and Drone-YOLO proposed by Zhang et al. [42]. It can be seen that the accuracy of RML-YOLO still maintains the lead when compared with the specialized object detection algorithms for UAVs; and its AP, AP50, and AP75 are 2.1% higher than that of Drone-YOLO by 2.1%, 3.8%, and 2.4%, respectively; and its detection ability for small objects is slightly lower than HIC-YOLO but still ranks second; and its APS is 4.6% higher than the CACS-YOLO algorithm and 1.8% higher than Drone-YOLO. The excellent performance of RML-YOLO under the UAV aerial photography dataset demonstrates the generalization ability of the algorithm proposed in this paper. It not only is capable of detecting insulators, but also maintains detection performance on the VISDrone 2019 dataset in complex environments with different scenes, weather and lighting conditions. This further proves the possibility of promoting RML-YOLO on another drone aerial object.

3.8. Visual Comparative Experiment

In addition, in Figure 10, this article compares the detection performances of mainstream object detection algorithms on an UID dataset. The figure shows various scene combinations, including noise, complex background, low light, rainy and snowy days, small objects, occlusion, etc.
In Figure 10a, the main challenges are noise interference and complex background. From the visualization of detection results, it can be observed that RML-YOLO, LiteYOLO-ID, CACS-YOLO, YOLOv8, and Faster-RCNN successfully detected all objects. However, both YOLOv7 and Gold-YOLO exhibited false positives; YOLOv7 falsely identified weeds in the background as normal insulators and misclassified a normal insulator in the top-right corner as a defective one, failing to recognize both normal and defective insulators against the complex left background. Gold-YOLO successfully detected defective insulators but missed the normal insulator on the left and falsely detected background interference as normal insulators. YOLOv9 did not detect any objects in this image.
In Figure 10b, the main challenges include complex backgrounds and small object. Ultimately, only RML-YOLO, YOLOv10, and CACS-YOLO successfully identified all object without false detections. Faster-RCNN, YOLOv7, YOLOv9, and Gold-YOLO all produced false positives by misclassifying background weeds as insulators.
In Figure 10c, the key challenges are low illumination, partial occlusion, and small object. Due to partial occlusion affecting the second insulator from the right, Faster-RCNN, YOLOv8, YOLOv10, and LiteYOLO-ID failed to detect this partially occluded object. Only RML-YOLO, YOLOv5, and CACS-YOLO detected all object, though YOLOv5 yielded a low confidence score (0.27) for the occluded object.
In Figure 10d, the main challenges are random rain interference and complex backgrounds. Faster-RCNN and YOLOv10 failed to detect defective insulators. YOLOv10 misclassified a normal insulator on the left, affected by random rain as a defective one. While YOLOv7 detected all object, it mistakenly identified leaves on the right as normal insulators.
In Figure 10e, the challenges are small targets and complex backgrounds. The defective insulator is on the left, located at the image edge with indistinct features and susceptible to interference from surrounding wires. Only RML-YOLO correctly identified the object. The defective insulator above was more apparent: hence, all algorithms successfully recognized it.
In Figure 10f, challenges arise from occlusion and complex backgrounds. The left insulator and its defective region are partially occluded. Only RML-YOLO and Faster-RCNN successfully recognized them, while YOLOv5, YOLOv9, and LiteYOLO-ID failed to detect the occluded normal insulator with background interference on the left.
Comprehensive analysis indicates that RML-YOLO maintains robust detection performance against challenges including complex backgrounds, occlusions, and small targets, making it suitable for object detection tasks in most scenarios.

4. Discussion

This paper proposes an insulator defect detection method for UAV aerial images, which enhances multi-scale target detection capabilities while reducing the model’s parameter count. The proposed algorithm introduces a multi-scale feature extraction network (MSFENet) that addresses the limitations of conventional FPNs, including insufficient information fusion and inadequate focus on large-scale feature layers. To overcome these issues, a Two-Stage Feature Fusion (TSFF) module is introduced, enabling the fusion of features from different levels and enhancing the model’s multi-scale detection performance through a multi-head detection strategy. To address the problem of excessive parameters in existing object detection algorithms, a lightweight Multi-Scale Shared Parameter Head (LMSSPH) is proposed. This detection head adopts a shared parameter design, effectively reducing the model’s size and parameter count while maintaining robust performance by leveraging a multi-head detection strategy. Considering the challenge of insufficient feature extraction in complex backgrounds, which often leads to degraded insulator detection performance, this study incorporates RFCAConv—a convolutional module that aggregates features with varying receptive fields. This design enables the model to effectively capture features from different spatial locations.
Experimental results on the UID and SFID datasets demonstrate that RML-YOLO achieves high detection accuracy for insulators and defects, with AP50 values of 88.3% and 99.3%, respectively, indicating that the model can effectively detect most insulator targets. Furthermore, experiments on the VISDrone2019 dataset confirm the algorithm’s generalization capability, achieving an AP that is 2.1% higher than that of Drone-YOLO, a dedicated target detection algorithm for UAV aerial scenarios. This result demonstrates that the model can accurately detect not only insulator targets but also other objects in UAV-captured scenes.
The YOLO series of algorithms has undergone continuous evolution and iteration. This study aims to develop improvements that can serve as plug-and-play modules, making them adaptable to other object detection algorithms. This article conducted an improvement experiment on YOLOv11 on the UID dataset, and the results are presented in Table 7. The findings reveal that the improved algorithm achieves accuracy comparable to that of YOLOv8. However, despite the lightweight design of the detection head, the overall parameter count of RML-YOLOv11 is higher than that of YOLOv11 due to the integration of MSFENet and RFCAConv. This suggests that local model lightweighting may not be universally applicable to all algorithms. Future articles will conduct experiments and promote more methods.
Although RML-YOLO has demonstrated promising performance in insulator defect detection, certain limitations remain. Specifically, while the use of a shared parameter detection head effectively reduces the model’s parameter count, optimizing the detection head alone is insufficient for significantly reducing the overall model size. Therefore, future research could further optimize the model through the following directions: First, other lightweight technologies such as model pruning, quantization, and distillation could be considered to further compress model dimensions and enhance performance. Second, given that the purpose of lightweight design is to enable deployment on resource-constrained devices, future plans include directly deploying the optimized model on unmanned aerial vehicles (UAVs) equipped with edge computing devices after completing lightweight modifications. This implementation would achieve real-time detection while improving system response speed and stability in practical field applications.

5. Conclusions

In this paper, an object detection algorithm named RML-YOLO is proposed for the problems of varied and uneven object scales, large volume and parameter number of conventional detection models, and difficult object feature extraction in complex environments, and experiments on the homemade dataset UID and the public dataset SFID, VISDrone2019, can be concluded.
  • Diverse object scales and feature extraction in the context of complex environments are the main reasons affecting the circuit line insulator and defect detection. This paper proposes an MSFENet, which is different from the traditional feature fusion network in that it not only fuses two large-scale feature maps of B1 and B2 using the TSFF module proposed in this paper, but also inputs the feature layers of four different scales of P2, P3, P4, and P5 to the detection head for multi-head detection, which substantially improves the multi-scale detection capability of the model; for the problem of large number of algorithm parameters, the article proposes an LMSH, which uses the idea of shared feature design. This design not only reduces the number of model parameters and computation, but also solves the problem of uneven distribution of objects at different scales, further improving the model’s ability of object detection at different scales, and lastly, the article introduces RFCAConv, which summarizes the different sensory field features, to solve the problem caused by the use of a shared-parameter convolutional kernel to solve the problem of insufficient standard convolutional feature extraction due to the use of a shared parameter convolution kernel.
  • The comparative experimental results show that the number of parameters of the algorithm proposed in this paper has decreased by 500,000, and the model volume has decreased by 0.8 M, which facilitates the subsequent deployment of the model on UAVs, and at the same time, the algorithm improves the AP by 7.8% on the UID dataset and by 2.74% on the SFID dataset, and improves the AP on the homemade insulator dataset and the public insulator dataset, and compares with the other classical algorithms and the public insulator dataset. Improvement, and compared with other classical algorithms and state-of-the-art algorithms, still maintains the leading level, which proves the detection ability of the algorithm proposed in this paper in insulators and defect scenarios. On the VISDrone2019 dataset, AP improves by 3.9%, demonstrating the generalization ability of the algorithm across different datasets and environments.
In conclusion, the RML-YOLO algorithm successfully combines lightweight design with strong detection performance and generalization ability. It effectively handles the detection of insulators and defective objects in complex backgrounds and across multiple scales, making it highly suitable for real-world applications, especially in UAV-based inspection scenarios.

Author Contributions

Conceptualization, Z.D. and X.L.; methodology, Z.D. and X.L; software, X.L.; validation, X.L.; formal analysis, R.Y.; writing—original draft preparation, Z.D. and X.L.; writing—review and editing, Z.D., X.L. and R.Y.; visualization, X.L.; project administration, Z.D.; funding acquisition, Z.D. All authors have read and agreed to the published version of the manuscript.

Funding

This work was partially supported by the Guangxi Science and Technology Project (Nos. AB25069087, AB20238013, and AB22035052), and Guangxi Key Laboratory of Image and Graphic Intelligent Processing Project (Nos. GIIP2308 and GIIP2211), and the Innovation Project of GUET Graduate Education (No. 2023YCXS062).

Institutional Review Board Statement

Not applicable.

Informed Consent Statement

Not applicable.

Data Availability Statement

The data presented in this study are available on request from the corresponding author. Due to privacy and security concerns, the data are not directly disclosed.

Acknowledgments

The authors sincerely acknowledge Hao Liang and Chaojian Meng from Guangxi ShuifaDigital Technology Co., Ltd. Corporation for their professional support in validation, resources, and data curation throughout this research.

Conflicts of Interest

The authors declare no conflicts of interest.

References

  1. Shi, C.; Huang, Y. Cap-Count Guided Weakly Supervised Insulator Cap Missing Detection in Aerial Images. IEEE Sens. J. 2021, 21, 685–691. [Google Scholar] [CrossRef]
  2. Park, K.C.; Motai, Y.; Yoon, J.R. Acoustic Fault Detection Technique for High-Power Insulators. IEEE Trans. Ind. Electron. 2017, 64, 9699–9708. [Google Scholar] [CrossRef]
  3. Gjorgiev, B.; Das, L.; Merkel, S.; Rohrer, M.; Auger, E.; Sansavini, G. Simulation-driven deep learning for locating faulty insulators in a power line. Reliab. Eng. Syst. Saf. 2023, 231, 108989. [Google Scholar] [CrossRef]
  4. Deng, F.; Xie, Z.; Mao, W.; Li, B.; Shan, Y.; Wei, B.; Zeng, H. Research on edge intelligent recognition method oriented to transmission line insulator fault detection. Int. J. Electr. Power Energy Syst. 2022, 139, 108054. [Google Scholar] [CrossRef]
  5. Zhou, Z.; Zhang, C.; Xu, C.; Xiong, F.; Zhang, Y.; Umer, T. Energy-Efficient Industrial Internet of UAVs for Power Line Inspection in Smart Grid. IEEE Trans. Ind. Inform. 2018, 14, 2705–2714. [Google Scholar] [CrossRef]
  6. Citroni, R.; Di Paolo, F.; Livreri, P. A Novel Energy Harvester for Powering Small UAVs: Performance Analysis, Model Validation and Flight Results. Sensors 2019, 19, 1771. [Google Scholar] [CrossRef]
  7. Gao, Z.; Yang, G.; Li, E.; Liang, Z. Novel Feature Fusion Module-Based Detector for Small Insulator Defect Detection. IEEE Sens. J. 2021, 21, 16807–16814. [Google Scholar] [CrossRef]
  8. Zuo, G.; Zhou, K.; Wang, Q. UAV-to-UAV Small Target Detection Method Based on Deep Learning in Complex Scenes. IEEE Sens. J. 2024, 25, 3806–3820. [Google Scholar] [CrossRef]
  9. Sun, H.R.; Shi, B.J.; Zhou, Y.T.; Chen, J.H.; Hu, Y.L. A Smoke Detection Algorithm Based on Improved YOLO v7 Lightweight Model for UAV Optical Sensors. IEEE Sens. J. 2024, 24, 26136–26147. [Google Scholar] [CrossRef]
  10. Yang, Z.; Xu, Z.; Wang, Y. Bidirection-Fusion-YOLOv3: An Improved Method for Insulator Defect Detection Using UAV Image. IEEE Trans. Instrum. Meas. 2022, 71, 1–8. [Google Scholar] [CrossRef]
  11. Dalal, N.; Triggs, B. Histograms of oriented gradients for human detection. In Proceedings of the 2005 IEEE Computer Society Conference on Computer Vision and Pattern Recognition (CVPR’05), San Diego, CA, USA, 20–25 June 2005; Volume 1, pp. 886–893. [Google Scholar] [CrossRef]
  12. Lowe, D.G. Distinctive image features from scale-invariant keypoints. Int. J. Comput. Vis. 2004, 60, 91–110. [Google Scholar] [CrossRef]
  13. Wang, X.; Han, T.X.; Yan, S. An HOG-LBP human detector with partial occlusion handling. In Proceedings of the 2009 IEEE 12th International Conference on Computer Vision, Kyoto, Japan, 29 September–2 October 2009; pp. 32–39. [Google Scholar] [CrossRef]
  14. Ren, S.; He, K.; Girshick, R.; Sun, J. Faster R-CNN: Towards Real-Time Object Detection with Region Proposal Networks. IEEE Trans. Pattern Anal. Mach. Intell. 2017, 39, 1137–1149. [Google Scholar] [CrossRef] [PubMed]
  15. Liu, W.; Anguelov, D.; Erhan, D.; Szegedy, C.; Reed, S.; Fu, C.Y.; Berg, A.C. Ssd: Single shot multibox detector. In Proceedings of the Computer Vision–ECCV 2016: 14th European Conference, Amsterdam, The Netherlands, 11–14 October 2016; Springer: Cham, Switzerland, 2016; pp. 21–37. [Google Scholar]
  16. Redmon, J.; Divvala, S.; Girshick, R.; Farhadi, A. You Only Look Once: Unified, Real-Time Object Detection. In Proceedings of the 2016 IEEE Conference on Computer Vision and Pattern Recognition (CVPR), Las Vegas, NV, USA, 27–30 June 2016; pp. 779–788. [Google Scholar] [CrossRef]
  17. Redmon, J.; Farhadi, A. YOLO9000: Better, Faster, Stronger. In Proceedings of the 2017 IEEE Conference on Computer Vision and Pattern Recognition (CVPR), Honolulu, HI, USA, 21–26 July 2017; pp. 6517–6525. [Google Scholar] [CrossRef]
  18. Redmon, J. Yolov3: An incremental improvement. arXiv 2018, arXiv:1804.02767. [Google Scholar]
  19. Bochkovskiy, A.; Wang, C.Y.; Liao, H.Y.M. Yolov4: Optimal speed and accuracy of object detection. arXiv 2020, arXiv:2004.10934. [Google Scholar]
  20. Li, C.; Li, L.; Jiang, H.; Weng, K.; Geng, Y.; Li, L.; Ke, Z.; Li, Q.; Cheng, M.; Nie, W.; et al. YOLOv6: A single-stage object detection framework for industrial applications. arXiv 2022, arXiv:2209.02976. [Google Scholar]
  21. Wang, C.Y.; Bochkovskiy, A.; Liao, H.Y.M. YOLOv7: Trainable Bag-of-Freebies Sets New State-of-the-Art for Real-Time Object Detectors. In Proceedings of the IEEE/CVF Conference on Computer Vision and Pattern Recognition (CVPR), Vancouver, BC, Canada, 18–22 June 2023; pp. 7464–7475. [Google Scholar]
  22. Wang, C.Y.; Yeh, I.H.; Mark Liao, H.Y. YOLOv9: Learning What You Want to Learn Using Programmable Gradient Information. In Proceedings of the Computer Vision—ECCV 2024; Leonardis, A., Ricci, E., Roth, S., Russakovsky, O., Sattler, T., Varol, G., Eds.; Springer: Cham, Switserland, 2025; pp. 1–21. [Google Scholar]
  23. Wang, A.; Chen, H.; Liu, L.; Chen, K.; Lin, Z.; Han, J.; Ding, G. YOLOv10: Real-Time End-to-End Object Detection. In Proceedings of the Advances in Neural Information Processing Systems; Globerson, A., Mackey, L., Belgrave, D., Fan, A., Paquet, U., Tomczak, J., Zhang, C., Eds.; Curran Associates, Inc.: Vancouver, BC, Canada, 2024; Volume 37, pp. 107984–108011. [Google Scholar]
  24. Khanam, R.; Hussain, M. Yolov11: An overview of the key architectural enhancements. arXiv 2024, arXiv:2410.17725. [Google Scholar]
  25. Han, G.; Wang, R.; Yuan, Q.; Zhao, L.; Li, S.; Zhang, M.; He, M.; Qin, L. Typical Fault Detection on Drone Images of Transmission Lines Based on Lightweight Structure and Feature-Balanced Network. Drones 2023, 7, 638. [Google Scholar] [CrossRef]
  26. He, M.; Qin, L.; Deng, X.; Liu, K. MFI-YOLO: Multi-Fault Insulator Detection Based on an Improved YOLOv8. IEEE Trans. Power Deliv. 2024, 39, 168–179. [Google Scholar] [CrossRef]
  27. Li, Y.; Fan, Q.; Huang, H.; Han, Z.; Gu, Q. A Modified YOLOv8 Detection Network for UAV Aerial Image Recognition. Drones 2023, 7, 304. [Google Scholar] [CrossRef]
  28. Qu, F.; Lin, Y.; Tian, L.; Du, Q.; Wu, H.; Liao, W. Lightweight Oriented Detector for Insulators in Drone Aerial Images. Drones 2024, 8, 294. [Google Scholar] [CrossRef]
  29. Li, D.; Lu, Y.; Gao, Q.; Li, X.; Yu, X.; Song, Y. LiteYOLO-ID: A Lightweight Object Detection Network for Insulator Defect Detection. IEEE Trans. Instrum. Meas. 2024, 73, 1–12. [Google Scholar] [CrossRef]
  30. Zhou, M.; Li, B.; Wang, J.; He, S. Fault Detection Method of Glass Insulator Aerial Image Based on the Improved YOLOv5. IEEE Trans. Instrum. Meas. 2023, 72, 1–10. [Google Scholar] [CrossRef]
  31. Zhao, W.; Xu, M.; Cheng, X.; Zhao, Z. An Insulator in Transmission Lines Recognition and Fault Detection Model Based on Improved Faster RCNN. IEEE Trans. Instrum. Meas. 2021, 70, 1–8. [Google Scholar] [CrossRef]
  32. Chen, J.; Kao, S.h.; He, H.; Zhuo, W.; Wen, S.; Lee, C.H.; Chan, S.H.G. Run, Don’t Walk: Chasing Higher FLOPS for Faster Neural Networks. In Proceedings of the 2023 IEEE/CVF Conference on Computer Vision and Pattern Recognition (CVPR), Vancouver, BC, Canada, 17–24 June 2023; pp. 12021–12031. [Google Scholar] [CrossRef]
  33. Zhang, X.; Liu, C.; Yang, D.; Song, T.; Ye, Y.; Li, K.; Song, Y. RFAConv: Innovating spatial attention and standard convolutional operation. arXiv 2023, arXiv:2304.03198. [Google Scholar]
  34. Hou, Q.; Zhou, D.; Feng, J. Coordinate Attention for Efficient Mobile Network Design. In Proceedings of the 2021 IEEE/CVF Conference on Computer Vision and Pattern Recognition (CVPR), Nashville, TN, USA, 20–25 June 2021; pp. 13708–13717. [Google Scholar] [CrossRef]
  35. Ioannou, Y.; Robertson, D.; Cipolla, R.; Criminisi, A. Deep Roots: Improving CNN Efficiency with Hierarchical Filter Groups. In Proceedings of the 2017 IEEE Conference on Computer Vision and Pattern Recognition (CVPR), Honolulu, HI, USA, 21–26 July 2017; pp. 5977–5986. [Google Scholar] [CrossRef]
  36. Tao, X.; Zhang, D.; Wang, Z.; Liu, X.; Zhang, H.; Xu, D. Detection of Power Line Insulator Defects Using Aerial Images Analyzed With Convolutional Neural Networks. IEEE Trans. Syst. Man Cybern. Syst. 2020, 50, 1486–1498. [Google Scholar] [CrossRef]
  37. Andrel, V.; Chaves, T.; Felix, H. Unifying Public Datasets for Insulator Detection and Fault Classification in Electrical Power Lines. September 2020. Available online: https://github.com/heitorcfelix/public-insulator-datasets (accessed on 25 May 2025).
  38. Zhang, Z.D.; Zhang, B.; Lan, Z.C.; Liu, H.C.; Li, D.Y.; Pei, L.; Yu, W.X. FINet: An Insulator Dataset and Detection Benchmark Based on Synthetic Fog and Improved YOLOv5. IEEE Trans. Instrum. Meas. 2022, 71, 1–8. [Google Scholar] [CrossRef]
  39. Lin, T.Y.; Maire, M.; Belongie, S.; Hays, J.; Perona, P.; Ramanan, D.; Dollár, P.; Zitnick, C.L. Microsoft coco: Common objects in context. In Proceedings of the Computer Vision–ECCV 2014: 13th European Conference, Zurich, Switzerland, 6–12 September 2014; Springer: Cham, Switzerland, 2014; pp. 740–755. [Google Scholar]
  40. Cao, Z.; Chen, K.; Chen, J.; Chen, Z.; Zhang, M. CACS-YOLO: A Lightweight Model for Insulator Defect Detection Based on Improved YOLOv8m. IEEE Trans. Instrum. Meas. 2024, 73, 1–10. [Google Scholar] [CrossRef]
  41. Tang, S.; Zhang, S.; Fang, Y. HIC-YOLOv5: Improved YOLOv5 For Small Object Detection. In Proceedings of the 2024 IEEE International Conference on Robotics and Automation (ICRA), Yokohama, Japan, 13–17 May 2024; pp. 6614–6619. [Google Scholar] [CrossRef]
  42. Zhang, Z. Drone-YOLO: An Efficient Neural Network Method for Target Detection in Drone Images. Drones 2023, 7, 526. [Google Scholar] [CrossRef]
Figure 1. MSFENet structure diagram.
Applsci 15 06117 g001
Figure 2. TSFF module structure diagram.
Applsci 15 06117 g002
Figure 3. LMSHead structure diagram.
Applsci 15 06117 g003
Figure 4. RFCAConv structure diagram.
Applsci 15 06117 g004
Figure 5. Model architecture diagram of RML-YOLO.
Applsci 15 06117 g005
Figure 6. UID dataset samples: the yellow box represents normal insulators, and the red box represents defective insulators.
Applsci 15 06117 g006
Figure 7. UID information.
Applsci 15 06117 g007
Figure 8. Training results: (a) training loss results and (b) training accuracy results.
Applsci 15 06117 g008
Figure 9. Confusion matrix.
Applsci 15 06117 g009
Figure 10. Visual comparison of the detection results of different algorithms.
Applsci 15 06117 g010
Table 1. Ablation experiment results.
ModelsRML AP AP 50 AP 75 AP S AP M AP L Param
(Million)
Size
(MB)
YOLOV8 57.982.865.551.363.656.93.006.3
+R 60.585.668.554.46561.23.036.4
+M 61.884.971.25764.960.12.96.3
+L 61.385.470.854.465.065.82.445.1
+RL 62.787.072.354.767.667.12.475.2
+RM 62.786.772.658.965.157.82.936.4
+ML 62.986.673.458.663.859.82.485.4
RML-YOLO 65.788.376.661.366.363.62.515.5
The best results are shown in bold, and the second best result are indicated with underline.
Table 2. Comparison of experimental results for generic object Detection algorithms on the UID dataset.
Models AP AP 50 AP 75 AP S AP M AP L Param
(Million)
Size
(MB)
Faster-RCNN48.67652.141.452.947.541.7328
YOLOv5-n58.2583.4364.9851.664.456.12.55.3
YOLOv7-tiny58.9186.3565.7852.162.160.96.0112.3
YOLOv8-n57.8882.8165.5351.363.656.93.06.3
YOLOv9-t57.8181.1866.748.565.966.12.616.1
YOLOv10-n56.580.965.0448.963.854.22.695.8
YOLOv11-n58.383.165.851.963.460.02.585.5
Gold YOLO-n57.7683.9765.3449.063.361.25.611.9
RML-YOLO (ours)65.788.376.661.366.363.62.515.5
The best results are shown in bold, and the second best result are indicated with underline.
Table 3. Comparison of experimental results for insulator defect detection algorithms on the UID dataset.
Models AP AP 50 AP 75 AP S AP M AP L Param
(Million)
Size
(MB)
CACS-YOLO-n57.781.966.350.264.859.92.645.5
CACS-YOLO-m63.587.074.258.965.660.227.4255.2
LiteYOLO-ID-n49.076.654.940.656.251.80.942.14
LiteYOLO-ID-m55.983.862.248.260.452.23.767.52
RML-YOLO (ours)65.788.376.661.366.363.62.515.5
The best results are shown in bold, and the second best result are indicated with underline.
Table 4. Comparison of experimental results for generic object detection algorithms on the SFID dataset.
Models AP AP 50 AP 75 AP S AP M AP L Param
(Million)
Size
(MB)
Faster-RCNN83.198.495.4077.684.741.7315
YOLOv5-n80.3798.696.0067.582.32.55.3
YOLOv7-tiny76.0297.391.95061.977.56.0112.3
YOLOv8-n81.3698.9896.26068.985.43.06.3
YOLOv9-t79.4698.795.2067.282.12.616.1
YOLOv10-n81.098.596.0068.483.12.695.8
YOLOv11-n80.698.696.3067.582.52.585.5
Gold YOLO-n80.9199.096.5071.582.95.611.9
RML-YOLO (ours)84.199.397.8075.883.92.515.5
The best results are shown in bold, and the second best result are indicated with underline.
Table 5. Comparison of experimental results for insulator defect detection algorithms on the SFID dataset.
Models AP AP 50 AP 75 AP S AP M AP L Param
(Million)
Size
(MB)
CACS-YOLO-n80.798.896.5068.683.12.645.5
CACS-YOLO-m86.699.398.2080.287.427.4255.2
LiteYOLO-ID-n67.595.080.5051.667.90.942.14
LiteYOLO-ID-m77.998.693.4065.080.03.767.52
RML-YOLO (ours)84.199.397.8075.883.92.515.5
The best results are shown in bold, and the second best result are indicated with underline.
Table 6. Comparative experiment on VISDrone 2019.
Models AP AP 50 AP 75 AP S AP M AP L Param
(Million)
Size
(MB)
Faster-RCNN9.616.39.92.320.129.141.7347
YOLOv5-n18.531.218.79.22842.92.55.3
YOLOv7-tiny18.934.817.810.727.737.76.0112.3
YOLOv8-n18.530.918.79.528.237.43.06.3
YOLOv9-t18.730.819.28.928.942.92.616.1
YOLOv10-n1830.118.48.827.839.32.695.8
YOLOv11-n18.631.119.09.428.238.82.585.5
Gold YOLO-n18.431.118.79.228425.611.9
CACS-YOLO18.431.018.99.228.140.927.4255.2
LiteYOL0-ID13.024.512.47.019.926.23.767.52
HIC-YOLO19.332.819.614.624.218.62.355.4
Drone-YOLO20.333.321.012.029.240.12.936.3
RML-YOLO (ours)22.437.123.413.832.140.62.515.5
The best results are shown in bold, and the second best result are indicated with underline.
Table 7. YOLOv11 improvement experiment.
Models AP AP 50 AP 75 AP S AP M AP L Param
(Million)
Size
(MB)
YOLOv857.8882.8165.5351.363.656.93.06.3
YOLOv1158.383.165.851.963.460.02.585.5
RML-YOLOv865.788.376.661.366.363.62.515.5
RML-YOLOv1165.788.476.261.166.264.62.795.9
The best results are shown in bold, and the second best result are indicated with underline.
Disclaimer/Publisher’s Note: The statements, opinions and data contained in all publications are solely those of the individual author(s) and contributor(s) and not of MDPI and/or the editor(s). MDPI and/or the editor(s) disclaim responsibility for any injury to people or property resulting from any ideas, methods, instructions or products referred to in the content.

