1. Introduction
As the power industry continues to grow, the increasing number of transmission lines makes it critical to ensure their safe and stable operation for consistent electricity transmission. Insulators, crucial components of transmission lines, support the overhead wires while preventing current from grounding. Exposed to complex environments, insulators are prone to severe conditions like lightning strikes, ice accumulation, extreme temperatures, wind erosion, and other harsh factors that can cause flashovers, breakage, or even self-explosion. These states pose significant risks to the safety and reliability of transmission lines. Consequently, accurate detection of insulator state is of paramount importance in the field of power transmission line inspection [
1,
2].
Given the vast scale of modern power grids, manual inspection of transmission lines or traditional methods is not only time-consuming but also prone to errors such as missed and false detections. This leads to slow detection speeds and reduced accuracy, making it challenging to meet the current operational demands of the power grid. With the rapid advancement of artificial intelligence, drones, robots, and other sophisticated equipment are increasingly being deployed in the power industry. This has led to the widespread adoption of drone-based inspection methods for transmission-lines insulators [
3,
4,
5]. By leveraging a large number of insulator images captured by drones, automatic inspection methods for assessing insulator conditions have been proposed. Among these, the use of target detection methods within computer vision technology to enable automated analysis of drone inspection images has become a significant research focus [
6].
With the ongoing advancement of target detection methods, it is increasingly widely used in the supervised detection of insulator states. Target detection methods can be classified into two-stage methods and one-stage methods. The two-stage methods, such as Faster R-CNN [
7] and Mask R-CNN [
8], are notable for their high accuracy. For example, a recent study [
9] achieved multi-target fault detection in aerial images by integrating an area-based non-maximal suppression method into Faster R-CNN and employing a cut-off detection scheme. Similarly, another study [
10] proposed a method for identifying bird-related faults on transmission towers using a Fine Mask Regional Convolutional Neural Network (Fine Mask R-CNN). This method incorporates an information fusion module with multi-scale convolutional kernels to recover lost details, enabling it to detect and evaluate insulator faults caused by bird pecking and contamination from bird droppings.
The one-stage target detection methods, such as SSD [
11] and the YOLO series [
12,
13,
14,
15], have gained significant popularity for their speed and efficiency. For instance, one study [
16] introduced a lightweight MobileNet-SSD target detection network combined with a MobileNetV2-DeeplabV3+ image segmentation network to detect and segment insulator self-explosion faults. This combination provides a relatively lightweight solution suitable for UAVs and embedded systems. Another study [
17] improved the YOLOv3 method by modifying the loss function with a Focal Loss and a balanced cross-entropy function, achieving 91.8% accuracy in locating and identifying insulator strings. Furthermore, a separate study [
18] altered the Neck structure in the YOLOv5 framework from FPN+PAN to a BiFPN structure, introducing an adaptive weighted fusion module for both multi-scale and same-scale features. This adjustment resulted in a detection accuracy of 96.8%. In another approach, a study [
19] replaced the backbone network of YOLOv5s with EfficientNet, resulting in a notable increase in accuracy for transmission-line insulator fault detection, with a reported accuracy of 98.5%.
The above research has achieved certain results in the field of insulator state detection, but it generally focuses only on a single insulator self-explosion and pays less attention to insulator breakage and flashover, which makes the inspection process smaller detection range, while insulator breakage and flashover will likewise threaten the stable operation of the transmission line, coupled with the aerial insulator of a small scale, a variety of angles, a complex background, and a lot of obstructions, the above methods are difficult to meet the actual needs during an inspection.
To automate the defect detection of insulators in transmission lines and alleviate the significant workload faced by human inspectors, this study introduces an advanced deep learning-based method tailored for insulator state detection. The proposed approach is designed to achieve high-precision identification of common insulator defects, including self-explosion, breakage, and flashover, which are critical for maintaining the safety and reliability of power transmission systems. By leveraging innovative techniques, this method effectively addresses key challenges such as accurately detecting small targets and distinguishing obscured objects in complex environments. Furthermore, the improvements in detection accuracy and reliability ensure that the proposed method can serve as a robust solution for real-world applications, potentially enhancing the efficiency and precision of transmission line maintenance operations.
2. Materials and Methods
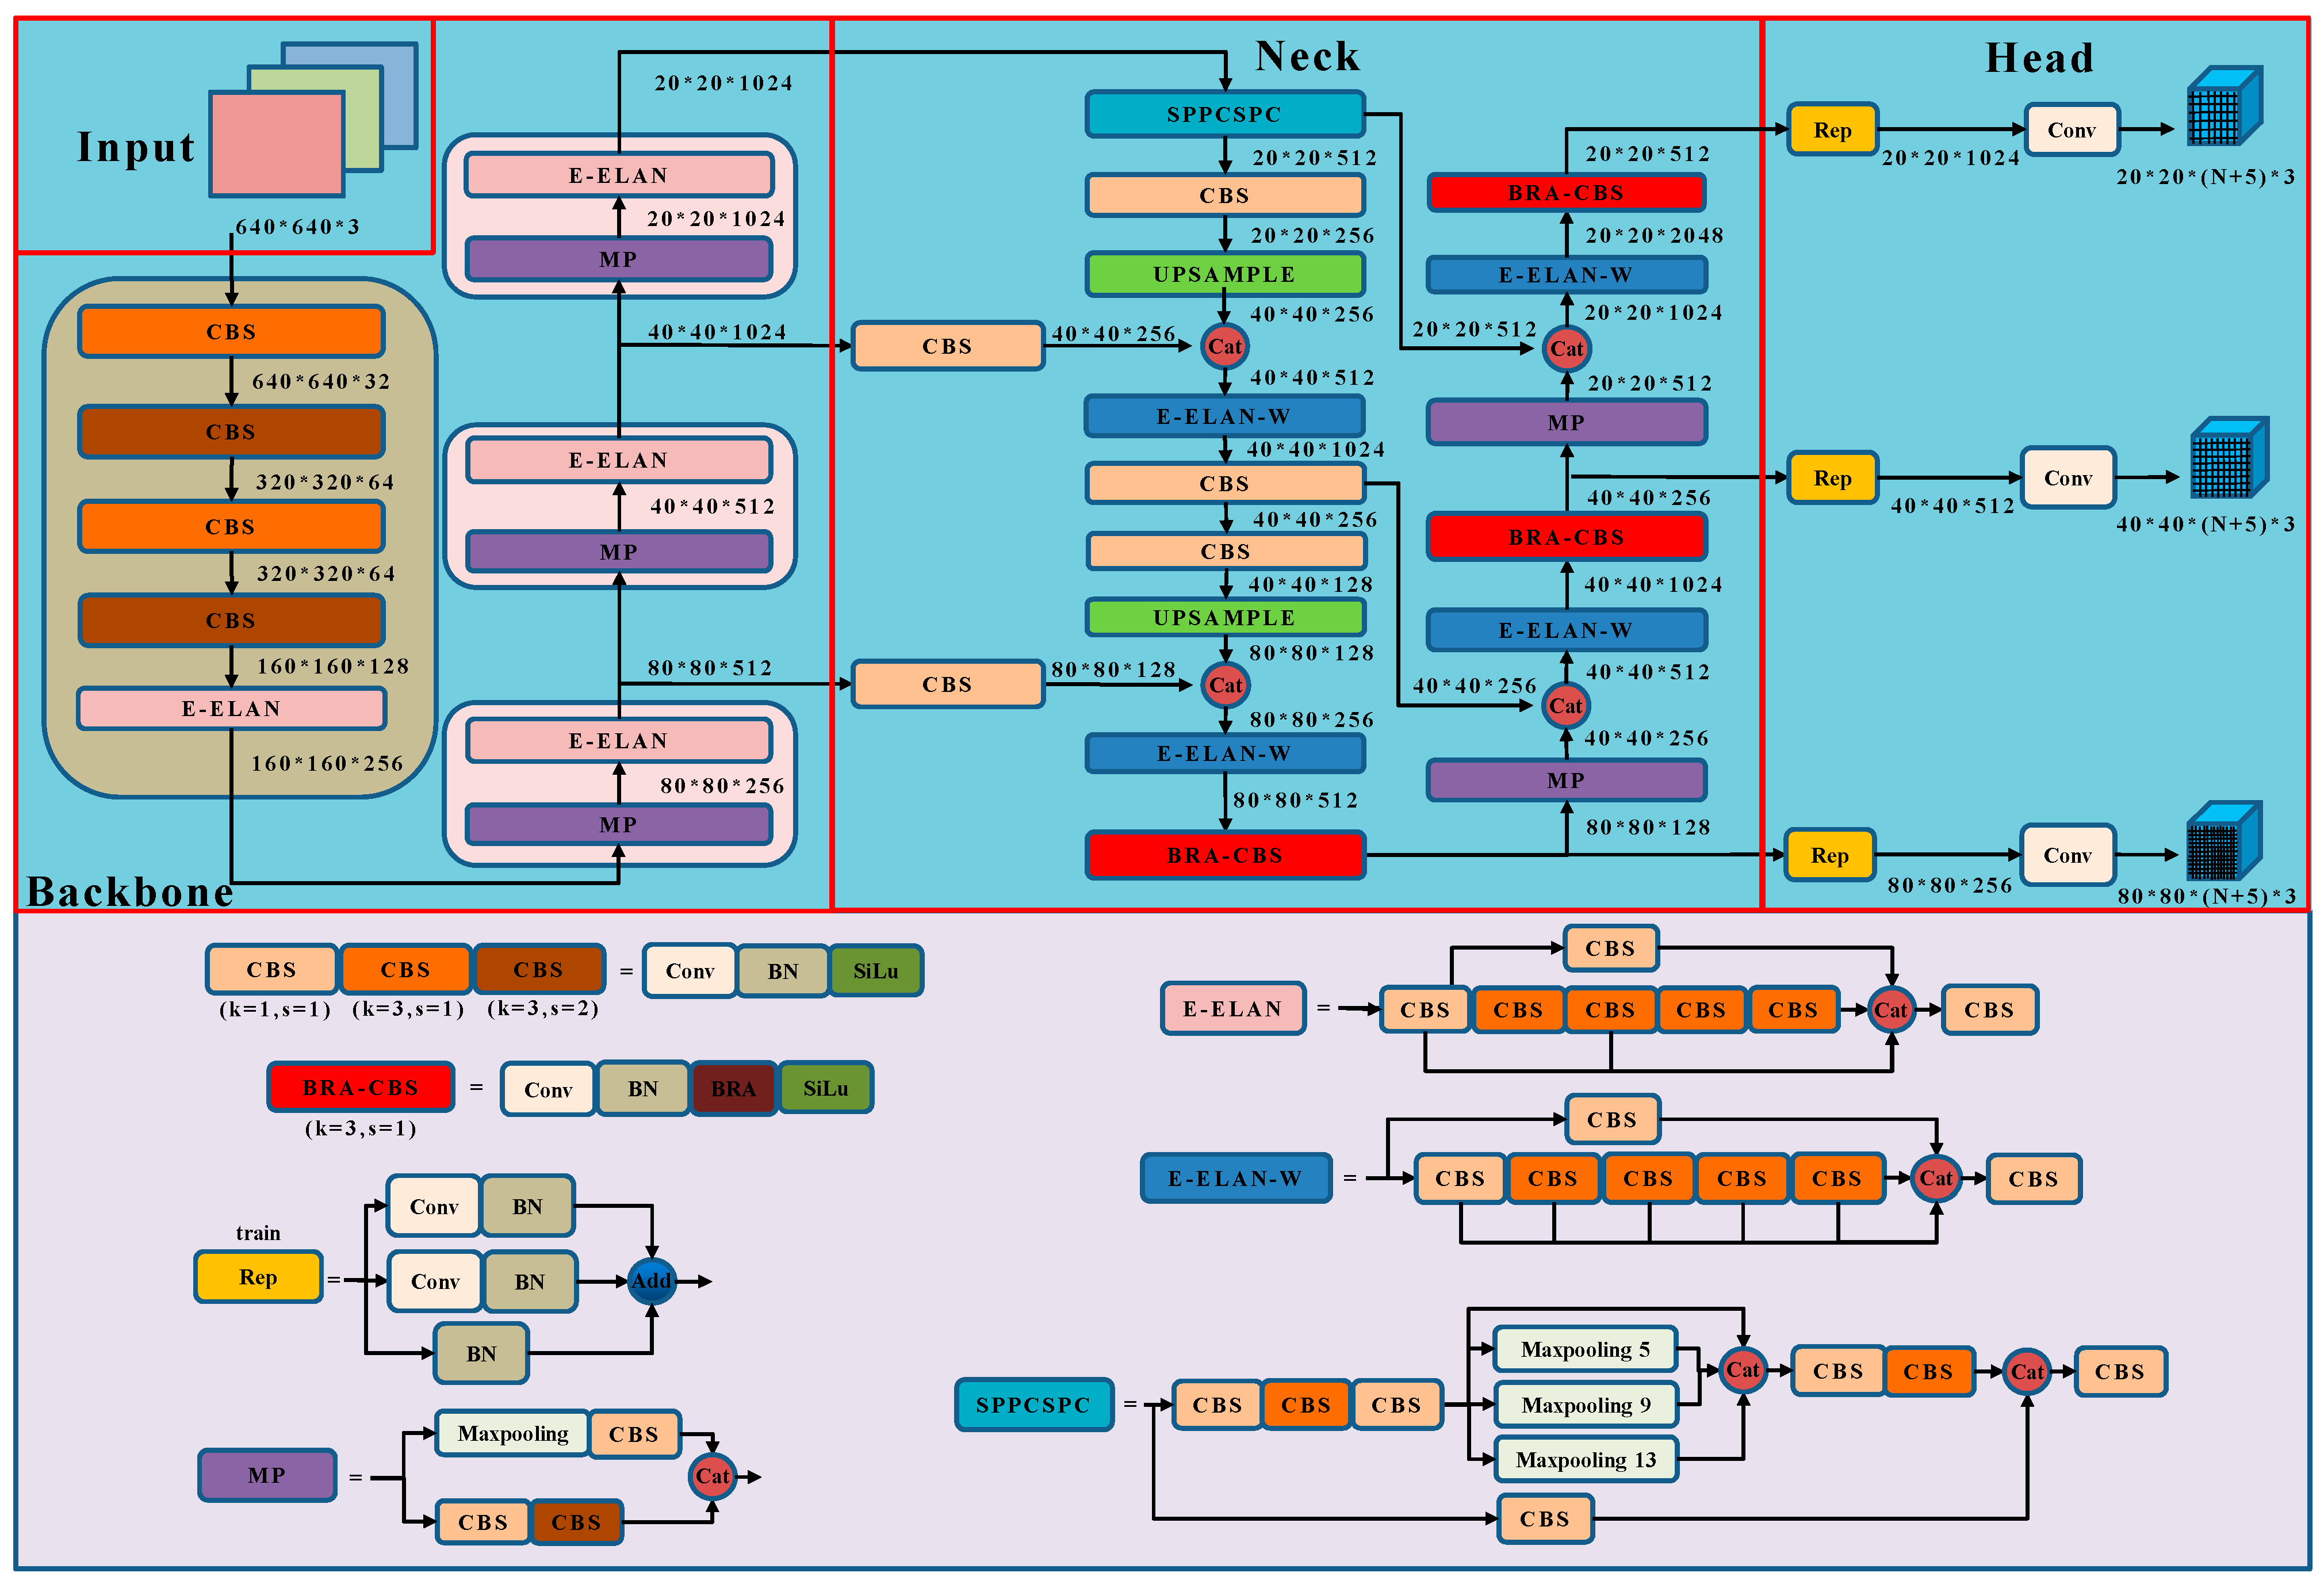
The transmission lines insulator state detection method based on BRA-CBS with con-tent-aware up-sampling proposed in this paper is an enhancement of the YOLOv7 [
20] framework proposed by Wang Chien-Yao et al. in 2022. The YOLOv7 Backbone is composed of three max-pooling down-sampling and CBS modules (MPs), along with four Extended Efficient Layer Aggregation Networks (E-ELANs) stacked together. Its Neck consists of a Path Aggregation Network (PANet) [
21] that performs bi-directional feature fusion across three scales derived from the backbone network. The Head utilizes a reparameterized convolution (RepConv) [
22], allowing a trade-off between speed and accuracy during training.
However, the baseline YOLOv7 network has limitations when it comes to retaining feature information for small targets during the feature fusion stage. Additionally, its nearest-neighbor interpolation up-sampling can lead to the loss of meaningful features when fusing different scales. The original YOLOv7’s CIOU loss function also does not adequately address the balance between high- and low-quality samples, potentially impacting detection accuracy. By introducing the BRA-CBS module and content-aware up-sampling, our improved method aims to mitigate these issues, enhancing small-target feature retention and providing a more robust approach to insulator state detection. The structure is shown in
Figure 1.
The model retains the original backbone network structure composed of MPs and E-ELAN. The E-ELAN employs group convolution to increase the channels and cardinality of computational blocks, improving the network’s learning capacity by expanding, shuffling, and merging cardinality, all while preserving the integrity of the original gradient pathways. It only modifies the architecture of computational blocks while leaving the structure of transition layers entirely unchanged. Assuming an input of a 640 × 640 × 3 RGB image, the feature map size is adjusted to 20 × 20 × 1024 after passing through the backbone network. Subsequently, the SPPCSPC module reduces the channel number to 512, adapting the method to different resolution images by using max pooling to obtain different receptive fields. Following this, the feature maps are enlarged by two content-aware feature reassembly up-sampling operators and concatenated with the feature maps extracted from two scales of the backbone network, yielding feature map groups of sizes 40 × 40 × 512 and 80 × 80 × 256. Then, the PANet’s bidirectional feature fusion network performs feature fusion from large to small scales. The fused features are then input into the BRA-CBS module, which incorporates a dual-level routing attention mechanism, producing feature map groups of sizes 20 × 20 × 512, 40 × 40 × 256, and 80 × 80 × 128. Finally, the features are fed into the Rep module for reparameterized convolution. The specific structures of each module are detailed in
Figure 1’s lower section.
2.1. BRA-CBS: Fused Attention Convolution Module
As a conventional convolutional module, CBS only conducts simple convolution operations for feature extraction, lacking the ability to discern the importance of different features. However, insulator states such as self-explosion and breakage demand precise extraction of fine-grained features. Therefore, introducing a dynamic sparse attention mechanism into the CBS module during the feature fusion process can help the feature fusion network focus on target areas. By capturing long-range contextual dependencies and employing more flexible computation allocation and content awareness, the detection network can more efficiently acquire crucial information, enhancing the model’s detection capabilities. The fusion convolution module BRA-CBS, equipped with a bi-level routing attention mechanism, is depicted in
Figure 2.
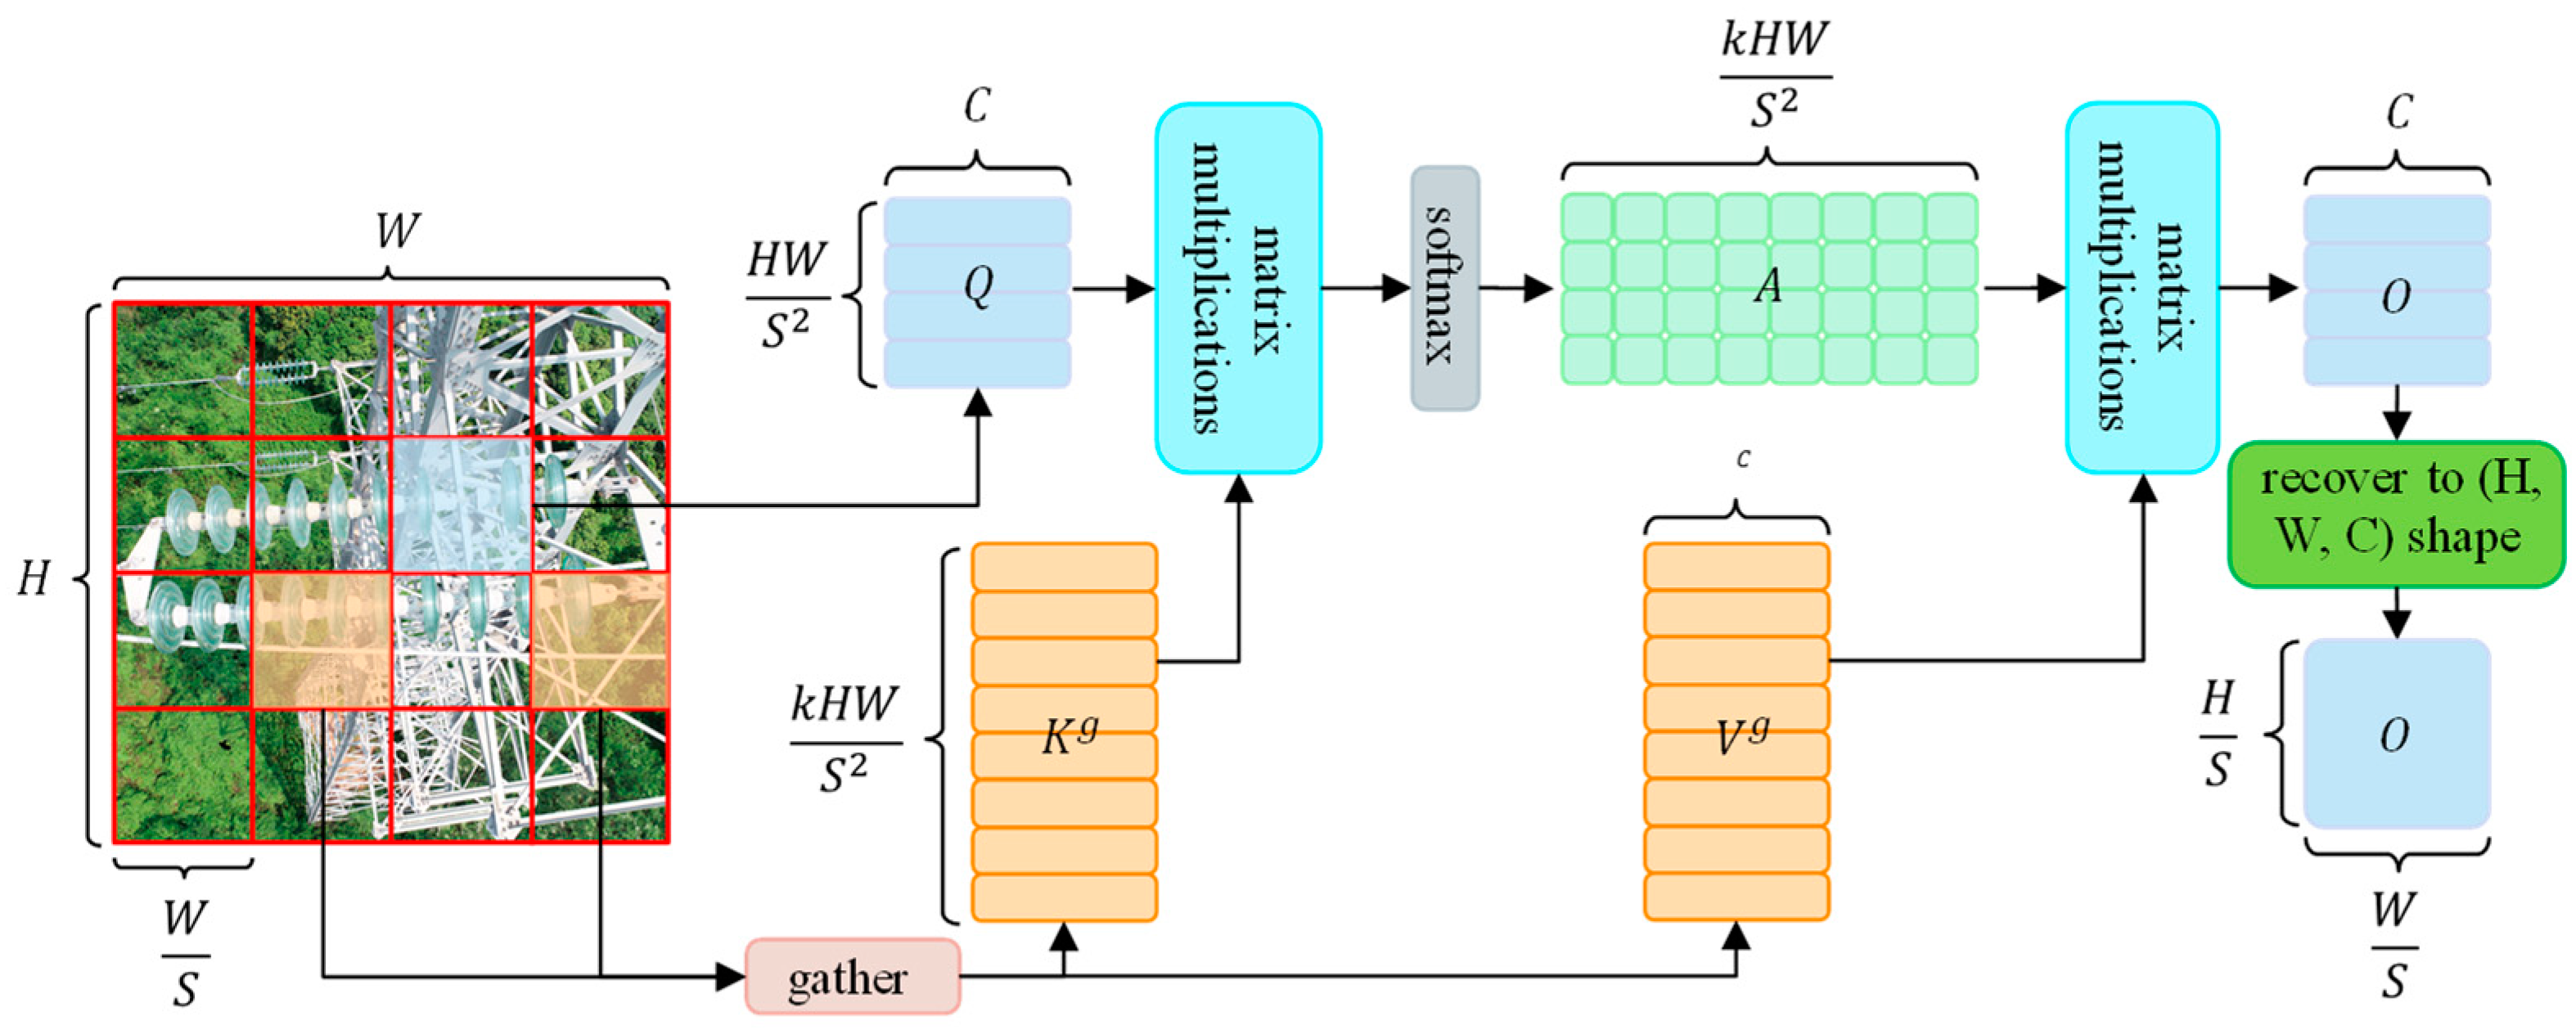
The structure of the BRA (bi-level routing attention) [
23] modules with query-awareness is shown in
Figure 3. The key idea is to filter out the least relevant key-value pairs on the coarse-grained region of the feature graph so that only a small portion of the routing region is retained and then apply fine-grained token-to-token attention to the concatenation of the remaining routing region. The following shows the computation of single-head self-attention for a single input.
Region partition and input projection. Assumed to be a 2D input feature map
, it is first divided into
non-overlapping regions, each containing
feature vectors. By reshaping
into
, then we obtain the query, key, and value tensor
by linear projections [
24], as shown in Equation (1).
where
are the projection weights of query, key, and value, respectively.
Region-to-region routing with the directed graph. Then, we find the relations of attention (the regions that should be focusing for each given region) by constructing a directed graph. In concrete terms, we derive queries and keys of each region,
, by applying the average number of pixels in each region on
and
, respectively. Then, we derive the matrix of correlation for each region,
, via matrix multiplication between
and transposed
, as shown in Equation (2).
Entries in the matrix,
, measure how much two regions are semantically related. Then we keep only top-
k connections for each region. Specifically, we derive a routing index matrix,
, with the row-wise top-
k operator as shown in Equation (3).
Consequently, the i-th row of contains the index of the most relevant regions for the region.
Token-to-token attention. Using the region-to-region routing index matrix
, we can subsequently implement precise token-to-token attention mechanisms. For every query token within region
, it will focus on all key-value pairs located within the set of
routed regions as indexed by
. Yet, efficiently implementing this step presents a challenge, given that these routed regions are dispersed across the entire feature map. GPUs depend on coalesced memory operations, which load blocks of dozens of contiguous bytes at once. Therefore, we initially gather the key and value tensors as shown in Equation (4):
where
are the gathered key and value tensors. Subsequently, we can employ attention mechanisms on the gathered key-value pairs as shown in Equation (5):
Compared to the original CBS module, the BRA-CBS module relies on its bi-level routing attention mechanism to retain more detailed features of small targets. It focuses more on target areas during feature fusion, reducing the overall method’s false detection rate.
2.2. Content-Aware Feature Reassembly Operator
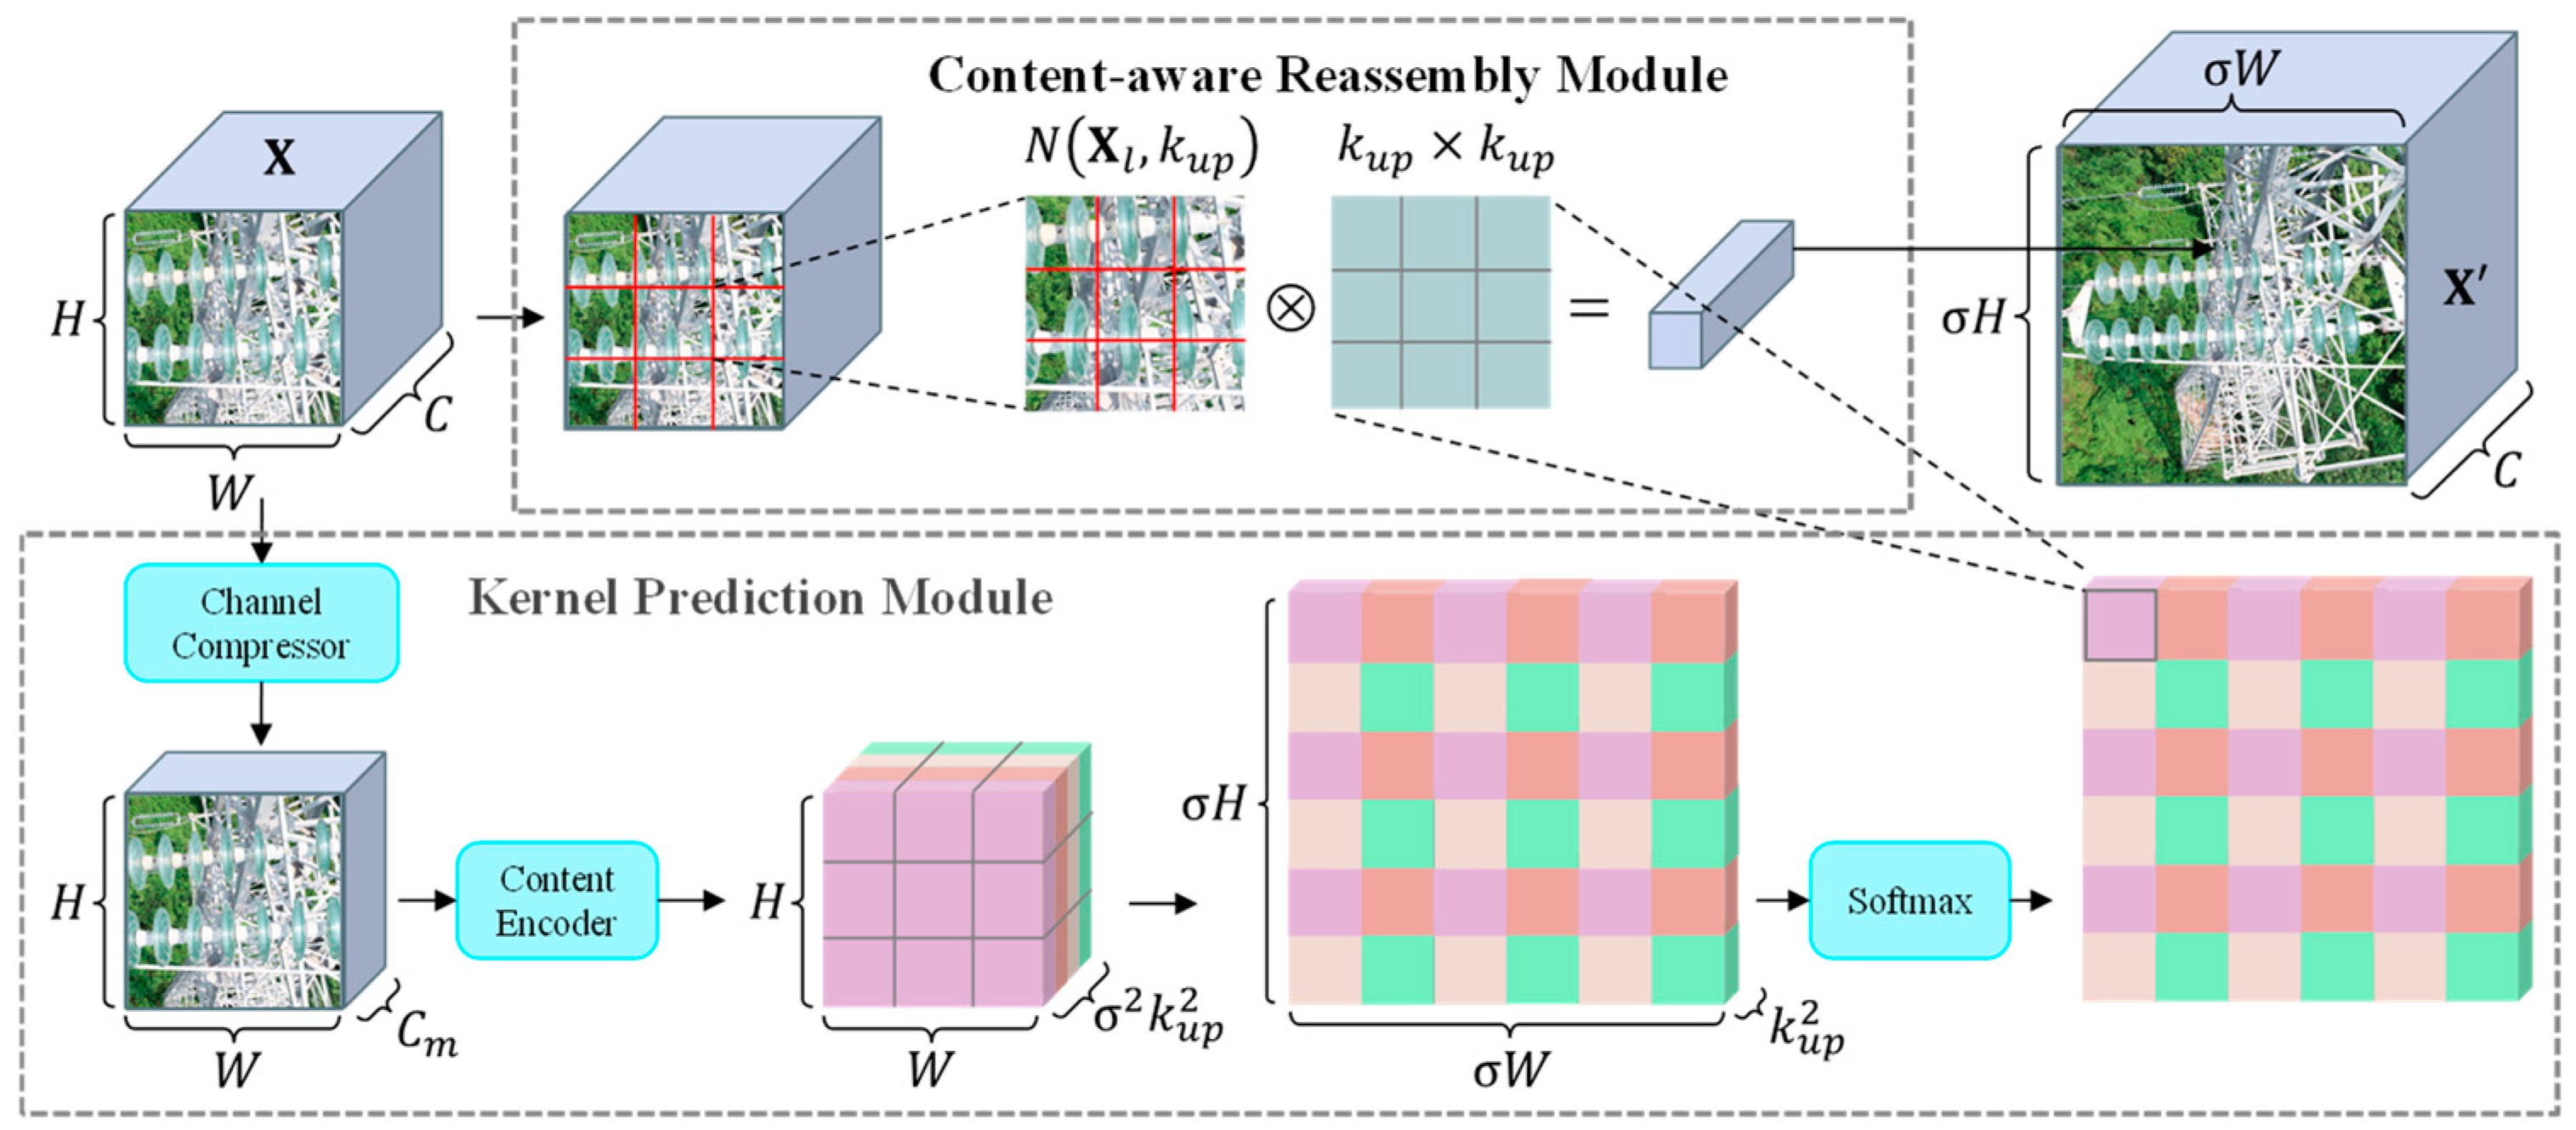
The original YOLOv7 employs a relatively simplistic nearest neighbor interpolation method for up-sampling, which fails to effectively preserve crucial features of the insulator. Moreover, it can introduce aliasing artifacts, causing feature distortion. To address this issue, this paper replaces nearest neighbor interpolation with a content-aware feature reassembly up-sampling operator [
25]. This operator introduces minimal additional parameters and combines context information from a large receptive field to perform feature up-sampling, thereby preserving the fine-grained details of the insulator as much as possible. Due to its content-aware nature, this up-sampling operator can utilize adaptive and optimized reassembly kernels at different locations. Comprising prediction modules for reassembly kernels and content-aware reassembly modules, the up-sampling operator’s overall structure is depicted in
Figure 4.
The content-aware feature reassembly operator consists of two steps. The first step is to predict a reassembly kernel for each target location according to its content, and the second step is to reassemble the features with predicted kernels. Assuming a 2D input feature map
and an up-sample ratio
(supposing
is an integer), then the operator will produce a new feature map
. For any location
in output
, there is a source location
in input
, where
,
. In the first step, the kernel prediction module
predicts a location-wise kernel
for each location
based on the neighbor of
, as shown in Equation (6):
where
is denoted as the
sub-region of
centered at the location
, i.e., the neighbor of
.
where
is the content-aware reassembly module that reassembles the neighbor of
with the kernel
. The details of
and
are as follows.
The kernel prediction module generates reassembly kernels in a content-aware manner. Each source location on corresponds to target locations on . Each target location requires a reassembly kernel of size , where is the size of the reassembly kernel, so this module outputs a reassembly kernel of size , where .
The kernel prediction module is composed of two submodules, i.e., channel compressor and content encoder. Channel compressor compresses the input feature channels from to using a convolutional layer of 1 × 1. Reducing the channels of the input feature map reduces the parameter and computational cost. And content encoder generates a reassembly kernel based on the content of the input features with a convolutional layer with a kernel size of . The parameters of the encoder are .
For each reassembly kernel
in the content-aware reassembly module, the content-aware reassembly module will reassemble the features in a neighborhood via function
. We use a simple
which is just a weighted sum operator. For the target location
and the corresponding square region
centered on
, the reassembly is shown in Equation (8):
where
. In the reassembly kernel, each pixel in the
region contributes differently to the up-sampled pixels because this is an up-sampled feature map based on feature content instead of location distance, which has stronger semantics than the original feature map.
Compared to the nearest neighbor interpolation up-sampling used in the original YOLOv7, this up-sampling operator, with its content-awareness, learns reorganization kernels. These kernels enable the up-sampled feature map to closely resemble the original feature map in content, thereby preserving more features. This is advantageous for enhancing the overall accuracy of the method.
2.3. Wise IOU Loss
The original YOLOv7 suffers from issues with its bounding box regression loss function, CIOU. These issues include the inability to simultaneously increase or decrease the width and height of bounding boxes during parameter updates, as well as the lack of balance between high and low-quality samples. In the training data, low-quality samples hinder the generalization of the object detection model, while high-quality samples dominate and overshadow the influence of lower-quality ones. As a result, the convergence speed of the loss function is slow, leading to a decrease in detection accuracy. To address these issues, this paper utilizes the Wise IOU Loss function, which is based on a dynamic non-monotonic focusing mechanism, for the enhanced method, replacing the CIOU loss function. The Wise IOU Loss function v3 [
26] (hereafter referred to as WIOU) is defined as shown in Equation (9):
Here, , , and IOU is the ratio of the intersection of the prediction box and the ground truth box. is the sliding average with momentum m; the superscript * indicates that it is separated from the computational graph, i.e., not involved in backpropagation and weight updating. The and are the given hyper-parameter, which is taken as , in this paper. The and are the coordinates of the prediction box, while and are the coordinates of the ground truth box, and is the width and length of the outer rectangular box at the intersection of the prediction box and the ground truth box. The quality of the anchor boxes is evaluated using the outlier instead of IOU, and a gradient gain assignment strategy is provided. This strategy reduces the competitiveness of high-quality anchor boxes while reducing the detrimental gradients generated by low-quality examples. This allows WIOU to focus on average-quality anchor boxes and improves the method’s generalization ability and overall performance.
2.4. Experimental Setup and Dataset
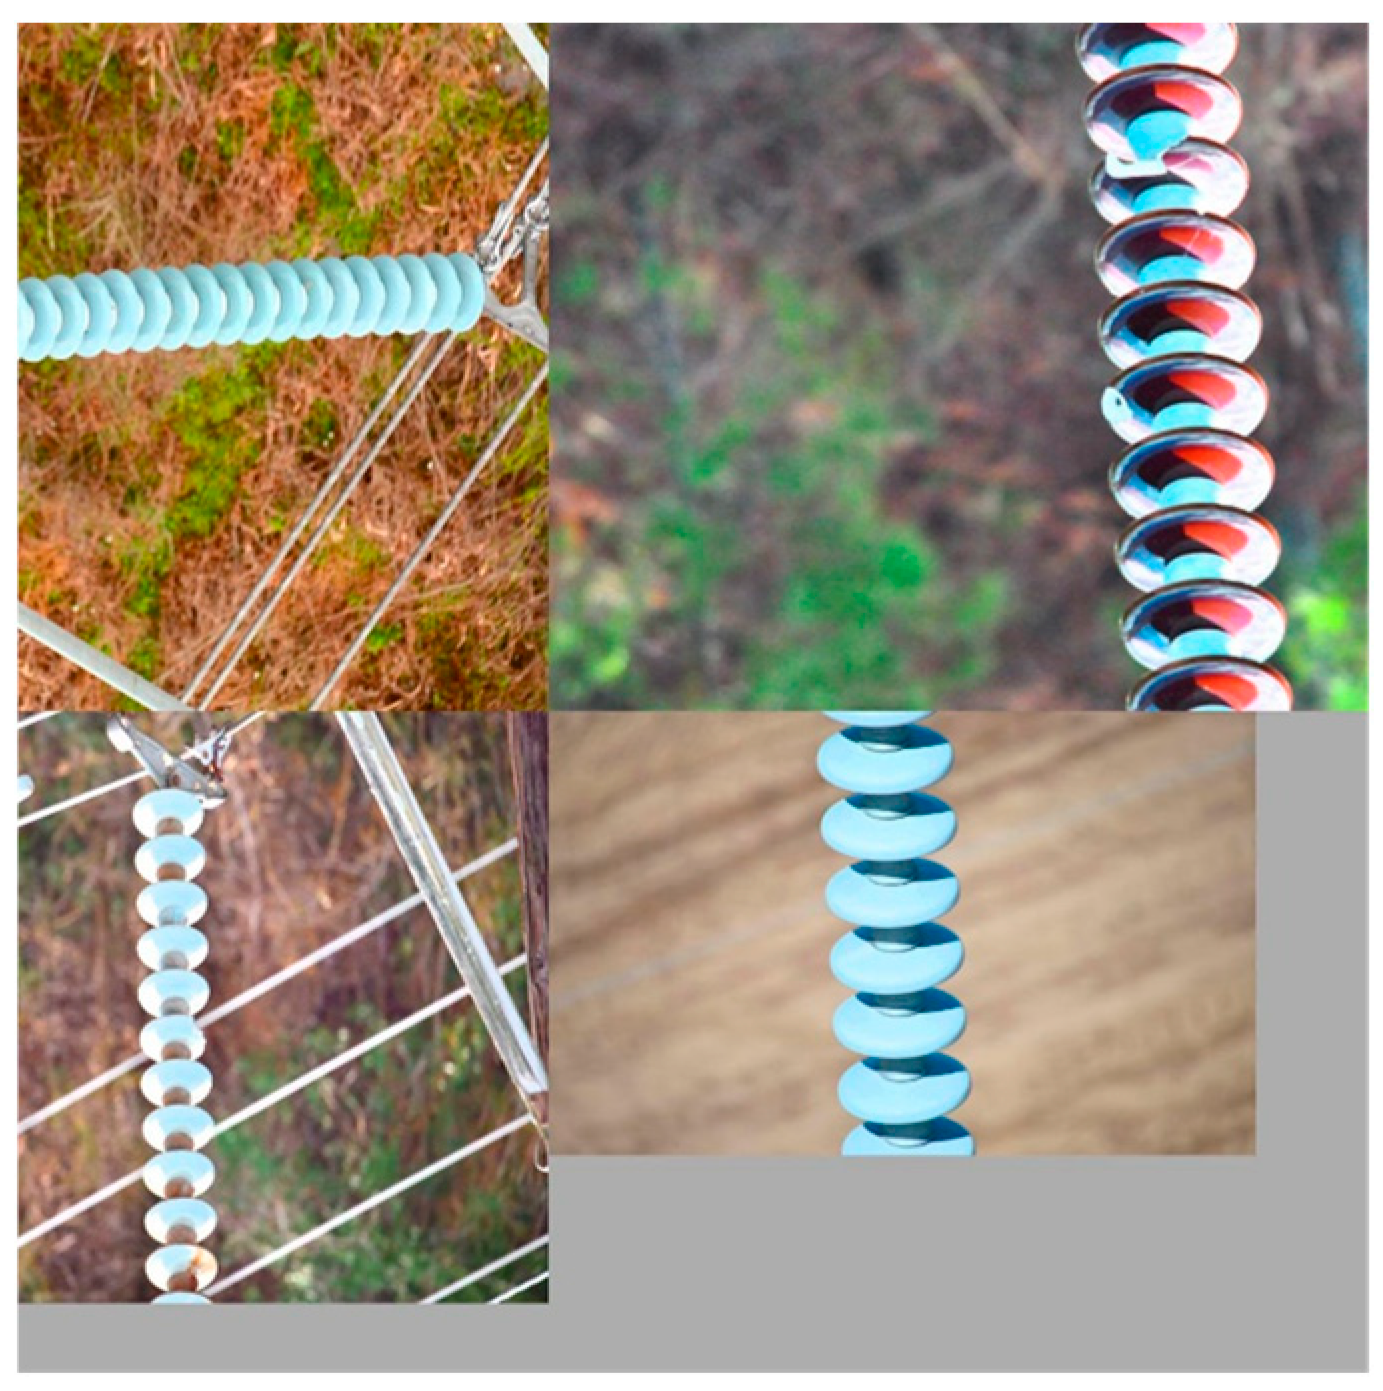
In this paper, insulator images captured from various transmission lines across different voltage levels in Shenzhen, along with an open-source insulator images dataset, are processed to create a dataset comprising insulators exhibiting flashover, breakage, and self-explosion. The dataset comprises a total of 1923 images. We used the LabelImg annotation program to annotate the insulator images, and the XML file with bounding boxes’ locations and labels is generated through the annotation. Examples of self-explosion, breakage, and flashover are shown in
Figure 5. Next, the dataset is augmented using the mosaic augmentation method. This involves randomly rotating, cropping, scaling, and applying color dithering to four images, which are then combined into one new image. Consequently, a total of 4000 augmented images are generated. An example of a data-augmented sample image is shown in
Figure 6, while the distribution of labeled samples is shown in
Table 1.
The training set, validation set, and test set are divided into three parts in the ratio of 8:1:1, and the original size of the image ranges from 1152 × 864 to 7360 × 4921 pixels. Then, the image size is fixed to 640 × 640 pixels after mosaic data augmentation, which is used as the original input for training the model. Before the training starts, the k-means clustering algorithm is used to cluster 9 centers of the length and width of the bounding box in the dataset as the initial anchors of the model, and reasonable anchors can make the model converge faster during training. Finally, the anchors (the length and width of the initial bounding box) are [17, 15], [28, 26], [53, 36], [89, 70], [62, 244], [283, 112], [109, 311], [184, 378], and [387, 252].
2.5. Evaluation Metrics and Performance of Improved Model
The evaluation metrics used in the experiment are
P (Precision),
R (Recall),
mAP (mean Average Precision), and
(
F1 score), and the formula for calculating
P,
R,
mAP,
, is shown in Equation (10):
where
TP (True Positive) is the number of positive samples with correct prediction;
FP (False Positive) is the number of positive samples with incorrect prediction;
FN (False Negative) is the number of negative samples with incorrect prediction;
AP is calculated as the area under the
P-
R curve;
N is the number of labeling categories; and
. In this paper,
mAP@0.5 denotes the
mAP for the IOU (intersection over union) threshold of 0.5 for the predicted boxes and ground truth boxes, and
mAP@0.5:0.95 denotes the average mAP of ten different IOU thresholds ranging from 0.5 to 0.95 with a step size of 0.05.
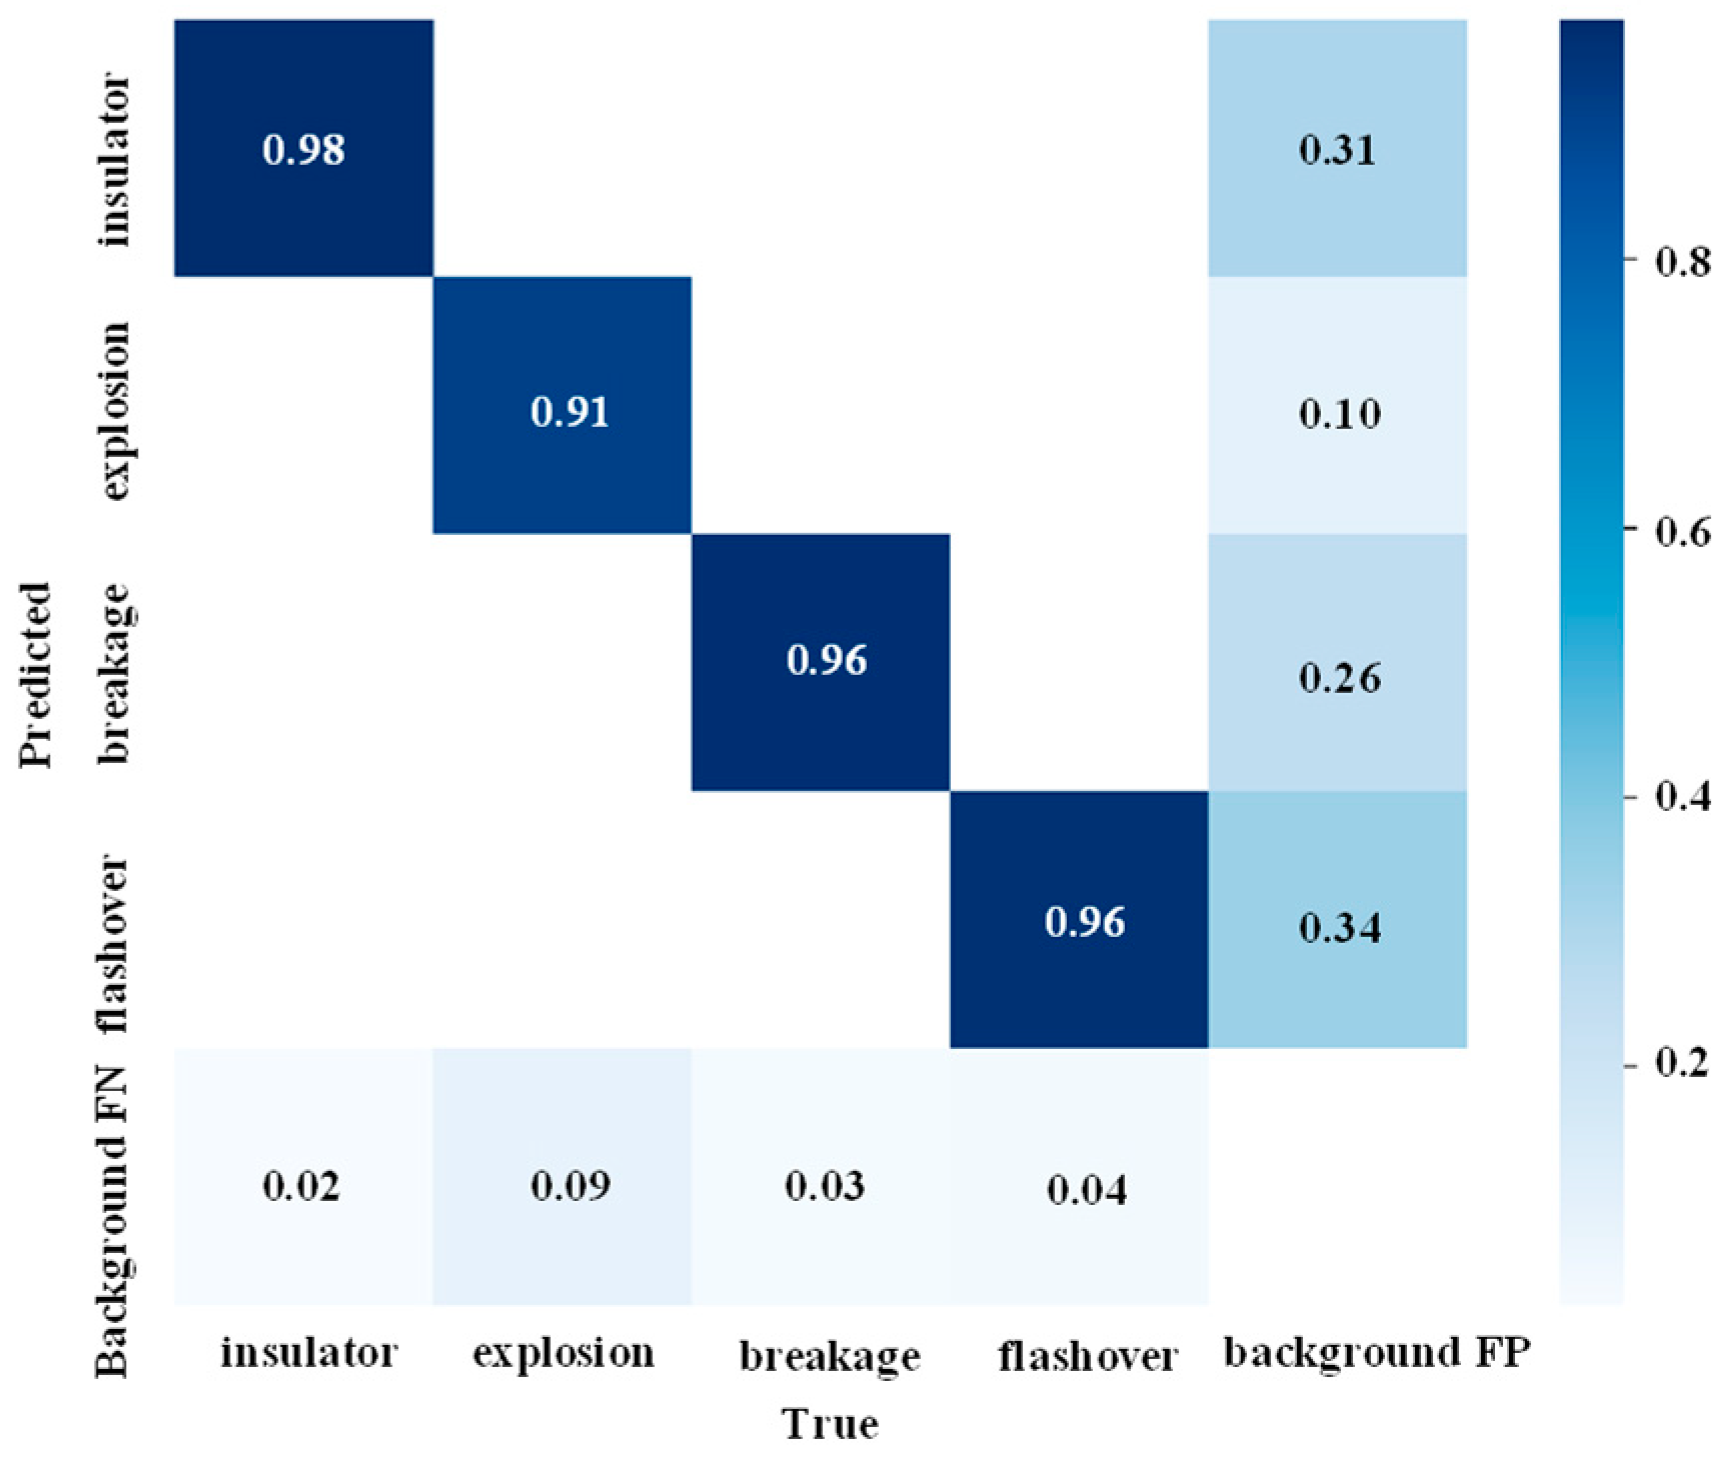
The use of a confusion matrix provides a visual representation of the detection performance of the proposed method on the dataset. The classification confusion matrix for model validation, with an input size of 640 × 640, is illustrated in
Figure 7. The diagonal of the confusion matrix represents the prediction accuracy for each class, while the off-diagonal elements indicate the probability of a particular class being predicted as another class. In the confusion matrix, the background region serves as negative samples, while the positive samples, including breakage, self-explosion, flashover, and insulator strings, are included in the evaluation of model performance.
From the confusion matrix analysis, it can be inferred that the insulation state detection method proposed in this paper demonstrates an overall high recognition accuracy. However, there are still relatively few instances of missed detections, which may be attributed to severe target occlusion or difficulty in capturing extremely small targets in the dataset. Specifically, the recognition rates for insulator strings, self-explosion, breakage, and flashover are 98%, 91%, 96%, and 96%, respectively. Meanwhile, the recognition rate for background is relatively high, indicating that complex backgrounds can indeed interfere with detection results.
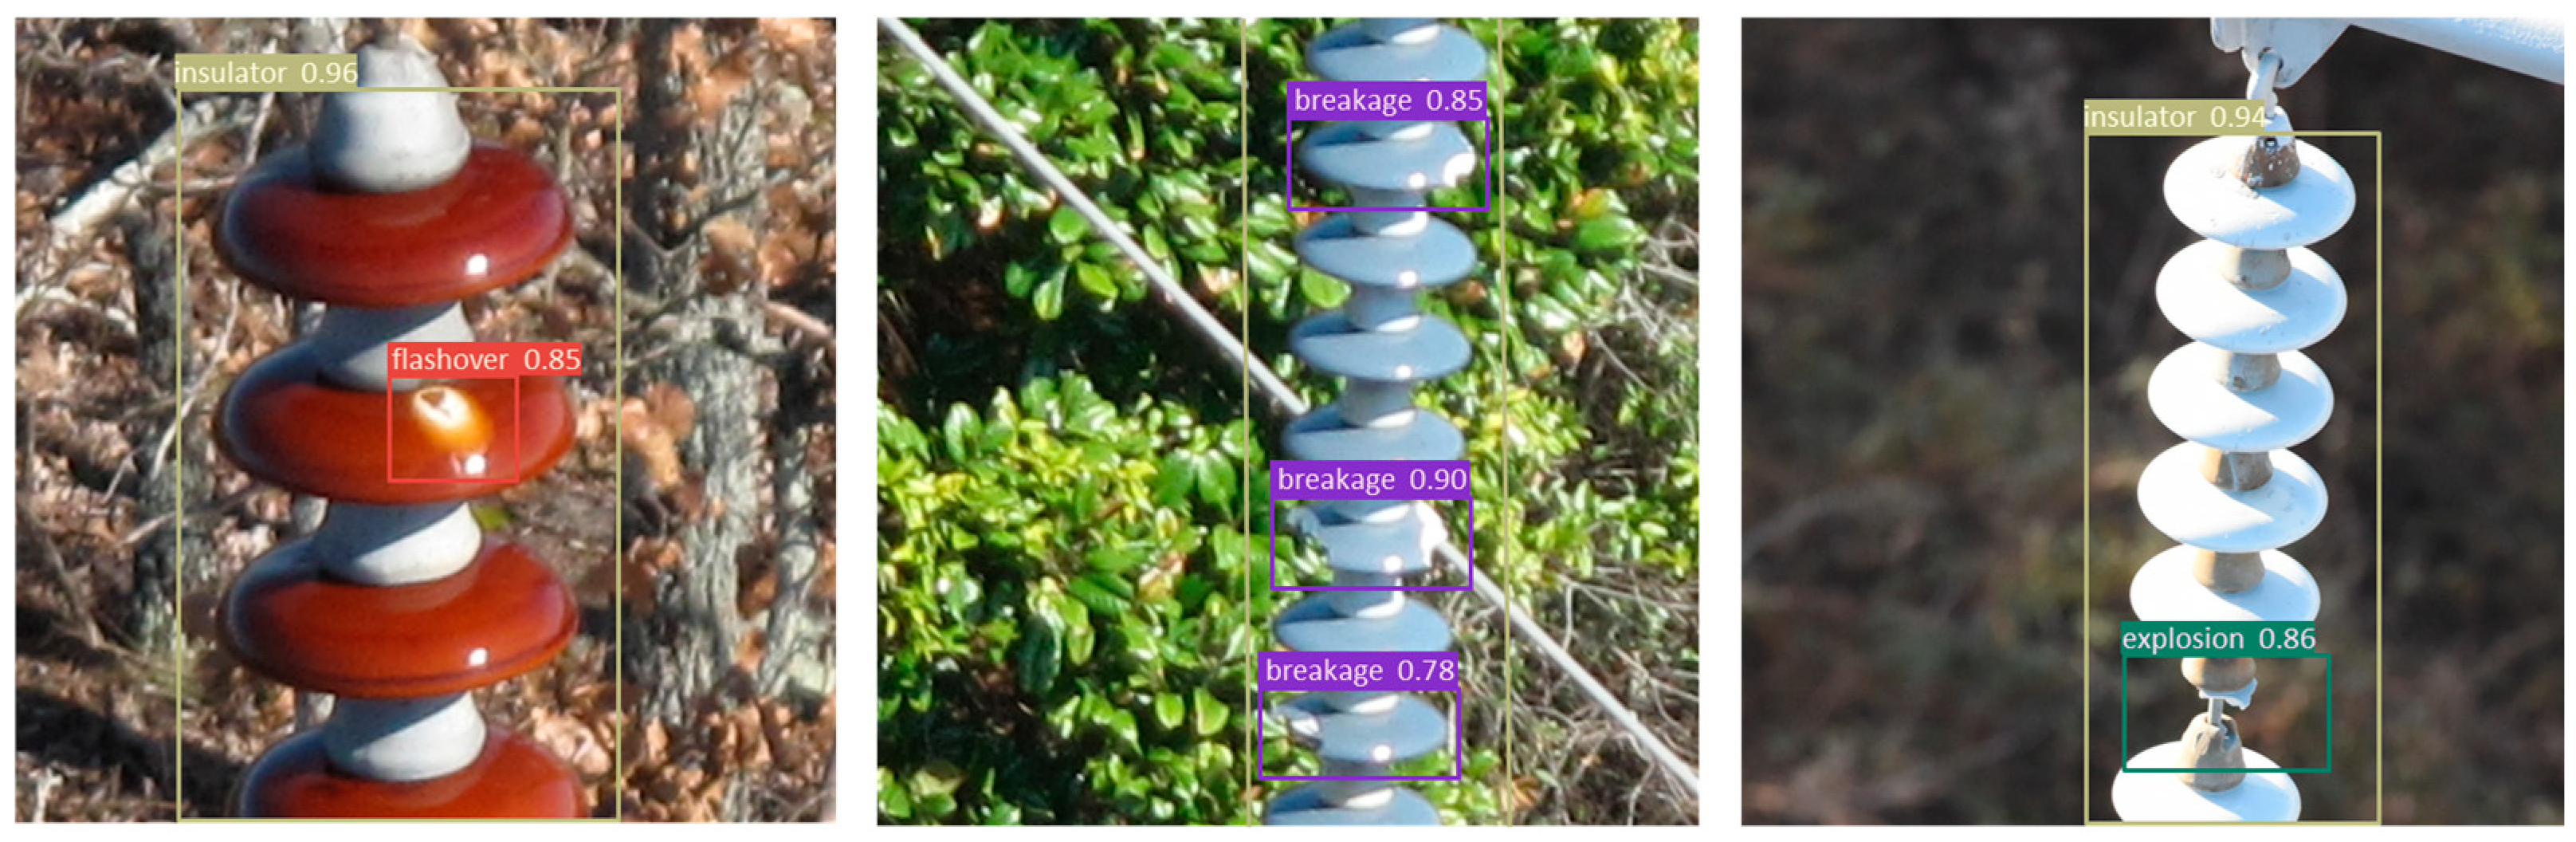
To further validate the detection performance of the proposed method, detection analysis was conducted using a test set. A class confidence threshold of 0.3 and an intersection over union (IOU) threshold of 0.75 were set. The visualized detection results are depicted in
Figure 8. From
Figure 8, it can be observed that the method proposed in this paper accurately detects insulator self-explosion, breakage, and flashover, even in scenarios involving target occlusion, dense targets, small target scales, and complex background interference.
3. Results
3.1. Comparison
To validate the superiority of the proposed method in detection performance compared to other methods and to comprehensively assess the performance of this model, various comparative experiments were conducted using multiple methods. Five object detection methods were compared in this experiment, including SSD, YOLOR [
27], YOLOv5, YOLOv10, and the original YOLOv7. All experiments were conducted on the same experimental platform as the method proposed in this paper, using a consistent dataset.
The performance metrics of the six comparative methods are presented in
Table 2. Among them, the SSD employs VGG16 as its backbone network. Despite having the smallest parameter size among the six methods, its detection accuracy is comparatively lower due to its weaker feature extraction capability. YOLOv5 adopts CSPNet [
28] as its backbone network. The YOLOR optimizes its detection accuracy by encoding implicit and explicit knowledge. YOLOv10 [
29] optimizes both efficiency and accuracy perspectives, which reduces the computational overhead and enhances the capability. With regards to mAP@0.5 on this dataset, the other five methods, apart from the proposed improved method, all achieve below 90%. In contrast, the proposed method achieves an mAP@0.5 of 97.1%, demonstrating superior accuracy, recall, and F1 score compared to other methods. This confirms the effectiveness and superiority of the proposed method.
The changing trend of loss during iteration is illustrated in
Figure 9, which depicts the loss function curves for the validation processes of the six methods over 100 iterations.
As observed from
Figure 9, except for the SSD, the losses of the remaining five methods decrease rapidly in the early iterations, gradually slowing down and eventually converging to a specific value after a certain number of iterations. Utilizing boundary box regression loss based on IOU measurement, the losses of these five methods eventually stabilize below 0.05. Conversely, the SSD employs boundary box regression loss based on the L1 norm, resulting in significantly higher losses and a slower decline in loss during the optimization process. The loss curve of the proposed method decreases from 0.21 to around 0.02, exhibiting the smallest convergence value and a smoother change in loss compared to other methods. This suggests that the proposed method updates parameters more accurately along the steepest gradient descent path, highlighting the advantages of the improved YOLOv7 proposed in this paper.
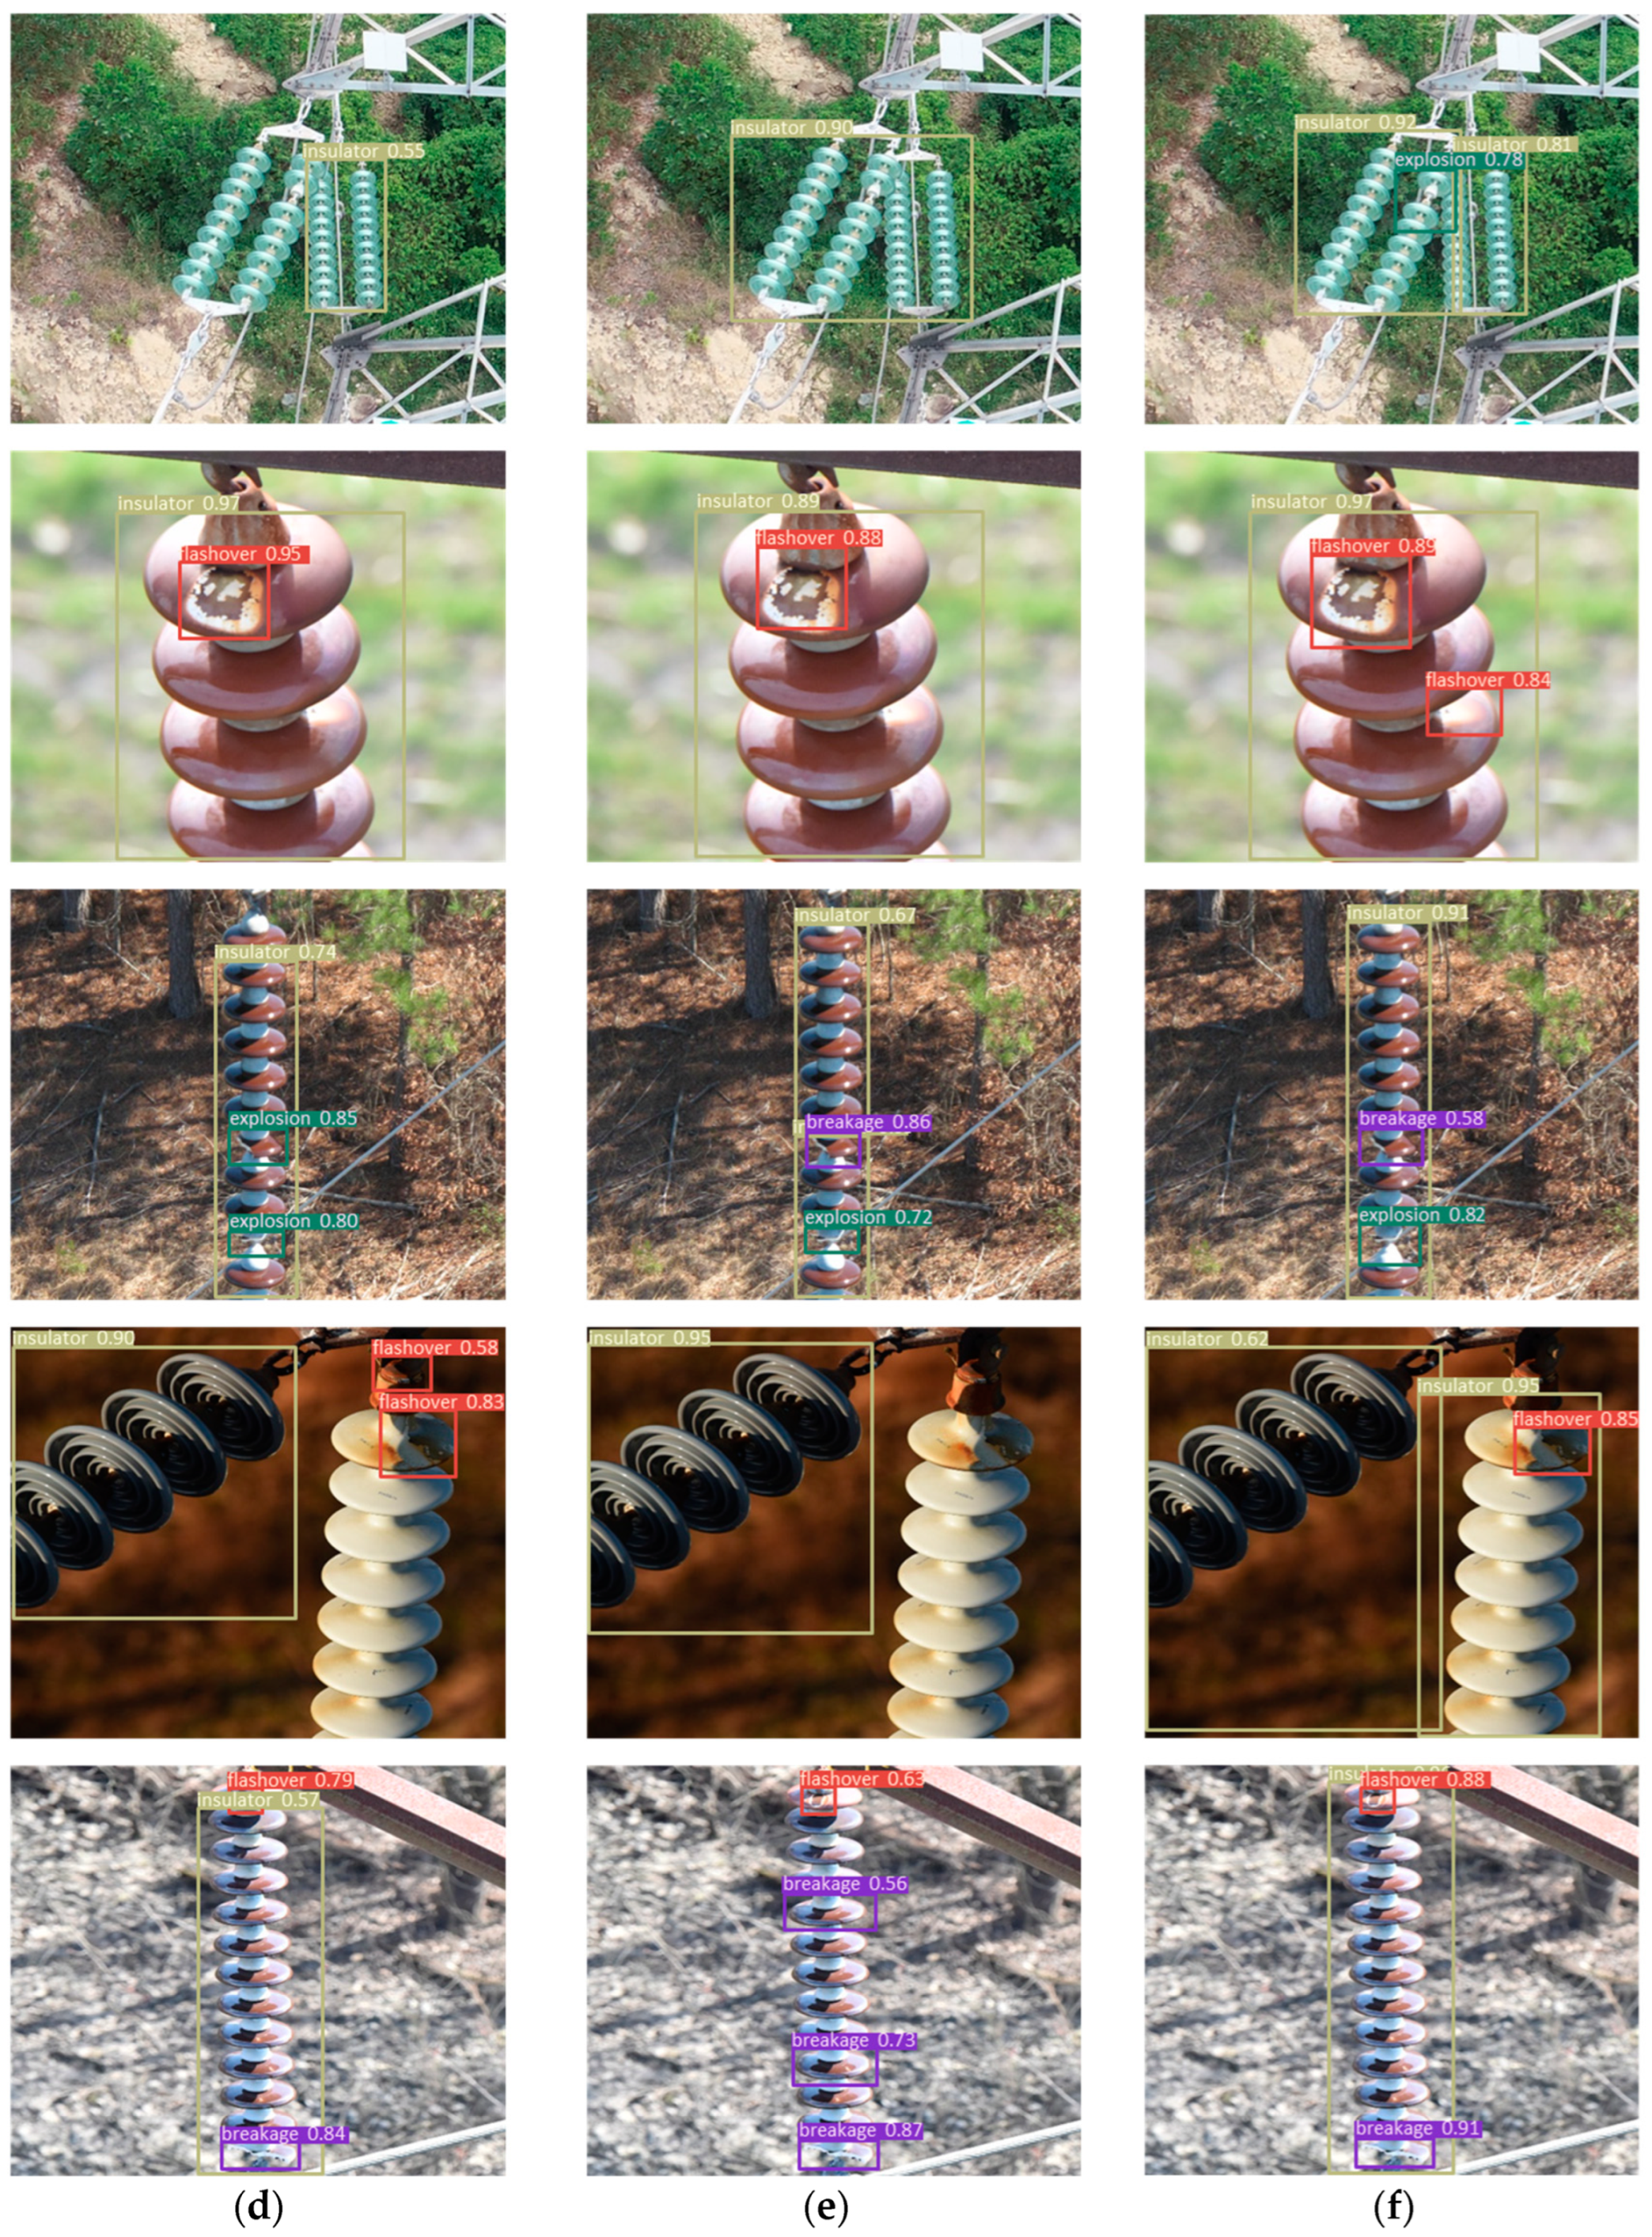
To intuitively demonstrate the detection performance of the proposed method for the insulator state, a comparative analysis was conducted between the proposed method and SSD, YOLOR, YOLOv5, YOLOv10, and the original YOLOv7 on the test set. A class confidence threshold of 0.5 and an intersection over union (IoU) threshold of 0.75 were set. The detection results are depicted in
Figure 10. Detected targets are marked with bounding boxes of different colors to represent different categories, with class labels and class confidence provided in the upper left corner of the bounding boxes.
Among these five detection results, SSD performs the worst, exhibiting missed detections for both small and large targets and poor performance in identifying occluded targets. YOLOR, YOLOv5, YOLOv10, and the original YOLOv7 all exhibit varying degrees of false positives and false negatives. In contrast, the proposed method shows no instances of false positives or false negatives in these five images, with most detected target class confidences higher than those of other methods. Through comparative experimental analysis, it is evident that the proposed method for detecting insulator state in transmission line based on BRA-CBS and content-aware up-sampling performs better in detection performance, producing results more in line with engineering reality and demonstrating good generalization and robustness.
3.2. Ablation
To demonstrate the detection performance of the proposed method, ablation experiments were conducted to validate its performance. The models were trained using the same dataset for 100 epochs, and detection was performed on the test set. Six experimental groups were conducted and compared in terms of their detection accuracy and parameter size. The experimental results are presented in
Table 3 and
Table 4, with
Figure 11 showing the mAP@0.5 curve and
Figure 12 showing the precision–recall (P-R) curve.
Group A utilized the original YOLOv7 network, trained on raw data of size 640 × 640 pixels without data augmentation. Groups B, C, and D, built upon Group A, employed mosaic data augmentation as input. Additionally, they replaced the bounding box regression loss function CIOU with WIOU, replaced nearest neighbor up-sampling with content-aware up-sampling operator, and replaced CBS with the fusion convolution module BRA-CBS with a bi-level routing attention mechanism, respectively. Group E is the proposed method but without data augmentation. Finally, Group F represents the proposed method. From
Table 3 and
Table 4, as well as
Figure 11 and
Figure 12, it can be observed that under the same training epochs, data augmentation significantly enhances the method’s detection accuracy. Moreover, the mAP@0.5 of the proposed method shows smoother variations and converges relatively faster.
Given that the samples of insulator strings and flashover constitute the majority, and the outlier assessment method of WIOU enhances learning with large sample sizes, Group B, which introduces WIOU, achieves the highest recognition accuracies (AP@0.5) for insulator strings and flashover, reaching 99.7% and 98.8%, respectively. Group C, utilizing the content-aware up-sampling operator, demonstrates favorable performance in the recognition accuracy of the self-explosion and the category recognition accuracy and only slightly increases the parameter size by 0.5% compared to the original YOLOv7. Group D, employing the BRA-CBS module, exhibits outstanding recall rates. Comparatively, the proposed method in Group F increases the parameter size by 4% compared to the original YOLOv7. However, its precision, recall, mAP@0.5, and mAP@0.5:0.95 metrics improve by 7.7%, 10.6%, 8.3%, and 19.7%, respectively, over the original YOLOv7. It achieves recognition accuracies (AP@0.5) of 93.5% and 98.6% for self-explosion and breakage, which have fewer samples. Through the analysis of the ablation experiments, it is evident that the improved YOLOv7 proposed in this paper not only introduces fewer parameters but also significantly outperforms the original YOLOv7 in terms of detection accuracy, demonstrating the superiority and effectiveness of this method.
4. Discussion
The experimental results validate the proposed enhancements to the YOLOv7 framework, including the BRA-CBS module, content-aware up-sampling operator, and Wise IOU loss. These improvements significantly enhance detection accuracy, achieving an impressive mAP@0.5 of 97.1% compared to the baseline YOLOv7 model. The method presented in this paper outperforms many existing approaches for insulator defect detection.
For example, Tao et al. [
30] introduced a novel deep CNN cascading architecture for insulator localization and defect detection. However, their method lacks the capability to distinguish between different types of insulator defects. Similarly, other studies [
31,
32,
33,
34,
35,
36] share this limitation, treating all defects as a single category, which restricts their applicability. Moreover, certain methods [
37,
38] focus solely on distinguishing breakage and flashover defects, grouping self-explosion and breakage together. This oversimplification fails to address the distinct impacts of breakage and self-explosion on the insulation of transmission lines. In contrast, Yang et al. [
39] proposed a lightweight detection algorithm that can distinguish self-explosion, breakage, and flashover defects of insulators, IDD-YOLO, but it achieved an mAP@0.5 of only 66.2%, which is insufficient for practical engineering applications.
The proposed method in this paper addresses these challenges by effectively distinguishing between self-explosion, breakage, and flashover, achieving a high recognition accuracy of 97.1%. Additionally, it excels in detecting small and obscured targets, demonstrating clear advantages over existing methods. Despite these achievements, limitations remain. Specifically, the accuracy of detecting self-explosion defects requires further improvement to enhance the method’s overall robustness and reliability.
5. Conclusions
Aiming to address the unhealthy states of self-explosion, breakage, and flashover in transmission line insulators, this paper proposes a state detection method based on deep learning using aerial images of insulators to enhance detection efficiency. Aerial images of transmission line insulators were captured by drones and supplemented with data from an open-source dataset, resulting in a collection of 4000 insulator images through dataset augmentation. By employing a tailored model training and fine-tuning strategy, the verification accuracy of the model reaches 97.1%. Additionally, the detection accuracies for insulators experiencing self-explosion, damage, flashover, and insulator strings are 93.5%, 98.6%, 97.5%, and 98.9%, respectively. This approach successfully achieves automatic detection of insulator states, demonstrating the model’s robust performance. Building on this foundation, future work will aim to enhance the detection accuracy for self-explosion defects and focus on developing datasets for other types of power equipment to broaden state detection capabilities. Additionally, we plan to investigate the impact of GAN-based data augmentation methods on improving model performance.


