Article

Survival of Listeria monocytogenes in Light and Full-Fat, Modified Atmosphere-Packaged, Sliced Greek Cheese over Shelf Life: Implications for Ready-to-Eat Food Safety

by
Ntina Vasileiadi
1,
Theofania Tsironi
2 and
Georgia D. Mandilara
1,*
1
Laboratory of Infectious Disease Surveillance, Unit of Environmental Microbiology, Faculty of Public Health Policy, School of Public Health, University of West Attica, 11521 Athens, Greece
2
Laboratory of Food Process Engineering, Department of Food Science and Human Nutrition, Agricultural University of Athens, 11855 Athens, Greece
*
Author to whom correspondence should be addressed.
Appl. Sci. 2025, 15(11), 6109; https://doi.org/10.3390/app15116109
Submission received: 7 April 2025 / Revised: 16 May 2025 / Accepted: 26 May 2025 / Published: 29 May 2025

Abstract

:
Listeria monocytogenes (Lm) represents a considerable hazard in ready-to-eat (RTE) foods, particularly for susceptible individuals. This study investigated the survival of Lm in modified atmosphere-packaged (MAP) semi-hard sliced Greek cheese, comparing full-fat and light varieties. Challenge testing was conducted, and key product characteristics, including MAP gas composition, background microbiota, sodium chloride concentration, fat content, water activity, and pH, were determined. While the tested sliced cheeses, under specific MAP and storage conditions, met EU regulatory criteria for RTE foods unable to support Lm growth, the pathogen persisted at low levels throughout the 6-month shelf life. This finding underscores a potential risk associated with temperature abuse or compromised packaging integrity, which could facilitate Lm proliferation. The observed survival highlights the importance of growth potential assessment, even in food matrices seemingly non-supportive of Lm. Given that post-pasteurization processing steps like slicing and MAP packaging can introduce contamination risks for vulnerable consumers, this study emphasizes the necessity of stringent hygienic practices to prevent Lm contamination. Food business operators (FBOs) must rigorously implement food safety protocols, including controlled storage temperatures, robust hygiene measures, and effective cross-contamination prevention strategies between raw and RTE products, to safeguard public health, protect brand integrity, and mitigate economic losses.

1. Introduction

Listeriosis, caused by Listeria monocytogenes (Lm), is a serious zoonotic infection that leads to high mortality in both humans and animals [1,2]. Listeriosis manifests in two forms: non-invasive and invasive. Non-invasive listeriosis is typically self-limiting, presenting with mild symptoms in healthy individuals. On the other hand, invasive listeriosis can be severe and life-threatening, particularly among vulnerable populations like pregnant women, immunocompromised individuals, the elderly, and infants. It can lead to severe conditions such as meningitis, sepsis, stillbirth, abortion, neurological diseases, and, in extreme cases, death [1,3,4,5,6,7]. Listeriosis can occur both as sporadic cases and outbreaks.
Listeria monocytogenes is a Gram-positive, facultatively anaerobic and aerobic bacterium, which is ubiquitous in the environment, including in water, soil, sewage, feces, and silage. This psychrotrophic bacterium demonstrates remarkable resistance to extreme environmental conditions such as low pH, low temperature, and high salt concentration, allowing it to survive various food processing methods like smoking, salting, drying, and freezing [8,9,10,11]. The ability of Lm to form biofilms allows it to persist for long periods in food processing environments, including siphons, floors, counters, equipment, and drainage filters [12,13]. If not properly controlled and prevented, Lm poses a significant risk for cross-contamination in the food supply chain [14,15,16].
The primary route of transmission for Lm is through contaminated food, particularly ready-to-eat (RTE) foods, designated for immediate consumption, requiring no further thermal or other antimicrobial processing to ensure microbiological safety [17]. Numerous RTE foods have been identified as potential carriers of Lm, such as soft cheeses from both pasteurized and unpasteurized milk [18,19,20,21], smoked and salted fish [16,22,23,24], ice cream [25], fruits and vegetables [26,27,28], salads [29], pâté [30], and various meat products [31,32,33,34].
The heightened risk of Lm contamination in ready-to-eat (RTE) foods, such as sliced cheese, is attributable to the multiple processing stages inherent in their production. Each manipulation, including slicing and packaging, elevates the potential for bacterial introduction from environmental sources, processing equipment, or personnel. Furthermore, the increased surface area resulting from slicing enhances susceptibility to contamination. The ubiquitous nature of Lm in processing environments, coupled with its ability to form biofilms on equipment, poses a significant challenge to sanitation efforts. Critically, post-pasteurization food processing steps, such as slicing and packaging, lack subsequent bactericidal treatments, rendering them vulnerable to contamination. Consequently, rigorous adherence to stringent hygiene and sanitation protocols is imperative to mitigate the risk of Lm contamination in these RTE food products [35,36].
Modified atmosphere packaging (MAP) is frequently employed to extend the shelf life of ready-to-eat (RTE) food products; however, its application presents a complex interplay with the potential for Lm proliferation. While MAP, particularly those with elevated carbon dioxide concentrations, can inhibit the growth of many spoilage microorganisms, Lm exhibits a notable tolerance to these conditions. This pathogen’s ability to thrive at refrigeration temperatures, coupled with its capacity to tolerate modified atmospheric conditions, necessitates a careful consideration of food safety protocols. Therefore, while MAP can contribute to extending product shelf life, it should not be considered a sole intervention for Lm control [37,38,39,40,41]. The interaction between Lm and fatty food matrices is multifaceted, extending beyond a simple direct correlation between fat content and bacterial proliferation. While fat itself does not serve as a primary growth substrate for Lm, its presence significantly impacts bacterial survival and potential growth dynamics. Notably, lipid components can confer a protective effect against antimicrobial interventions. Furthermore, the overall food matrix, including its lipid content, influences physicochemical properties such as water activity, which, in turn, modulates Lm growth. Research indicates that the microstructure of fatty foods also plays a role in influencing bacterial growth patterns. Additionally, while Lm does not directly metabolize lipids, the presence of fats and oils contributes to the overall nutrient milieu, potentially supporting bacterial proliferation. Finally, the fatty acid composition of the surrounding food matrix can influence the composition of the Lm cell membrane, especially during adaptation to low temperatures. Consequently, although fat is not a direct growth promoter, it creates an environment that can enhance Lm survival and influence its growth trajectory. Therefore, rigorous handling and processing protocols are crucial for fatty, ready-to-eat food products to mitigate the risk of Lm contamination [42,43,44,45].
In 2023, the listeriosis notification rate in the EU/EEA stood at 0.66 cases per 100,000 population [1]. This represented a 5.8% increase compared to the 2022 rate (0.63 cases per 100,000 population) and marked the highest incidence rate and cases reported since 2007. Additionally, the overall trend in Lm infections showed a statistically significant increase over the 2019–2023 period [1]. In Greece, between 2004 and 2023, a total of 266 listeriosis cases, with an average annual incidence rate of 1.23 cases per 1,000,000 population, were reported; a significant surge in cases was observed in 2023, with the incidence rate reaching 3.0 cases per 1,000,000 population [46,47].
These developments highlight significant challenges for both the food industry and public health authorities. European Regulation (EC) No 2073/2005 imposes strict safety criteria for specific microorganisms in RTE foods, including Lm [48]. The regulation outlines microbiological criteria based on factors like the pH and water activity (aw) of the food, which influence the growth of Lm. Foods with a pH ≤ 4.4, aw ≤ 0.92, a combination of pH ≤ 5.0 and aw ≤ 0.94, or a shelf life shorter than five days are considered safe, as long as Lm levels do not exceed 100 CFU/g during the product’s shelf life. For RTE foods capable of supporting Lm growth, stricter measures are required. Food business operators (FBOs) must demonstrate that Lm levels will remain below 100 CFU/g throughout the product’s shelf life or test for the absence of Lm in a 25 g sample. If neither is possible, the regulation mandates the implementation of science-based approaches, including challenge tests and durability studies, to ensure that Lm growth is controlled. These studies encompass all stages of food production, processing, distribution, and consumer use. Numerous studies have been conducted on monitoring Lm growth in RTE foods [49,50,51,52,53,54]. Commission Regulation (EU) 2024/2895 of 20 November 2024 amends the Regulation (EC) No 2073/2005 as regards Lm and tightens microbiological criteria for Lm in ready-to-eat (RTE) foods that support its growth. Specifically, it mandates that if a food business operator cannot demonstrate that Lm levels will remain below 100 CFU/g throughout the food’s shelf life, the “not detectable in 25 g” criterion must be met for the entire shelf life, not just at the manufacturing stage [48]. This effectively increases safety standards and potentially impacts shelf life management for affected RTE products.
The purpose of this study was to evaluate whether RTE Greek light and full-fat semi-hard sliced cheeses, packaged under a modified atmosphere (MAP), can support the growth of the pathogenic microorganism Lm after artificial inoculation with Lm strains. The cheese slicing process poses a significant risk of potential contamination with Lm due to equipment contamination and cross-contamination between products. Additionally, improper handling and failure to maintain the correct conditions such as the composition of gases in the modified atmosphere (MAP) during packaging may increase the risk of Lm contamination and growth. Furthermore, the quality and sterility of packaging materials can also present a risk due to cross-contamination. Another objective of this study was to examine whether the fat content of the tested cheeses affects the growth of Lm. Additionally, we aimed to determine the optimal storage conditions to minimize the likelihood of Lm growth.

2. Materials and Methods

2.1. Characteristics and Storage Conditions of Cheese Food Matrix

The food products examined in this research were Greek light and full-fat semi-hard cheeses originating from the same manufacturing facility and produced from 100% Greek pasteurized sheep’s and cow’s milk. Following a 4-month maturation process, the cheeses were sliced and subsequently packaged under modified atmosphere packaging (MAP). The fat content of the full-fat cheese was 29% (29 g/100 g), whereas the light cheese exhibited a fat content of 17% (17 g/100 g). Each package (sample) had a net weight of 200 g and contained ten slices. A six-month shelf life was specified for both cheese varieties when packaged under MAP. To assess inter-Batch variability, three independent Batches of each cheese type, produced on different production days, were included in this study, resulting in a total of 120 samples (n = 20 per Batch).
Based on the “EURL Lm Technical Guidance Document on Challenge Tests and Durability Studies for assessing shelf life of Ready-to-Eat foods related to Lm” [55], as well as ISO 20976-1:2019 [56], we made corresponding adjustments to align with our research inquiry. Specifically, the protocol is as follows:
Upon receipt from the producer on the second day following production, the cheeses were transported in temperature-controlled boxes with ice packs and were already packaged under a modified atmosphere (MAP). This arrival date was established as “Day 0” for the initiation of our analytical procedures. The stated expiration date of the product was referred to as “Day End”.
The storage temperatures implemented in this study were as follows: 5 °C during the manufacturing phase, 5 °C during transportation, and 7 °C at the retail stage. These temperature values were selected to represent the most reliable and predictable conditions within the cold chain. The storage temperature applied at the consumer level was 10 °C, informed by the findings of the study “Temperatures of the food cold chain at the consumer level in Europe” [57,58].

2.2. Listeria monocytogenes Inoculum Preparation

To eliminate any potential bias associated with the use of a single Lm strain, a mixture of three different Lm strains was used to inoculate the cheeses.
The Listeria monocytogenes (Lm) reference strains utilized were obtained from the European Reference Laboratory for Lm. These strains were originally isolated from various cheese types and their associated environments. Specifically, three of the employed strains were linked to dairy products and are listed below:
  • Strain isolated from a related environment (milk production filter): 17SEL22LM, molecular serotype IIa, clonal complex 14, sequence type 91;
  • Strain isolated from raw milk cheese: 17SEL82LM, molecular serotype IVb, clonal complex 6, sequence type 6;
  • Strain isolated from cheese: 09CEB411LM, molecular serotype IIa, clonal complex 26, sequence type 26.
Before processing each Batch, for each Batch, Subculture 1 and Subculture 2 from each of the aforementioned strains were prepared following the guidelines outlined in the EURL Lm TGD [55].
To obtain a mixed culture of the three Lm strains, we mixed at equivalent concentration Subculture 2 of each of the above strains. Subsequently, for each Batch, an inoculum suspension was prepared using decimal dilutions with physiological water. The Lm concentration in the inoculum, for each Batch, was determined according to ISO 11290-2 [59].
The Lm inoculum concentration for three Batches of light semi-hard sliced cheeses was as follows: for Batch 1, 1.85 × 10⁴ CFU/mL; for Batch 2, 1.7 × 10⁴ CFU/mL; and for Batch 3, 1.7 × 10⁴ CFU/mL. Meanwhile, for three Batches of full-fat semi-hard sliced cheeses, the concentrations were as follows: for Batch 1, 1.6 × 10⁴ CFU/mL; for Batch 2, 1.5 × 10⁴ CFU/mL; and for Batch 3, 1.5 × 10⁴ CFU/mL. The target contamination level of Lm for each of the six Batches was 150 CFU/g.
This level of contamination closely approaches the food safety limit criteria outlined in Regulation 2073/2005 [48] and minimizes the impact of measurement uncertainty associated with low bacterial counts.

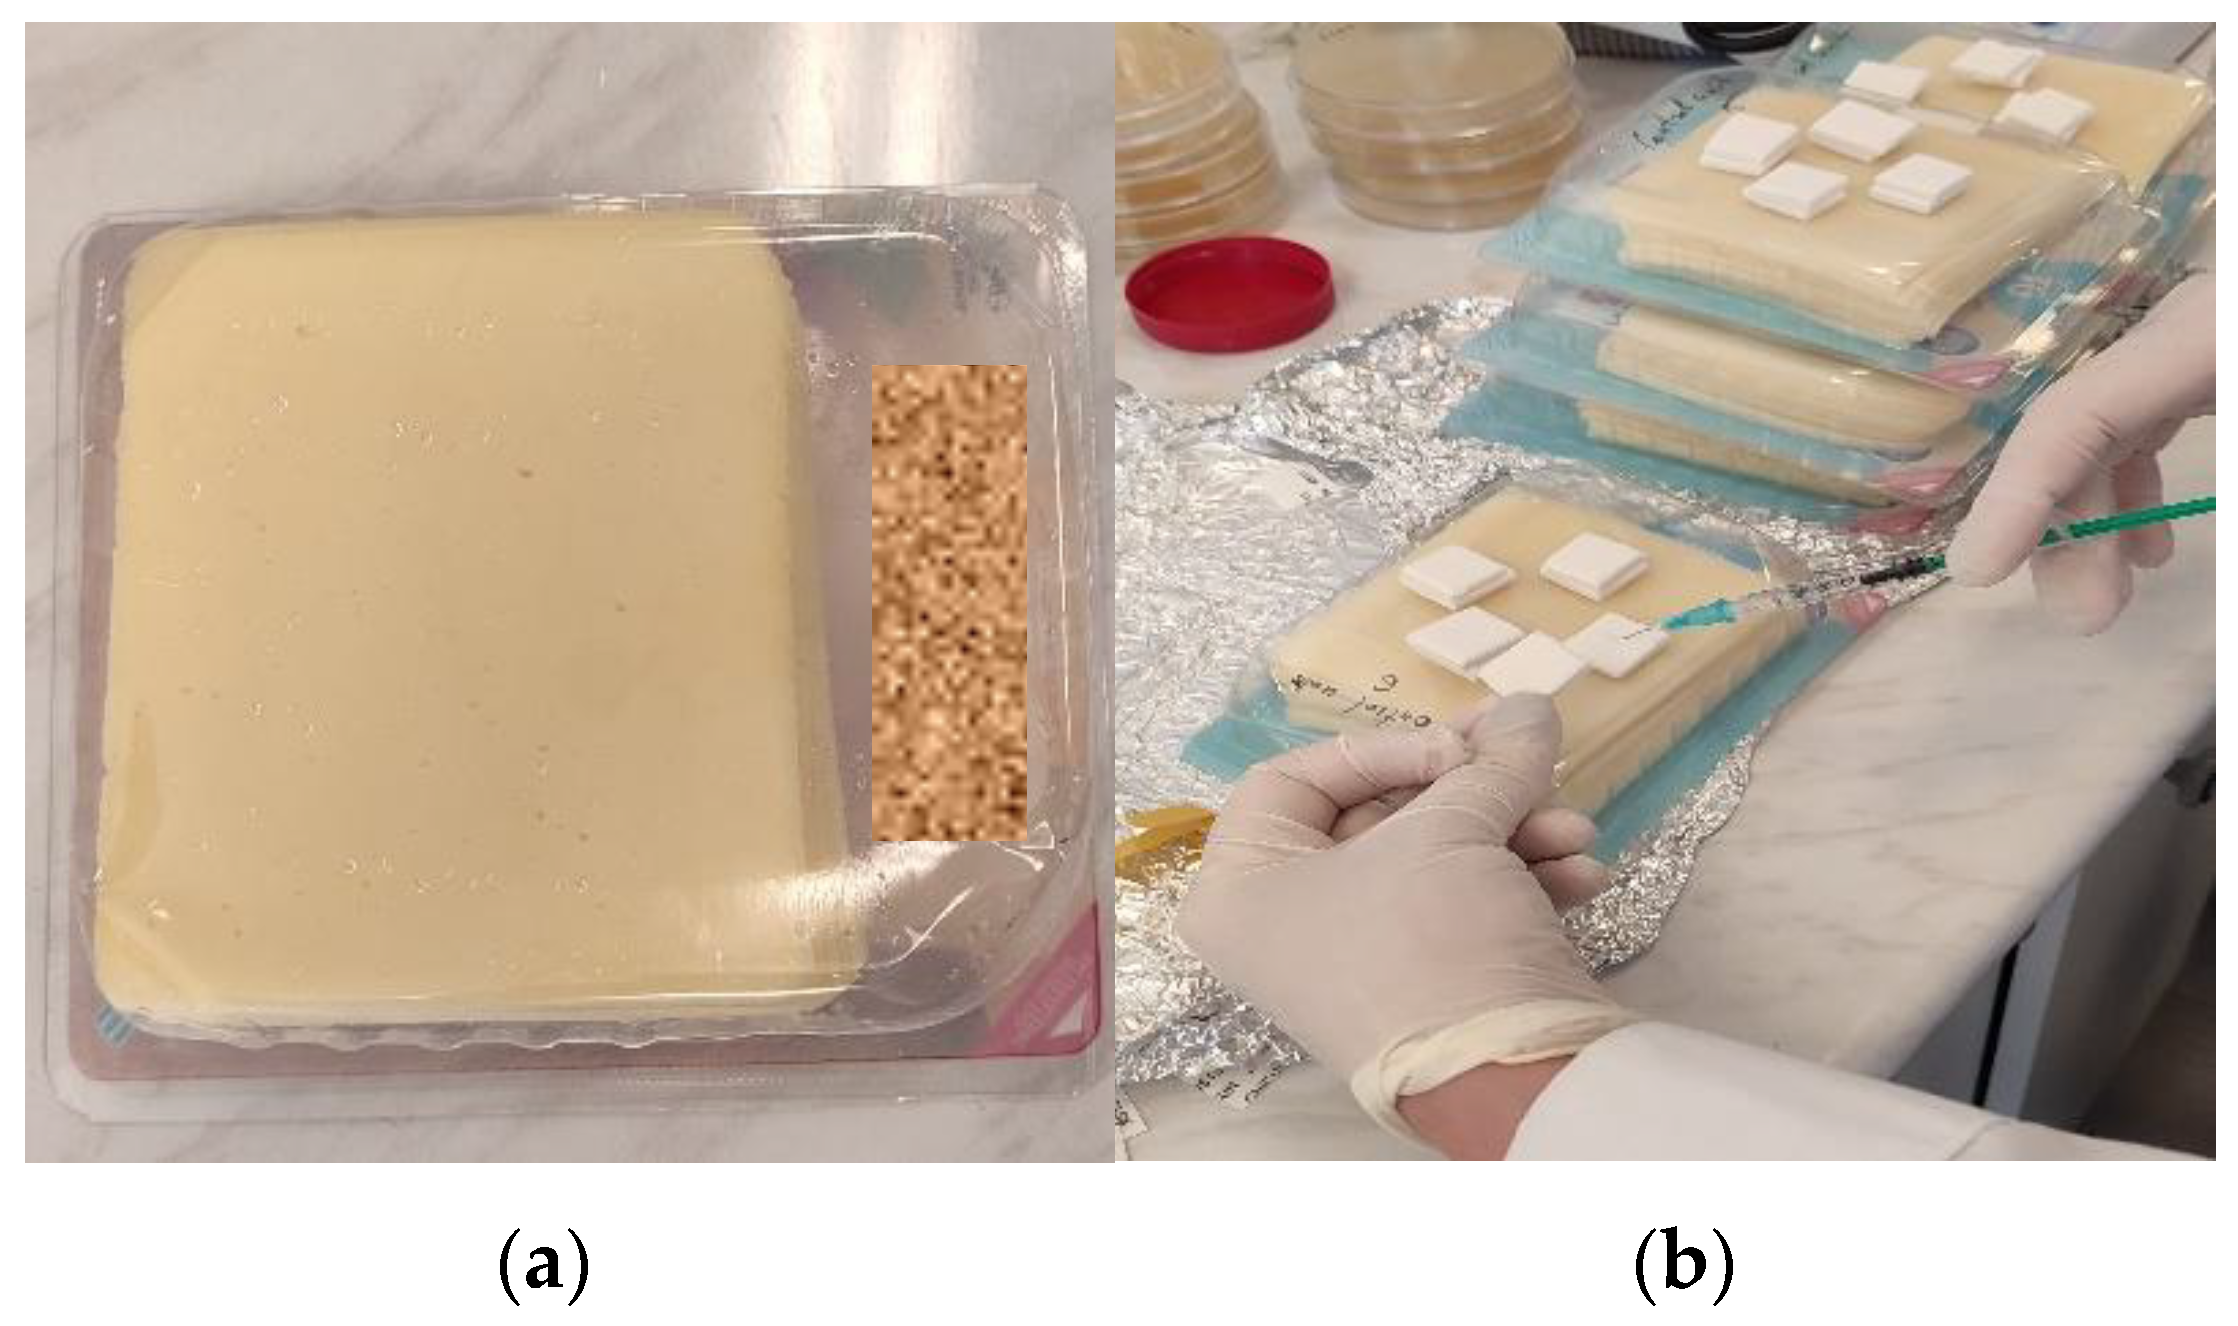
2.3. Inoculation of Cheese Food Matrix and Homogenization Procedure

In order to inoculate the whole food matrix, a suitable quantity of Lm _inoculum was prepared. The volume of inoculum introduced into each sample should not exceed 1% of the mass of each sample, which was 200 g. All three Batches of light cheese and all three Batches of full-fat cheese were inoculated with Listeria monocytogenes (Lm) to a target concentration of 150 CFU/g. Based on the determined concentration of the working inoculum and employing the formula outlined in the EURL Lm Technical Guidance Document (C inoculum × V inoculum = C whole matrix × M matrix), the precise volume (in milliliters) required for the inoculation of samples within each Batch was calculated to achieve the target final concentration of 150 CFU/g of Lm. To preserve the modified atmosphere packaging (MAP) within the experimental units, the inoculum was divided into four portions and introduced via four double septa using sterile syringes, as depicted in Figure 1b. The inoculation of each sample was performed both on the surface and within the depth of the cheese. Subsequently, the packages underwent vigorous agitation. This methodology aimed to ensure the comprehensive contamination of all regions of the cheese and the headspace environment within the package, resulting in a uniform distribution of the microbial load.
Eight samples (n = 8) of each cheese type (light and full-fat), referred to as “Test Units”, were inoculated with Lm strains through the double septum, upon the receipt of the cheese samples at the laboratory, on “Day 0”.
Four additional samples (n = 4) of each cheese type, referred to as “Control Units”, were injected with physiological water through the double septum. The injected volume for the “Control Units” was identical to the volume of the Lm inoculum injected into the “Test Units”, and the storage conditions for the “Control Units” were maintained identical to those of the “Test Units” (Figure 1).
For the enumeration of Lm, upon opening each package, the cheese slices were aseptically reduced to smaller fragments using a sterile, single-use scalpel. Subsequently, the comminuted cheese was transferred to a sterile Stomacher bag, and the contents were initially mixed manually to ensure homogeneity prior to mechanical homogenization using a Stomacher apparatus for a duration of three minutes.

2.4. Experimental Design

The “Control Units” were utilized to assess the pH, water activity (aw), and NaCl content (%) values of the cheese samples and to evaluate the existing “microbial flora”—mesophilic aerobic count and lactic acid bacteria (Lab)—present in the food on “Day 0” and on the end of the shelf life—“Day End”. These units served to evaluate potential effects arising from changes in the actual composition of the food, which practically results in “identical” physicochemical conditions to those in the inoculated “Test Unit” samples.
On “Day 0”, for three of the eight “Test Units” inoculated with Lm samples of each cheese (full-fat and light), Lm enumeration was performed. The remaining inoculated “Test Unit” samples were stored at 5 °C for 24 days to simulate the conditions at the production and transportation levels. The subsequent Lm enumeration was performed after 35 days of storage at 7 °C, after 49 days of storage at 7 °C, and after 57 days of storage at 7 °C to simulate storage conditions at the retail level. Finally, the remaining samples were tested after another 17 days of storage at 10 °C, on the last day of the shelf life on the “Day End” (181st day), to mimic storage conditions at the consumer level.
An additional “Control Unit” sample (n = 1) was dedicated to monitoring the storage temperatures of the test samples studied. A thermal data logger (Elitech RC-5) was placed inside a designated “Control Unit” sample within the same incubator, as close as possible to the “Test Unit” samples, to continuously record temperature data throughout the experiment. Also, on the two above “Control Unit” samples, gas atmosphere monitoring measurements were performed, two measurements per Batch on “Day 0” and two on “Day End”.
On “Day 0”, from each Batch, five (n = 5) “Food Control Samples”—the samples without any inoculation—were analyzed to confirm the absence of Lm. Five samples (n = 5) of each Batch were tested on “Day 0” for pH and aw, to ensure the uniformity and representativeness of the samples received from each Batch. Also, the pH, aw, NaCl content (%), and fat content (%) values in these samples were tested, as well as the microbial flora naturally present in the product. Furthermore, on the above “Food Control Samples”, gas atmosphere monitoring measurements were performed, five measurements (n = 5) on “Day 0” and two (n = 2) on “Day End”.
All microbiological criteria analyses were performed following ISO methods [59,60,61,62]. Fat content and salt concentration were determined in the aqueous phase, and the water activity (aw) and pH values were determined using AOAC procedures [63].
All the procedures mentioned above are summarized in Table 1.

2.5. Data Analysis

An analysis of variance (two-factor ANOVA) at a significance level of 95% was applied for the analysis of the studied physicochemical and microbiological parameters for all sample series (XLSTAT 2023.1.1, https://www.xlstat.com/en/, accessed on 10 March 2025).

3. Results

3.1. “Food Control Samples”

In each of the three Batches of light and of full-fat semi-hard sliced cheeses, the absence of Lm in the five (n = 5) “Food Control Samples” per Batch on “Day 0” was verified; Lm was not detected in 25 g.
The measured values of pH in three light cheese Batches of the “Food Control Samples” on “Day 0” ranged from 5.68 to 6.23, and the pH values measured in three Batches of full-fat cheese ranged from 5.63 to 6.23. These values approached the optimal conditions for Lm growth (pH ≈ 7.0). The measured values of the aw of the “Food Control Samples” on “Day 0” in three light cheese Batches ranged from 0.65 to 0.81, and the aw measured in three Batches of full-fat cheeses ranged from 0.692 to 0.820.
The %MAP O2 values on “Day 0” in three Batches of light sliced cheeses ranged from 0.10% to 3.50%. By “Day End”, there was a general decrease, and the values did not exceed 0.50%. The %MAP CO2 on “Day 0” had values from 19.40% to 25.80%, while on “Day End”, it increased, and the values ranged from 25.90% to 34.10%.
The %MAP O2 values in three Batches of full-fat sliced cheese from “Day 0” to “Day End” were almost similar to those of light cheeses. The %MAP O2 values on “Day 0” ranged from 0.50% to 1.60%. However, on “Day End”, there was again a general decrease, and the values did not exceed 0.60%. The %MAP CO2 on “Day 0” had values ranging from 18.50% to 25.50%, while on “Day End”, they increased, and the values ranged from 27.60% to 33.30% (Table 2 and Table 3).

3.2. “Control Units”

3.2.1. Physicochemical Analysis of “Control Units” in Three Batches of Greek Light Semi-Hard Sliced Cheese, Packed Under Modified Atmosphere (MAP)

The measured values of pH in three light cheese Batches of the “Control Unit” samples on “Day 0” ranged from 5.69 to 6.30 and on “Day End” ranged from 6.21 to 6.58. The measured values of the aw of the “Control Unit” samples on “Day 0” in three light cheese Batches ranged from 0.68 to 0.80 and on “Day End” ranged from 0.65 to 0.78. The measured values of NaCl content (%), in the abovementioned cheeses, on “Day 0” ranged from 0.73 to 1.21 and on “Day End” ranged from 0.78 to 1.20.
The %MAP O2 values on “Day 0” in three Batches of light sliced cheeses ranged from 0.10% to 2.0%. By “Day End”, the %O2 values in Batches 1 and 2 were zeroed, while in Batch 3, we had an average value of 0.40%. The %MAP CO2 on “Day 0” had values ranging from 21.70% to 25.80%, while on “Day End”, they increased, and the values ranged from 29.40% to 36.70% (Table 4).

3.2.2. Physicochemical Analysis of “Control Units” in Three Batches of Greek Full-Fat Semi-Hard Sliced Cheese, Packed Under Modified Atmosphere (MAP)

The measured values of pH in three full-fat cheese Batches of the “Control Unit” samples on “Day 0” ranged from 5.62 to 6.14 and on “Day End” ranged from 5.91 to 6.87. The measured values of the aw of the “Control Unit” samples on “Day 0” in three full-fat Batches ranged from 0.70 to 0.78 and on “Day End” ranged from 0.71 to 0.81. The measured values of NaCl content (%), in the abovementioned cheeses, on “Day 0” ranged from 0.72 to 1.21 and on “Day End” ranged from 0.78 to 1.20.
The %MAP O2 values in three Batches of full-fat sliced cheeses from “Day 0” to “Day End” were almost similar to those of light cheeses. The %MAP O2 values on “Day 0” ranged from 0.30% to 1.50%. However, on “Day End”, there was again a general decrease, and the values did not exceed 0.70%. The %MAP CO2 on “Day 0” had values ranging from 18.60% to 20.70%, while on “Day End”, they increased, and the values ranged from 25.90% to 31.20% (Table 5).

3.3. Evaluation of Lm Growth in Light Semi-Hard Sliced Cheeses, Packed Under Modified Atmosphere (MAP)

On “Day 0”, which is the day of the inoculation of the cheeses with the Lm target inoculum (150 CFU/g), the measured Lm values in light cheese were as follows: in Batch 1, 1.2 × 10² CFU/g (2.08 log10 CFU/g); in Batch 2, 2.1 × 10² CFU/g (2.31 log10 CFU/g); and in Batch 3, 2.2 × 10² CFU/g (2.23 log10 CFU/g). Gradually, advancing towards the 24th day with a storage temperature of 5 °C (the storage conditions at the production and transportation levels), the measured Lm values decreased to the following values: in Batch 1, 8.5 × 10 CFU/g (1.93 log10 CFU/g); in Batch 2, 5.5 × 10 CFU/g (1.74 log10 CFU/g); and in Batch 3, “microorganisms are present but <4.0 × 10 CFU/g” (“microorganisms are present but <1.60 log10 CFU/g”). On the 59th day, with the storage temperature being at 7 °C (the storage conditions at the retail level), the measured Lm values were approximately at the same levels as the measurements on the 24th day, as follows: in Batch 1, 5.5 × 10 CFU/g (1.74 log10 CFU/g); in Batch 2, 5.5 × 10 CFU/g (1.74 log10 CFU/g); and in Batch 3, “microorganisms are present but <4.0 × 10 CFU/g” (“microorganisms are present <1.60 log10 CFU/g”). On the 108th day of measurement, with a storage temperature of 7 °C (the storage conditions at the retail level), the values of Lm did not decrease, but they remained at the same levels as the measurements on day 24 and day 59, and they were as follows: in Batch 1, 6.0 × 10 CFU/g (1.78 log10 CFU/g); in Batch 2, 6.0 × 10 CFU/g (1.78 log10 CFU/g); and in Batch 3, “microorganisms are present but <4.0 × 10 CFU/g” (“microorganisms are present but <1.60 log10 CFU/g”). On the 164th day of measurement, the Lm values decreased and were as follows: in Batch 1, the “estimated number” of microorganisms was 4.0 × 10 CFU/g (“estimated number” of microorganisms was 1.60 log10 CFU/g); in Batch 2, the “estimated number” of microorganisms was 4.0 × 10 CFU/g (“estimated number” of microorganisms was 1.60 log10 CFU/g); and in Batch 3, the measurement result was negative, and the level of Lm was <10 CFU/g (<1.00 log10 CFU/g). On the last day of measurement, the 181st day, which is also the expiration date of the cheese (end of shelf life, “Day End”), with a storage temperature of 10 °C (the storage conditions at the consumer level), the measurement results in all three Batches were as follows: “microorganisms are present but <4.0 × 10 CFU/g (“microorganisms are present but <1.60 log10 CFU/g”).
In conclusion, the Lm values in all three Batches of light semi-hard sliced cheese from “Day 0” to “Day End” decrease but do not reach zero, and Lm was present in all three Batches but less than <4.0 × 10 CFU/g (Table 6).

3.4. Evaluation of Lm Growth in Full-Fat Semi-Hard Sliced Cheeses, Packed Under Modified Atmosphere (MAP)

On “Day 0”, which is the day of the inoculation of the cheeses with the Lm target inoculum (150 CFU/g), the measured Lm values in full-fat cheese were as follows: in Batch 1, 1.6 × 10² CFU/g (2.20 log10 CFU/g); in Batch 2, 1.1 × 10² CFU/g (2.02 log10 CFU/g); and in Batch 3, 1.2 × 10² CFU/g (2.08 log10 CFU/g). Gradually, advancing towards the 24th day with a storage temperature of 5 °C (the storage conditions at the production and transportation levels), the measured Lm values decreased to the following values: for Batch 1 and Batch 2, the “estimated number” of microorganisms was 6.0 × 10 CFU/g (“estimated number” of microorganisms was 1.78 log10 CFU/g), while in Batch 3, the level of Lm was 7.5 × 10 CFU/g (1.88 log10 CFU/g). On the 59th day, with a storage temperature of 7 °C (the storage conditions at the retail level), the measured Lm values were at the same level as the measurements on the 24th day, and Lm in Batch 1 showed the following result: the “estimated number” of microorganisms was 6.0 × 10 CFU/g (“estimated number” of microorganisms was 1.78 log10 CFU/g). In Batch 2 and Batch 3, a minimal decrease in Lm values was observed compared to day 24, and the result for Batch 2 was that “microorganisms are present but <4.0 × 10 CFU/g” (“microorganisms are present but <1.60 log10 CFU/g”). For Batch 3, the result was that the “estimated number” of microorganisms was 4.0 × 10 CFU/g (“estimated number” of microorganisms was 1.60 log10 CFU/g). On the 108th day of measurement, with a storage temperature of 7 °C (the storage conditions at the retail level), a minimal increase in Lm was observed in all three Batches of full-fat semi-hard sliced cheeses. The results in Batch 1 and Batch 3 were as follows: the “estimated number” of microorganisms was 7.0 × 10 CFU/g (“estimated number” of microorganisms was 1.85 log10 CFU/g). The results in Batch 2 were the “estimated number” of microorganisms being 5.0 × 10 CFU/g (“estimated number” of microorganisms was 1.70 log10 CFU/g).
On the 164th day of measurement, the Lm values decreased, and in Batch 1, the measurement result was negative, and the level of Lm was <10 CFU/g (<1.00 log10 CFU/g). In Batch 2 and Batch 3, the results were as follows: microorganisms were present but <4.0 × 10 CFU/g (microorganisms were present but <1.60 log10 CFU/g).
On the last day of measurement, on the 181st day, which is also the expiration date of the cheese (end of shelf life, “Day End”), with a storage temperature of 10 °C (the storage conditions at the consumer level), the measurement results in Batches 1 and 3 were negative, and the level of Lm was <10 CFU/g (<1.00 log10 CFU/g). In Batch 2, the results were as follows: “microorganisms are present but <4.0 × 10 CFU/g” (“microorganisms are present but <1.60 log10 CFU/g”) (Table 7).
Due to the downward trend in Lm, the growth potential of Lm in both types of cheese we studied could not be calculated based on the “EURL Lm Technical Guidance Document on Challenge Tests and Durability Studies for assessing shelf life of Ready-to-Eat foods related to Lm”.

3.5. Microbiological Analysis

3.5.1. Microbiological Analysis of Background Microbial Flora of Light Semi-Hard Sliced Cheeses, Packed Under Modified Atmosphere (MAP)

The concentration of mesophilic aerobic count in the first two Batches of light cheese from “Day 0” to “Day End” increased slightly, while in the third Batch, there was a slight decrease. As for the lactic acid bacteria (Lab) concentration, a slight growth decrease was observed in all three Batches (Table 8).

3.5.2. Microbiological Analysis of Background Microbial Flora of Full-Fat Semi-Hard Sliced Cheeses, Packed Under Modified Atmosphere (MAP)

The concentration of mesophilic aerobic count in the first two Batches of full-fat cheese from “Day 0” to “Day End” decreased slightly, while in the third Batch, there was about a 1 log increase. As for the lactic acid bacteria (Lab) concentration, a slight growth decrease was observed in all three Batches (Table 9).

4. Discussion

The presence of Listeria monocytogenes in ready-to-eat (RTE) foods, particularly sliced cheese, poses a significant public health concern due to the organism’s ability to proliferate at refrigeration temperatures. While pasteurization effectively eliminates Lm from raw milk, post-pasteurization contamination remains a critical risk factor. This contamination can occur at various stages of processing, including slicing, packaging, and handling, thereby introducing the pathogen into the final product. The complex nature of sliced cheese production, involving increased handling and surface exposure, elevates the potential for environmental contamination and cross-contamination. As a ready-to-eat (RTE) food, cheese must meet the standards set by Regulation (EC) No 2073/2005. Under this regulation, food business operators are required to conduct studies assessing whether the relevant inoculated microorganism can proliferate or persist in the product when subjected to different reasonably expected storage conditions.

4.1. pH and Water Activity (Aw)

According to our study, the measured pH values of the Greek light and full-fat semi-hard sliced cheeses, packed under a modified atmosphere (MAP), in the “Food Control Samples” ranged from 5.68 to 6.23 in the three Batches of light cheeses and from 5.63 to 6.23 in the three Batches of full-fat cheeses. On the other hand, the measured aw values in the same samples in the three Batches of light cheeses ranged from 0.65 to 0.81, and in the three Batches of full-fat cheeses, they ranged from 0.69 to 0.82.
The measured pH values in the three Batches of the “Control Unit” samples of light cheeses on “Day 0” ranged from 5.69 to 6.30 and 6.21 to 6.58 on “Day End”. The pH values in the three Batches of the “Control Unit” samples of full-fat cheeses on “Day 0” ranged from 5.62 to 6.14 and 5.91 to 6.87 on “Day End”. The aw values in the same samples in the three Batches of light cheeses on “Day 0” ranged from 0.68 to 0.80 and 0.65 to 0.78 on “Day End” and in the three Batches of full-fat cheeses on “Day 0” ranged from 0.70 to 0.786 and 0.71 to 0.81 on “Day End”. The measured pH values in both the “Food Control Samples” and the “Control Unit” samples of both types of cheeses approach the most suitable values for Lm growth (pH ≈ 7.0). In the “Control Unit” samples, the measured pH values in both cheese types from “Day 0” to “Day End” had a minimal increase. The aw values in the same samples from “Day 0” to “Day End” remained at the same levels. In total, while the pH values approach the optimum value for Lm growth, the aw values do not support the growth of Lm but are suitable for its survival.

4.2. Modified Atmosphere Package

The composition of %MAP gases in the “Food Control Samples” on “Day 0” for the three Batches of light sliced cheeses showed O2 values ranging from 0.10% to 3.50%, while CO2 values ranged from 19.40% to 25.80%. The corresponding values on “Day End” for O2 ranged from 0.20% to 0.50% and for CO2 from 25.90% to 34.10%.
Similarly, in the three Batches of full-fat sliced cheeses, the %MAP gas composition on “Day 0” showed O2 values ranging from 0.50% to 1.60%, while CO2 values ranged from 18.50% to 25.50%. On “Day End”, the O2 values ranged from 0.10% to 0.60%, and CO2 values ranged from 27.90% to 33.30%.
These results indicate that the %MAP gas composition in the “Food Control Samples” was similar for both types of cheeses. From “Day 0” to “Day End”, O2 levels decreased slightly and remained very low, with a maximum recorded value of 0.60%. In contrast, CO2 levels increased, reaching a maximum value of 34.10%. These findings suggest that the gas composition was suitable for protecting and preserving the product for six months (up to the expiration date) and that no gas leakage occurred by “Day End”.
Furthermore, no differences were observed in the %MAP gas composition between the light and full-fat sliced cheeses, indicating that the fat content had no influence on gas composition stability.
The composition of %MAP gases in the “Control Unit” samples on “Day 0” for the three Batches of light sliced cheeses showed O2 values ranging from 0.10% to 2.00%, while CO2 values ranged from 21.70% to 25.80%. The corresponding values on “Day End” for O2 ranged from 0.00% to 0.80% and for CO2 from 29.40% to 36.70%.
Similarly, in the three Batches of full-fat sliced cheeses, the %MAP gas composition in the “Control Unit” samples on “Day 0” showed O2 values ranging from 0.30% to 1.50%, while CO2 values ranged from 18.40% to 20.70%. On “Day End”, the O2 values ranged from 0.10% to 0.70%, and CO2 values ranged from 25.90% to 31.20%.
We observed that the %MAP gas composition in the “Control Unit” samples for both types of cheese was similar to that of the “Food Control Samples”. This indicates that the inoculation process of the “Control Unit” samples using physiological water via a double septum was performed correctly, with no gas leakage.
From “Day 0” to “Day End”, O2 levels in the “Control Unit” samples decreased slightly, with a maximum recorded value of 0.60%, while CO2 levels increased, reaching a peak of 36.70%. Furthermore, as with the “Food Control Samples”, no differences were observed in the %MAP gas composition between light and full-fat sliced cheeses, confirming that fat content had no impact on gas stability.
The most important gas in modified atmosphere packaging (MAP) is carbon dioxide (CO2) due to its strong antimicrobial properties, which can inhibit the growth of many bacteria. CO2 significantly lowers the pH of food through the dissociation of carbonic acid. In our study, however, no pH reduction was observed in the “Control Unit” samples of either type of cheese. On the contrary, a slight increase in pH values was recorded from “Day 0” to “Day End”.
Additionally, the NaCl content (%) levels in both types of cheese were found to be close to the optimal range for the growth of Lm.

4.3. Mesophilic Aerobic Count and Lactic Acid Bacteria

Regarding the background-harbored microflora in the microbiological analysis, the concentration of mesophilic aerobic count in the “Food Control Samples” across three Batches of light cheeses on “Day 0” ranged from 5.0 × 10⁷ CFU/g to 1.6 × 10⁸ CFU/g, while in full-fat cheeses, it ranged from 2.0 × 10⁷ CFU/g to 8.8 × 10⁷ CFU/g. The concentration of lactic acid bacteria (Lab) in the “Food Control Samples” across three Batches of light cheeses on “Day 0” ranged from 2.2 × 10⁷ CFU/g to 9.3 × 10⁷ CFU/g, whereas in full-fat cheeses, it ranged from 3.0 × 10⁶ CFU/g to 1.3 × 10⁷ CFU/g. We observed that, starting from “Day 0”, the levels of background-harbored microflora were relatively high in both types of cheese. Similarly, in the “Control Unit” samples, the mesophilic aerobic count in the three Batches of light cheeses on “Day 0” ranged from 2.2 × 10⁷ CFU/g to 1.3 × 10⁸ CFU/g, while in the three Batches of full-fat cheeses, it ranged from 8.1 × 10⁶ CFU/g to 4.6 × 10⁷ CFU/g. The concentration of mesophilic aerobic count in the “Control Unit” samples across three Batches of light cheeses on “Day End” ranged from 5.9 × 10⁷ CFU/g to 7.6 × 10⁷ CFU/g, while in the three Batches of full-fat cheeses, it ranged from 8.2 × 10⁶ CFU/g to 7.1 × 10⁷ CFU/g. We observed that in the “Control Unit” samples from “Day 0” to “Day End”, the mesophilic aerobic count in the first two Batches of light cheese showed a slight increase, whereas in the third Batch, there was a slight decrease.
In the case of full-fat cheese, the mesophilic aerobic count in the first two Batches slightly decreased from “Day 0” to “Day End”, while in the third Batch, there was an increase of approximately 1 log10. The concentration of lactic acid bacteria (Lab) in the “Control Unit” samples across three Batches of light cheeses on “Day 0” ranged from 1.4 × 10⁷ CFU/g to 7.3 × 10⁷ CFU/g, while in full-fat cheeses, it ranged from 1.4 × 10⁶ CFU/g to 2.6 × 10⁷ CFU/g. On “Day End”, the concentration of lactic acid bacteria (Lab.) in the “Control Unit” samples of light cheeses ranged from 1.1 × 10⁷ CFU/g to 4.5 × 10⁷ CFU/g, whereas in full-fat cheeses, it ranged from 1.0 × 10⁶ CFU/g to 1.2 × 10⁶ CFU/g. Regarding the lactic acid bacteria (Lab) concentration in the “Control Unit” samples from “Day 0” to “Day End”, a slight decline in growth was observed across all three Batches of both light and full-fat cheeses. We expected a significant increase in their values from “Day 0” to “Day End”. However, the levels of the background microbial flora in light and full-fat semi-hard sliced cheeses, packaged under a modified atmosphere (MAP), remained almost unchanged.
The natural acidification that occurred due to the high concentration of “background” microbial flora during the storage of the cheeses we studied did not cause any significant difference in pH values from “Day 0” to “Day End”, as they remained nearly at the same levels.

4.4. Listeria monocytogenes Behavior

The survival kinetics of Listeria monocytogenes (Lm) from the initial inoculation (150 CFU/g) on “Day 0” to the designated “Day End” (Day 181) were evaluated in light and full-fat semi-hard sliced cheeses packaged under modified atmosphere packaging (MAP). Across all six Batches, a gradual decline in Lm populations was observed, reaching significantly reduced levels by this study’s endpoint.
In light cheeses, the Lm population decreased to a quantifiable presence below 4.0 × 101 CFU/g in all three Batches but did not achieve complete elimination. Similarly, in full-fat cheeses on “Day 181”, Lm counts were below 10 CFU/g in Batches 1 and 3. Batch 2 of the full-fat cheese exhibited Lm levels below 4.0 × 101 CFU/g, again without reaching 0.
A comparative analysis of Lm behavior across the three Batches of light and the three Batches of full-fat semi-hard sliced cheese under MAP indicated that, within the parameters of this study, the fat content of the cheese matrix did not exert a significant influence on the reduction in Lm populations, as similar trends were observed in both cheese types.
Under the specific MAP conditions employed, Lm, as an aerobic and facultatively anaerobic microorganism, demonstrated a substantial reduction to very low levels in both cheese categories. However, complete eradication was not achieved, signifying its survival under these conditions.
Based on these findings, Greek light and full-fat semi-hard sliced cheeses, packaged under MAP with a 6-month shelf life and stored under the conditions applied in this investigation, meet the criteria for “Ready-to-Eat Food unable to support the growth of Lm” and are classified under food safety category 1.3 of (EC) Regulation 2073/2005. Nevertheless, the persistent presence of Lm, albeit at low levels, at the end of the shelf life necessitates caution. Deviations from recommended storage conditions or compromised MAP integrity leading to an altered gaseous environment could potentially facilitate Lm proliferation. The synergistic effects of reduced oxygen, elevated carbon dioxide and nitrogen concentrations, and refrigeration are known to extend the shelf life of food products while preserving quality and inhibiting spoilage.
Considering the inherent complexities of sliced cheese production, encompassing multiple handling stages and MAP, post-pasteurization contamination with Listeria monocytogenes remains a relevant concern. An initial contamination level of 150 CFU/g, while seemingly low, represents a plausible scenario given potential environmental exposure during the slicing and packaging processes. Despite the utilization of pasteurized milk and the inhibitory effects of MAP coupled with appropriate storage, the observed survival of Listeria monocytogenes, even at minimal concentrations, at the conclusion of the product’s shelf life underscores the organism’s resilience and the critical importance of rigorous hygiene protocols throughout the entire food processing chain.
Although this study did not apply predictive microbial growth models, such tools, like those provided by ComBase, could be employed in future studies to simulate how varying NaCl concentrations in the aqueous phase influence the growth kinetics of relevant spoilage or pathogenic microorganisms. This approach would enhance risk assessment and shelf life predictions in high-fat cheeses such as feta.

5. Conclusions

This study investigated the behavior of Listeria monocytogenes (Lm) in Greek light and full-fat semi-hard sliced cheeses packaged under a modified atmosphere (MAP). Given that slicing and MAP represent critical post-production handling points with a potential risk of Lm contamination, we evaluated the efficacy of the MAP environment in controlling Lm growth throughout the six-month shelf life at realistic storage temperatures. Our analysis of the MAP gas composition (O2 and CO2) confirmed conditions unsuitable for Lm proliferation. Furthermore, fat content did not significantly influence Lm behavior. While Lm levels decreased from Day 0 to the shelf life end, it was not entirely eliminated. Although these cheeses fall under Regulation 2073/2005 category 1.3 (foods not supporting Lm growth), even low levels without subsequent growth can pose a risk to vulnerable populations, as indicated by epidemiological evidence [28]. While a threshold of <100 CFU/g at consumption is generally considered safe [64], the precise infectious dose remains unclear [3,65]. Challenge testing, the most reliable method for assessing Lm behavior in ready-to-eat (RTE) foods and determining shelf life, is crucial for food business operators (FBOs) to ensure products do not exceed legal limits throughout their shelf life. Such testing validates preservation techniques, assesses the impact of formulation and processing variations, and is often mandated by regulatory bodies. Strict adherence to food safety protocols, including temperature control, hygiene, and cross-contamination prevention, is paramount for FBOs to protect public health and their brand. The findings of this research aim to enhance the understanding of Lm behavior in MAP products for producers, traders, consumers, and researchers, ultimately contributing to improved food safety practices.

Author Contributions

Conceptualization, G.D.M.; methodology, N.V., T.T. and G.D.M.; software, N.V.; validation, N.V. and G.D.M.; formal analysis, N.V. and G.D.M.; investigation, N.V. and T.T.; resources, N.V. and G.D.M.; data curation, N.V., T.T. and G.D.M.; writing—original draft preparation, N.V. and G.D.M.; writing—review and editing, N.V. and G.D.M.; visualization, N.V., G.D.M. and T.T.; supervision, G.D.M.; project administration, G.D.M.; funding acquisition, N.V., G.D.M. and T.T. All authors have read and agreed to the published version of the manuscript.

Funding

This research received no external funding.

Institutional Review Board Statement

Not applicable.

Informed Consent Statement

Not applicable.

Data Availability Statement

Data are contained within this article.

Conflicts of Interest

The authors declare no conflicts of interest.

References

  1. European Food Safety Authority (EFSA); European Centre for Disease Prevention and Control (ECDC). The European Union One Health 2023 Zoonoses Report. EFSA J. 2024, 22, e9106. [Google Scholar] [CrossRef]
  2. World Organisation for Animal Health. Available online: https://www.woah.org/en/what-we-do/standards/codes-and-manuals/ (accessed on 5 April 2025).
  3. Food Standards Agency; Pearson, K.; Chobanova, S.; Kintz, E.; Food Standards Scotland. The Risk to Vulnerable Consumers from Listeria monocytogenes in Ready to Eat Smoked Fish; Food Standards Scotland: Aberdeen, UK, 2023.
  4. Wadhwa Desai, R.; Smith, M.A. Pregnancy-Related Listeriosis. Birth Defects Res. 2017, 109, 324–335. [Google Scholar] [CrossRef] [PubMed]
  5. Quereda, J.J.; Morón-García, A.; Palacios-Gorba, C.; Dessaux, C.; García-del Portillo, F.; Pucciarelli, M.G.; Ortega, A.D. Pathogenicity and Virulence of Listeria monocytogenes: A Trip from Environmental to Medical Microbiology. Virulence 2021, 12, 2509–2545. [Google Scholar] [CrossRef] [PubMed]
  6. Doganay, M. Listeriosis: Clinical Presentation. FEMS Immunol. Med. Microbiol. 2003, 35, 173–175. [Google Scholar] [CrossRef]
  7. Koopmans, M.M.; Brouwer, M.C.; Vázquez-Boland, J.A.; van de Beek, D. Human Listeriosis. Clin. Microbiol. Rev. 2022, 36, e00060-19. [Google Scholar] [CrossRef]
  8. Shahamat, M.; Seaman, A.; Woodbine, M. Survival of Listeria monocytogenes in High Salt Concentrations. Zentralblatt Für Bakteriol. 1 Abt Orig. Med. Mikrobiol. Infekt. Parasitol. 1980, 246, 506–511. [Google Scholar] [CrossRef]
  9. Li, X.; Hospital, X.F.; Hierro, E.; Fernández, M.; Sheng, L.; Wang, L. Formation of Listeria monocytogenes Persister Cells in the Produce-Processing Environment. Int. J. Food Microbiol. 2023, 390, 110106. [Google Scholar] [CrossRef]
  10. Bucur, F.I.; Grigore-Gurgu, L.; Crauwels, P.; Riedel, C.U.; Nicolau, A.I. Resistance of Listeria monocytogenes to Stress Conditions Encountered in Food and Food Processing Environments. Front. Microbiol. 2018, 9, 2700. [Google Scholar] [CrossRef]
  11. Zhang, Q.; Feng, Y.; Deng, L.; Feng, F.; Wang, L.; Zhou, Q.; Luo, Q. SigB Plays a Major Role in Listeria monocytogenes Tolerance to Bile Stress. Int. J. Food Microbiol. 2011, 145, 238–243. [Google Scholar] [CrossRef]
  12. Møretrø, T.; Langsrud, S. Listeria monocytogenes: Biofilm Formation and Persistence in Food-Processing Environments. Biofilms 2004, 1, 107–121. [Google Scholar] [CrossRef]
  13. Ramires, T.; Kleinubing, N.R.; Iglesias, M.A.; Vitola, H.R.S.; Núncio, A.S.P.; Kroning, I.S.; Moreira, G.M.S.G.; Fiorentini, Â.M.; da Silva, W.P. Genetic Diversity, Biofilm and Virulence Characteristics of Listeria monocytogenes in Salmon Sushi. Food Res. Int. 2021, 140, 109871. [Google Scholar] [CrossRef] [PubMed]
  14. Buchanan, R.L.; Gorris, L.G.M.; Hayman, M.M.; Jackson, T.C.; Whiting, R.C. A Review of Listeria monocytogenes: An Update on Outbreaks, Virulence, Dose-Response, Ecology, and Risk Assessments. Food Control 2017, 75, 1–13. [Google Scholar] [CrossRef]
  15. Lado, B.H.; Yousef, A.E. Characteristics of Listeria monocytogenes Important to Food Processors. In Listeria, Listeriosis, and Food Safety; CRC Press: Boca Raton, FL, USA, 2007; ISBN 978-0-429-11537-0. [Google Scholar]
  16. Schjørring, S.; Gillesberg Lassen, S.; Jensen, T.; Moura, A.; Kjeldgaard, J.S.; Müller, L.; Thielke, S.; Leclercq, A.; Maury, M.M.; Tourdjman, M.; et al. Cross-Border Outbreak of Listeriosis Caused by Cold-Smoked Salmon, Revealed by Integrated Surveillance and Whole Genome Sequencing (WGS), Denmark and France, 2015 to 2017. Eurosurveillance 2017, 22, 17-00762. [Google Scholar] [CrossRef]
  17. Chlebicz, A.; Śliżewska, K. Campylobacteriosis, Salmonellosis, Yersiniosis, and Listeriosis as Zoonotic Foodborne Diseases: A Review. Int. J. Environ. Res. Public Health 2018, 15, 863. [Google Scholar] [CrossRef]
  18. Magalhaes, R.; Almeida, G.; Ferreira, V.; Santos, I.; Silva, J.; Mendes, M.M.; Pita, J.; Mariano, G.; Mancio, I.; Sousa, M.M.; et al. Cheese-Related Listeriosis Outbreak, Portugal, March 2009 to February 2012. Eurosurveillance 2015, 20, 21104. [Google Scholar] [CrossRef]
  19. Amato, E.; Filipello, V.; Gori, M.; Lomonaco, S.; Losio, M.N.; Parisi, A.; Huedo, P.; Knabel, S.J.; Pontello, M. Identification of a Major Listeria monocytogenes Outbreak Clone Linked to Soft Cheese in Northern Italy—2009–2011. BMC Infect. Dis. 2017, 17, 342. [Google Scholar] [CrossRef]
  20. Palacios, A.; Otto, M.; Flaherty, E.; Boyle, M.M.; Malec, L.; Holloman, K.; Low, M.; Wellman, A.; Newhart, C.; Gollarza, L.; et al. Multistate Outbreak of Listeria monocytogenes Infections Linked to Fresh, Soft Hispanic-Style Cheese—United States, 2021. Morb. Mortal. Wkly. Rep. 2022, 71, 709–712. [Google Scholar] [CrossRef]
  21. Heiman, K.E.; Garalde, V.B.; Gronostaj, M.; Jackson, K.A.; Beam, S.; Joseph, L.; Saupe, A.; Ricotta, E.; Waechter, H.; Wellman, A. Multistate Outbreak of Listeriosis Caused by Imported Cheese and Evidence of Cross-Contamination of Other Cheeses, USA, 2012. Epidemiol. Infect. 2016, 144, 2698–2708. [Google Scholar] [CrossRef]
  22. Lachmann, R.; Halbedel, S.; Lüth, S.; Holzer, A.; Adler, M.; Pietzka, A.; Al Dahouk, S.; Stark, K.; Flieger, A.; Kleta, S.; et al. Invasive Listeriosis Outbreaks and Salmon Products: A Genomic, Epidemiological Study. Emerg. Microbes Infect. 2022, 11, 1308–1315. [Google Scholar] [CrossRef]
  23. Halbedel, S.; Sperle, I.; Lachmann, R.; Kleta, S.; Fischer, M.A.; Wamp, S.; Holzer, A.; Lüth, S.; Murr, L.; Freitag, C.; et al. Large Multicountry Outbreak of Invasive Listeriosis by a Listeria monocytogenes ST394 Clone Linked to Smoked Rainbow Trout, 2020 to 2021. Microbiol. Spectr. 2023, 11, e0352022. [Google Scholar] [CrossRef]
  24. European Food Safety Authority. Prolonged Multi-Country Outbreak of Listeria monocytogenes ST173 Linked to Consumption of Fish Products. EFSA Support. Publ. 2024, 21, 8885E. [Google Scholar] [CrossRef]
  25. Chen, Y.I.; Burall, L.S.; Macarisin, D.; Pouillot, R.; Strain, E.; DE Jesus, A.J.; Laasri, A.; Wang, H.; Ali, L.; Tatavarthy, A.; et al. Prevalence and Level of Listeria monocytogenes in Ice Cream Linked to a Listeriosis Outbreak in the United States. J. Food Prot. 2016, 79, 1828–1832. [Google Scholar] [CrossRef] [PubMed]
  26. McCollum, J.T.; Cronquist, A.B.; Silk, B.J.; Jackson, K.A.; O’Connor, K.A.; Cosgrove, S.; Gossack, J.P.; Parachini, S.S.; Jain, N.S.; Ettestad, P.; et al. Multistate Outbreak of Listeriosis Associated with Cantaloupe. N. Engl. J. Med. 2013, 369, 944–953. [Google Scholar] [CrossRef]
  27. McLauchlin, J.; Aird, H.; Amar, C.; Barker, C.; Dallman, T.; Lai, S.; Painset, A.; Willis, C. An Outbreak of Human Listeriosis Associated with Frozen Sweet Corn Consumption: Investigations in the UK. Int. J. Food Microbiol. 2021, 338, 108994. [Google Scholar] [CrossRef]
  28. Ward, S.; Bedale, W.; Glass, K.A. Listeria monocytogenes Outbreaks Related to Commercially Produced Caramel Apples: Developments in Sanitation, Product Formulation, and Packaging: A Review. J. Food Prot. 2022, 85, 1287–1299. [Google Scholar] [CrossRef]
  29. Self, J.L.; Conrad, A.; Stroika, S.; Jackson, A.; Whitlock, L.; Jackson, K.A.; Beal, J.; Wellman, A.; Fatica, M.K.; Bidol, S.; et al. Multistate Outbreak of Listeriosis Associated with Packaged Leafy Green Salads, United States and Canada, 2015–2016. Emerg. Infect. Dis. 2019, 25, 1461–1468. [Google Scholar] [CrossRef]
  30. Cabal, A.; Allerberger, F.; Huhulescu, S.; Kornschober, C.; Springer, B.; Schlagenhaufen, C.; Wassermann-Neuhold, M.; Fötschl, H.; Pless, P.; Krause, R.; et al. Listeriosis Outbreak Likely Due to Contaminated Liver Pâté Consumed in a Tavern, Austria, December 2018. Eurosurveillance 2019, 24, 1900274. [Google Scholar] [CrossRef]
  31. Kvistholm Jensen, A.; Nielsen, E.M.; Björkman, J.T.; Jensen, T.; Müller, L.; Persson, S.; Bjerager, G.; Perge, A.; Krause, T.G.; Kiil, K.; et al. Whole-Genome Sequencing Used to Investigate a Nationwide Outbreak of Listeriosis Caused by Ready-to-Eat Delicatessen Meat, Denmark, 2014. Clin. Infect. Dis. Off. Publ. Infect. Dis. Soc. Am. 2016, 63, 64–70. [Google Scholar] [CrossRef]
  32. Centers for Disease Control and Prevention (CDC). Outbreak of Listeriosis—Northeastern United States, 2002. Morb. Mortal. Wkly. Rep. 2002, 51, 950–951. [Google Scholar]
  33. Halbedel, S.; Wilking, H.; Holzer, A.; Kleta, S.; Fischer, M.A.; Lüth, S.; Pietzka, A.; Huhulescu, S.; Lachmann, R.; Krings, A.; et al. Large Nationwide Outbreak of Invasive Listeriosis Associated with Blood Sausage, Germany, 2018–2019. Emerg. Infect. Dis. 2020, 26, 1456–1464. [Google Scholar] [CrossRef]
  34. Thomas, J.; Govender, N.; McCarthy, K.M.; Erasmus, L.K.; Doyle, T.J.; Allam, M.; Ismail, A.; Ramalwa, N.; Sekwadi, P.; Ntshoe, G.; et al. Outbreak of Listeriosis in South Africa Associated with Processed Meat. N. Engl. J. Med. 2020, 382, 632–643. [Google Scholar] [CrossRef] [PubMed]
  35. Belias, A.; Sullivan, G.; Wiedmann, M.; Ivanek, R. Factors That Contribute to Persistent Listeria in Food Processing Facilities and Relevant Interventions: A Rapid Review. Food Control 2022, 133, 108579. [Google Scholar] [CrossRef]
  36. Gonzales-Barron, U.; Cadavez, V.; Guillier, L.; Sanaa, M. A Critical Review of Risk Assessment Models for Listeria monocytogenes in Dairy Products. Foods 2023, 12, 4436. [Google Scholar] [CrossRef]
  37. Farber, J.M.; Daley, E. Fate of Listeria monocytogenes on Modified-Atmosphere Packaged Turkey Roll Slices. J. Food Prot. 1994, 57, 1098–1100. [Google Scholar] [CrossRef]
  38. Culliney, P.; Schmalenberger, A. Growth Potential of Listeria monocytogenes on Refrigerated Spinach and Rocket Leaves in Modified Atmosphere Packaging. Foods 2020, 9, 1211. [Google Scholar] [CrossRef]
  39. Whitley, E.; Muir, D.; Waites, W.M. The Growth of Listeria monocytogenes in Cheese Packed under a Modified Atmosphere. J. Appl. Microbiol. 2001, 88, 52–57. [Google Scholar] [CrossRef]
  40. Parry, R.T. Principles and Applications of Modified Atmosphere Packaging of Foods; Springer Science & Business Media: Berlin, Germany, 2012; ISBN 978-1-4615-2137-2. [Google Scholar]
  41. Brown, S.R.; Forauer, E.C.; D’Amico, D.J. Effect of Modified Atmosphere Packaging on the Growth of Spoilage Microorganisms and Listeria monocytogenes on Fresh Cheese. J. Dairy Sci. 2018, 101, 7768–7779. [Google Scholar] [CrossRef]
  42. Barmpalia-Davis, I.M.; Geornaras, I.; Kendall, P.A.; Sofos, J.N. Effect of Fat Content on Survival of Listeria monocytogenes during Simulated Digestion of Inoculated Beef Frankfurters Stored at 7 °C. Food Microbiol. 2009, 26, 483–490. [Google Scholar] [CrossRef]
  43. Roig-Sagués, A.X.; Velázquez, R.M.; Montealegre-Agramont, P.; López-Pedemonte, T.J.; Briñez-Zambrano, W.J.; Guamis-López, B.; Hernandez-Herrero, M.M. Fat Content Increases the Lethality of Ultra-High-Pressure Homogenization on Listeria monocytogenes in Milk. J. Dairy Sci. 2009, 92, 5396–5402. [Google Scholar] [CrossRef]
  44. Wang, L.L.; Johnson, E.A. Inhibition of Listeria monocytogenes by Fatty Acids and Monoglycerides. Appl. Environ. Microbiol. 1992, 58, 624–629. [Google Scholar] [CrossRef]
  45. Bover-Cid, S.; Belletti, N.; Aymerich, T.; Garriga, M. Modeling the Protective Effect of Aw and Fat Content on the High Pressure Resistance of Listeria monocytogenes in Dry-Cured Ham. Food Res. Int. 2015, 75, 194–199. [Google Scholar] [CrossRef] [PubMed]
  46. Epidemiological Data for Listeriosis in Greece 2004–2023. Available online: https://eody.gov.gr/wp-content/uploads/2024/03/epidemiological-data-for-listeriosis-greece-2004-2023.pdf (accessed on 17 March 2025).
  47. Available online: https://eody.gov.gr/enimerotiko-deltio-eody-ioynios-2024/ (accessed on 1 July 2024).
  48. Commission Regulation (EC) No 2073/2005 of 15 November 2005 on Microbiological Criteria for Foodstuffs. Available online: https://eur-lex.europa.eu/eli/reg/2005/2073/oj/eng (accessed on 17 March 2025).
  49. Álvarez-Ordóñez, A.; Leong, D.; Hickey, B.; Beaufort, A.; Jordan, K. The Challenge of Challenge Testing to Monitor Listeria monocytogenes Growth on Ready-to-Eat Foods in Europe by Following the European Commission (2014) Technical Guidance Document. Food Res. Int. 2015, 75, 233–243. [Google Scholar] [CrossRef] [PubMed]
  50. Lanni, L.; Morena, V.; Scattareggia Marchese, A.; Destro, G.; Ferioli, M.; Catellani, P.; Giaccone, V. Challenge Test as Special Tool to Estimate the Dynamic of Listeria monocytogenes and Other Foodborne Pathogens. Foods 2021, 11, 32. [Google Scholar] [CrossRef]
  51. Gérard, A.; El-Hajjaji, S.; Van Coillie, E.; Bentaïb, A.; Daube, G.; Sindic, M. Determination of the Growth Potential of Listeria monocytogenes in Various Types of Belgian Artisanal Cheeses by Challenge Tests. Food Microbiol. 2020, 92, 103582. [Google Scholar] [CrossRef]
  52. Collu, D.; Marras, L.; Sanna, A.; Carrucciu, G.; Pinna, A.; Carraro, V.; Sanna, G.; Coroneo, V. Evaluation of Growth Potential and Growth Dynamics of Listeria monocytogenes on Ready-to-Eat Fresh Fruit. Ital. J. Food Saf. 2021, 10, 9337. [Google Scholar] [CrossRef]
  53. Vasileiadi, N.; Lappa, A.; Koukouvinos, C.; Tsironi, T.; Mandilara, G. Challenge Test for Assessing the Growth Potential of Listeria monocytogenes in Greek Soft Cheese (Anthotyros). Appl. Sci. 2022, 12, 12349. [Google Scholar] [CrossRef]
  54. Vasileiadi, N.; Tsironi, T.; Mandilara, G.D. Assessing Listeria monocytogenes Growth in Artificially Inoculated Sea-Farmed Product—Raw Sea Bass (Dicentrarchus labrax) Fillet, Produced in Greece. Microorganisms 2024, 12, 1970. [Google Scholar] [CrossRef]
  55. EURL Lm TECHNICAL GUIDANCE DOCUMENT on Challenge Tests and Durability Studies for Assessing Shelf-Life of Ready-to-Eat Foods Related to Listeria monocytogenes; Version 4. Available online: https://food.ec.europa.eu/system/files/2021-07/biosafety_fh_mc_tech-guide-doc_listeria-in-rte-foods_en_0.pdf (accessed on 1 July 2021).
  56. ISO 20976-1:2019; Microbiology of the Food Chain—Requirements and Guidelines for Conducting Challenge Tests of Food and Feed Products—Part 1: Challenge Tests to Study Growth Potential, Lag Time and Maximum Growth Rate. International Organization for Standardization: Geneva, Switzerland, 2019.
  57. Bonanno, L.; Bergis, H.; Bonanno, L.; Bergis, H. Temperatures of the Food Cold Chain at Consumer Level in Europe; Version 2; Unit Salmonella & Listeria, Anses, Laboratory for Food Safety, EURL Lm: Maisons-Alfort, France, 2021. [Google Scholar]
  58. Bonanno, L.; Bergis, H.; Gnanou-Besse, N.; Asséré, A.; Danan, C. Which Domestic Refrigerator Temperatures in Europe—Focus on Shelf-Life Studies Regarding Listeria monocytogenes (Lm) in Ready-to-Eat (RTE) Foods. Food Microbiol. 2024, 123, 104595. [Google Scholar] [CrossRef]
  59. ISO 11290-2; Microbiology of the Food Chain—Horizontal Method for the Detection and Enumeration of Listeria monocytogenes and of Listeria spp.—Part 2: Enumeration Method. ISO: Geneva, Switzerland, 2017. Available online: https://www.iso.org/standard/60314.html (accessed on 17 March 2025).
  60. ISO 11290-1; Microbiology of the Food Chain—Horizontal Method for the Detection and Enumeration of Listeria monocytogenes and of Listeria spp.—Part 1: Detection Method. ISO: Geneva, Switzerland, 2017. Available online: https://www.iso.org/standard/60313.html (accessed on 17 March 2025).
  61. ISO 4833-1:2013; Part 1: Colony Count at 30 °C by the Pour Plate Technique. ISO: Geneva, Switzerland, 2013. Available online: https://www.iso.org/standard/53728.html (accessed on 17 March 2025).
  62. ISO 15214; Horizontal Method for the Enumeration of Mesophilic Lactic Acid Bacteria—Colony Count Technique at 30 °C. ISO: Geneva, Switzerland, 1998. Available online: https://www.iso.org/standard/26853.html (accessed on 6 April 2025).
  63. Association of Official Analytical Chemists. Official Methods of Analysis, 15th ed.; Association of Official Analytical Chemists: Washington, DC, USA, 1990. [Google Scholar]
  64. Pouillot, R.; Klontz, K.C.; Chen, Y.; Burall, L.S.; Macarisin, D.; Doyle, M.; Bally, K.M.; Strain, E.; Datta, A.R.; Hammack, T.S.; et al. Infectious Dose of Listeria monocytogenes in Outbreak Linked to Ice Cream, United States, 2015. Emerg. Infect. Dis. 2016, 22, 2113–2119. [Google Scholar] [CrossRef]
  65. Farber, J.M.; Zwietering, M.; Wiedmann, M.; Schaffner, D.; Hedberg, C.W.; Harrison, M.A.; Hartnett, E.; Chapman, B.; Donnelly, C.W.; Goodburn, K.E.; et al. Alternative Approaches to the Risk Management of Listeria monocytogenes in Low Risk Foods. Food Control 2021, 123, 107601. [Google Scholar] [CrossRef]
Figure 1. The cheese samples when delivered were packaged under MAP conditions. The net weight of each package was 200 g (a). Inoculation was performed on each studied sample using sterile syringes through the double septum (b).
Applsci 15 06109 g001
Table 1. The protocol and the number of units that were analyzed per Batch * for the determination of Lm growth in Greek light and full-fat semi-hard sliced cheeses, packed under a modified atmosphere (MAP).
Type of UnitsType of AnalysisNumber of Units and Day of Analysis per Batch *
Test UnitsEnumeration of Lm83 Test Units on “Day 0”, 1 Test Unit on each of 4 intermediate dates, and 1 Test Unit on “Day End”
Food Control SamplesDetection of Lm55 on “Day 0”
Measurement of physicochemical characteristics
Enumeration of the associated microflora
MAP measurement
MAP measurement22 on “Day End”
Control UnitsMeasurement of physicochemical characteristics42 on “Day 0” and 2 on “Day End”
Enumeration of the associated microflora
MAP measurement
Temperature control1Throughout the test
Total number of units per Batch20
Total number of all examined samples of the 3 Batches of sliced light cheese and the 3 Batches of sliced full-fat cheese60 + 60 = 120
* Three Batches of sliced light cheese and three Batches of sliced full-fat cheese.
Table 2. The physicochemical characteristics (measurements) and % MAP measurements of the five “Food Control Samples” on “Day 0” and % MAP measurements of the two “Food Control Samples” on “Day End”, from each of the three Batches of light semi-hard sliced cheese.
Batch 1 Food Control SamplesBatch 2 Food Control SamplesBatch 3 Food Control Samples
Day 0pHaw%NaCl%Fat%MAP O2%MAP CO2pHaw%NaCl%Fat%MAP O2%MAP CO2pHaw%NaCl%Fat%MAP O2%MAP CO2
6.230.741.0217.401.0022.306.020.731.2017.300.1022.905.750.720.7816.700.2023.60
5.940.790.8816.001.4022.705.950.651.0017.602.8023.505.680.800.8816.300.3025.60
6.040.68--2.3021.205.860.69--3.5019.605.920.76--0.1019.70
6.150.77--2.1023.405.870.74--0.4025.805.900.81--0.4024.40
6.070.81--2.9019.405.900.66--3.2022.406.200.76--0.3022.50
Average6.090.760.9516.701.9421.805.920.691.1017.452.0022.845.890.770.8316.500.2623.16
±SD0.110.050.100.990.751.560.070.040.140.211.622.230.200.040.070.280.112.24
Batch 1 Food Control SamplesBatch 2 Food Control SamplesBatch 3 Food Control Samples
Day End %MAP O2%MAP CO2 %MAP O2%MAP CO2 %MAP O2%MAP CO2
0.3032.40 0.5025.90 0.2034.10
0.4028.70 0.2030.60 0.4027.30
Average 0.3530.55 0.3528.25 0.3030.70
±SD 0.072.62 0.213.32 0.144.81
Table 3. The physicochemical characteristics (measurements) and % MAP measurements of the five “Food Control Samples” on “Day 0” and % MAP measurements of the two “Food Control Samples” on “Day End”, from each of the three Batches of full-fat semi-hard sliced cheese.
Batch 1 Food Control SamplesBatch 2 Food Control SamplesBatch 3 Food Control Samples
Day 0pHaw%NaCl%Fat%MAP O2%MAP CO2pHaw%NaCl%Fat%MAP O2%MAP CO2pHaw%NaCl%Fat%MAP O2%MAP CO2
5.630.7300.9327.201.2021.405.710.7850.7228.400.8020.405.890.7861.0028.600.8019.60
5.840.7540.8431.000.8019.305.790.7610.8229.300.7019.805.960.7740.8629.500.6018.50
5.890.782--0.5020.105.840.710--1.1025.506.020.789--1.3020.40
6.230.748--1.6021.505.770.743--0.6022.805.920.793--0.8020.00
6.110.763--0.6020.805.890.692--0.9021.706.170.820--0.5024.70
Average5.940.7550.8929.100.9420.625.800.7380.7728.850.8222.045.990.7920.9329.050.8020.64
±SD0.240.0190.062.690.460.930.070.0380.070.640.192.260.110.0170.100.640.312.38
Batch 1 Food Control SamplesBatch 2 Food Control SamplesBatch 3 Food Control Samples
Day End %MAP O2%MAP CO2 %MAP O2%MAP CO2 %MAP O2%MAP CO2
0.1033.30 0.4027.60 0.3032.80
0.3029.10 0.2031.50 0.6028.40
Average 0.2031.20 0.3029.55 0.4530.60
±SD 0.142.97 0.142.76 0.213.11
Table 4. The physicochemical characteristic measurements of the “Control Unit” samples of semi-hard light sliced cheese on “Day 0” and at the end of the shelf life on “Day End”.
Batch 1 Control Units
(Injected with Physiological Water)
Batch 2 Control Units
(Injected with Physiological Water)
Batch 3 Control Units
(Injected with Physiological Water)
Day 0pHaw%NaCl%Fat%MAP O2%MAP CO2pHaw%NaCl%Fat%MAP O2%MAP CO2pHaw%NaCl%Fat%MAP O2%MAP CO2
5.690.760.9117.40.4021.706.120.740.7316.900.6024.405.820.681.2117.40.6025.80
5.990.800.7516.22.0021.706.300.700.8316.300.1023.605.700.721.1017.00.3023.70
Ave rage5.840.780.8316.81.2021.706.210.720.7816.600.3524.005.760.701.1617.20.4524.75
±SD0.210.030.110.851.130.000.130.030.070.420.350.570.080.030.080.280.211.48
Day EndpHaw%NaCl%Fat%MAP O2%MAP CO2pHaw%NaCl%Fat%MAP O2%MAP CO2pHaw%NaCl%Fat%MAP O2%MAP CO2
6.420.720.93NE *0.0033.206.500.760.95NE *0.0029.406.210.781.20NE *0.0034.10
6.240.650.78NE *0.0032.306.400.710.91NE *0.0036.706.580.720.92NE *0.8029.70
Average6.330.690.86 0.0032.756.450.740.93 0.0033.056.400.751.06 0.4031.90
±SD0.130.050.11 0.000.640.070.040.03 0.005.160.260.040.20 0.573.11
NE *—not examined.
Table 5. The physicochemical measurements of the “Control Unit” samples of the semi-hard full-fat sliced cheese on “Day 0” and at the end of the shelf life on “Day End”.
Batch 1 Control Units
(Injected with Physiological Water)
Batch 2 Control Units
(Injected with Physiological Water)
Batch 3 Control Units
(Injected with Physiological Water)
Day 0pHaw%NaCl%Fat%MAP O2%MAP CO2pHaw%NaCl%Fat%MAP O2%MAP CO2pHaw%NaCl%Fat%MAP O2%MAP CO2
6.140.701.2028.301.5020.405.780.7700.8729.000.7019.205.920.7860.9527.400.3018.60
5.840.780.7229.700.9019.805.620.7810.8527.400.6018.406.080.7810.8428.900.6020.70
Average5.990.740.9629.001.2020.105.700.7760.8628.200.6518.806.000.7840.9028.150.4519.65
±SD0.210.060.340.990.420.420.110.0080.011.130.070.570.110.0040.081.060.211.48
Day EndpHaw%NaCl%Fat%MAP O2%MAP CO2pHaw%NaCl%fat%MAP O2%MAP CO2pHaw%NaCl%fat%MAP O2%MAP CO2
6.140.750.80NE *0.7025.905.920.7480.90NE *0.5027.406.060.8100.91NE *0.1031.20
6.210.710.93NE *0.5028.605.910.7500.71NE *0.3029.506.870.7860.76NE *0.4030.60
Average6.180.730.87 0.6027.255.920.7490.81 0.4028.456.470.7980.84 0.2530.90
±SD0.050.030.09 0.141.910.010.0010.13 0.141.480.570.0170.11 0.210.42
NE *—not examined.
Table 6. The rate of reduction in the concentration of Lm (log10 CFU/g) in the three contaminated Batches of light semi-hard sliced cheese during storage at 5 °C, 7 °C, and 10 °C, during the studied period (“Day 0”—day of inoculation; “Day End”—end of shelf life (181st day upon the receipt of the Batches)). The shelf life of the cheese was 6 months.
Lm (log10 CFU/g)Lm % Change *
Day (Storage Temperature)Batch 1Batch 2Batch 3Batch 1Batch 2Batch 3
02.082.312.23
24 (5 °C)1.931.74<1.60−7.21−24.68<−28.25
59 (7 °C)1.741.74<1.60−9.840.000.00
108 (7 °C)1.781.78<1.602.302.300.00
164 (7 °C)1.60<1.60<1.00−10.11<−10.11<−37.50
181 (10 °C)<1.60<1.60<1.600.000.00<60
* % Change = F i n a l   v a l u e I n i t i a l   v a l u e I n i t i a l   v a l u e × 100.
Table 7. The rate of reduction in the concentration of Lm (log10 CFU/g) in the three contaminated Batches of full-fat semi-hard sliced cheese during storage at 5 °C, 7 °C, and 10 °C, during the studied period (“Day 0”—day of inoculation; “Day End”—end of shelf life (181st day upon the receipt of the Batches)). The shelf life of the cheese was 6 months.
Lm (log10 CFU/gr)Lm % Change *
Day (Storage Temperature)Batch 1Batch 2Batch 3Batch 1Batch 2Batch 3
02.202.022.08
24 (5 °C)1.781.781.88−19.09−11.88−9.62
59 (7 °C)1.78<1.601.600.00<−10.11−14.89
108 (7 °C)1.851.701.853.936.2515.63
164 (7 °C)<1.00<1.60<1.60<−45.95<−5.88<−13.51
181 (10 °C)<1.00<1.60<1.000.000.00<−37.50
* % Change = F i n a l   v a l u e I n i t i a l   v a l u e I n i t i a l   v a l u e × 100.
Table 8. The enumeration of mesophilic aerobic count and lactic acid bacteria (Lab) in the “Control Unit” samples in the three Batches of light semi-hard sliced cheeses.
Day (Storage Temperature)Mesophilic Aerobic Count in “Control Units” (log10 CFU/g)Lactic Acid Bacteria (Lab) in “Control Units” (log10 CFU/g)
Day 0 5 °C7.367.658.117.157.557.87
Day End 10 °C7.807.777.887.027.367.66
* % Change from
“Day 0” to “Day End” (Day 181)
6.05%1.60%−2.85%−1.76%−2.56%−2.66%
* % Change = F i n a l   v a l u e I n i t i a l   v a l u e I n i t i a l   v a l u e × 100.
Table 9. The enumeration of mesophilic aerobic count and lactic acid bacteria (Lab) in the “Control Unit” samples in the three Batches of full-fat semi-hard sliced cheeses.
Day (Storage Temperature)Mesophilic Aerobic Count in “Control Units” (log10 CFU/g)Lactic Acid Bacteria (Lab) in “Control Units” (log10 CFU/g)
Day 0 5 °C7.587.676.917.426.926.14
Day End 10 °C6.917.607.856.076.006.04
* % Change from
“Day 0” to “Day End” (Day 181)
−8.82%−0.84%13.65%−18.17%−13.27%−1.72%
* % Change = F i n a l   v a l u e I n i t i a l   v a l u e I n i t i a l   v a l u e × 100.
Disclaimer/Publisher’s Note: The statements, opinions and data contained in all publications are solely those of the individual author(s) and contributor(s) and not of MDPI and/or the editor(s). MDPI and/or the editor(s) disclaim responsibility for any injury to people or property resulting from any ideas, methods, instructions or products referred to in the content.

