Article

Deep Learning-Based Imagery Style Evaluation for Cross-Category Industrial Product Forms

by
Jianmin Zhang
1,
Yuliang Li
2,*,
Mingxing Zhou
1 and
Sixuan Chu
3
1
College of Mechanical Engineering, Donghua University, Shanghai 201620, China
2
Institute of Artificial Intelligence, Shanghai Engineering Research Center of Industrial Big Data and Intelligent System, Donghua University, Shanghai 201620, China
3
College of Information Science and Technology, Donghua University, Shanghai 201620, China
*
Author to whom correspondence should be addressed.
Appl. Sci. 2025, 15(11), 6061; https://doi.org/10.3390/app15116061
Submission received: 23 April 2025 / Revised: 23 May 2025 / Accepted: 26 May 2025 / Published: 28 May 2025

Abstract

The evaluation of imagery style in industrial product design is inherently subjective, making it difficult for designers to accurately capture user preferences. This ambiguity often results in suboptimal market positioning and design decisions. Existing methods, primarily limited to single product categories, rely on labor-intensive user surveys and computationally expensive data processing techniques, thus failing to support cross-category collaboration. To address this, we propose an Imagery Style Evaluation (ISE) method that enables rapid, objective, and intelligent assessment of imagery styles across diverse industrial product forms, assisting designers in better capturing user preferences. By combining Kansei Engineering (KE) theory with four key visual morphological features—contour lines, edge transition angles, visual directions and visual curvature—we define six representative style paradigms: Naturalness, Technology, Toughness, Steadiness, Softness, and Dynamism (NTTSSD), enabling quantification of the mapping between product features and user preferences. A deep learning-based ISE architecture was constructed by integrating the NTTSSD paradigms into an enhanced YOLOv5 network with a Convolutional Block Attention Module (CBAM) and semantic feature fusion, enabling effective learning of morphological style features. Experimental results show the method improves mean average precision (mAP) by 1.4% over state-of-the-art baselines across 20 product categories. Validation on 40 product types confirms strong cross-category generalization with a root mean square error (RMSE) of 0.26. Visualization through feature maps and Gradient-weighted Class Activation Mapping (Grad-CAM) further verifies the accuracy and interpretability of the ISE model. This research provides a robust framework for cross-category industrial product style evaluation, enhancing design efficiency and shortening development cycles.

1. Introduction

At present, enterprises need to cater to user preferences to win the market, and the imagery style of product form critically impacts customers’ emotional responses and decision-making [1]. However, it is very challenging to objectively measure and assess imagery style in alignment with user emotional preferences for product form. Designers often rely heavily on personal knowledge, experience, intuition, and taste in product affective design, which can lead to inconsistencies in design outcomes and quality due to cognitive biases regarding user emotional needs [2,3,4]. If objective and quantitative analysis of user emotional feedback data is conducted, a better morphological design artifact can be created during the product conceptual design stage when the data reflect user preferences.
To better understand users’ emotional needs, some scholars have utilized Eye Tracking and Electroencephalography (EEG) techniques [5,6,7,8,9] to precisely measure consumer attention to specific regions of products. Additionally, surveys and interviews have been conducted to explore user emotional preferences, aiding in guiding specific product designs [10,11]. However, these traditional methods face some limitations: they are often labor-intensive, costly, time-consuming, and limited in scale. Compared to traditional methods, applying machine learning techniques to analyze user emotional preferences for product forms is both low-cost and efficient [12]. Therefore, some scholars use machine learning methods to predict user preferences by analyzing small sample data of certain product forms and local design element parameters. In particular, certain of these algorithms have become mainstream applications in the field of product form, such as Support Vector Machines (SVM) [13,14], Random Forest [15], Bayesian networks [16,17,18], Decision Trees [19,20], and artificial neural networks [21,22,23,24,25]. While machine learning methods are more efficient than traditional approaches, they are primarily used to predict user preferences for specific product forms in small samples. Additionally, for machine learning to be applied to design problems, design variables must be numerical or convertible to numerical data [26]. After multiple rounds of data interpretation and complex data conversions, the objectivity of the information may significantly decrease. Furthermore, it becomes challenging for general designers to deal with large volumes of data in various formats.

Aims of This Study

This paper proposes an Imagery Style Evaluation (ISE) method for multi-type industrial product forms, oriented towards user emotional preferences. The ISE method addresses key limitations of traditional approaches, such as heavy reliance on manual labor, small sample prediction, and cumbersome data transformations. It enables rapid, end-to-end, and visualized evaluation, helping designers better understand user emotions, reduce cognitive biases, and shorten the design cycle. The main contributions of this paper are as follows:
(1)
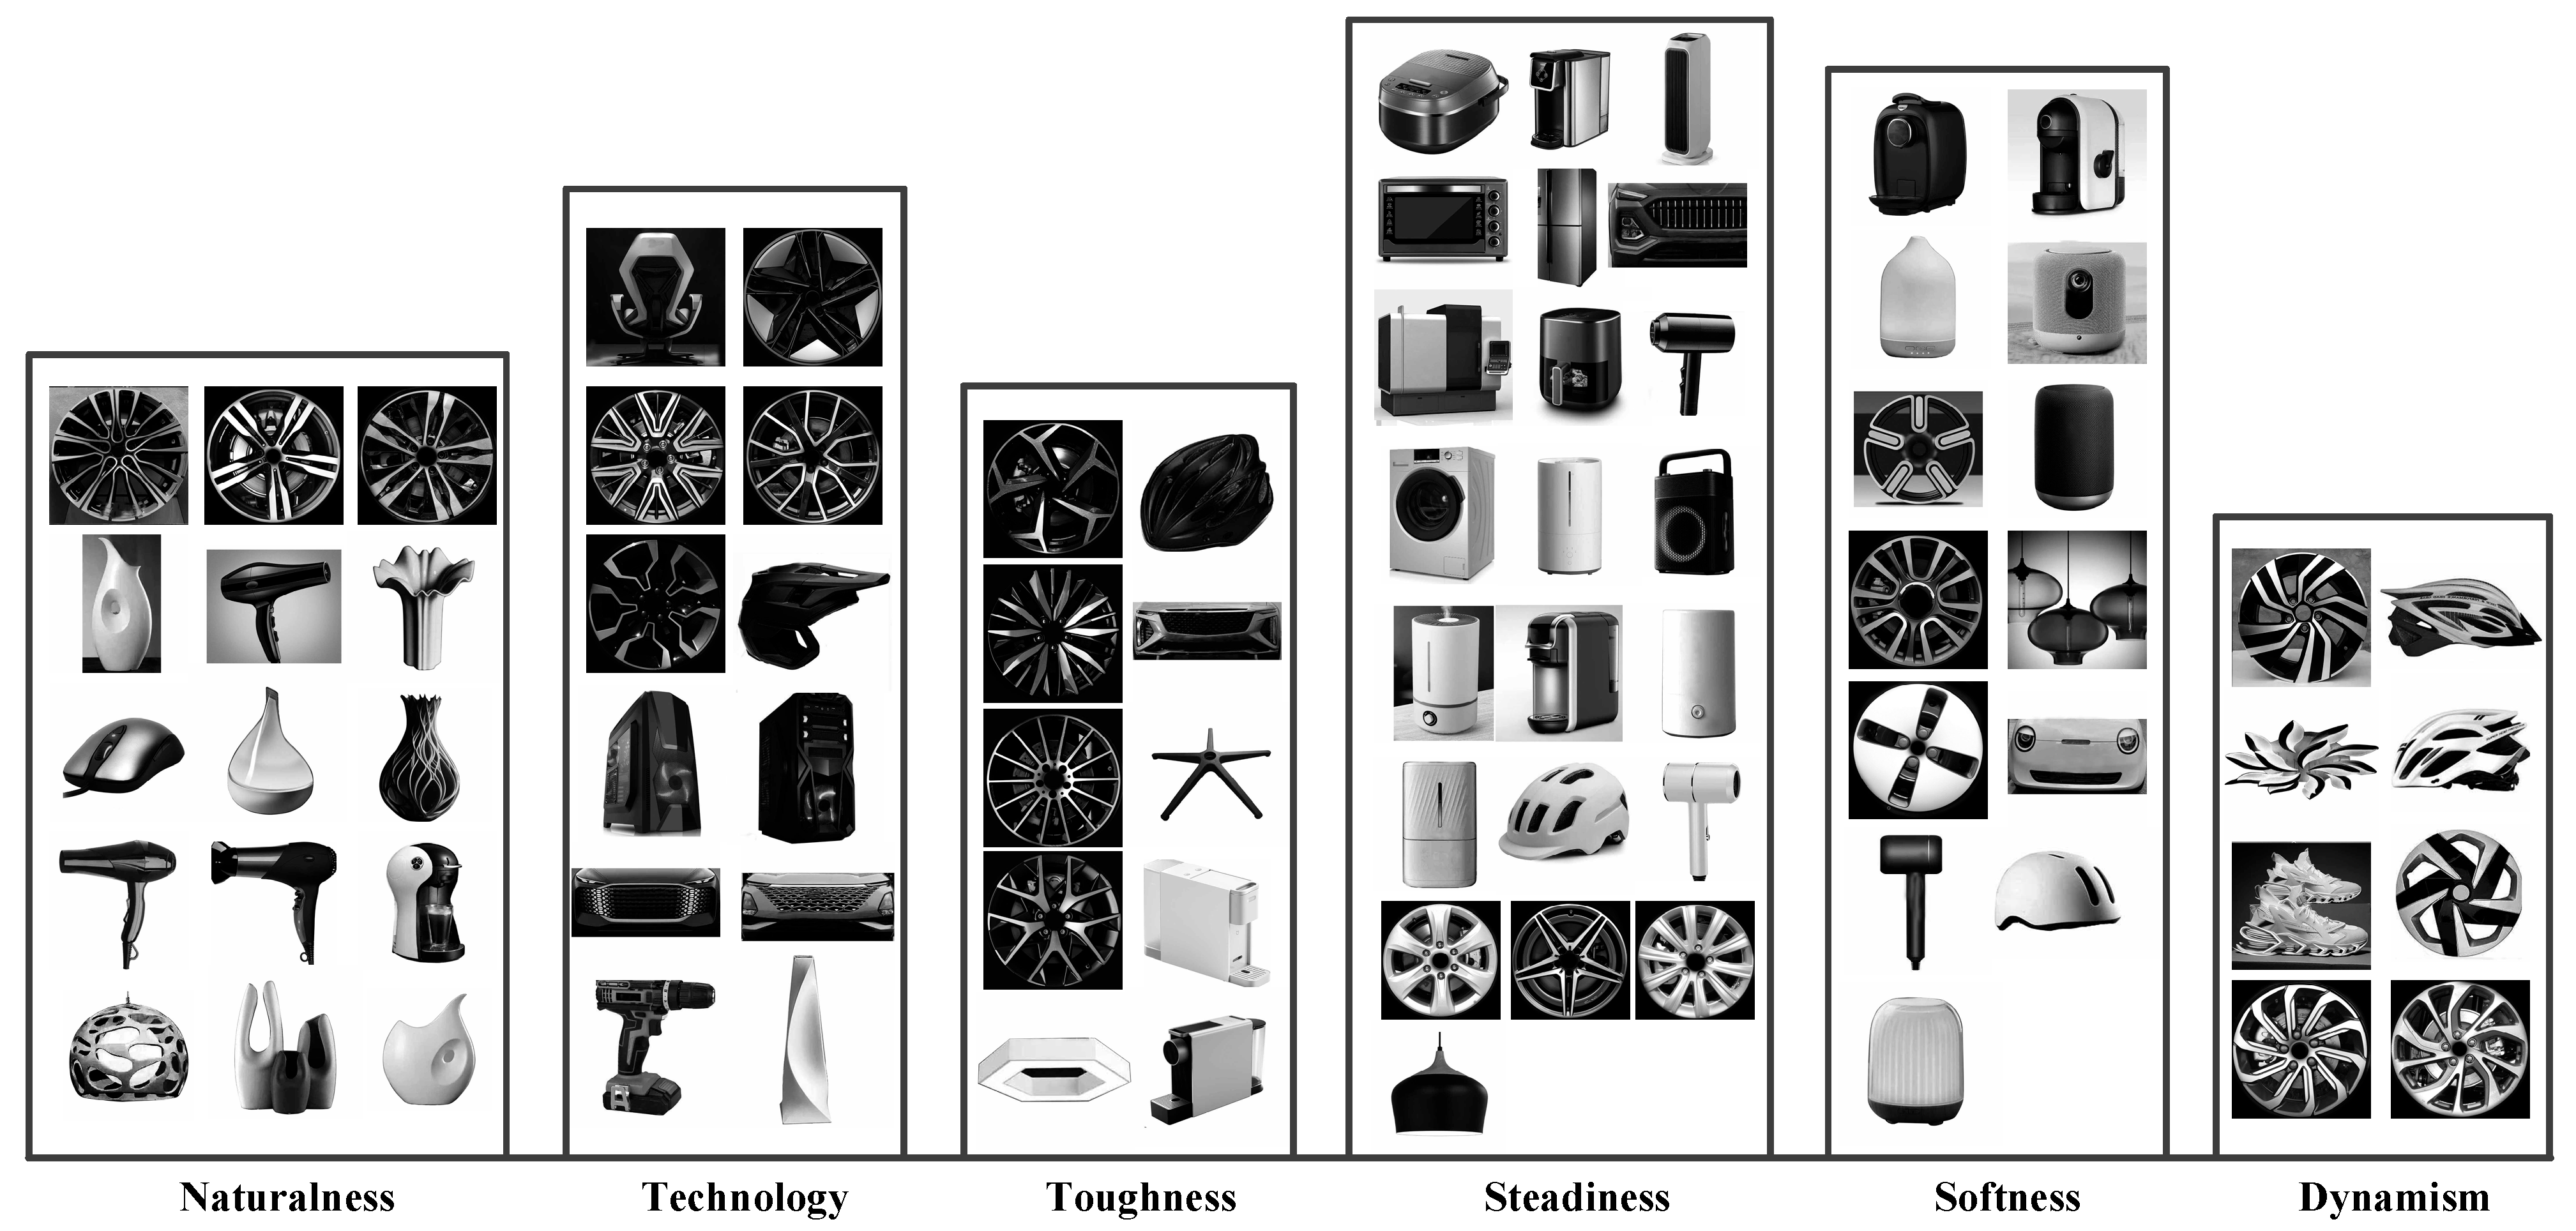
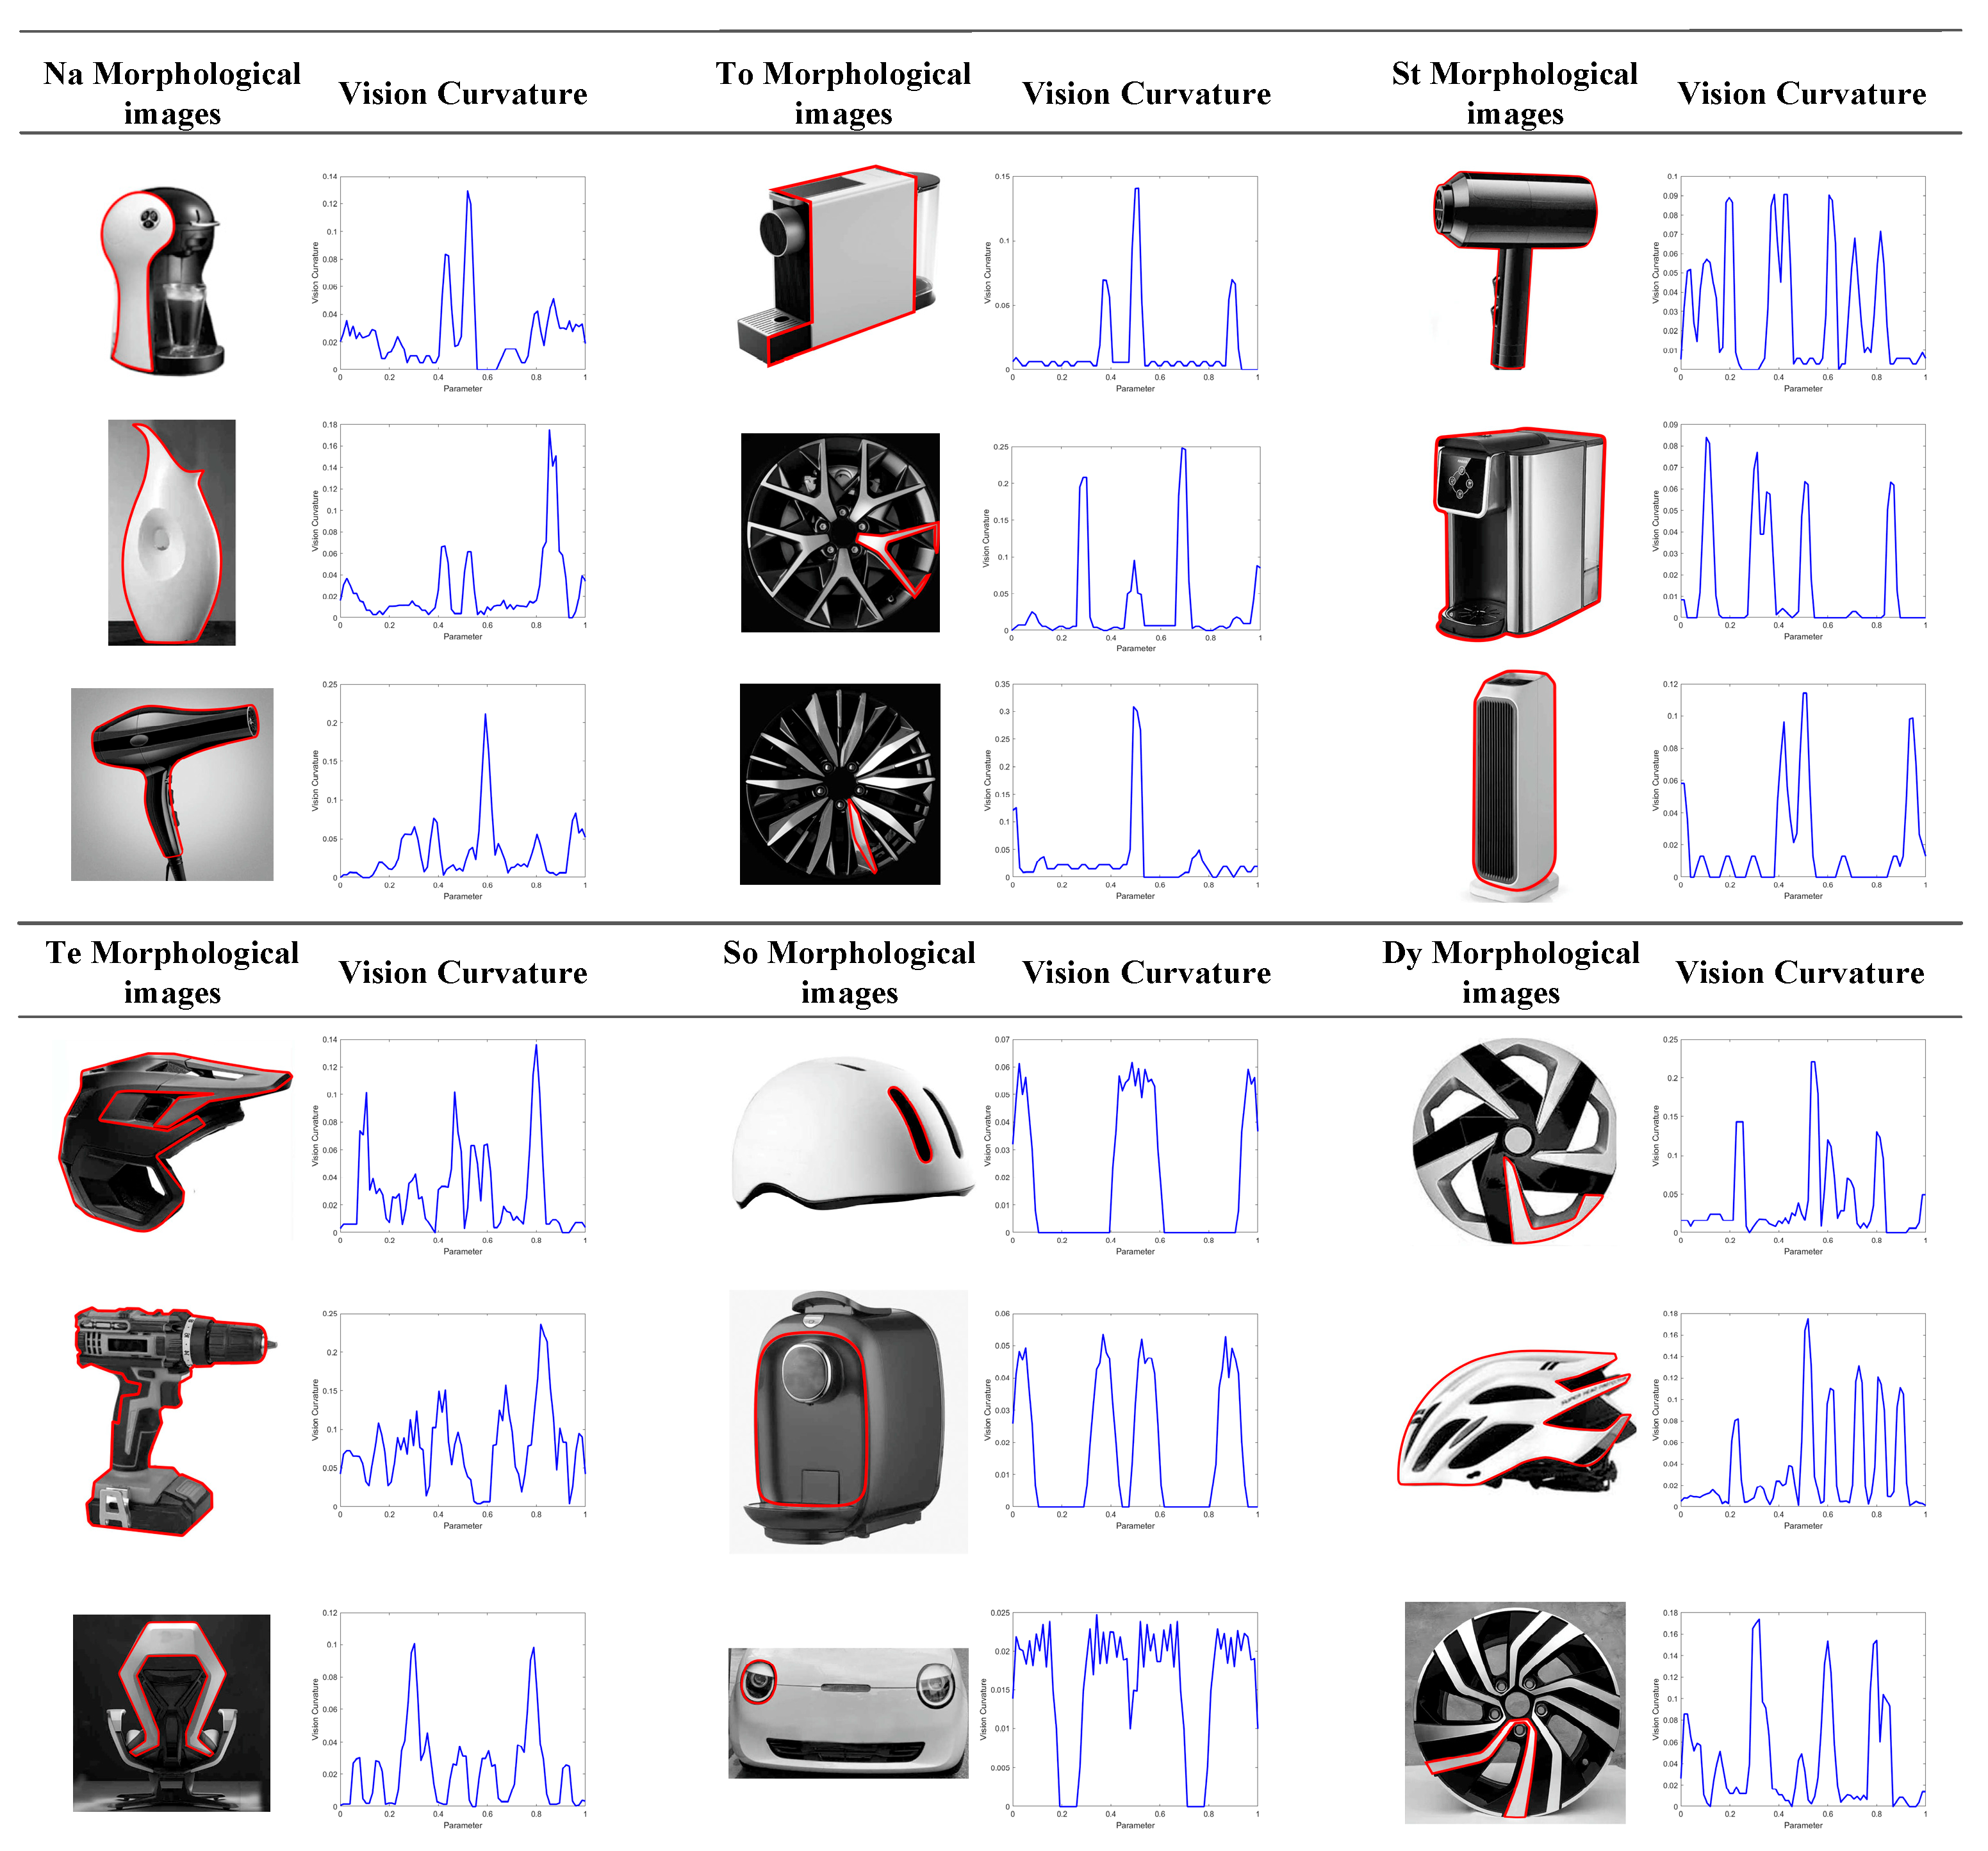
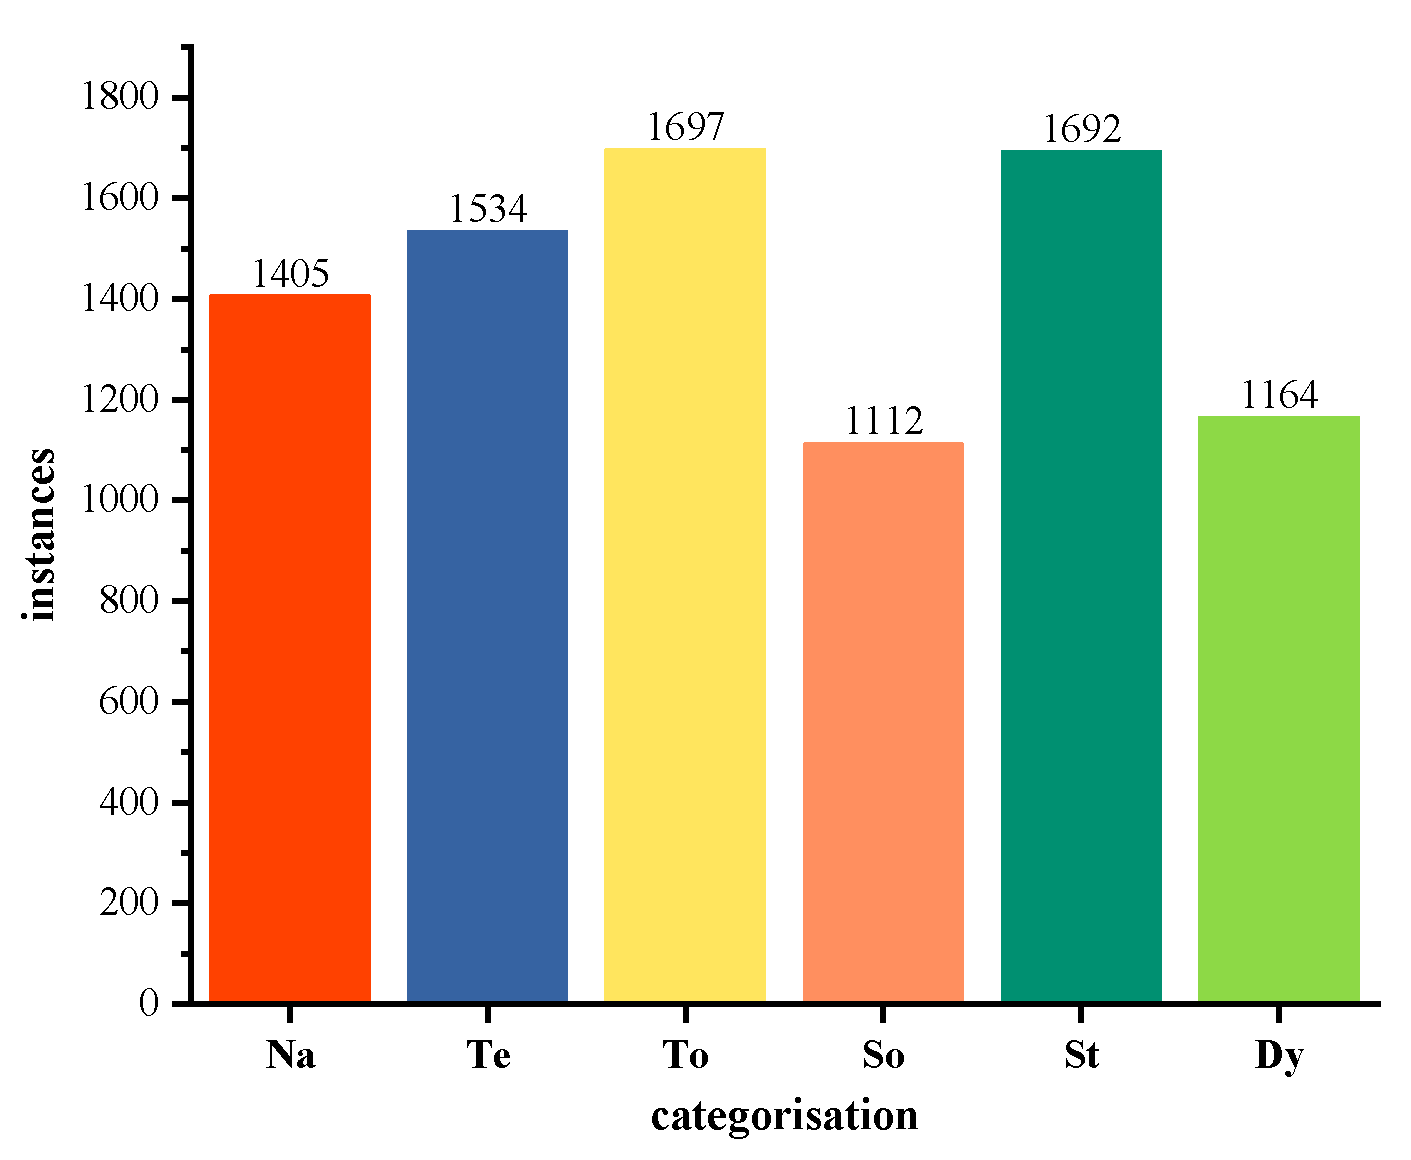
Construction of representative style paradigms: Naturalness, Technology, Toughness, Steadiness, Softness, and Dynamism (NTTSSD) for evaluating imagery styles across multi-category product forms. Based on Kansei Engineering (KE), we integrate four key visual morphological features, i.e., contour line, edge transition angle, visual direction, and visual curvature, to establish the NTTSSD paradigms. These paradigms enable a systematic mapping between product form features and user emotional preferences, allowing for the quantification of perceptual evaluations across diverse product categories. Accordingly, a dataset of 8604 images covering 20 industrial product types was constructed.
(2)
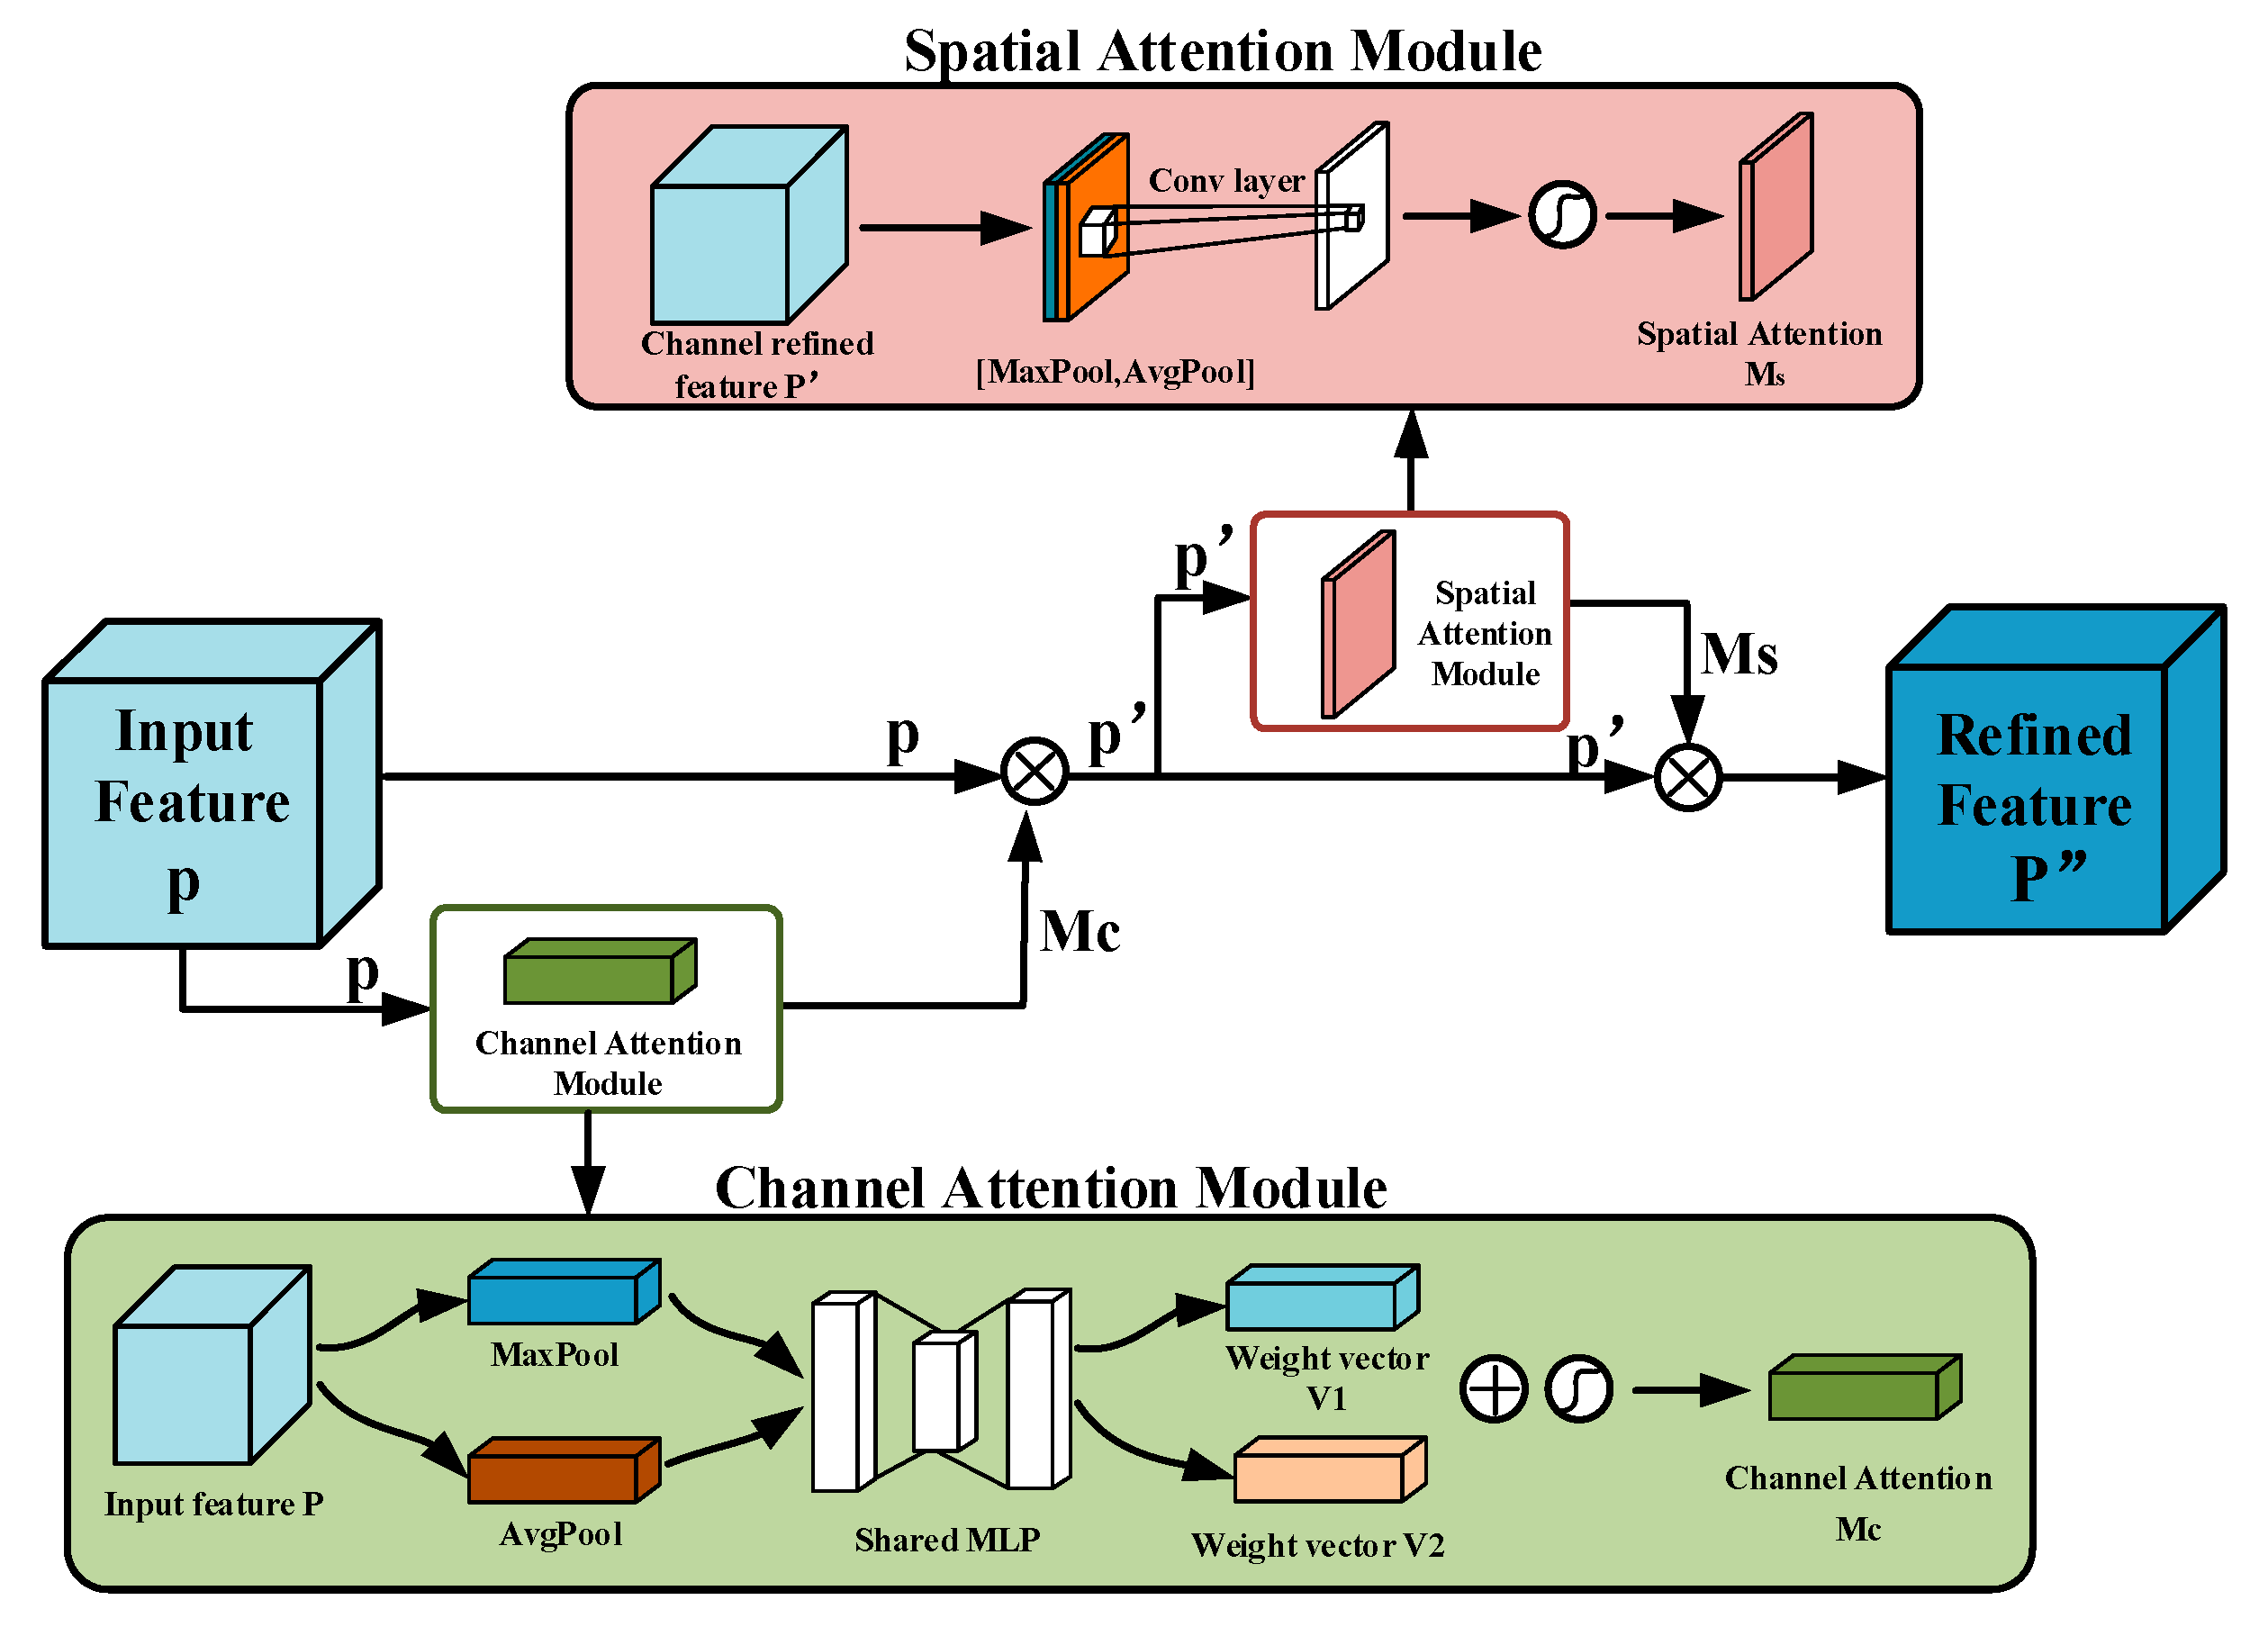
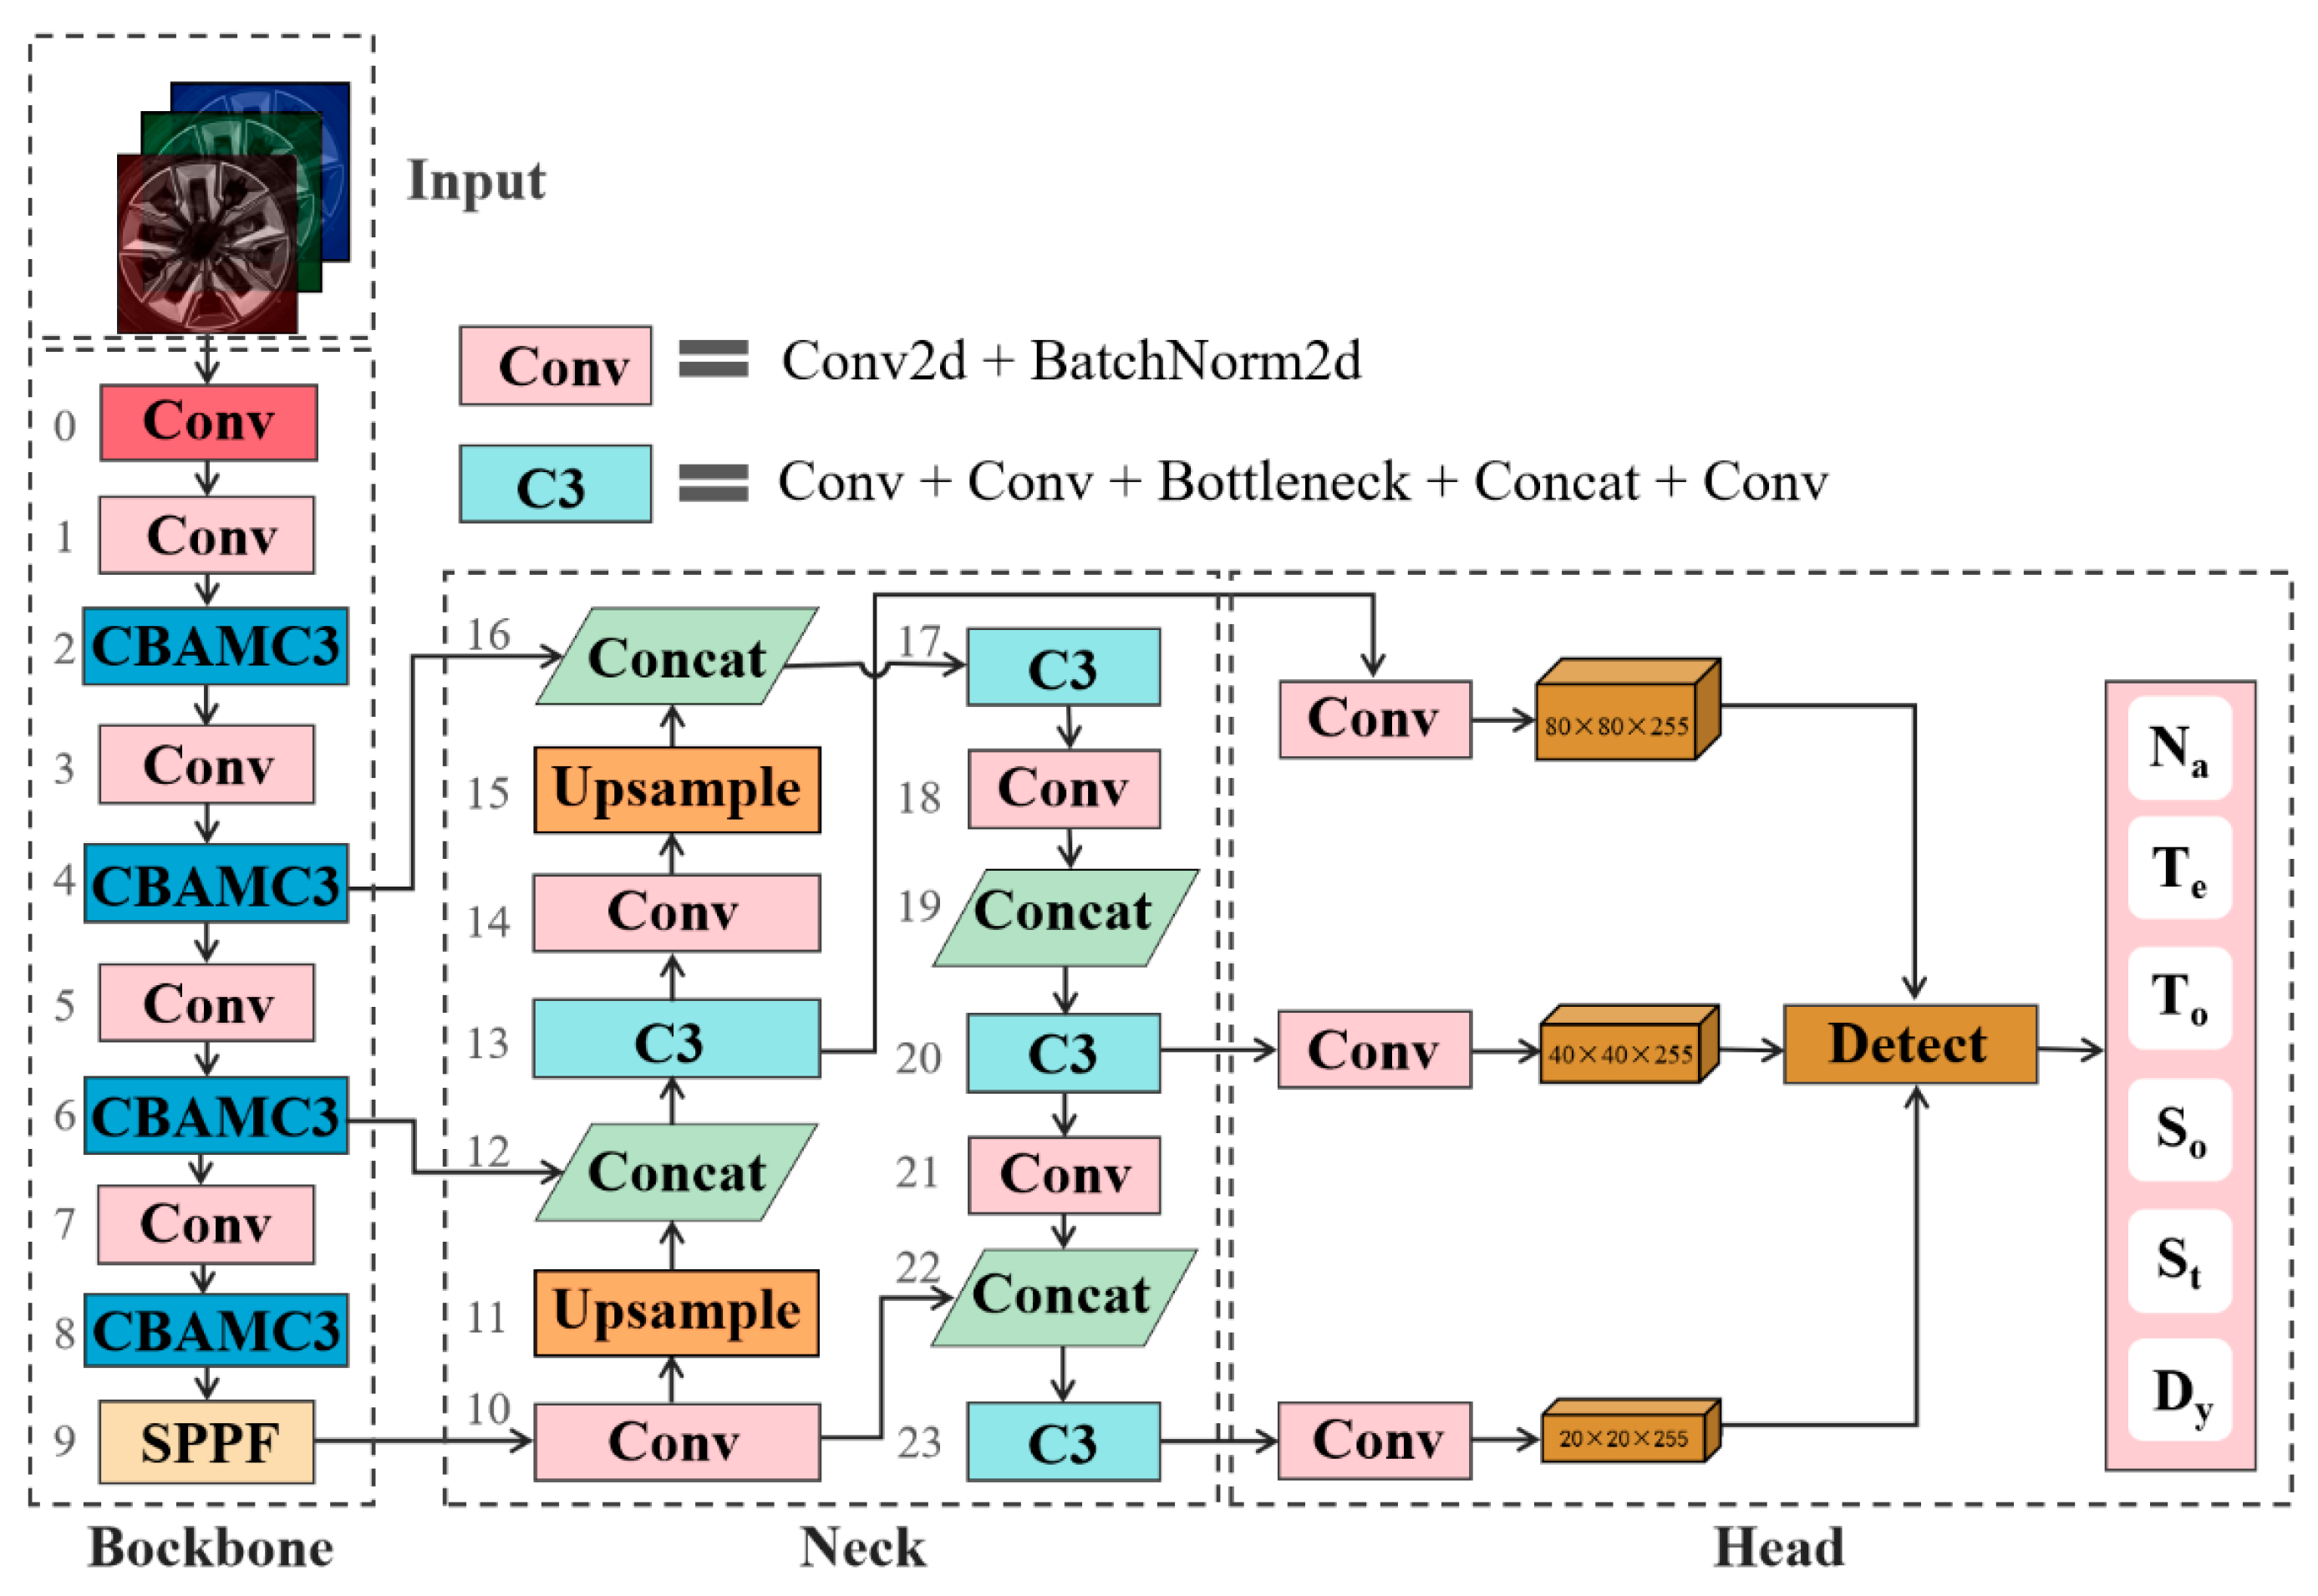
Development of an end-to-end intelligent ISE framework: This study integrates an enhanced You Only Look Once version 5 small (YOLOv5s) deep learning network with NTTSSD paradigms by incorporating a Convolutional Block Attention Module (CBAM) to improve efficient learning of key morphological features. A shallow-to-deep semantic feature fusion mechanism is also proposed to capture multi-scale morphological characteristics across diverse product types. Experimental results show that the mean Average Precision (mAP@0.5) across all categories reaches 86.1%, representing a 1.4% improvement over the state-of-the-art baseline model, while increasing the processing speed by 40.7 Frames Per Second (FPS). This framework significantly reduces the dependence on costly user surveys and complex data transformations, enabling efficient and collaborative evaluation across product categories.
(3)
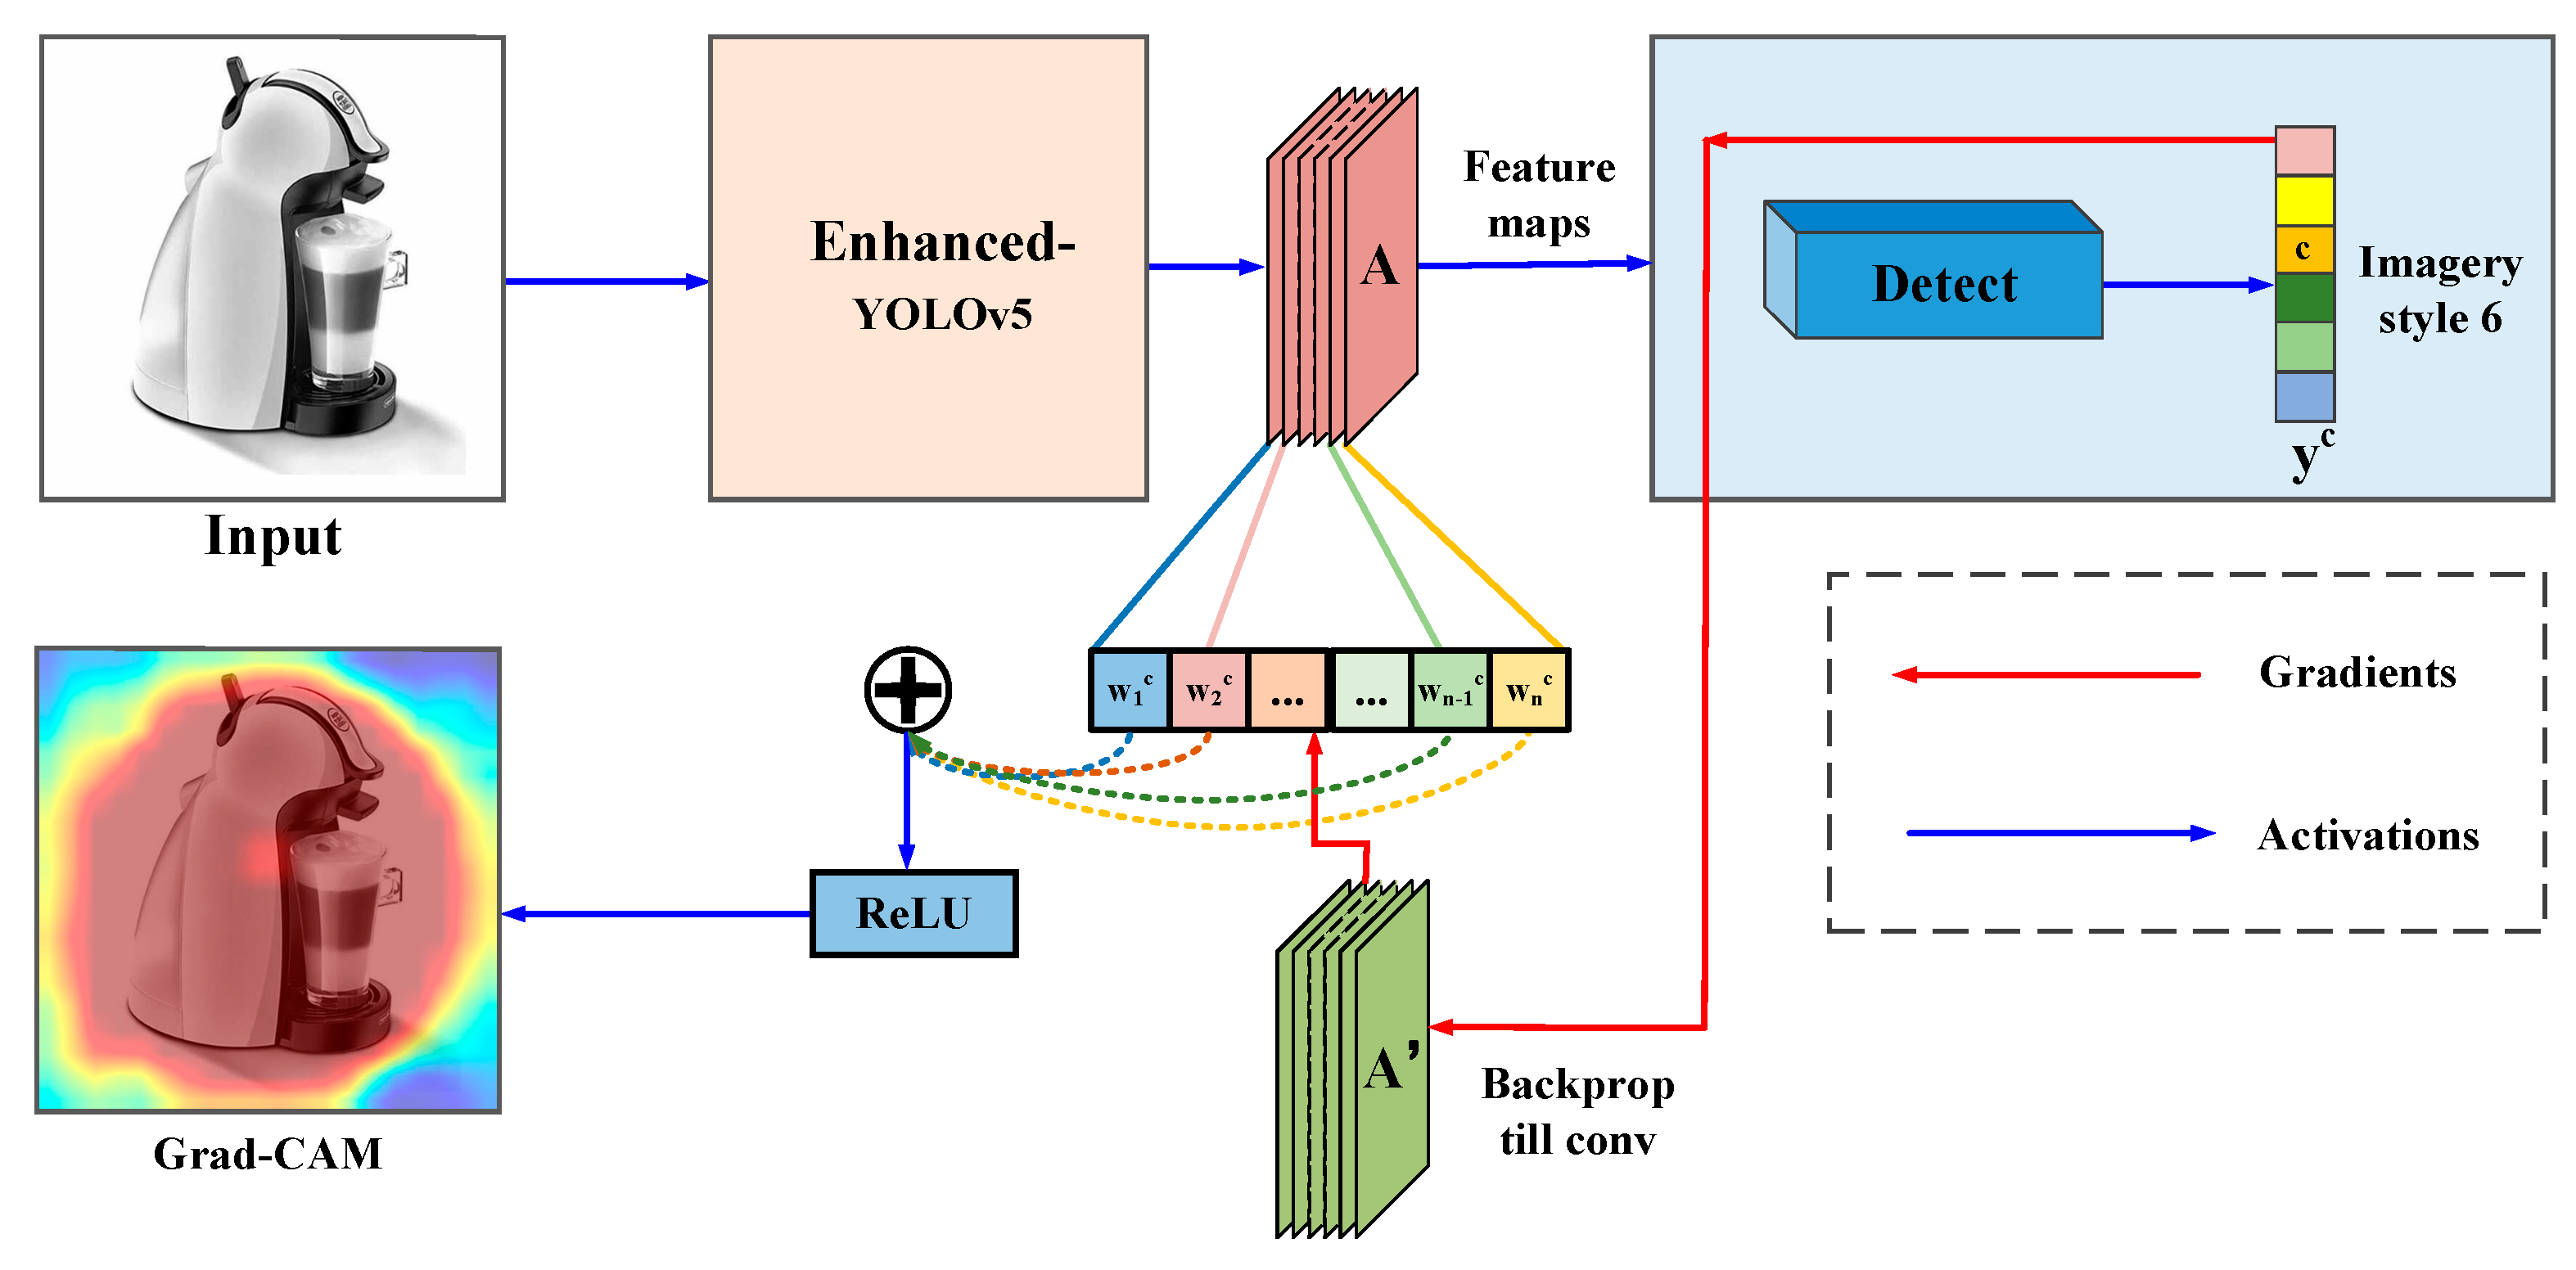
Validation of the model’s generalization and interpretability: We utilize key layer feature maps and Gradient-weighted Class Activation Mapping (Grad-CAM) technology to visualize the model’s attention to critical morphological regions, thereby enhancing interpretability. In extended testing across 40 product types, the ISE model achieves a root mean square error (RMSE) of 0.26, demonstrating strong cross-category generalization. These results highlight the feasibility of data-driven, intelligent imagery style evaluation in cross-category industrial product design.
This paper is structured as follows: Section 2 presents a review of related studies. The NTTSSD paradigms are constructed in Section 3. Section 4 presents the ISE method. Section 5 describes feature visualization of the ISE method. The conclusions and future work are discussed in Section 6.

2. Related Work

2.1. Research on User Emotional Preferences in Product Forms Based on Kansei Engineering

The theory of Kansei Engineering (KE) [27] laid a solid foundation for acquiring user preferences in product form design. Based on this theory, quantitative techniques such as the Semantic Differential (SD) [28,29] have been widely adopted. Typically, SD employs questionnaires with pairs of antonyms (e.g., like-dislike, pretty-unattractive, reliable-unreliable, etc.) divided into several levels for consumers to rate [30,31,32,33]. Although this simple questionnaire format can quickly capture user preferences, it may be too broad and vague for designers seeking to understand specific user experiences with products requiring more precise emotional vocabularies to accurately reflect users’ emotional needs.
Consequently, numerous scholars have integrated various methods with KE to map consumers’ affective perceptions onto product morphological elements. For instance, Luo, S.J., et al. [34] constructed a mapping model between consumer psychological image characteristics and SUV car product family shape genes. Wang, D. et al. [35] utilized fuzzy case-based reasoning to create a product style knowledge base for high-heeled shoes. Shih and Zhang [36] adopted the Kano model, to investigate user preferences for various vases. Fu, G., et al. [37] used ERP to assess the response of affective words to car design features. Fan [38] verified the effectiveness of a mapping model between style vocabulary and product form design for toy cars. Shi and Peng [39] defined the degree of customer satisfaction for upper limb rehabilitation devices based on adjectives collected from customer reviews. Kuo and Lai et al. [40] built a suitable emotional imagery vocabulary for the shape images of bluetooth headsets and computer mice. Zhong et al. [41] used KE and knowledge graphs to obtain design requirements for outdoor leisure chairs. Wu et al. [42] proposed a knowledge base for the design of the front face of cars. Guo et al. [43] established the mapping relationship between user imagery needs and product form design elements to meet consumer demand for ceramic bottle design. Liu et al. [44] advanced the field by proposing a shape grammar-based product family DNA for the Audi sedan series, linking explicit morphological features with implicit design intentions. Despite these advancements, most research has focused on detailed design elements and affective perception vocabularies for specific products, making it challenging to simultaneously address multiple types of industrial products. This fragmentation can hinder efficiency in rapidly changing market environments, impacting the entire product design cycle.
In summary, through a comprehensive review of KE and its applications, it is evident that user preferences for product form have been analyzed from multiple perspectives, providing substantial theoretical support for user preference research. However, to further enhance the accuracy of understanding user preferences and improve design efficiency, more effective tools and methodologies are required to integrate these preferences into practical applications across a wide range of industrial products. This study combines KE with the Technique for Order Preference by Similarity to Ideal Solution (TOPSIS) to acquire unified user affective perceptions across various product forms, thereby enabling designers to better comprehend the semantic needs of different industrial products and transform abstract user emotions into concrete design guidelines, ultimately enhancing design efficiency.

2.2. Deep Learning Model

Deep learning models have gained significant attention for their advantages in product design and image aesthetics evaluation, particularly with the advent of the big data era [45,46,47,48,49,50,51]. These models excel in image feature extraction and objective decision-making, often outperforming human-level performance in specific tasks [52,53,54,55]. In the realm of real-time end-to-end detection, frameworks such as DEtection TRansformer (DETR) and the You Only Look Once (YOLO) series are currently among the most popular. While DETR excels in accuracy, its computational complexity poses challenges in balancing precision and speed. Conversely, the YOLO series achieves an optimal trade-off between these two factors, making it highly suitable for end-to-end deployment [56,57].
Recently, YOLOv5 has found widespread application across various fields, including healthcare [58], industry and transportation [57,59], and agriculture [60,61]. Its versatility is particularly evident in industrial applications where both cost-effectiveness and rapid deployment are critical considerations. As illustrated in Table 1, which compares eight detector models on the COCO 2017 validation dataset under identical environmental conditions [62,63], the YOLOv5s model is particularly notable for its compact size and lightweight architecture. Specifically, Table 1 provides a comparison of parameters (param), floating-point operations (FLOPs), and validation Average Precision (APval) across models. Although YOLOv5s achieves a validation Average Precision of 37.5%, which is lower than some other models, it compensates with significantly fewer parameters and lower computational requirements. Given the moderate complexity of industrial product samples, YOLOv5s’ small size and lightweight architecture reduce costs and enable rapid deployment. This makes YOLOv5s an ideal choice for further development in industrial applications. Motivated by these advancements, this study aims to develop an enhanced YOLOv5s deep learning architecture for industrial product form decision-making, particularly to aid designers in understanding user preferences and reducing cognitive biases.
The YOLOv5 network is composed of four main components: Input, Backbone, Neck, and Head, as shown in Figure 1. The Backbone processes the input image through a series of Convolution layers (Conv) and C3 layers (containing 3 standard Conv) to extract key features from the image. Finally, a Spatial Pyramid Pooling-Fast (SPPF) module is used to quickly capture multi-scale features, enhancing both the detection and speed of the model. The Neck performs further fusion and up-sampling based on features extracted by the backbone network. It adopts the Path Aggregation Network (PANet) structure, which first performs top-down feature fusion followed by bottom-up feature fusion. This structure enhances the detection accuracy and robustness of the model through effective feature fusion and information integration. The Head can fuse and transform features at different scales to capture higher-level semantic information and generate detection results [64,65]. Compared to traditional machine learning methods, YOLOv5 has superior nonlinear feature extraction and learning capabilities. Its lightweight and efficient model achieves higher accuracy and efficiency in target detection, performing excellently in complex tasks that are challenging to annotate manually [66,67]. Thus, this paper adopts YOLOv5s architectures to capture product morphological features in order to accurately reflect users’ aesthetic style preferences.

3. Constructing NTTSSD Paradigms for Imagery Style of Industrial Product Forms

Cognitive science research indicates that higher-level features are more closely aligned with the human brain’s perception of images and objects, thereby facilitating recognition and understanding [68]. Product form images can directly convey consumers’ cognitive impressions of products, while adjectives capture their abstract emotional responses to these morphologies. Consequently, this paper establishes a relationship between the visual features of industrial product forms and key adjectives, thereby developing an NTTSSD paradigm for imagery styles based on user preferences.

3.1. Quantifying the Imagery Style of Industrial Product Forms Based on Kansei Engineering

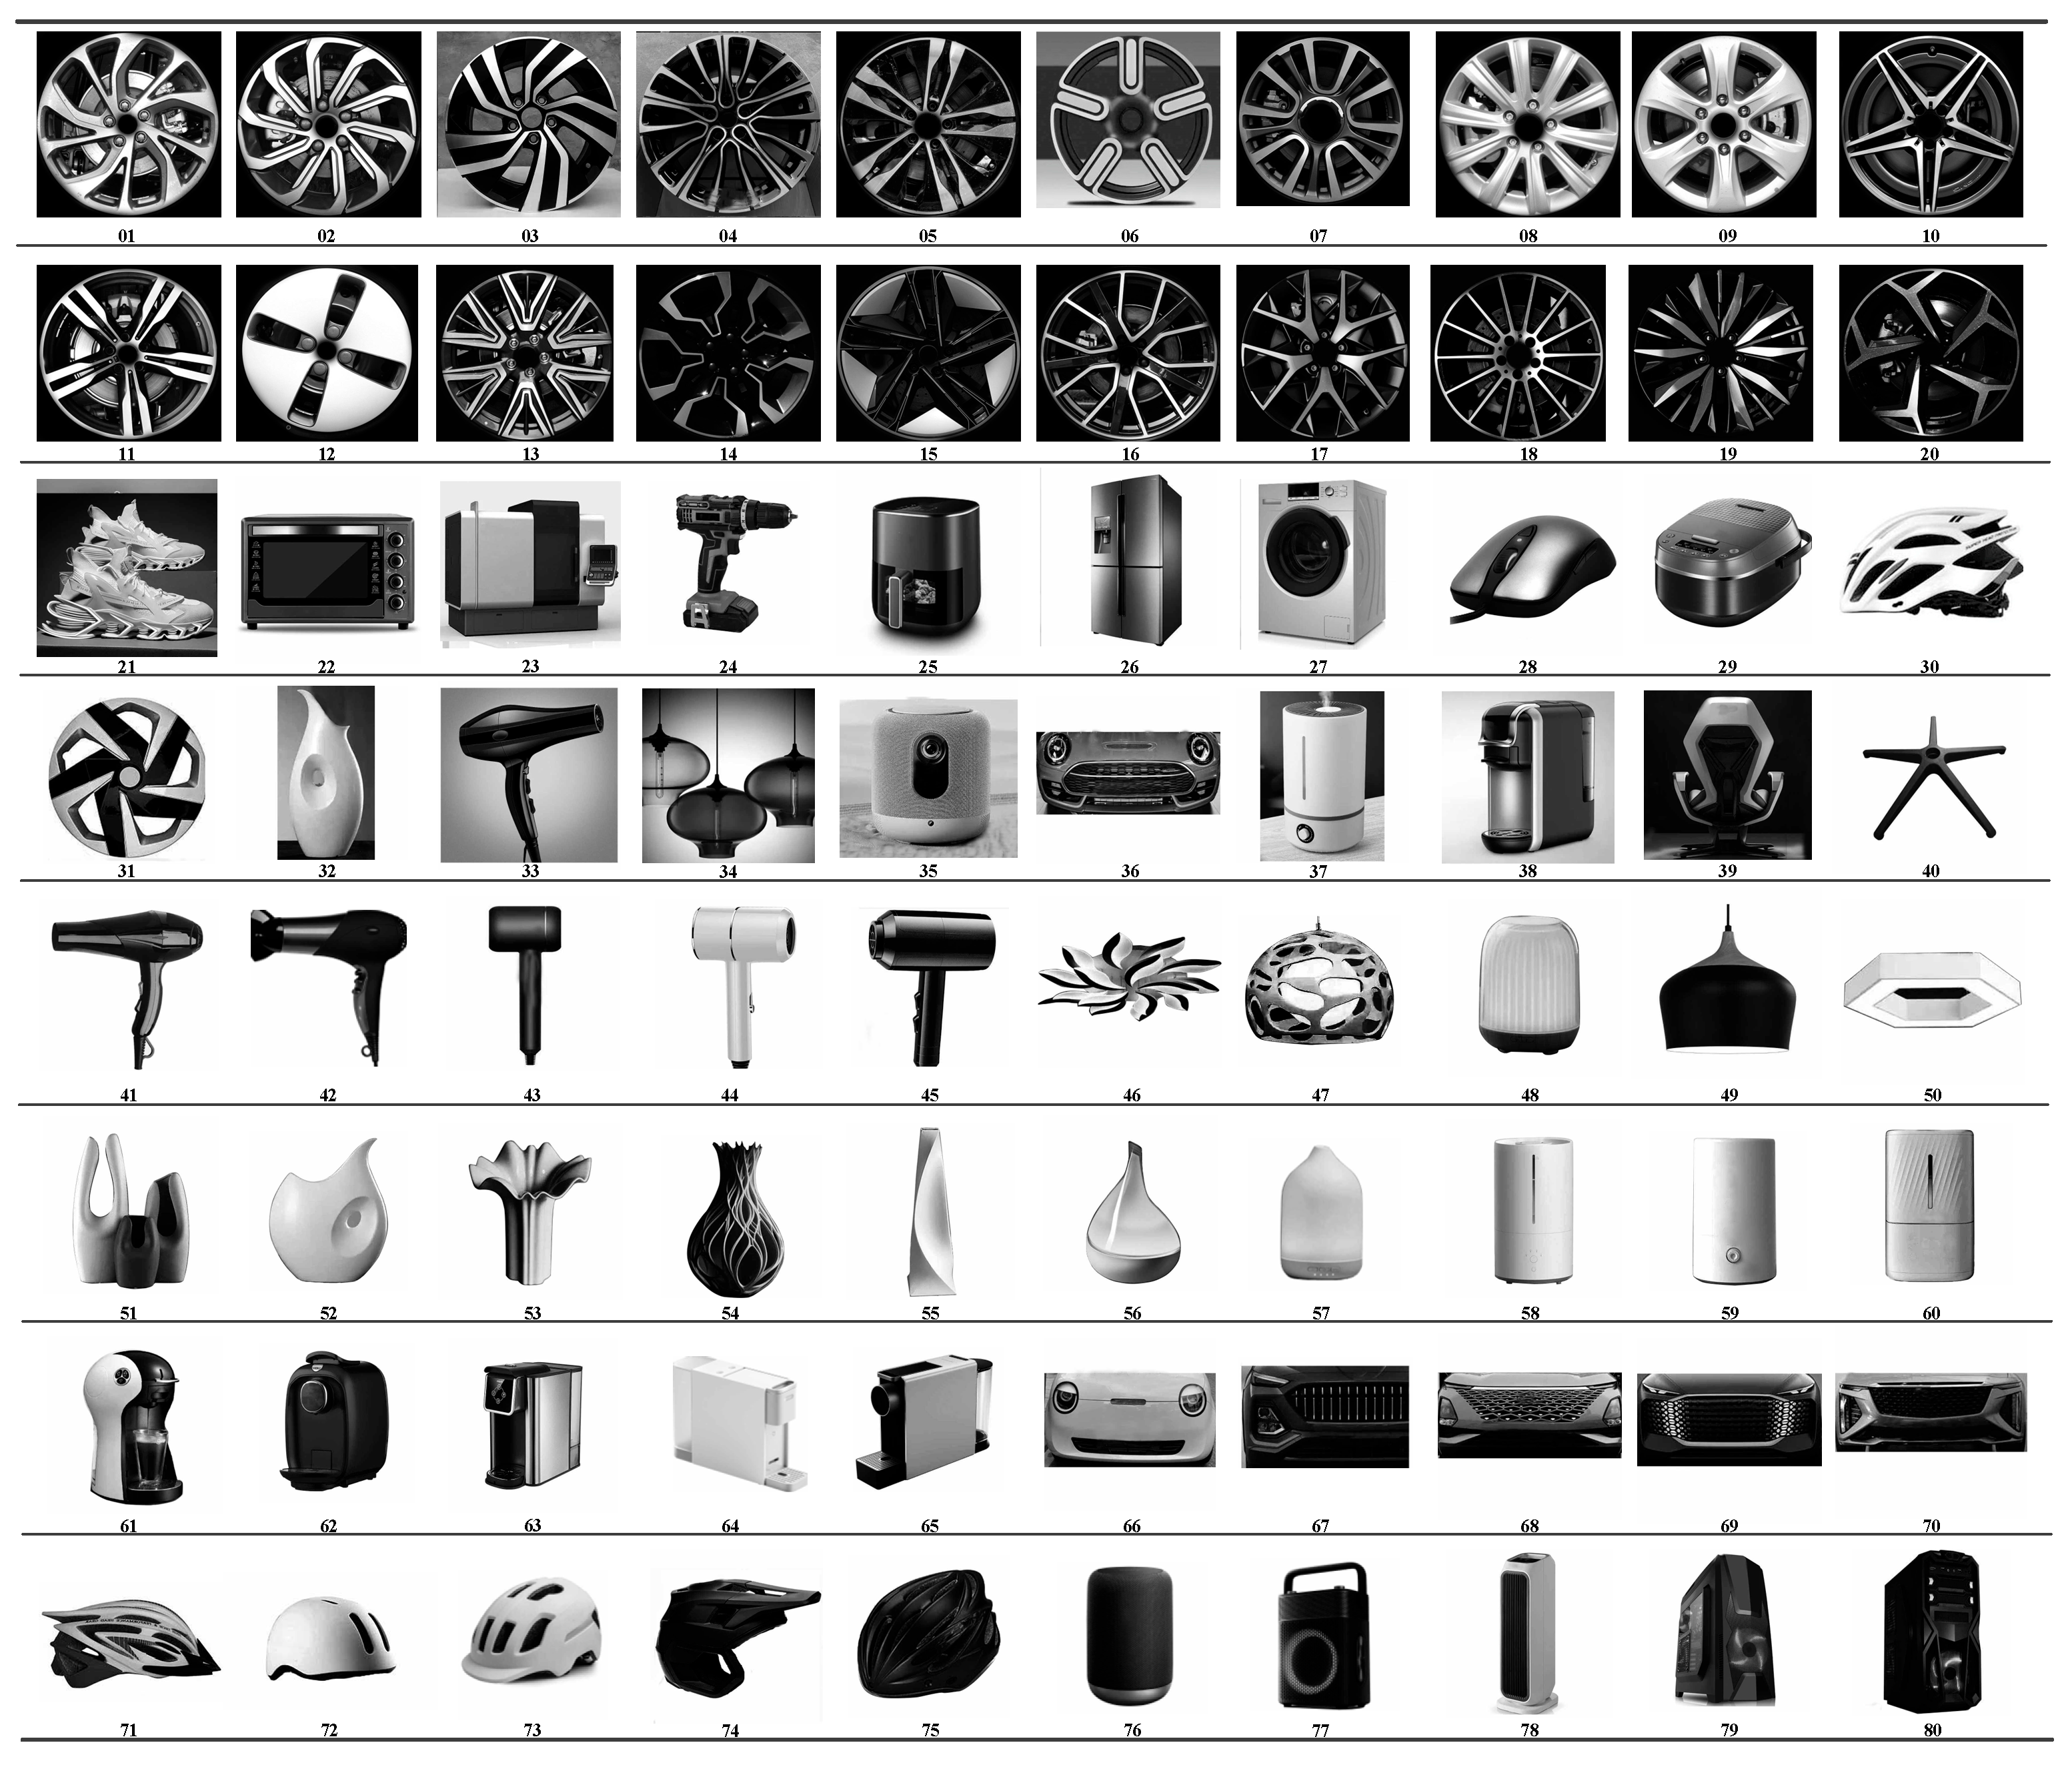
3.1.1. Acquisition of Cross-Category Industrial Product Forms

In this study, images of 20 commonly seen industrial product forms were collected from major e-commerce platforms, including Amazon, Taobao, and JD.com. The selected product categories covered consumer electronics (e.g., hair dryers, humidifiers, coffee machines, computer mice, loudspeakers), household appliances and furnishings (e.g., lamps, vases, chairs, swivel chairs with five-star bases, air fryers, rice cookers, washing machines, ovens, and refrigerators), as well as transportation equipment and other tools (e.g., wheel hubs, cars, helmets, drills, shoes, and medical devices). All collected images were converted into grayscale and underwent background standardization to minimize the influence of color, texture, and environmental noise. To ensure morphological diversity in the dataset, six senior industrial designers with over ten years of professional experience were invited to participate in the sample selection. The expert panel included four industry practitioners (e.g., design firm directors and electronic product supervisors) and two academic researchers (associate professors in industrial design). As shown in Figure 2, the experts selected 80 representative samples from the 20 product categories based on criteria including morphological diversity, market representativeness, and design innovativeness. These selected samples were later used for evaluating user preferences regarding product form.

3.1.2. Establishing the Vocabulary of Imagery Styles in Industrial Product Forms

Considering individual differences in cognitive levels, customers may have difficulty accurately expressing their needs. To address this issue, 100 adjectives describing industrial product forms from product websites, magazines, and literature were collected, as shown in Table 2. The globally utilized adjectives were chosen to be free of praise or criticism. Subsequently, six industrial designers with over ten years of professional experience (four industry practitioners and two academic researchers) analyzed the semantic similarity of these adjectives. Several car types (including sports car, intelligent car, off-road car, business car, mini car, and racing car) with the highest global user recognition were selected. These car types were quantitatively ranked and analyzed using the Technique for Order Preference by Similarity to Ideal Solution (TOPSIS), and critical imagery style words were identified to provide more precise user support.
Second, a 5-point Likert scale was used by six experts to score the relevance of the imagery style words within each category. The values of imagery style words a x y were scaled to a range of 0 to 1 based on the 5-point Likert scale, as shown in Table 3:
Finally, this paper uses the TOPSIS method [69,70] to calculate comprehensive evaluation scores for imagery style words associated with a specific product form. The vocabulary with a score closest to the positive ideal solution was then selected as the representative word for each category of morphology style. The expression is as follows:
Let the set of experts be E = {e1, e2, e3, …, en}, where i = 1,2,3, …, n . The set of imagery style words to be evaluated is S = {s1, s2, s3, …, sn}, where j = 1,2,3, …, m. The m similar imagery style words are rated by n experts based on the u type of product form, which creates a similarity evaluation matrix:
A u = a 11 u a 12 u       a 1 n u a m 1 u a m 2 u       a m n u
(i = 1,2, 3, …, n; j = 1, 2, 3, …, m)
Because the expert scoring in this paper uses a 5-point Likert scale ranging from 0 to 1, the positive ideal solution is defined as 1 and the negative ideal solution is 0.
For the j imagery style word, the distances to the positive and negative ideal solutions are D j u + and   D j u , which are calculated using the Euclidean Distance:
  D j u + = i = 1 n a i j u 1 2           ( j = 1,2 , 3 , m )
D j u = i = 1 n a i j u 2           ( j = 1,2 , 3 , m )
The composite evaluation score C j u   for each imagery style word was calculated as follows:
C j u = D j u ( D j u + + D j u )     0 C j u 1 ,   j = 1,2 , . m
where C j u   represents the comprehensive evaluation score given by experts for the j imagery style word of the u type of industrial product form.
According to the above expression, six experts were invited to score 100 imagery style words for six categories product forms on a 5-point Likert scale. After calculating comprehensive scores, the 100 words were ranked according to their proximity to the positive ideal solution. As shown in Table 4, the key imagery style words for six types of automobiles were quantitatively ranked using TOPSIS. Based on the comprehensive scoring results, six representative imagery style terms were ultimately identified: steady, soft, dynamic, tough, technological, and natural. These imagery style words serve as highly approximate representations of product forms, which can be represented using set inclusion relationships:
d e m u r e , f o r m a l , h e a v y s t e a d y a m i a b l e , r o u n d e d , c u t e s o f t s p o r t i v e , l i v e l y , f l e x i b l e d y n a m i c m a s c u l i n e , g e o m e t r i c , s h a r k t o u g h   f u t u r e , a d v a n c e d , t r e n d y t e c h n o l o g i c a l b i o n i c , o r g a n i c , b r i s k n a t u r a l

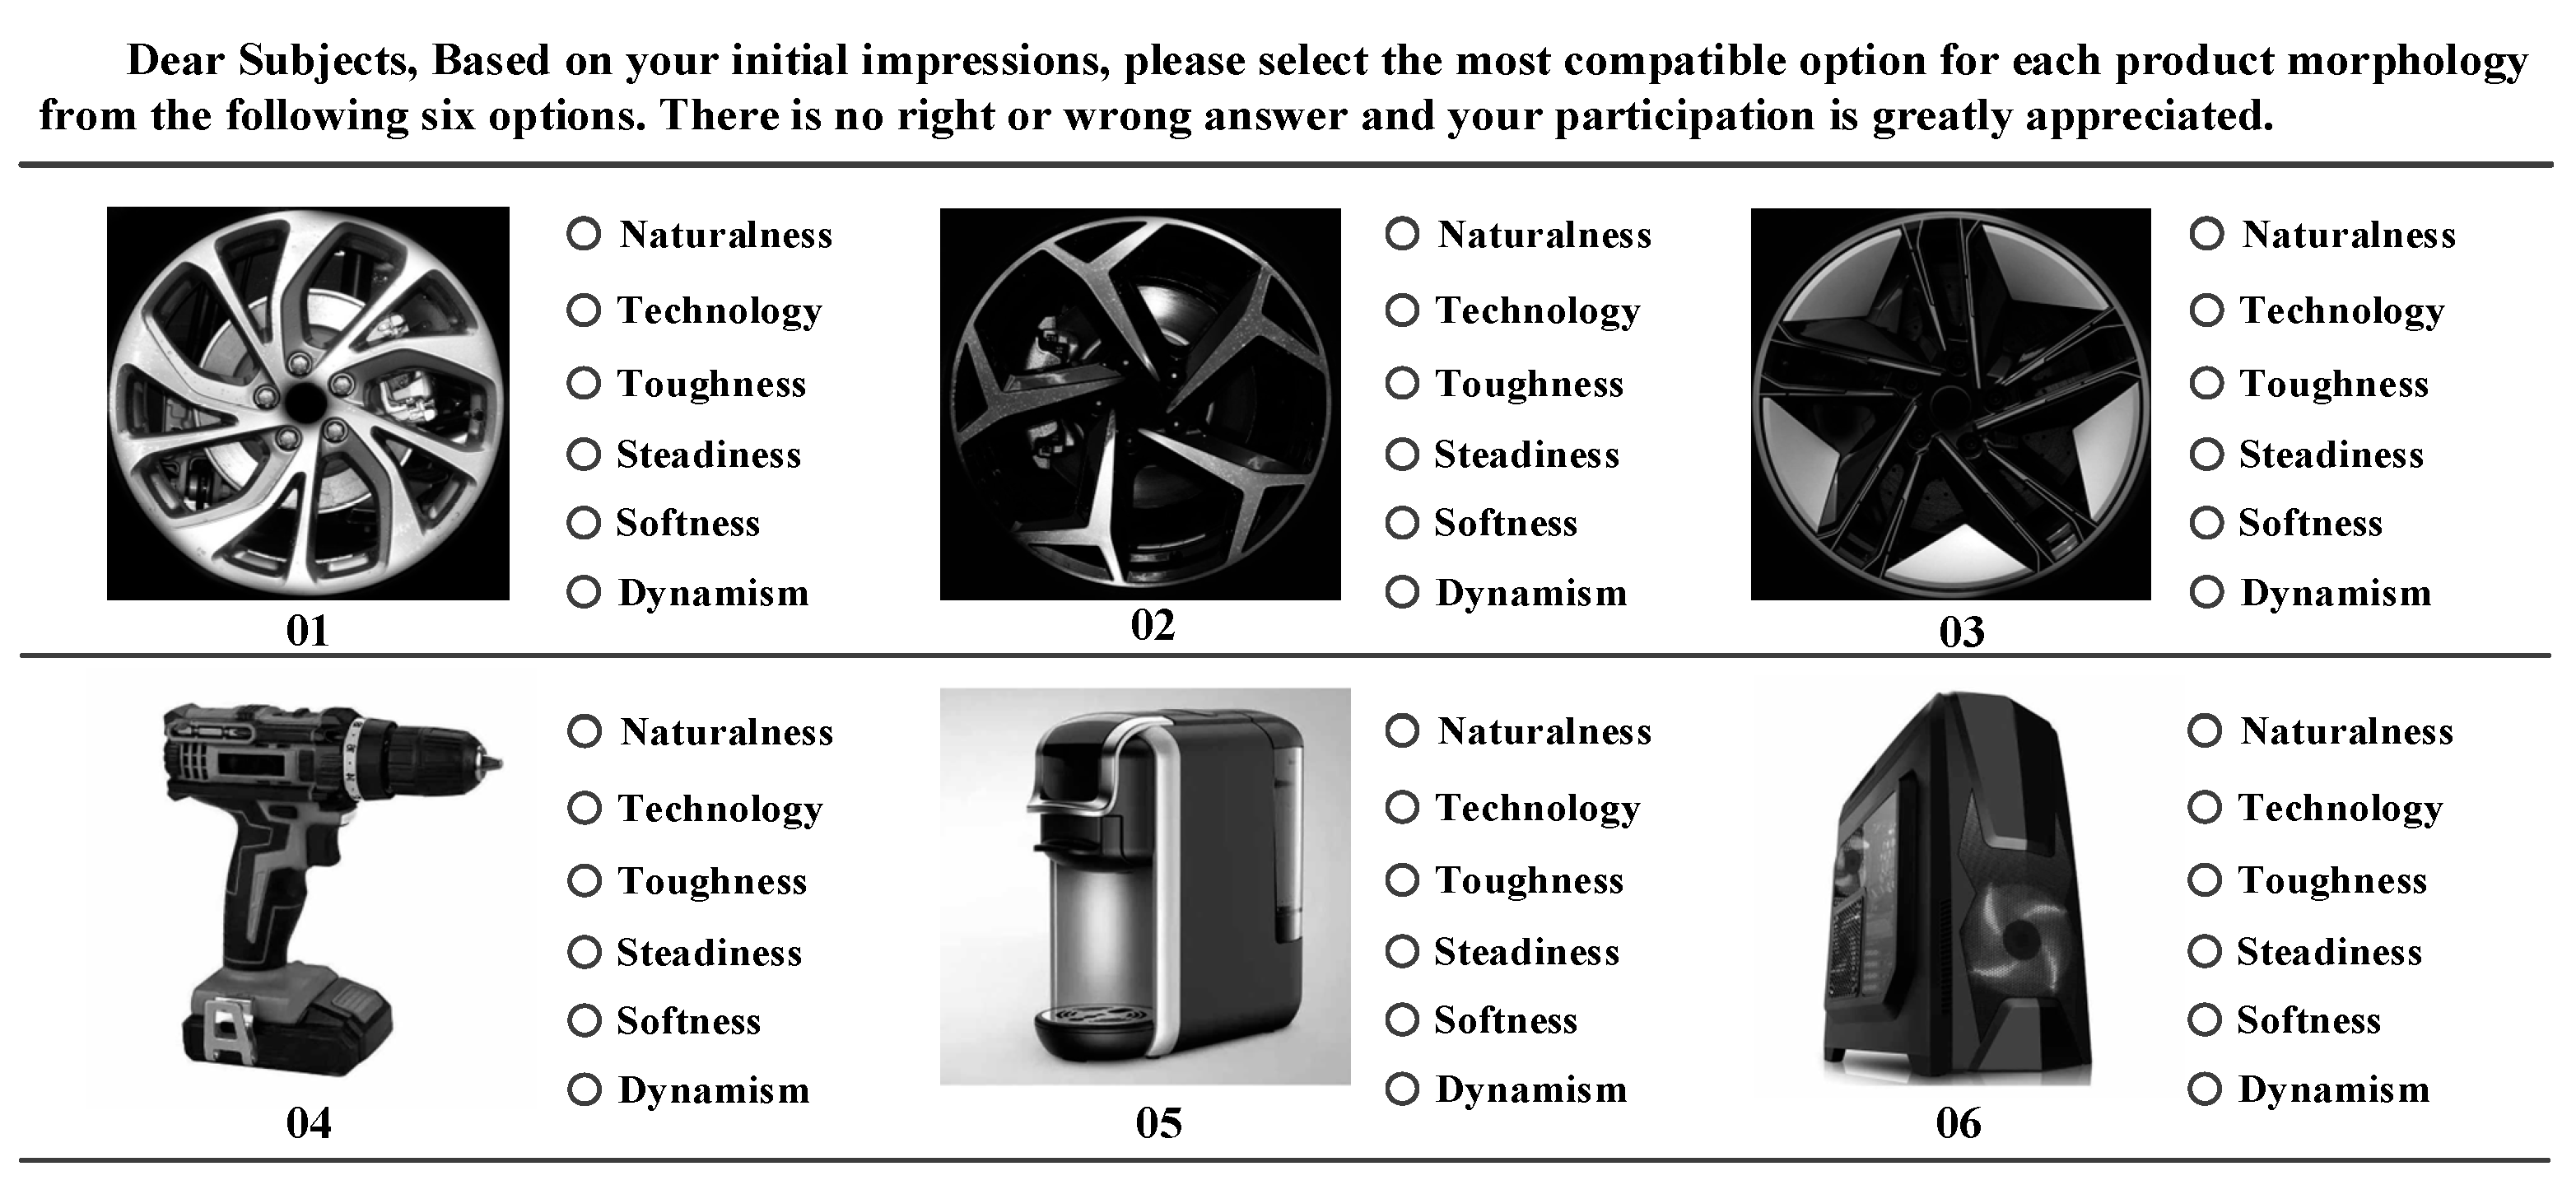
3.1.3. Experimental Design of User Preference Using a Three-Stage Semantic Differential (SD) Questionnaire Survey

To mitigate participant fatigue and potential bias arising from information overload in the SD questionnaire, we refined the six imagery style terms (Steady, Soft, Dynamic, Tough, Technological, Natural) into more accessible sensory descriptors (Naturalness, Technology, Toughness, Steadiness, Softness, Dynamism). Each respondent selected one term to best represent their perception. The design of the questionnaire is illustrated in Figure 3.
This study employed a three-phase approach to investigate 80 product form samples, ensuring comprehensiveness, accuracy, and diversity of data, as shown in Figure 2. In the first phase, an online SD questionnaire was used to survey images of wheel hubs numbered 01 to 20, providing a preliminary assessment of participants’ perceptions of specific product types and laying the groundwork for subsequent research. The second phase involved selecting 20 popular product forms, with image numbers ranging from 21 to 40, where user perceptions of different product types were collected through offline questionnaires to ensure practical value and representativeness of the results. In the third phase, eight representative industrial products were selected, with serial numbers ranging from 41 to 80, including 5 helmets, 5 coffee machines, 5 hairdryers, 5 humidifiers, 5 loudspeakers, 5 vases, 5 cars, and 5 lamps, resulting in a total of 40 samples, which were subsequently used for an offline user survey. This phase aimed to further refine and validate participants’ perceptions of diverse product forms, thereby enhancing the accuracy and comprehensiveness of the data.
The results were tallied after three different surveys, as shown in Figure 4:
Survey 1: As shown in Table 5, A total of 243 valid questionnaires were collected, comprising 119 males and 124 females. The results indicated that for the 15 samples with distinct morphologies, each top-scoring imagery style term clearly corresponded to a specific wheel hub morphology. However, for five other samples (numbers 03, 04, 14, 16, and 19) exhibiting more complex morphologies, two imagery style terms may have close scores, reflecting the ambiguity of these morphologies and customers’ subjectivity. This result suggests that while certain product forms have a clear semantic direction in user perception, the semantic perception of complex morphologies remains uncertain. Therefore, the visual curvature was adopted to better describe and distinguish the ambiguity of these morphologies.
Survey 2: An offline questionnaire survey was conducted with 20 adult males and 20 adult females. As shown in Table 6, over 82% of consumers hold fixed perceptions of certain product patterns. For instance, vases (numbered 32) are typically perceived as having a sense of naturalness, medical devices and kitchen utensils (numbered 23, 22, 25, 26, 29) are often associated with steadiness, whereas sneakers and helmets (numbered 21, 30) convey dynamism. However, perceptions of some household items were ambiguous and uncertain, possibly due to these products’ diverse usage scenarios affecting judgment. To further extract the common characteristics of diverse morphologies across different types of products, contour lines, edge transition angles, and visual directions are employed to distinguish morphological differences. This approach facilitates a clear understanding of consumer preferences.
Survey 3: This offline interview involved 40 participants (20 males and 20 females). Participants showed significant similarity in their overall perception and feature classification. A total of 90% of users tended to categorize products with various morphologies into unified style categories based on their overall impression. For instance, product forms with a sense of naturalness usually featured free curves, as shown in the first column of naturalness in Figure 4; product forms with a sense of toughness were dominated by angular straight lines, as shown in the third column of toughness in Figure 4; product forms with a sense of softness had large “R” chamfers and no sharp corners, as shown in the fifth column of softness in Figure 4; product forms with a sense of dynamism were characterized by overall asymmetry, and a strong sense of visual direction and instability, as shown in the sixth column of dynamism in Figure 4. The results indicate that users consider both the overall contour lines and detailed features of products to form a consistent style perception.

3.2. Constructing the NTTSSD Paradigms for Imagery Style Mapping Across Cross-Category Industrial Products

In product design, contour line (l) is used to describe the overall appearance of the product, combining key shape features such as curves, straight lines, folds, arcs, and slanted lines. It clearly defines the form and structure of the product, and the geometric features of the product can be visually conveyed through the contour line, helping the user to quickly understand its basic form. Another important feature is the edge transition angle (θ), which describes the angular characteristics of the product’s outer edges. Whether the edges are rounded or sharp directly affects the product’s visual impression and functional properties. Visual direction (d) emphasizes the product’s orientation and clarity in spatial layout. The representation of contour lines (indicated by red lines), edge transition angles (indicated by green lines), and visual directions (indicated by yellow arrows) across six imagery styles in product forms is shown in Figure 5. In the Naturalness style, the contour lines are predominantly composed of freeform curves. Edge transitions featuring large radii with an absence of sharp angles and no clear visual direction are observed. In the Technology style, the contour lines are mainly angular, comprising a mix of straight and curved segments. Edge transitions mostly consist of blunt angles, and a visual direction is present but not strongly emphasized. In the Toughness style, the contour lines are dominated by straight lines, with sharp edge transitions and a clearly defined, though not highly emphasized, visual direction. In the Steadiness style, horizontal and straight contour lines dominate. Edge transitions are characterized by small fillets or rounded corners, and obtuse angles are common. No clear visual direction is present. In the Softness style, contour lines are primarily composed of arcs. Edge transitions feature large radii and smooth curves, with no clear directionality. In the Dynamism style, contour lines combine flowing curves and diagonal lines, where edge angles are freely varied, and a strong visual direction emerges. Additionally, since complex shapes may appear ambiguous in user evaluations, visual curvature (k), an invariant feature for visual recognition of multi-scale images, is classified into high, medium, low, and zero curvature levels to improve the accuracy of product form description. Through the variations in visual curvature, product forms that are difficult to distinguish in human judgement can be distinguished more clearly, as shown in Figure 6.
Below is the formula for calculating the visual curvature, as described by Liu [71]:
K N , S v = π 0 N 1 # [ H a i ( s ( v ) ) ] N S
where s v represents the neighborhood of the point with width S on the curve, and # [ H a i ( s ( v ) ) ] represents the number of extreme points in the neighborhood s v of the point v on the height function H a i , regardless of whether the extreme point is extremely large or extremely small.
Four key visual morphological features—contour line (l), edge transition angle (θ), visual direction (d), and visual curvature (k)—are used to reveal changes in the characteristics of industrial product form. Each imagery style vocabulary varies along these four dimensions. We match the six key imagery style vocabularies—Naturalness, Technology, Toughness, Steadiness, Softness, and Dynamism (NTTSSD)—with each of these four dimensions to construct an NTTSSD paradigm for product form. This ultimately results in a semantic description framework as defined below:
N T T S S D = ( N a , T e , T o , S o , S t , D y )
where the NTTSSD paradigm is composed of Naturalness, Technology, Toughness, Steadiness, Softness, and Dynamism, and each style is represented by an initial letter and a second lowercase letter, e.g., Naturalness is represented by Na for its semantic meaning.
According to the above analysis, each morphological style can be represented as:
Y i = l i     θ i   d i     k i ,               i N a ,   T e , T o , S o , S t , D y
where l i ,   θ i ,   d i ,   a n d   k i   represent contour line (l), edge transition angle (θ), visual direction (d), and visual curvature (k) of the product form. By applying this framework, designers can systematically adjust the features l, θ, d, and k to achieve the desired imagery style Y i in alignment with user preferences.
For instance, these characteristics can be defined as:
Y N a = Free   curve   dominated   Large   arc   with   no   visible   sharp   corners   or   sharp   edges   No   clear   visual   direction { H i g h   c u r v a t u r e   a n d   g r e a t e r     f l u c t u a t i o n s }
and
Y T e = Folding   lines   are   dominant ,   supplemented   by   straight   and   curved   lines       Mainly   characterized   by   obtuse   angles   with   clear ,   distinct   angular   shapes   Directional   but   not   very   strong   { M o d e r a t e   c u r v a t u r e   b u t   w i t h   p r o n o u n c e d   f l u c t u a t i o n s }
Y T o = Straight   and   sharp   lines   dominated   O b t u s e   a n g l e s   p r e d o m i n a t e   a n d   t h e r e   a r e   c l e a r   a n g l e s Directional   but   not   very   strong Smaller   curvature   with   abrupt   fluctuations
Y S o = Circular   arcs   dominate   Rounded   corners   and   large   R-angles No   clear   visual   direction { L o w   a n d   a l m o s t   c o n s t a n t   c u r v a t u r e }
  Y S t = Horizontal   and   vertical   lines   predominate   A n g l e s   r a n g e   f r o m   a c u t e   t o   f l a t ,   w i t h   s m a l l   c h a m f e r s   b e i n g   c o m m o n No   clear   visual   direction Low   curvature   and   fluctuation   followed   by   stabilization
Y D y = Dynamic   curves   and   slopes   dominated N o   c l e a r   a n g l e   r e s t r i c t i o n ,   v a r i e d   p e r s p e c t i v e s Strong   visual   direction { H i g h   c u r v a t u r e   a n d   l a r g e   f l u c t u a t i o n s }
In this paper, customer-perceived product form is summarized in the semantic rule sets (9) to (14). A judgement about which style a morphology belongs to is made in the order of contour line (l), edge transition angle (θ), visual direction (d), and visual curvature (k). If the first rule can be used to make a decision, there is no need to check subsequent rules. However, the fuzzy criterion for evaluating morphological styles presents significant challenges in comprehensively quantifying them. Deep learning models after being pre-trained can automatically make the right decisions if the test cases are within the same subject of the training objects, which can improve the efficiency of identifying and understanding complex stylistic features. Therefore, this paper annotates a large-scale dataset based on the NTTSSD paradigms to extract visual forms that align with the perception of most consumers. Subsequently, deep learning models are used to learn and extract complex visual feature patterns from these data, helping designers more accurately understand and optimize product forms.

3.3. Constructing the Dataset Based on the NTTSSD Paradigms

In this study, product form images were collected from 20 of the most common product categories on the market, including wheel hubs, cars, helmets, hairdryers, humidifiers, drills, lamps, vases, chairs, coffee machines, shoes, loudspeakers, swivel chairs with five-star bases, computer mice, air fryers, rice cookers, medical devices, ovens, washing machines, and refrigerators. This study focuses on the product form characteristics while excluding other factors, such as color and texture. Therefore, all collected images were converted to 640 × 640-pixel grayscale images, with prominent logos and complex backgrounds removed to minimize visual interference. To ensure the reliability of the annotation process in the NTTSSD paradigms, we randomly selected 10% of the dataset (a total of 860 images) for secondary review by four experts with over 10 years of experience in industrial product design, along with four master’s candidates specializing in industrial design. The reviewers evaluated the consistency between the style labels and the corresponding target form features. To ensure a balanced data distribution, we divided the complete annotated dataset of 8604 images into six categories, then randomly split them into training, validation, and test sets at an 8:1:1 ratio (as shown in Figure 7).

4. Imagery Style Evaluation (ISE) Method for Cross-Category Industrial Product Forms

A total of 20 types of industrial product form images were used as inputs to the deep learning model and six categories of imagery style vocabularies from the NTTSSD paradigms were output. An enhanced YOLOv5 model was trained and tested to develop an Imagery Style Evaluation (ISE) method for product forms. The experiment was compiled under the Python 3.8 and PyTorch 1.8 framework on an NVIDIA GeForce GTX 1660Ti GPU. The training process involved 400 epochs with 640 × 640 pixel images and a batch size of 4. Stochastic Gradient Descent (SGD) was chosen as the optimizer, with the warmup and weight decay parameter set to 0.01 and 5 × 10⁻⁴, respectively. A confidence threshold of 0.5 was applied. The Intersection over Union (IoU) threshold was set to 0.45.

4.1. Constructing an Enhanced YOLOv5 Deep Learning Network for Imagery Style Evaluation

The deep learning architecture of the YOLOv5s network was chosen to construct an evaluation network structure for the imagery style of industrial product forms. However, it was found that misjudgments often occur for the original YOLOv5s network model. This issue arose because the model mistakenly identified small local elements as features while overlooking key features in the images.
To solve this problem, a Convolutional Block Attention Module (CBAM) [72] was integrated into the Backbone network of the original YOLOv5s to capture key morphological features. Figure 8 illustrates the architecture of the CBAM attention mechanism. First, the feature map P is input into the Channel Attention Module to obtain the channel weights, which are then multiplied with the input feature map P to generate the intermediate feature map p′. Next, p′ is fed into the Spatial Attention Module to obtain the spatial weights, which are subsequently multiplied with p′ to produce the final weighted feature map p″. The process can be expressed mathematically as follows:
P = M c ( P ) P
P = M s ( P ) P
M c P = σ ( M L P A v g P o o l P + M L P A v g P o o l P = σ ( W 1 W 0 P a v g c + W 1 ( W 0 ( P m a x c ) ) )
M s P = σ ( f i × i A v g P o o l P ; M a x P o o l P ) = σ ( f i × i ( P a v g s ; P m a x s ) )
where P is the feature map, and M c and M s denote the Channel Attention Module and Spatial Attention Module. ⊗ denotes the multiplication of elements, σ is a sigmoid operation, f i × i denotes a convolution operation with a convolution kernel of size i × i , W 0 and W 1 denote two convolution operations, P a v g c and P a v g s   denote average pooling, P m a x c   and P m a x s denote maximum pooling, and Multilayer Perceptron (MLP) represents the process of channel downgrading and then recovering.
Furthermore, variations in local chamfering in product form design can influence different imagery styles. In the original YOLOv5 deep network, shallow feature layers have a smaller receptive field compared to deeper layers, which enables them to extract more detailed features and better detect small, critical regions in the image. To address this issue, the YOLOv5s model is modified by changing the input channel to layer 13 from layer 17 to the first Conv layer in the Head module. This adjustment allows lower-level semantic features from the Neck structure to be directly recognized as local morphology, thereby reducing information loss of shallow features during convolution.
The Head section uses the Complete Intersection over Union (CIoU) loss function, which integrates the center point distance, aspect ratio, and overlapping area for more precise bounding box regression. This loss function enhances the accuracy of localization and evaluation of key feature areas in industrial product forms, thereby improving the overall performance of the model. The calculation formula is as follows:
C I o U L o s s = 1 ( I o U D i s t a n c e _ 2 2 D i s t a n c e _ C 2 V 2 1 I o U + V ) V = 4 π 2 ( a r c t a n w g t h g t a r c t a n w p h p ) 2 I o U = D e t e c t i o n R e s u l t   G r o u d T r u t h D e t e c t i o n R e s u l t   G r o u d T r u t h
where C is the minimum outer rectangle, D i s t a n c e _ C 2 is the diagonal distance, D i s t a n c e _ 2 2 is the Euclidean distance between the centers, and w and h are the width and height scales of the bounding box, respectively. The Intersection over Union (IoU) measures the overlap between the predicted bounding box and the ground truth box, defined as the ratio of their overlapping area to their union area. Higher IoU values indicate more accurate evaluation results.
Subsequently, Non-maximum Suppression (NMS) is applied to remove redundant detections and retain the local maxima, which aids in making the most accurate category decision for the NTTSSD paradigms. As shown in Figure 9, the YOLOv5 algorithm is enhanced by incorporation of CBAM into the shallow feature fusion branch, resulting in a customized YOLOv5 network architecture for the ISE method.

4.2. Testing and Comparative Analysis of the Imagery Style Evaluation Model

This paper employs several metrics to evaluate model performance, including Precision (P), Recall (R), F1-score, Frames Per Second (FPS), Average Precision (AP), and mean Average Precision (mAP). The F1-score, being the harmonic mean of precision and recall, provides a comprehensive assessment of model quality. FPS indicates the model’s real-time processing speed. AP measures the model’s effectiveness in detecting specific categories, while mAP reflects the overall performance of the detection model.
This experiment aims to assess the enhanced YOLOv5 model within the ISE method for evaluating the imagery style of various product forms. Figure 10 presents the loss convergence curves of both the enhanced YOLOv5 model and the original YOLOv5 model. Starting from epoch 0, the loss values consistently decrease and gradually stabilize as training approaches approximately 350 epochs. Therefore, this study employs the weights obtained after 400 training iterations for the enhanced YOLOv5 model. Figure 11 shows the results of the enhanced YOLOv5 model. During testing, the Precision-Recall curve gradually approaches 1, and the confidence score associated with the F1 curve also approaches 1. Additionally, the mAP@0.5 across all categories reaches 0.861. These results indicate a strong positive correlation between product forms that align with user emotional preferences and the model’s performance in the test set.
As shown in Figure 12, the confusion matrix of imagery styles in the test set demonstrates how semantic similarity influences misclassification rates. Semantically opposite imagery style pairs, such as “Dynamism (Dy)” vs. “Steadiness (St)”, “Softness (So)” vs. “Toughness (To)”, or “Naturalness (Na)” vs. “Technology (Te)”, exhibit relatively low misclassification rates. In contrast, due to complex and ambiguous associations in product form features, “Dynamism (Dy)” is often misclassified as “Technology (Te)”, “Softness (So)” as “Steadiness (St)”, and “Toughness (To)” as “Technology (Te)”. Among these, “Toughness (To)” exhibits the highest misclassification rate, primarily because it shares overlapping and ambiguous semantic characteristics with both “Technology (Te)” and “Steadiness (St)”, which makes it more difficult for the model to distinguish accurately. The confusion matrix further validates the consistency between the model’s recognition and human visual perception. As revealed in the user preference survey (Section 3.1.3), morphological features of different imagery styles can be ambiguous or overlapping in certain scenarios, thereby affecting perceptual consistency. This is especially challenging for designers with limited experience, who may struggle to differentiate nuanced imagery styles in product forms. Therefore, incorporating diverse user preference data during model training not only helps mitigate individual subjective bias but also enhances the model’s capacity to distinguish complex morphological features across styles.
Traditional design evaluation methods (such as expert scoring and user surveys) played an important role in early research. However, their limitations have been systematically summarized in the literature [73]. These methods require repeated, time-consuming, and labor-intensive investigations for each product category, with low reusability of results, leading to low efficiency and poor scalability. In the field of product design evaluation, Support Vector Machines (SVM) remains a commonly used machine learning approach. However, its applicability is relatively limited. As noted in [13,14], SVM performs well only in scenarios involving small sample sizes with clearly defined product characteristics, but its effectiveness declines significantly in contexts involving multiple categories with ambiguous attributes.
The comparative analysis presented in Table 7 evaluates model performance under standardized experimental conditions and identical datasets. Compared to the original YOLOv5, the enhanced YOLOv5 achieves a 4.9% improvement in mean Average Precision (mAP) and a 6% increase in F1-score, with almost no increase in inference time. When compared with the more advanced YOLOv10 model, the enhanced YOLOv5 still outperforms in terms of mAP (+1.4%) and F1-score (+2%), while delivering significantly better inference efficiency. Notably, the enhanced YOLOv5 demonstrates substantial superiority over the SVM model, achieving a 34.1% increase in mAP and an 88.6% boost in Frames Per Second (FPS). These results indicate that the enhanced YOLOv5 not only offers excellent performance stability and testing efficiency but also provides strong technical support for intelligent and scalable evaluation of imagery styles in industrial product forms.

4.3. Testing the Generalization Ability of the ISE Model on Different Industrial Products

4.3.1. Experimental Program

To comprehensively demonstrate the applicability of the ISE method, this study evaluates two sets of product form images to verify the positive correlation between customer-perceived imagery style and the imagery style assessed by the deep learning model. Group A images contain 20 types of industrial products from the enhanced YOLOv5 testing sets, including car wheel, car, helmet, hairdryer, humidifiers, drill, lamps, vases, chairs, coffee machines, shoes, loudspeaker, swivel chairs with five-star bases, computer mice, air fryer, rice cooker, medical device, oven, washing machine, and refrigerator. Group B images include another 20 types of industrial products such as mugs, cameras, watches, water coolers, shavers, water bottles, printers, headphones, projectors, irons, trash, exercise bikes, and luggage. The study uses the root mean squared error (RMSE) for evaluation, as expressed in the following formula:
R M S E = i = 1 n ( y i y ^ i ) 2 n
where y i is the imagery style value given by customer perception for product form, y ^ i represents the style value obtained from the model test using the ISE method, i is the test sample number, and n denotes the total number of evaluated samples. If there is no difference between these two values, the RMSE approaches 0; otherwise, a higher RMSE value indicates a greater discrepancy.

4.3.2. Validation Results and Analysis

The RMSE calculated according to Equation (20) for the ISE method is 0.26, as shown in Table 8. This indicates that the evaluation model effectively captures and represents consumers’ perceptions of product form in terms of visual appearance and design factors. Despite the subjectivity and complexity of morphological aesthetic factors, the deep learning network effectively identifies discriminative key features from visual data. It is worth noting that, as shown in Figure 13, this study presents the evaluation results of the imagery styles of selected product forms through a comparative experiment (Group A: known categories; Group B: unseen categories, including both successful and failed cases). The predicted imagery styles are indicated by colored borders: red (Dynamism), green (Steadiness), orange (Softness), yellow-green (Toughness), yellow (Technology), and pink (Naturalness). Through a systematic qualitative analysis, this study explores the key factors influencing the model’s imagery style evaluations, identifying three critical dimensions:
(1)
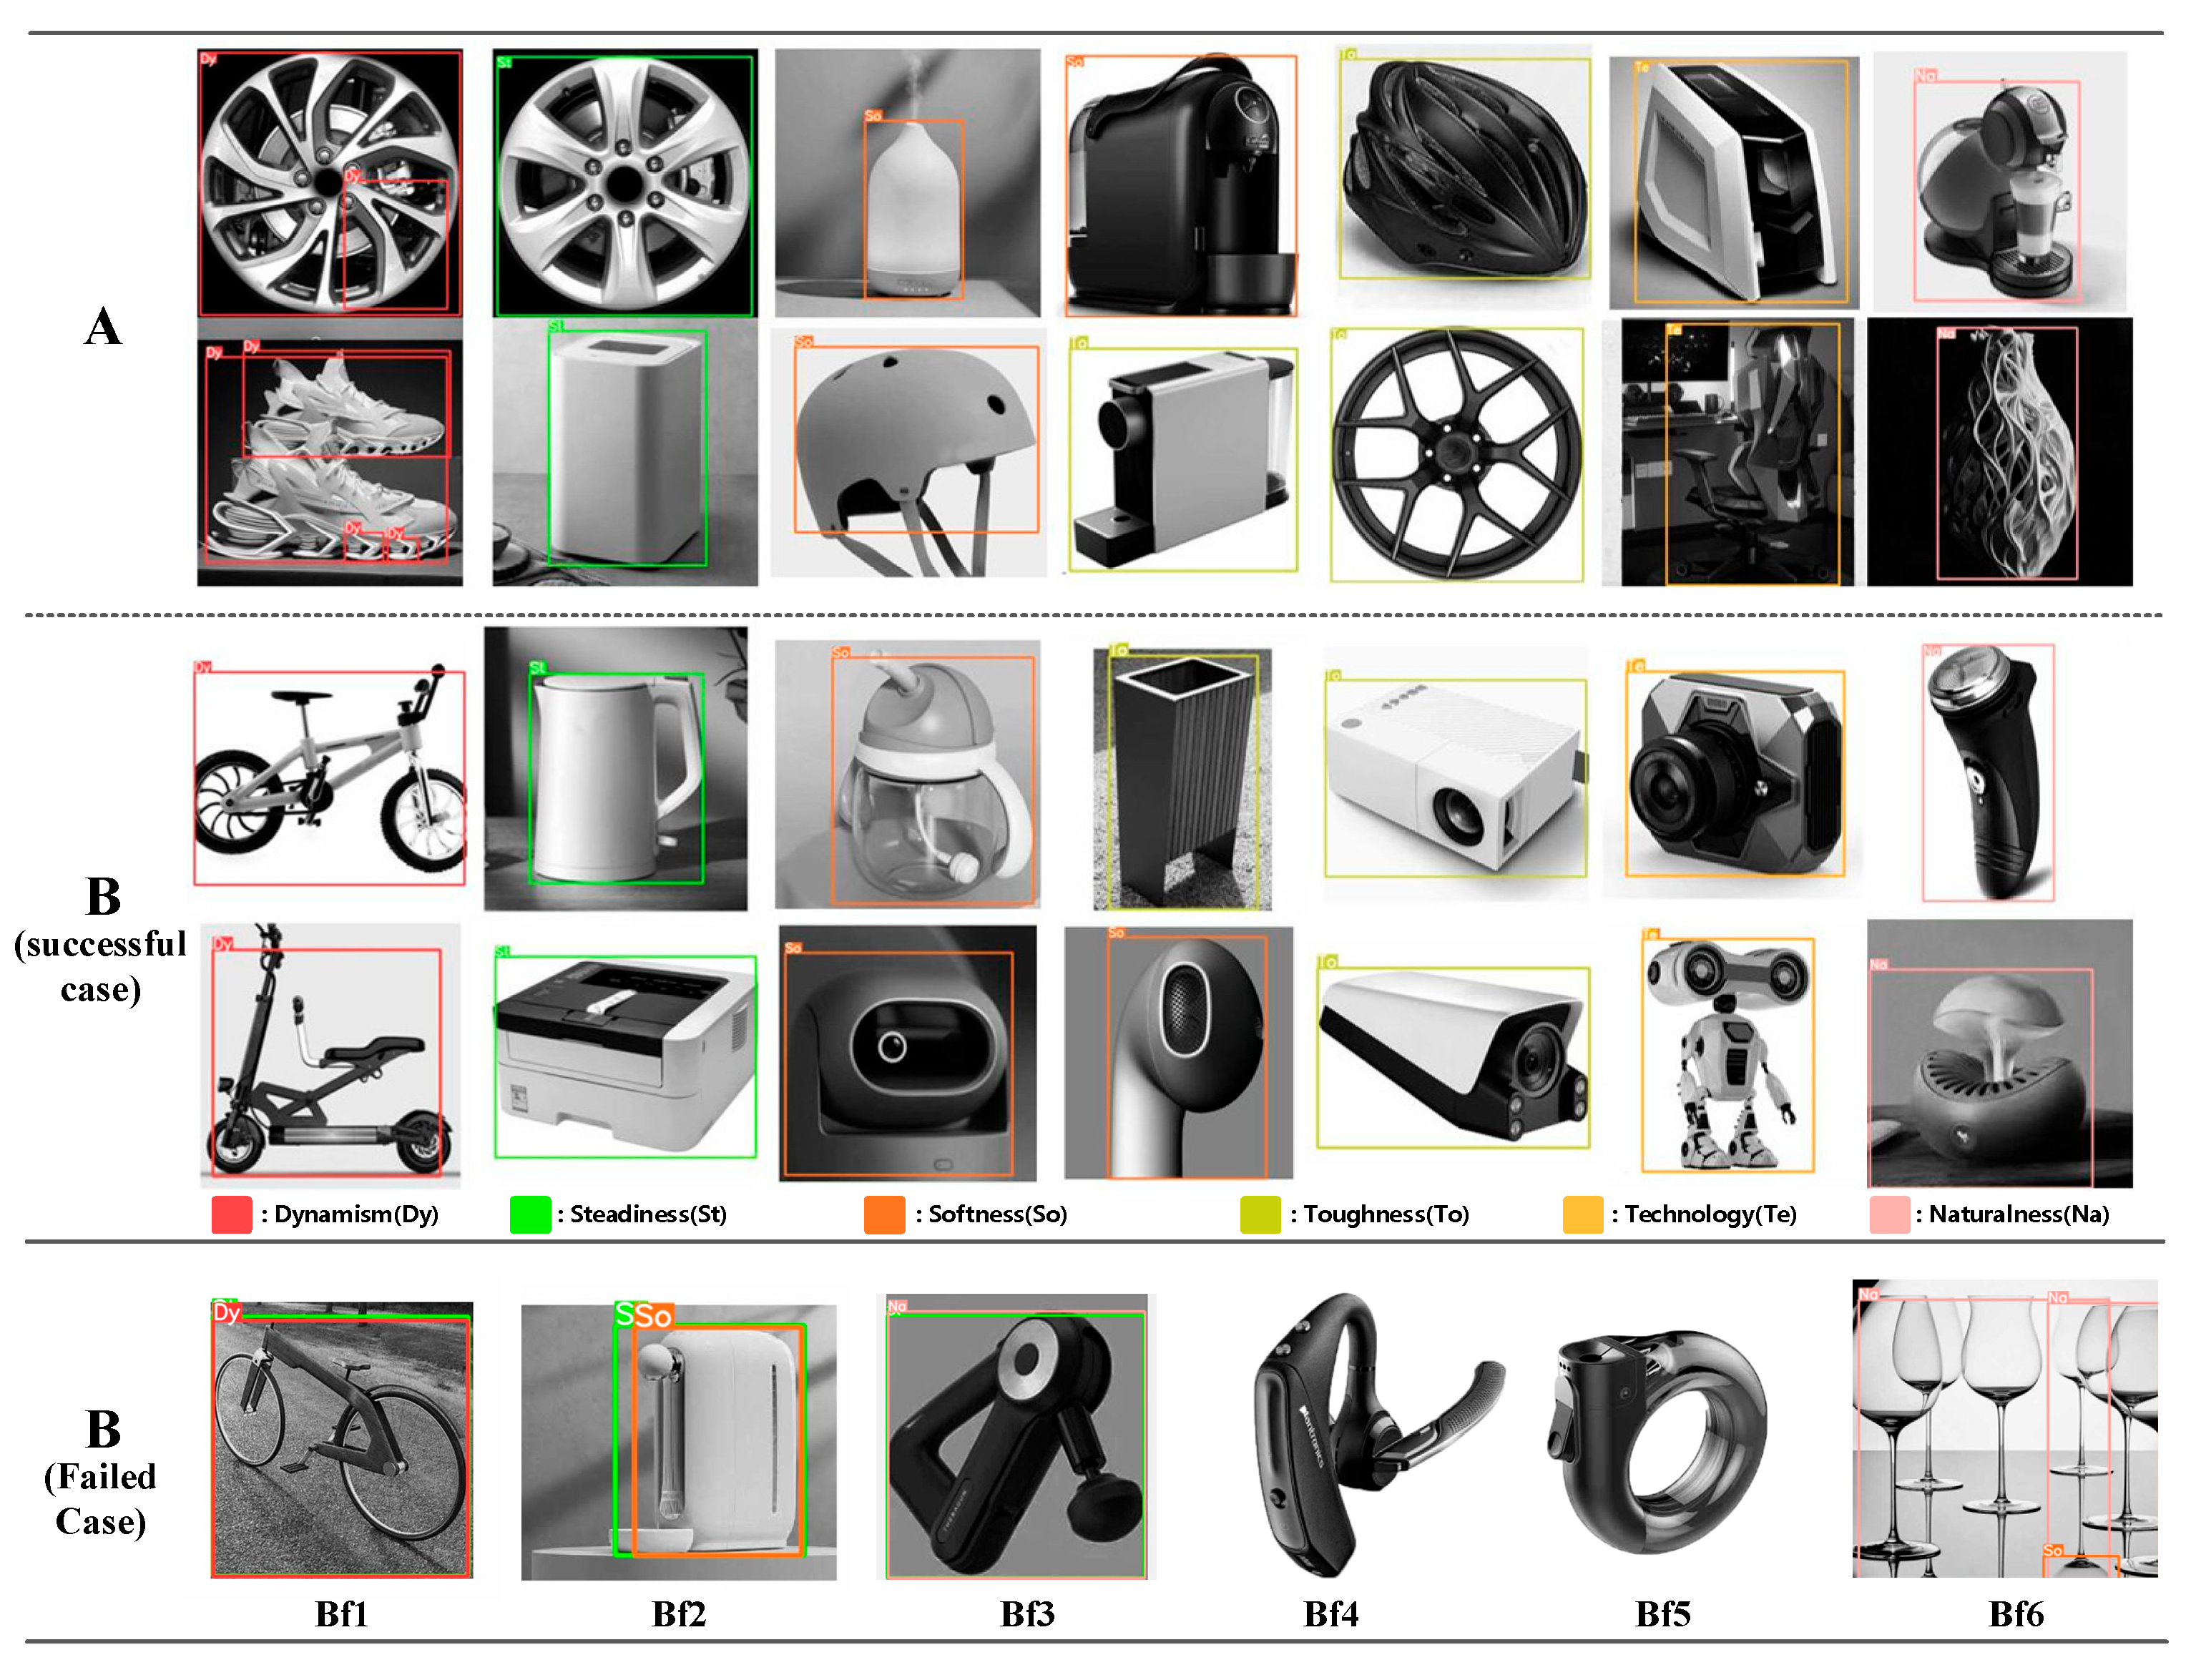
Coupling the effect of feature distinguishability and background interference: When the product has a simple structure and highly distinguishable features (e.g., a trash bin with sharp lines and a rigid form, or headphones with smooth, rounded edges), the model can accurately evaluate the imagery style regardless of background complexity. In contrast, when the structure is complex and features are ambiguous (e.g., cases Bf1, Bf2, Bf3), the model tends to misclassify the imagery style even against a simple background, due to overlapping or conflicting stylistic cues.
(2)
Structure-feature balance under background-free conditions: For complex products with homogeneous and dominant features (e.g., bicycles, robots), the model can effectively extract and evaluate key stylistic traits. However, for products with simple structures but conflicting features (e.g., cases Bf4 and Bf5), the model struggles due to semantic interference among competing stylistic signals, leading to ambiguous or incorrect predictions.
(3)
Feature competition in multi-object scenes: Products with complex structures and salient features (e.g., electric shavers, projectors) can still be correctly evaluated even with simple or cluttered backgrounds. However, in scenes containing multiple objects—even if each object has a simple and clear structure (e.g., case Bf6)—feature overlap and competition between objects introduce significant noise, often resulting in inconsistent or inaccurate assessments.
In summary, the combination of product structural complexity, the distribution of salient features, background complexity, and scene composition all significantly influence the accuracy of the model’s imagery style evaluations.

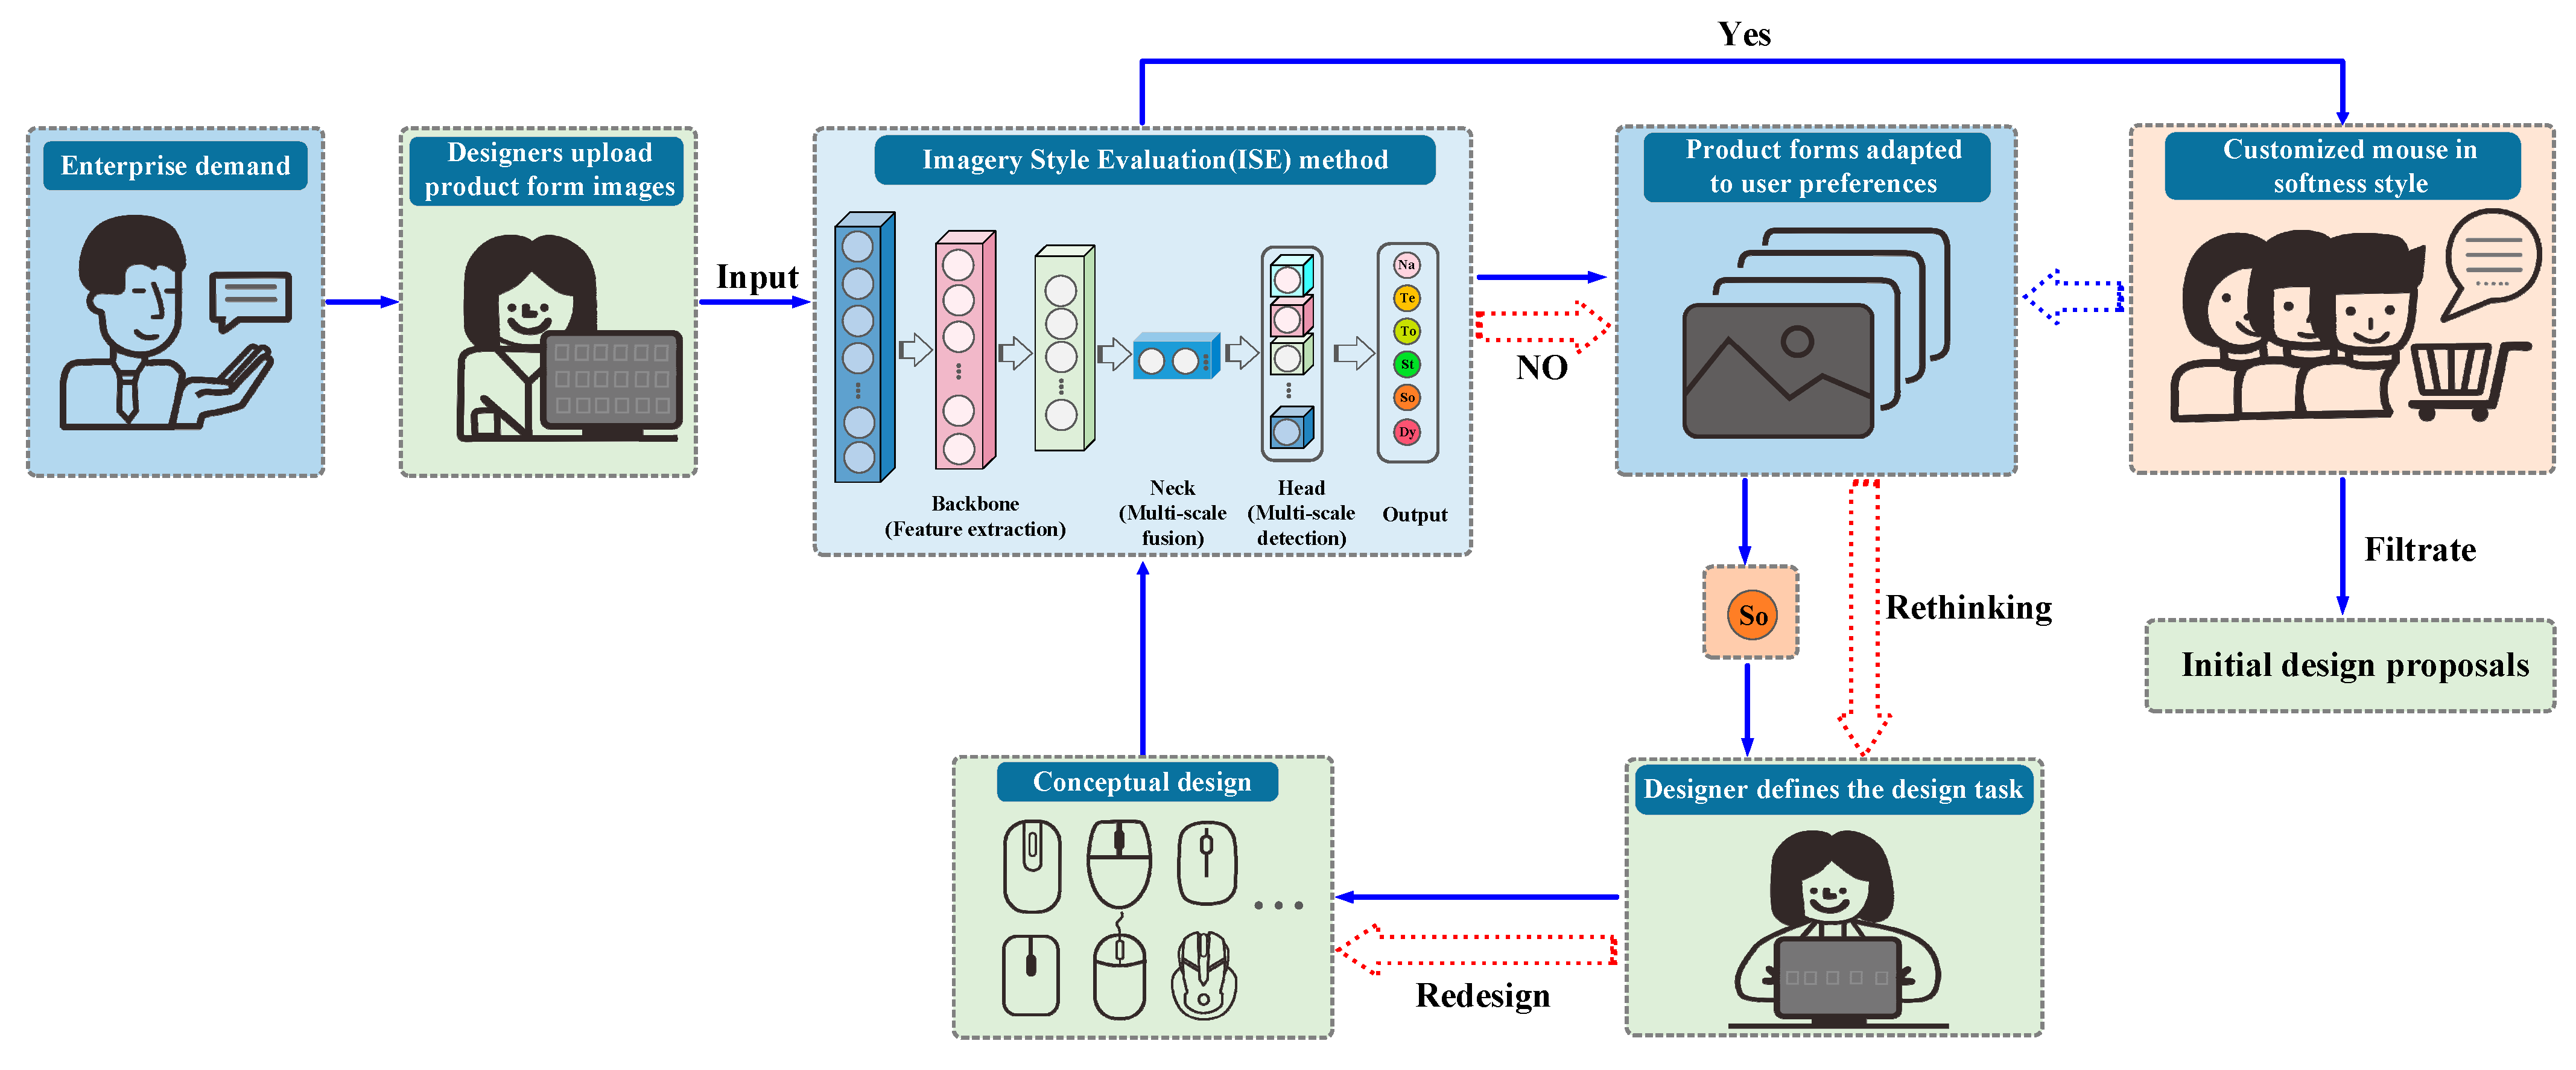
4.4. Product Form Design Decision Process Based on ISE Method

In traditional industrial product design workflows, the development cycle is often prolonged, typically taking several weeks to months to complete stages such as market research, needs analysis, concept design, and review. Generally, the strategic department first conducts user demand research and analysis, then communicates the results to the design department. Designers, based on this input, generate multiple (typically 3 to 5) initial design proposals, which are then evaluated and screened through cross-departmental collaboration. However, this coordination is prone to delays at individual stages, significantly extending the overall development timeline.
As illustrated in Figure 14, the ISE method proposed in this study provides a streamlined approach to facilitate decision-making during the early concept design phase and improve overall efficiency. In this workflow, enterprises can adopt the image-style-based database constructed in this study or build an internal database using historical market feedback and product form data. Upon receiving a design request from the marketing department (e.g., developing a mouse with specific functions and stylistic tendencies), designers can collect and upload representative product images that reflect their interpretation of the intended style into the ISE system. This step helps verify whether their style understanding aligns with the preferences of the target user group. Based on the ISE system’s feedback regarding user preference fit, designers can further refine design goals and tasks and develop multiple concept proposals accordingly. These initial proposals do not need to be immediately subjected to interdepartmental review. Instead, designers can first reassess them using the ISE method to analyze how well they match user preferences. If the model’s output indicates alignment with both user expectations and company design objectives, the screened concepts can proceed to the next stage of evaluation. Otherwise, the design direction can be redefined and alternative concepts generated and validated.
Combined with the ISE method, the design process gains the capability to identify and correct directional biases early on, thereby reducing the risk of delays caused by initial misjudgments or excessive cross-functional communication. This not only shortens the concept design phase but also allows more time for detailed development and technical validation, ultimately improving both design quality and interdepartmental collaboration.

5. Feature Visualization of the Imagery Style Evaluation Method

5.1. Visualization Technique

To visually demonstrate the effectiveness of the ISE method, the regions of interest in the NTTSSD paradigms are illustrated by the feature maps of each layer and the Gradient-weighted Class Activation Mapping (Grad-CAM) technique. The implementation process of the Grad-CAM technique [74] is shown in Figure 15. The original image is firstly forward-propagated through the network to obtain the feature maps A. Then, by backpropagating the prediction value y c of category c , the gradient information A’ of the feature maps A is obtained. Next, the gradients A’ are averaged over w and h to determine the importance of each channel within the feature maps A. Finally, the weighted sum is computed and passed through ReLU to obtain Grad-CAM.
The calculation formulas for Grad-CAM are as follows:
L G r a d C A M c = R e L U ( k a k c A k )
a k c = 1 Z i j y c A i j k
where A represents the last convolutional output feature maps, k represents the Kth channel in feature maps A , c denotes category c,   A k represents the data of channel k in feature map A ,   a k c represents the weight associated with A k ,   y c   represents the score predicted by the network for the category,   A i j k represents the data of feature map A in channel k at the position of coordinate (i,j), and Z equals the product of the width and height (w × h) of the feature map.

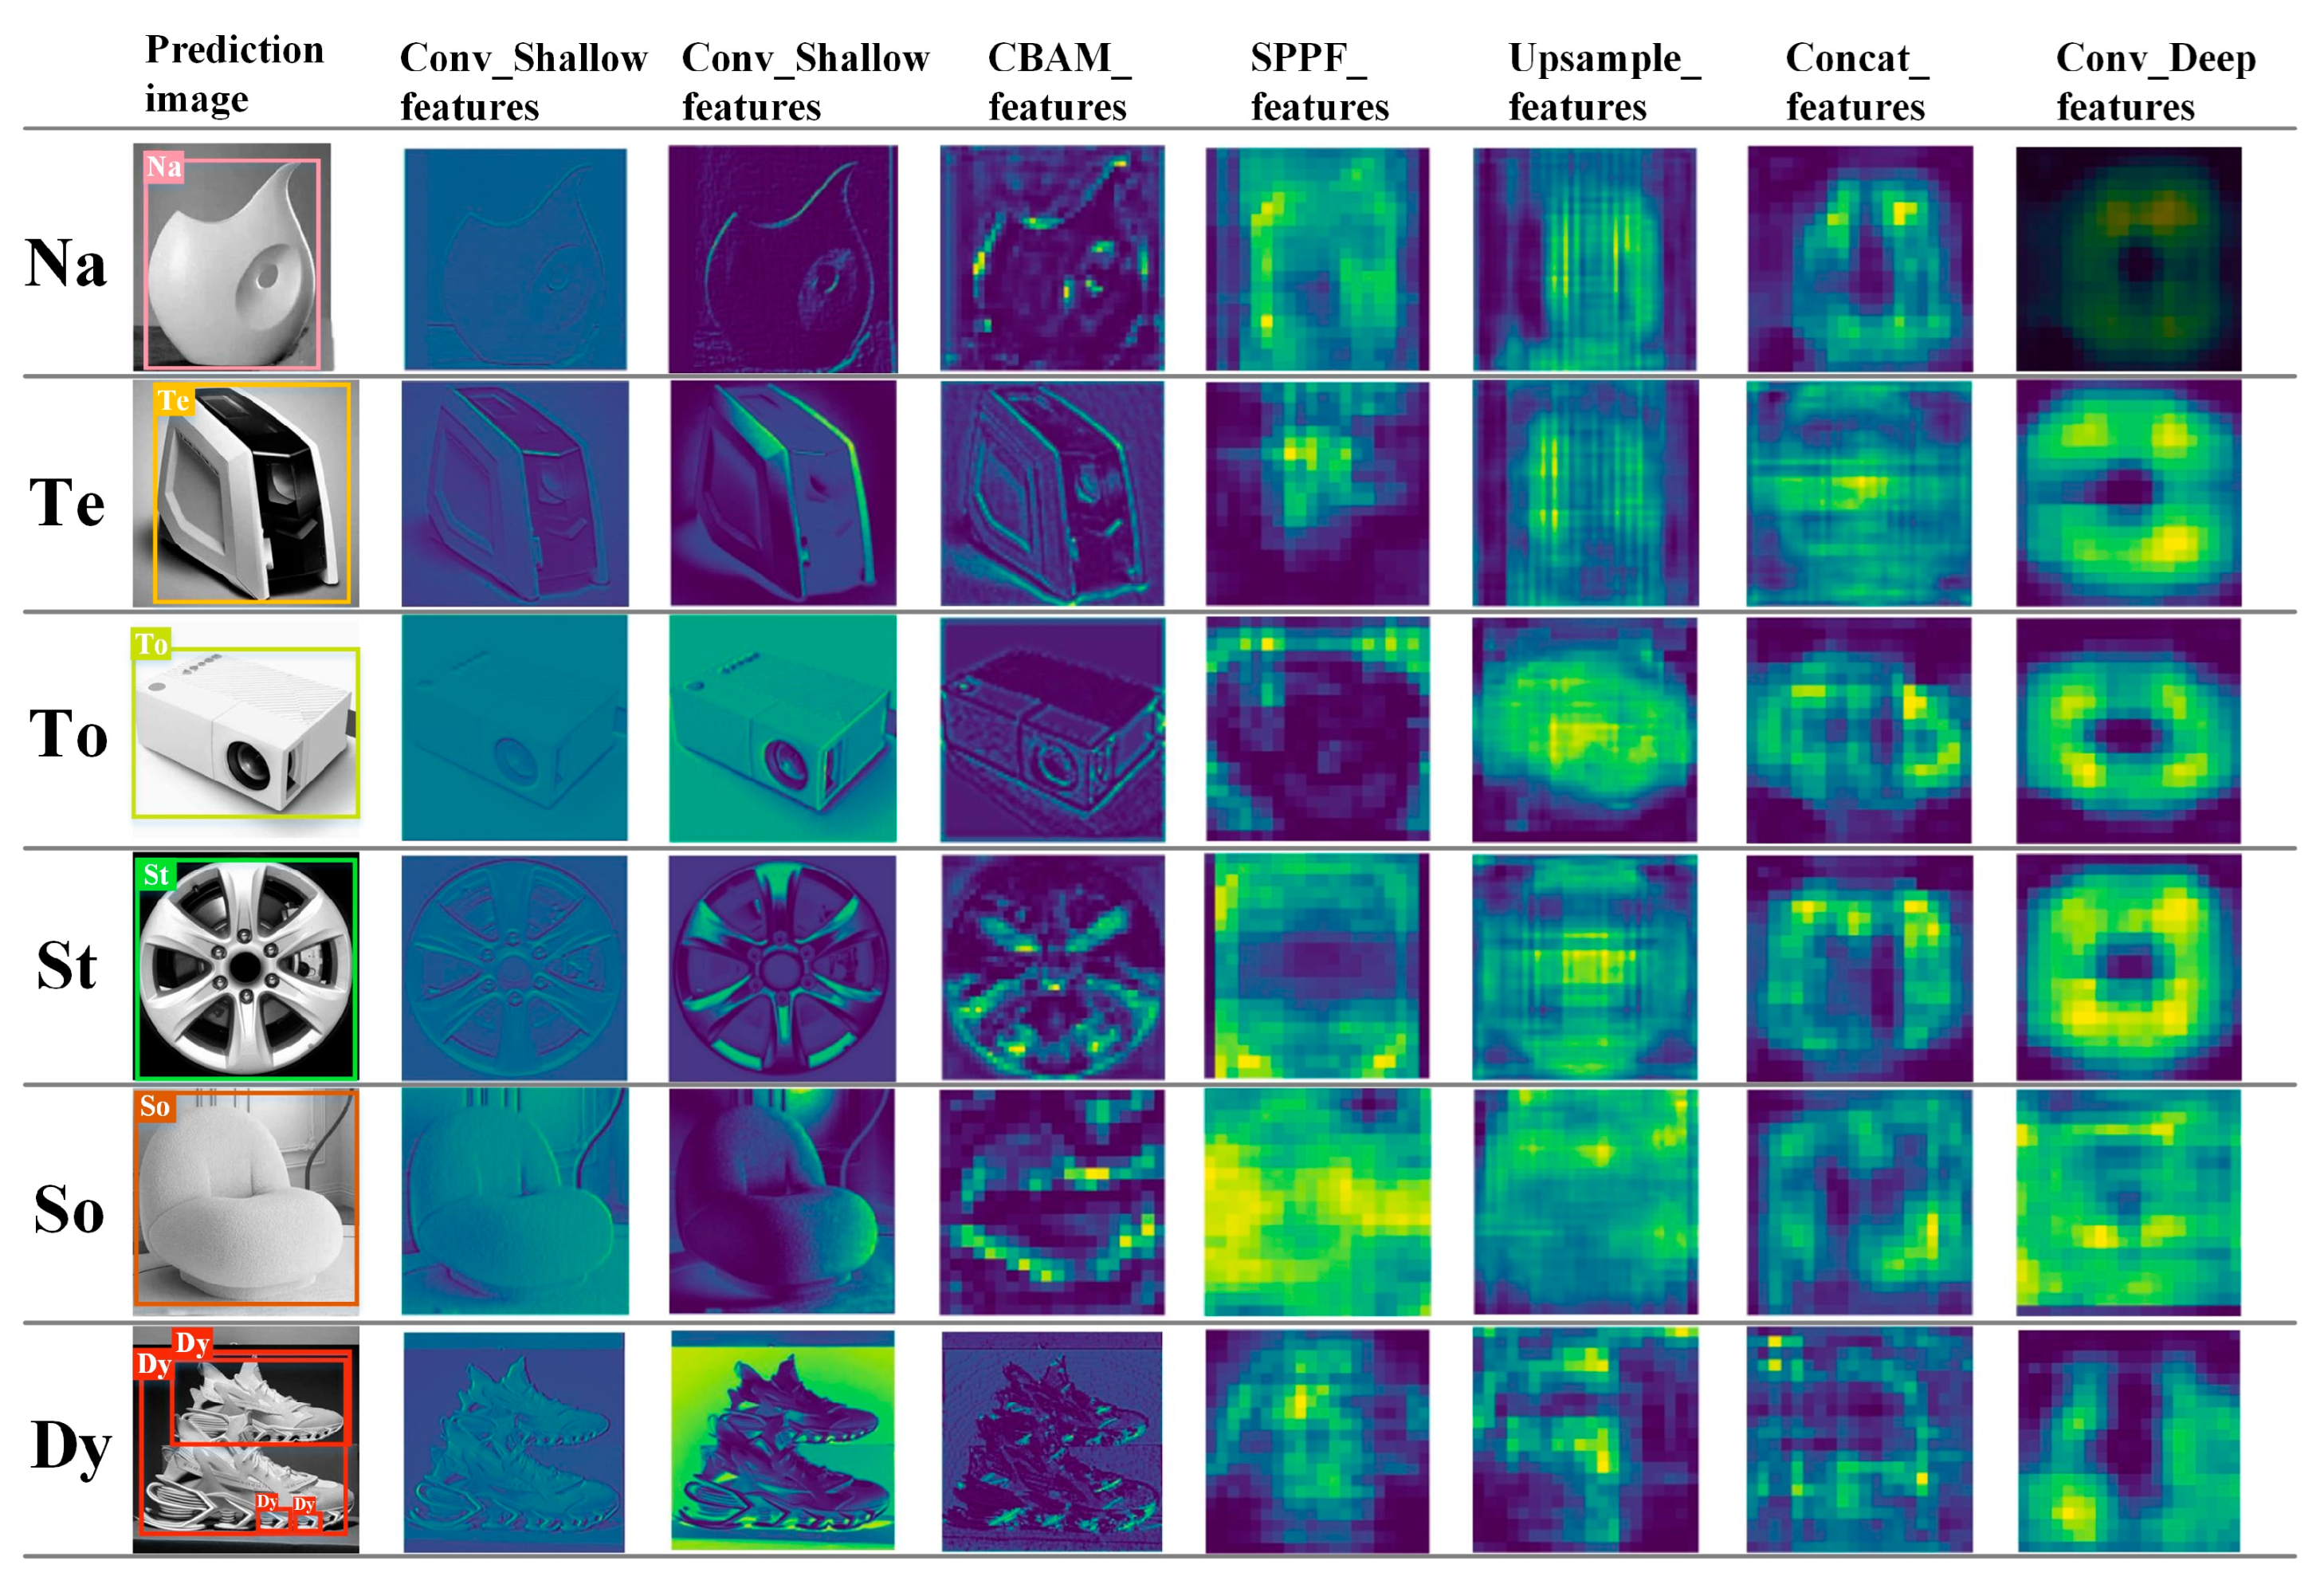
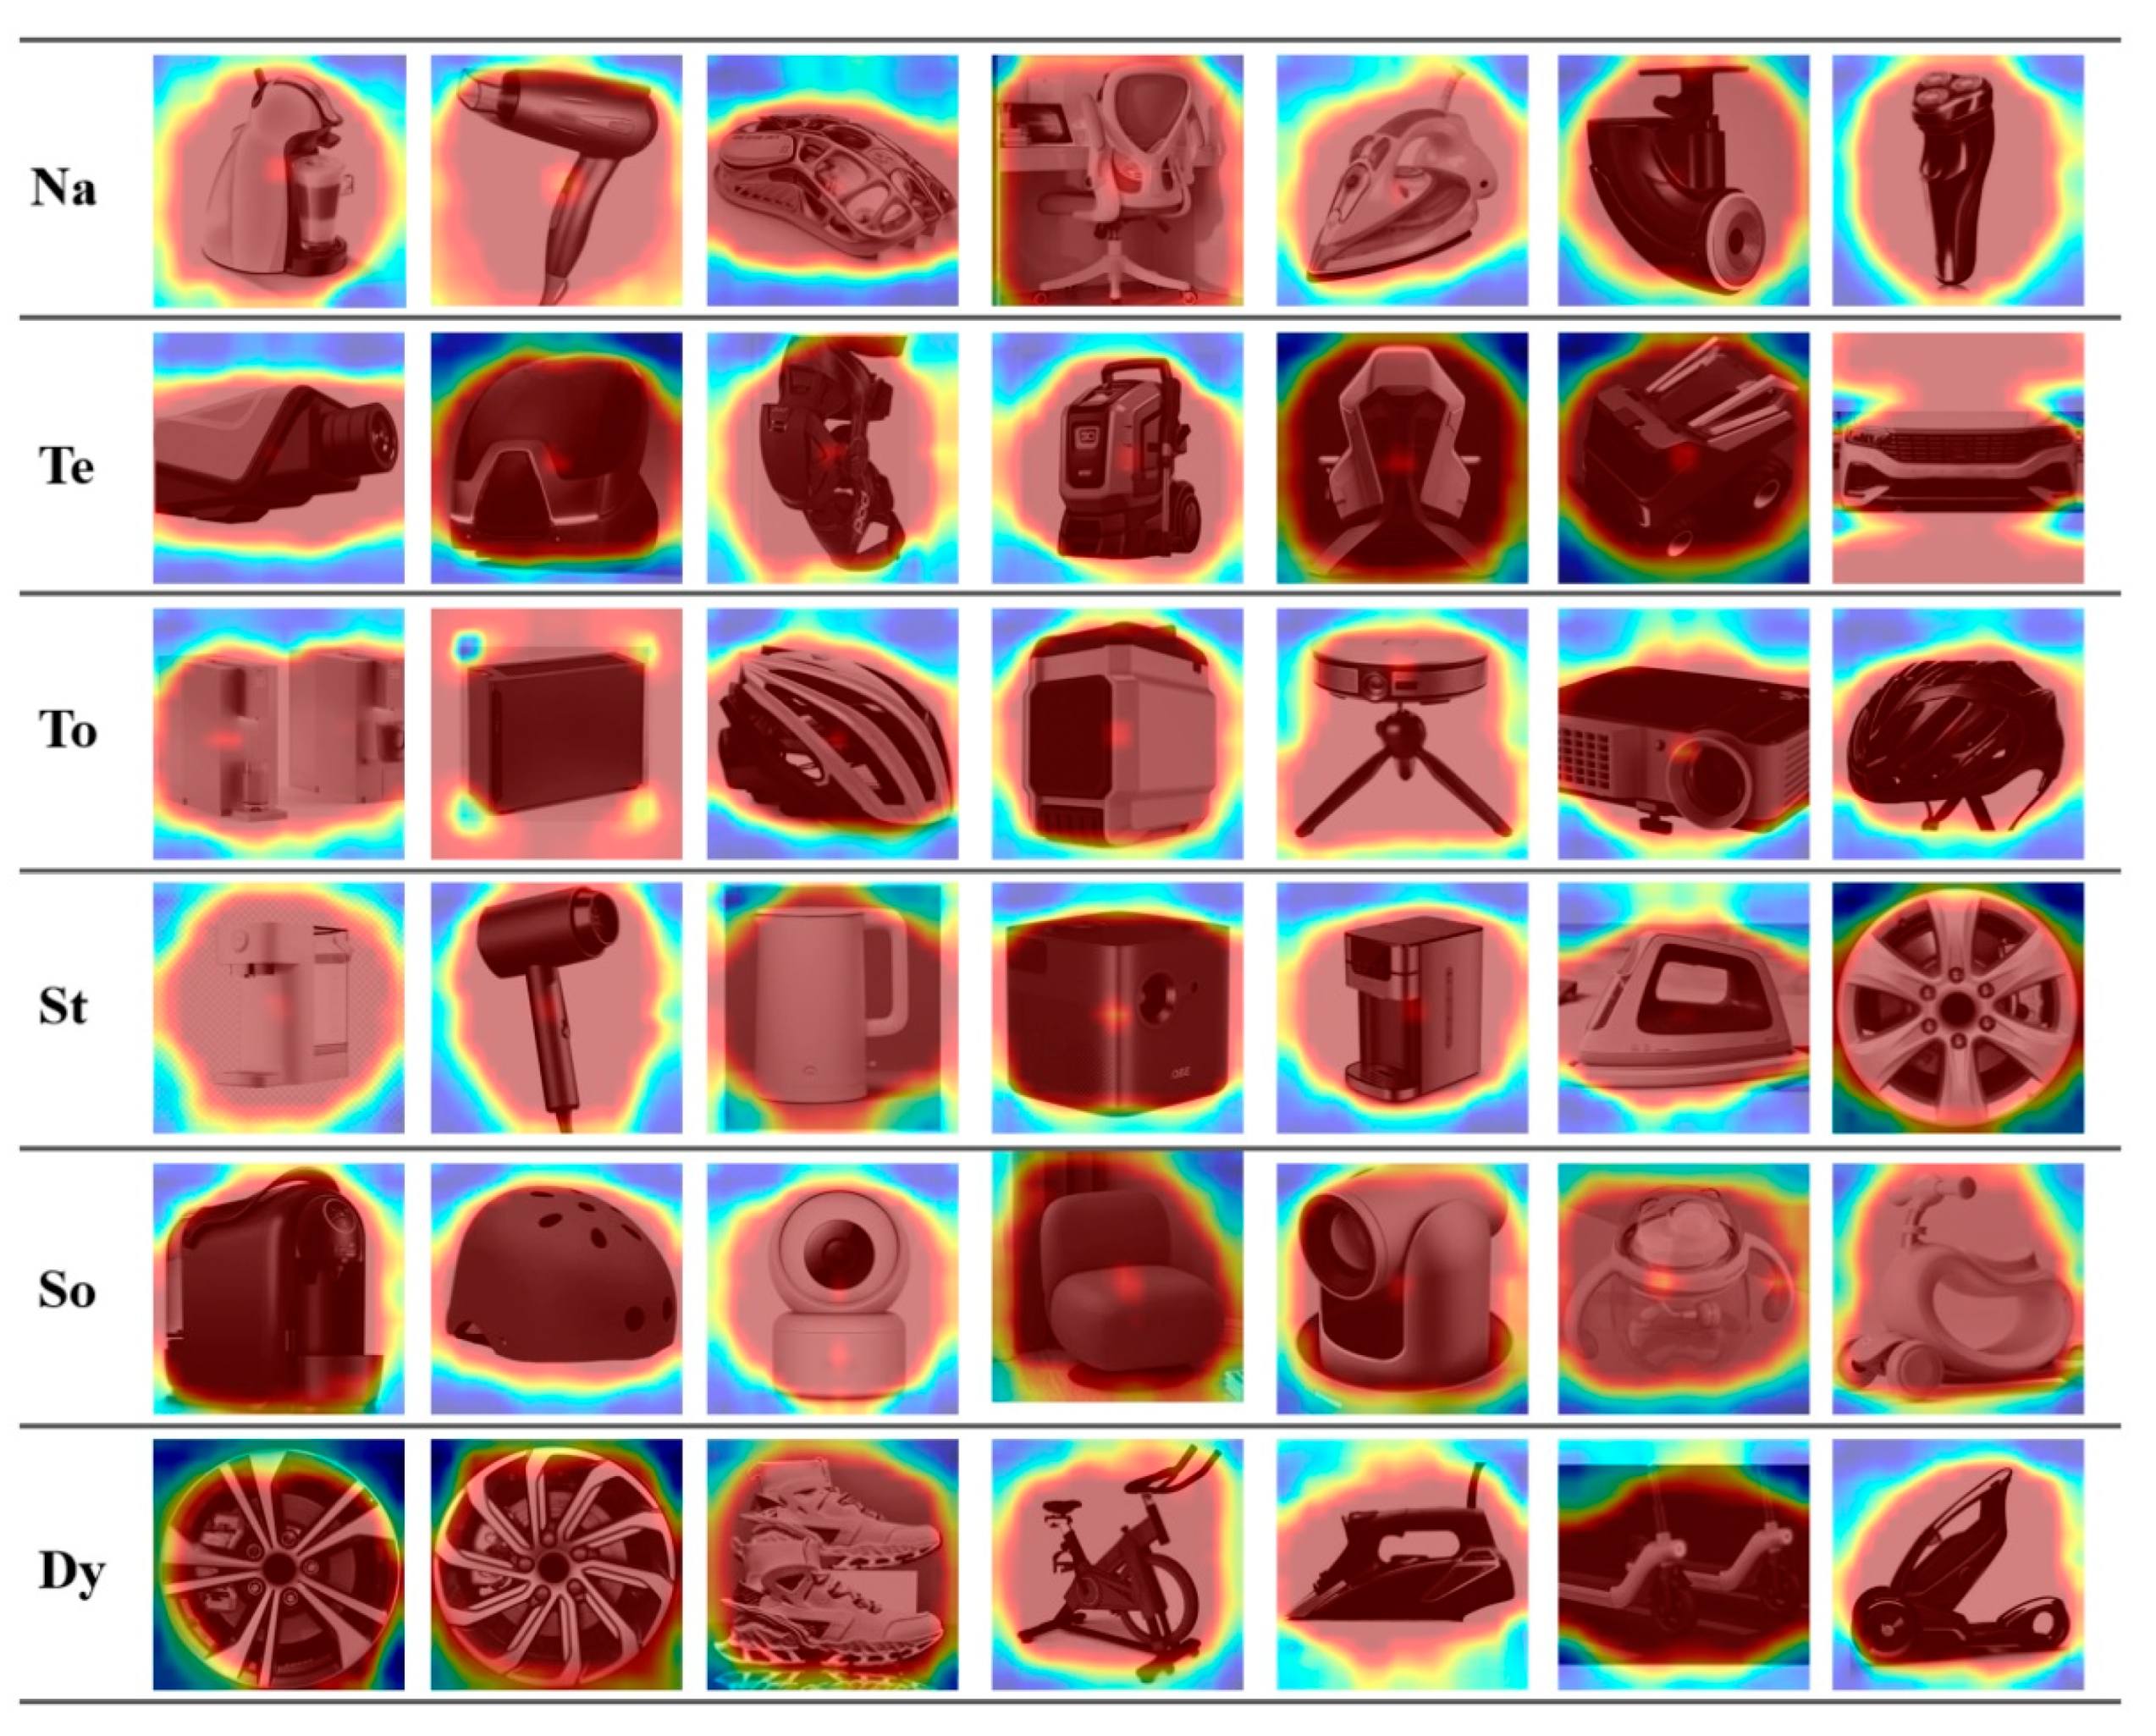
5.2. Visualization Analysis

The ISE method is further validated by visualizing the feature maps across different layers of the enhanced YOLOv5 architecture. The feature visualizations of key layers for different product forms across six imagery styles are shown in Figure 16. The shallow-layer features clearly capture the primary contours of the products, while the integration of the CBAM module significantly enhances the model’s attention to critical features, thereby improving the effectiveness of feature extraction. Additionally, the resulting Grad-CAM heatmaps (as shown in Figure 17) reveal significant differences between the features of six imagery styles. Specifically, Naturalness (Na) primarily focuses on the free-form curve aspects of product form, where the visual curvature generally has an average value greater than 0.02 and a maximum value greater than 0.1; Technology (Te) emphasizes the transitional areas of the morphology, where the visual curvature generally has an average value greater than 0.01 and a maximum value greater than 0.05; Toughness (To) concentrates on the sharp lines within the morphology, where the visual curvature generally has an average value less than 0.05 and a maximum value less than 0.5; Steadiness (St) highlights the overall harmony and transitions in the shape—its visual curvature has an average value less than 0.1 and a maximum value less than 0.2; Softness (So) focuses on the filleted corner sections of morphological transitions, where the visual curvature typically maintains an average value of 0.01~0.04 and a maximum value less than 0.2; Dynamic (Dy) emphasizes the directional integrity of the overall product forms, where the visual curvature generally has an average value greater than 0.03 but less than 0.1, with a maximum value greater than 0.08. It can be shown according to the above analysis that key feature points of product forms have been captured.

6. Conclusions and Future Work

This study explores the objective mapping relationship between product form features and user style preferences, proposing an ISE method based on deep learning to help designers better capture user preferences. This method addresses the subjective bias and complexity of data processing in traditional approaches for evaluating cross-category industrial product forms. Building on NTTSSD paradigms and the enhanced YOLOv5 network structure, the analysis of small-scale consumer preferences can be transitioned to large-scale evaluations of imagery style, effectively narrowing the cognitive gap between designers and users while simplifying the complexity of user perception in industrial product form. Experimental results confirm the effectiveness of the proposed method in enhancing both the speed and accuracy of design evaluations. The ISE method not only provides a rapid and intelligent evaluation tool but also offers key semantic features and deep insights to designers, fostering innovative design and providing new perspectives for industrial product design decisions, thus shortening design cycles and improving the design process. However, this study also has certain limitations, such as the limited sample coverage and the differences in user preferences across specific cultural contexts. Therefore, future research will focus on expanding product diversity and continuously updating the user preference database to ensure the long-term effectiveness and adaptability of this method. Additionally, factors such as product materials and colors, which significantly influence consumer perceptions and preferences, will be integrated into the evaluation framework to build a more comprehensive morphological assessment system and promote design innovation.

Author Contributions

J.Z.: Conceptualization, methodology, writing—original draft preparation; Y.L.: Supervision, reviewing and editing; M.Z.: Data curation, validation; S.C.: Data collection and investigation. All authors have read and agreed to the published version of the manuscript.

Funding

The research work is funded by the National Natural Science Foundation of China [Grant Number 52175219]; the Fundamental Research Funds for Central Universities [Grant Number: 2232019A3-11].

Institutional Review Board Statement

Not applicable.

Informed Consent Statement

Informed consent was obtained from all subjects involved in the study.

Data Availability Statement

The original contributions presented in the study are included in the article, further inquiries can be directed to the corresponding author.

Conflicts of Interest

The authors declare no conflict of interest.

Abbreviations

The following abbreviations are used in this manuscript:
EEGElectroencephalography
SVMSupport Vector Machines
ISEImagery Style Evaluation
NTTSSDNaturalness, Technology, Toughness, Steadiness, Softness, Dynamism
CBAMConvolutional Block Attention Module
Mapmean Average Precision
FPSFrames Per Second
Grad-CAMGradient-weighted Class Activation Mapping
RMSERoot Mean Square Error
KEKansei Engineering
SDSemantic Differential
TOPSISTechnique for Order Preference by Similarity to Ideal Solution
DETRDEtection Transformer
YOLOYou Only Look Once
FLOPsFloating-point operations
APAverage Precision
mAPmean Average Precision
ParamParameters
ConvConvolution layers
C3 layersContaining 3 standard Conv
SPPFSpatial Pyramid Pooling-Fast
PANetPath Aggregation Network
lContour line
θEdge transition angle
dVisual direction
kVisual curvature
SGDStochastic Gradient Descent
IoUIntersection over Union
CioUComplete Intersection over Union
NMSNon-maximum Suppression
NaNaturalness
TeTechnology
ToToughness
StSteadiness
SoSoftness
DyDynamism

References

  1. Zhang, X.; Li, Y.; Shang, D.; Di, C.; Ding, M. The influence of user cognition on consumption decision-making from the perspective of bounded rationality. Displays 2023, 77, 102392. [Google Scholar] [CrossRef]
  2. Chan, K.Y.; Kwong, C.K.; Clark, P.; Jiang, H.; Fung, C.K.Y.; Bilal, A.S.; Liu, Z.; Andy, T.C.; Wong, P.J. Affective design using Machine learning: A survey and its prospect of conjoining big data. Int. J. Comput. Integr. Manuf. 2020, 33, 645–669. [Google Scholar] [CrossRef]
  3. Hu, H.C.; Liu, Y.; Lu, W.F.; Guo, X. A quantitative aesthetic measurement method for product appearance design. Adv. Eng. Inform. 2022, 53, 101644. [Google Scholar] [CrossRef]
  4. Zhao, X.; Sharul, A.S.; Han, L. A novel product shape design method integrating kansei engineering and whale optimization algorithm. Adv. Eng. Inform. 2024, 62, 102847. [Google Scholar] [CrossRef]
  5. Shan, H.U.; Jia, Q.; Wang, Y.; Dong, L.; Luo, Y. A study on the redesign of traditional cultural symbols based on eye movement experiment and extensible semantics. Decoration 2021, 8, 88–92. [Google Scholar]
  6. Kuo, J.Y.; Chen, C.H.; Shinichi, K.; Danni, C. Investigating the relationship between users’ eye movements and perceived product attributes in design concept evaluation. Appl. Ergon. 2021, 94, 103393. [Google Scholar] [CrossRef]
  7. Pei, H.; Huang, X.; Ding, M. Image visualization: Dynamic and static images generate users visual cognitive experience using eye-tracking technology. Displays 2022, 73, 102175. [Google Scholar] [CrossRef]
  8. Li, L.; Xin, Y.; Guo, Z.; Deng, Y.Q.; Yang, P. Research on product morphological Kansei engineering model based on eye movement empowerment and EEG image cognition. Packag. Eng. 2022, 43, 37–44. [Google Scholar]
  9. Fan, T.; Qiu, S.; Wang, Z.; Zhao, H.; Jiang, J.; Wang, Y. A new deep convolutional neural network incorporating attentional mechanisms for ECG emotion recognition. Comput. Biol. Med. 2023, 159, 106938. [Google Scholar] [CrossRef]
  10. Valeria, B.; Paul, G. The influence of product involvement and emotion on short-term product demand forecasting. Int. J. Forecast. 2017, 33, 652–661. [Google Scholar]
  11. Buker, T.; Schmitt, T.; Miehling, J.; Wartzack, S. What’s more important for product design-usability or emotionality? An examination of influencing factors. J. Eng. Des. 2022, 33, 635–669. [Google Scholar] [CrossRef]
  12. Han, Y.; Moghaddam, M. Eliciting attribute-level user needs from online reviews with deep language models and information extraction. J. Mech. Des. 2020, 143, 1–34. [Google Scholar] [CrossRef]
  13. Su, J.N.; Zhao, H.J.; Wang, R.H.; Zhang, S.T. Optimized design of product imagery styling based on support vector machines and particle swarm algorithms. Mech. Des. 2015, 32, 105–109. [Google Scholar]
  14. Ding, M.; Zhang, S.Y.; Huang, X.G.; Li, M.H. Product appearance imagery design based on support vector machine regression and simulated annealing algorithm. Mech. Des. 2020, 37, 135–140. [Google Scholar]
  15. Li, Z.; Tian, Z.G.; Wang, J.W.; Wang, W.M.; Huang, G.Q. Dynamic mapping of design elements and affective responses: A machine learning based method for affective design. J. Eng. Des. 2018, 29, 358–380. [Google Scholar] [CrossRef]
  16. Hao, J.; Xu, L.; Wang, G.; Jin, Y.; Yan, Y. A knowledge-based method for rapid design concept evaluation. IEEE Access 2019, 7, 116835–116847. [Google Scholar] [CrossRef]
  17. Ding, M.; Zhao, L.; Sun, M.; Qin, H. An ISM-BN-GA based methodology for product emotional design. Displays 2022, 74, 102279. [Google Scholar] [CrossRef]
  18. Neha, P.; Goonjan, J. Bayesian game model based unsupervised sentiment analysis of product reviews. Expert Syst. Appl. 2023, 214, 119128. [Google Scholar]
  19. Ferrero, V.J.; Alqseer, N.; Tensa, M.; DuPont, B. Using decision trees supported by data mining to improve function-based design. In Proceedings of the ASME Design Engineering Technical Conference, Online, 17–19 August 2020. [Google Scholar] [CrossRef]
  20. Čok, V.; Vlah, D.; Povh, J. Methodology for mapping form design elements with user preferences using Kansei engineering and VDI. J. Eng. Des. 2022, 33, 144–170. [Google Scholar] [CrossRef]
  21. Wang, L.; Liu, Z. Data-driven product design evaluation method based on multistage artificial neural network. Appl. Soft Comput. 2021, 103, 107117. [Google Scholar] [CrossRef]
  22. Camburn, B.; He, Y.; Raviselvam, S.; Luo, J.; Wood, K. Machine learning-based design concept evaluation. J. Mech. Des 2020, 142, 3. [Google Scholar] [CrossRef]
  23. Wu, X.X.; Yang, M.G.; Su, Z.S.; Zhang, X.X. On the evaluation of product aesthetic evaluation based on hesitant-fuzzy cognition and neural network. Complexity 2022, 18, 8407521. [Google Scholar] [CrossRef]
  24. Zhe, H.L.; Woo, J.C.; Luo, F.; Chen, Y.T. Research on sound imagery of electric shavers based on Kansei engineering and multiple artificial neural networks. Appl. Sci 2022, 12, 10329. [Google Scholar]
  25. Wang, T.X.; Xu, M.M.; Liu, Y.; Zhou, M.Y.; Sun, X.F. Constructing a MOEA approach for product form Kansei design based on text mining and BPNN. J. Intell. Fuzzy Syst. 2024, 02, 8865–8885. [Google Scholar] [CrossRef]
  26. Nurullah, Y.; Hüseyin, R.B.; Hüseyin, K.S.; Olcay, E.C. Review of artificial intelligence applications in engineering design perspective. Eng. Appl. Artif. Intell. 2023, 118, 105697. [Google Scholar]
  27. Nagamachi, M. Kansei engineering: A new ergonomic consumer-oriented technology for product development. Int. J. Ind. Ergon. 1995, 15, 3–11. [Google Scholar] [CrossRef]
  28. Osgood, C.E.; Suci, C.J.; Tannenbaum, P.H. The Measurement of Meaning; University of Illinois Press: Champaign, IL, USA, 1957; pp. 76–124. [Google Scholar]
  29. Lu, Z.L. Design Cognition Mechanisms and Methods for Automotive Styling Morphologies; Beijing Institute of Technology Press: Beijing, China, 2022; Volume 3, pp. 15–16. ISBN 9787576311273. [Google Scholar]
  30. Cristina, N.Z.; Silva, S.L.; Daniel, C.A.; Costa, J.M.H.; Benedito, G.B. Automatic digital mood boards to connect users and designers with kansei engineering. Int. J. Ind. Ergon. 2019, 74, 102829. [Google Scholar]
  31. Hirokawa, J.; Vaughan, P.; Masset, T.; Ott, A.K. Frontal cortex neuron types categorically encode single decision variables. Nature 2019, 576, 446–451. [Google Scholar] [CrossRef]
  32. Masayuki, K.; Yuichi, K.; Shigekazu, I. Kansei engineering study on car seat lever position. Int. J. Ind. Ergon. 2021, 86, 103215. [Google Scholar]
  33. Wang, Z.; Hu, S.; Liu, W.D. Product feature sentiment analysis based on GRU-CAP considering chinese sarcasm recognition. Expert Syst. Appl. 2024, 241, 122512. [Google Scholar] [CrossRef]
  34. Luo, S.J.; Li, W.J.; Fu, Y.T. Consumer preference-driven SUV product family profile gene design. J. Mech. Eng. 2016, 52, 9. [Google Scholar] [CrossRef]
  35. Wang, D.; Li, Z.; Dey, N.; Ashour, A.S.; Sherratt, R.S.; Shi, F. case-based reasoning for product style construction and fuzzy analytic hierarchy process evaluation modeling using consumers linguistic variables. Cit. Inf. 2017, 10, 4900–4912. [Google Scholar] [CrossRef]
  36. Shih, W.H.; Zhang, C.T. Use Aesthetic Measure to Analyze the Consumer Preference Model of Product forms. Int. J. Eng. Innov. Technol. 2018, 7, 2277–3754. [Google Scholar]
  37. Fu, G.; Qing, X.Q.; Mitsuo, N.; Vincent, G.D. A proposal of the event-related potential method to effectively identify kansei words for assessing product design features in kansei engineering research. Int. J. Ind. Ergon. 2020, 76, 102940. [Google Scholar]
  38. Fan, J.S.; Yu, S.; Yu, M.J. Research on construction and application of gene network model for morphology design based on consumer’s preference. Adv. Eng. Inform. 2021, 50, 101412. [Google Scholar] [CrossRef]
  39. Shi, Y.L.; Peng, Q.J. Enhanced customer requirement classifcation for product design using big data and improved Kano model. Adv. Eng. Inform. 2021, 49, 101340. [Google Scholar] [CrossRef]
  40. Kuo, L.W.; Chang, T.; Lai, C.C. Research on product design modeling image and color psychological test. Displays 2021, 71, 102108. [Google Scholar] [CrossRef]
  41. Zhong, D.X.; Fan, J.S.; Yang, G.J.; Tian, B.; Zhang, Y. Knowledge management of product design: A requirements-oriented knowledge management framework based on Kansei engineering and knowledge map. Adv. Eng. Inform. 2022, 52, 101541. [Google Scholar] [CrossRef]
  42. Wu, Y.; Ma, L.; Yuan, X.F.; Li, Q.G. Human-machine hybrid intelligence for the generation of car frontal morphologies. Adv. Eng. Inform. 2023, 55, 101906. [Google Scholar] [CrossRef]
  43. Guo, X.Y.; Li, M.M.; Chen, X.L. Research on personalized ceramic bottle design with imagery and neural networks. Front. Artif. Intell. Appl. 2024, 4, 703–713. [Google Scholar]
  44. Liu, L.L.; Bo, M.; Meng, C.P.; Zhen, C.; Yang, Z.Y.; He, X. Research on automotive front face styling based on shape grammar. Front. Artif. Intell. Appl. 2024, 4, 295–304. [Google Scholar]
  45. Zhou, A.M.; Liu, H.B.; Zhang, S.T. Evaluation and design method for product form aesthetics based on deep learning. Digit. Object Identifier 2021, 10, 3101619. [Google Scholar] [CrossRef]
  46. Luigi, C.; Gianluigi, C.; Paolo, N. A grid anchor based cropping approach exploiting image aesthetics, geometric composition and semantics. Expert Syst. Appl. 2021, 186, 115852. [Google Scholar]
  47. Danilo, A.; Marco, C.; Luigi, C.; Alessio, F.; Gian, L.F.; Marco, R.M.; Fabrizio, R. Real-time deep learning method for automated detection and localization of structural defects in manufactured products. Comput. Ind. Eng. 2022, 172, 108512. [Google Scholar]
  48. Dharmalingam, M.; Sathyamoorthy, S. Feature sampling based on multilayer perceptive neural network for image quality assessment. Eng. Appl. Artif. Intell. 2023, 121, 106015. [Google Scholar]
  49. Delitzas, A.; Chatzidimitriou, K.C.; Symeonidis, A.L. Calista: A deep learning-based system for understanding and evaluating website aesthetics. Int. J. Hum.-Comput. Stud. 2023, 175, 103019. [Google Scholar] [CrossRef]
  50. Luis, G.N.; Julia, F.M.; Jesus, M.G.; Jose, M.P. Novel groundtruth transformations for the aesthetic assessment problem. Inf. Process. Manag. 2023, 60, 103368. [Google Scholar]
  51. Ma, A.; Yu, Y.H.; Shi, C.; Guo, Z.R.; Chua, T.S. Cross-view hypergraph contrastive learning for attribute-aware recommendation. Inf. Process. Manag. 2024, 61, 103701. [Google Scholar] [CrossRef]
  52. Islam, M.R.; Ahmed, M.U.; Barua, S.; Begum, S. A systematic review of explainable artificial intelligence in terms of different application domains and tasks. Appl. Sci. 2022, 12, 1353. [Google Scholar] [CrossRef]
  53. Minh, D.; Wang, H.X.; Li, Y.F.; Nguyen, T.N. Explainable artificial intelligence: A comprehensive review. Artif. Intell. Rev. 2022, 55, 3503–3568. [Google Scholar] [CrossRef]
  54. Allison, J.T.; Cardin, M.; McComb, C.; Ren, M.Y.; Selva, D.; Tucker, C.; Witherell, P.; Zhao, Y.F. Special issue: Artificial intelligence and engineering design. ASME J. Mech. Des 2022, 144, 020301. [Google Scholar] [CrossRef]
  55. Chang, Y.; Zhou, W.; Cai, H.N.; Fan, W.; Hu, L.F.; Wen, J.H. Meta-relation assisted knowledge-aware coupled graph neural network for recommendation. Inf. Process. Manag. 2023, 60, 103353. [Google Scholar] [CrossRef]
  56. Chen, Y.M.; Yuan, X.B.; Wu, R.Q.; Wang, J.B.; Hou, Q.B.; Cheng, M.M. YOLO-MS: Rethinking multi-scale representation learning for real-time object detection. arXiv 2023, arXiv:2308.05480v1. [Google Scholar] [CrossRef]
  57. Zhao, Y.; Chen, B.; Liu, B.; Yu, C.Y.; Wang, L.; Wang, S.S. GRP-YOLOv5: An improved bearing defect detection algorithm based on YOLOv5. Sensors 2023, 23, 7437. [Google Scholar] [CrossRef]
  58. Zhou, T.; Liu, F.Z.; Ye, X.Y.; Wang, H.W.; Lu, H.L. CCGL-YOLOV5: A cross-modal cross-scale global-local attention YOLOV5 lung tumor detection model. Comput. Biol. Med. 2023, 165, 107387. [Google Scholar] [CrossRef]
  59. Arunabha, M.R.; Jayabrata, B. DenseSPH-YOLOv5: An automated damage detection model based on DenseNet and Swin-Transformer evaluation head-enabled YOLOv5 with attention mechanism. Adv. Eng. Inform. 2023, 56, 102007. [Google Scholar]
  60. Jing, J.P.; Li, S.F.; Qiao, C.; Li, K.Y.; Zhua, X.Y.; Zhang, L.X. A tomato disease identification method based on leaf image automatic labeling algorithm and improved YOLOv5 model. J. Sci. Food Agric. 2023, 103, 7070–7082. [Google Scholar] [CrossRef]
  61. Li, Y.; Ma, R.; Zhang, R.; Cheng, Y.; Dong, C. A tea buds counting method based on YOLOv5 and kalman filter tracking algorithm. Plant Phenomics 2023, 5, 0030. [Google Scholar] [CrossRef]
  62. Li, C.Y.; Li, L.L.; Geng, Y.F.; Jiang, H.L.; Cheng, M.; Zhang, B.; Ke, Z.D.; Xu, X.M.; Chu, X.X. Yolov6 v3.0: A full-scale reloading. arXiv 2023, arXiv:2301.05586. [Google Scholar]
  63. Wang, A.; Chen, H.; Liu, L.H.; Chen, K.; Lin, Z.J.; Han, J.G.; Ding, G.G. YOLOv10: Real-Time End-to-End Object Detection. arXiv 2024, arXiv:2405.14458v1. [Google Scholar]
  64. Syed, S.A.Z.; Mohammad, S.A.; Asra, A.; Nadia, K.M.A.; Brian, L. A survey of modern deep learning based on object detection models. Digit. Signal Process. 2022, 126, 103514. [Google Scholar]
  65. Zhu, H.; Bian, C.Z.; Li, X.X. Contrast feature enhancement for small target detection in elevated banks. Comput. Eng. Appl. 2023, 9, 1–11. [Google Scholar]
  66. Cengil, E.; Cinar, A. Poisonous mushroom detection using YOLOV5. Turk. J. Sci. Technol. 2021, 16, 119–127. [Google Scholar]
  67. Luo, Y.F.; Huang, Y.; Qian, W.; Kai, Y.; Zhao, Z.X.; Li, Y.H. An improved YOLOv5 model: Application to leaky eggs detection. LWT-Food Sci. Technol. 2023, 187, 115313. [Google Scholar] [CrossRef]
  68. Joel, P. The human imagination: The cognitive neuroscience of visual mental imagery. Nat. Rev. Neurosci. 2019, 20, 624–634. [Google Scholar]
  69. Hwang, C.L.; Kwangsun, Y. Lecture notes in economics and mathematical systems. In Multiple Attribute Decision Making Methods and Applications; Springer: Berlin/Heidelberg, Germany, 1981; p. 186. ISBN 978-3-540-10558-9. [Google Scholar]
  70. Sahoo, L.; Senapati, T.; Yager, R.R. Real Life Applications of Multiple Criteria Decision Making Techniques in Fuzzy Domain; Studies in Fuzziness and Soft Computing; Springer: Singapore, 2023; p. 420. ISBN 978-981-19-4928-9. [Google Scholar]
  71. Liu, H.R. Curvature Representation and Decomposition of Shapes. Ph.D. Dissertation, Huazhong University of Science and Technology, Wuhan, China, 2009. Volume 3. pp. 38–47. [Google Scholar]
  72. Woo, S.; Park, J.; Lee, J.Y.; Kweon, I.S. Cbam: Convolutional block attention module. In Proceedings of the 15th European Conference on Computer Vision, Munich, Germany, 8–14 September 2018; pp. 3–19. [Google Scholar]
  73. Quan, H.; Li, S.; Zeng, C.; Wei, H.; Hu, J. Big Data and AI-Driven Product Design: A Survey. Appl. Sci. 2023, 13, 9433. [Google Scholar] [CrossRef]
  74. Ramprasaath, R.S.; Michael, C.; Abhishek, D.; Abhishek, D. Grad-CAM: Visual explanations from deep networks via gradient-based localization. In Proceedings of the 2017 IEEE International Conference on Computer Vision (ICCV), Venice, Italy, 22–29 October 2017; pp. 1–24. [Google Scholar]
Figure 1. YOLOv5 framework architecture.
Applsci 15 06061 g001
Figure 2. Eighty sample images of product form.
Applsci 15 06061 g002
Figure 3. Example of the SD questionnaire format.
Applsci 15 06061 g003
Figure 4. Survey results for 80 samples.
Applsci 15 06061 g004
Figure 5. Examples of contour lines, edge transition angles, and visual directions across six imagery styles.
Applsci 15 06061 g005
Figure 6. Changes in visual curvature across different product forms.
Applsci 15 06061 g006
Figure 7. Number of categories for each dataset.
Applsci 15 06061 g007
Figure 8. Structure diagram of the CBAM attention mechanism.
Applsci 15 06061 g008
Figure 9. Enhanced YOLOv5 deep learning network architecture for the ISE method.
Applsci 15 06061 g009
Figure 10. Loss function convergence curves.
Applsci 15 06061 g010
Figure 11. Test results of the enhanced YOLOv5 model.
Applsci 15 06061 g011
Figure 12. Confusion matrix on the test set.
Applsci 15 06061 g012
Figure 13. Examples of evaluation results from two experimental sets.
Applsci 15 06061 g013
Figure 14. Examples of product form design decision process based on ISE method.
Applsci 15 06061 g014
Figure 15. Grad-CAM visualization process.
Applsci 15 06061 g015
Figure 16. Visualization of feature maps in key layers for various product forms.
Applsci 15 06061 g016
Figure 17. Grad-CAM heatmaps visualization for six product form categories.
Applsci 15 06061 g017
Table 1. Comparison between detectors on COCO 2017val in the same environment.
ModelParam (M)FLOPs (G)APval (%)
YOLOv5-S 7.216.537.4
YOLOv6-3.0-S18.545.344.3
Gold-YOLO-S21.546.045.4
YOLO-MS-S8.131.246.2
YOLOv8-S11.228.644.9
YOLOv9-S7.126.446.7
YOLOv10-S7.221.646.8
RT-DETR-R1820.060.046.5
Table 2. One hundred imagery style words for industrial product forms.
Serial
Number
Imagery
Style Words
Serial
Number
Imagery
Style Words
Serial
Number
Imagery
Style Words
Serial NumberImagery
Style Words
01Tidy26Delicate51Austere76Geometric
02Unaffected27Traditional52Lithe77Respected
03Ponderous28Exaggerated53Soft78Ecological
04Urbane29Meticulous54Airy79Exquisite
05Graceful30Comfortable55Placid80Lively
06Flexible31Directional56Smooth81Decorative
07Revolving32Interesting57Masculine82Individual
08Rough33Overbearing58Concise83Mysterious
09Bold34Advanced59Trendy84High-end
10Unique35Modern60Plush85Newfangled
11Daring36Swanking61Natural86Comfortable
12Organic37Kingly62Rational87High-grade
13Ornate38Exquisite63Amiable88Rustic
14Gliding39Conservative64Sedate89Classical
15Steady40Coordinating65Laconic90Unified
16Nostalgic41Technological66Sincere91Romantic
17Simple42Plain67Staid92Dynamic
18Rational43Tenuous68Friendly93Stately
19Quiet44Lively69Slant94Formal
20Cute45Vivid70Tough95Unbending
21Sportive46Sharp71Stocky96Heavy
22Streamline47Reliable72Future97Demure
23Hard48Particular73Rounded98Fashion
24Solid49Elegant74Pure99Bionic
25Peculiar50Brisk75Genial100Speed
Table 3. 5-point Likert scale range.
Degree of RelevanceIrrelevantSlightly RelatedRelevantVery RelevantStrong Relevant
a x y 00.20.50.81
Table 4. Partial results of sorting for imagery style keywords.
Product ImagesImagery Style
Vocabulary
D m u +
(Positive Ideal Solutions)
D m u
(Negative Ideal Solutions)
C m u (Comprehensive Evaluation Score)
Applsci 15 06061 i001
Business Car
Steady0.1150.9380.890
Demure0.1630.8720.842
Elegant0.3810.6670.637
Heavy0.2740.7580.735
Stately0.3320.7140.683
Formal0.2610.7970.753
Applsci 15 06061 i002
Mini Car
Soft0.0820.9700.922
Amiable0.1630.8720.842
Rounded0.2610.7970.753
Quiet0.3810.6670.637
Urbane0.3320.7140.683
Cute0.3210.7550.701
Applsci 15 06061 i003
Racing Car
Dynamic0.0820.9700.922
L i v e l y 0.2610.7970.753
Gliding0.3320.7140.683
Sportive0.1630.8720.842
Flexible0.2740.7580.735
Speed0.4640.5610.548
Applsci 15 06061 i004
Off-road Car
Tough0.1150.9380.890
Masculine0.1630.8720.842
Geometric0.2740.7580.735
Rough0.3810.6670.637
Sharp0.3320.7140.683
Hard0.4240.6160.592
Applsci 15 06061 i005
Intelligent car
Technological0.1150.9380.890
Advanced0.1830.8370.821
Future0.1410.9060.865
Trendy0.2610.7970.753
High-end0.3810.6670.637
Peculiar0.4240.6160.592
Applsci 15 06061 i006
Sports Car
Natural0.0820.9700.922
Bionic0.1150.9380.890
Organic0.1830.8370.821
Brisk0.3810.6670.637
Ecological0.5290.5290.500
Comfortable0.4240.6160.592
Table 5. User survey data for 20 wheel hubs.
Number of Surveyed Users124 Female119 Male
Sample NumberThe Proportion of Naturalness (%)The Proportion of Technology (%)The Proportion of Toughness (%)The proportion of Steadiness (%)The Proportion of Softness (%)The Proportion of Dynamism (%)
018.236.173.2927.571.2453.50
027.8211.1118.110.82062.14
0339.098.648.231.651.2441.15
0451.4440.3301.234.122.88
0552.263.290.412.0628.8113.17
068.234.530.8212.3565.848.23
077.4111.112.4716.4654.328.23
082.061.6516.8765.027.826.58
090.412.8812.3577.361.655.35
102.474.9413.1766.671.2311.52
1153.502.064.127.418.2324.68
121.656.5800.4174.4916.87
1312.3555.1419.756.172.064.53
142.8844.4436.633.290.4112.35
154.5362.5512.348.231.6510.70
162.4745.2735.804.120.4111.93
173.7014.4070.783.7007.42
180.826.5978.191.230.8212.35
192.8818.5265.843.701.247.82
202.4711.5252.264.530.4128.81
Table 6. User evaluation data for 20 types of popular product forms.
Number of Surveyed Users20 Female20 Male
Sample
Number
The Proportion of Naturalness (%)The Proportion of Technology (%)The Proportion of Toughness (%)The Proportion of Steadiness (%)The Proportion of Softness (%)The Proportion of Dynamism (%)
215.002.502.500090.00
22010.002.5085.002.500
2307.505.0087.5000
2415.0072.505.005.0002.50
25010.002.5082.505.000
26010.005.0085.0000
2707.5015.0075.002.500
2860.0017.5002.5020.000
292.5012.50082.502.500
302.505.007.500085.00
3112.5010.0012.500065.00
3285.0002.5005.007.50
3375.005.0002.5010.007.50
3417.50002.5077.502.50
3512.505.0005.0077.500
3617.507.500067.507.50
372.505.00072.5020.000
382.507.50070.0020.000
3910.0077.507.50005.00
4005.0080.0015.0000
Table 7. Comparison experimental results.
AlgorithmAP (%)mAP
(%)
F1
(%)
FPS
(%)
NaTeToSoStDy
Enhanced YOLOv591.885.476.387.186.389.886.182106.4
YOLOv589.976.766.286.285.38381.276104.2
YOLOv1090.183.773.484.287.988.884.780147.1
SVM5457324363615266195.0
Table 8. Results from two sets of experiments using the ISE method.
ClustersTotal NumberNumber of Predicted SuccessesmAP (%)RMSE
A86080286.10.26
B1077100580
Disclaimer/Publisher’s Note: The statements, opinions and data contained in all publications are solely those of the individual author(s) and contributor(s) and not of MDPI and/or the editor(s). MDPI and/or the editor(s) disclaim responsibility for any injury to people or property resulting from any ideas, methods, instructions or products referred to in the content.

