1. Introduction
Public transport waiting times constitute a critical component of users’ travel experience and can decisively influence both their level of satisfaction and their choice of transport mode. Prolonged waiting periods not only discourage the use of public transport—favoring less sustainable private modes—but can also exacerbate congestion and pollution issues. In the current urban context, where air quality and urban livability are pressing challenges, fostering an efficient public transport system is essential [
1,
2].
The Greater Valparaíso Metropolitan Area in Chile is not exempt from these challenges. Public transport in this region supports a significant portion of residents’ mobility but faces difficulties related to the equity and efficiency of its services. Notably, there are indications that certain social groups or geographic areas could be experiencing prolonged waiting times, which may negatively affect both access to opportunities and the overall perception of the system.
Although the study of waiting times in public transport has received considerable attention in various international contexts, there remains a gap in specific knowledge about the scale of this issue and which users are most affected in the Valparaíso region.
International evidence further supports this concern. Gallotti and Barthelemy [
3], analyzing the United Kingdom’s multimodal public transport network, report that for trips involving at least one mode change, connection times (walking + inter-layer waiting) account on average for 23 ± 6% of door-to-door travel time. In Montreal, Lachapelle and Boisjoly [
4] find that off-vehicle activities (access + waiting) comprise 58.52% of total trip duration (7.09 min of access and 16.68 min of waiting over a mean trip of 43.37 min). As an additional illustration, based on the waiting (5–20 min) and median trip (30–50 min) ranges reported by Vaishnav et al. [
5], it can be approximated that waiting represents roughly 17–40% of total trip time (author estimation). These international examples demonstrate that waiting—and transfer—times form a substantial portion of door-to-door journeys and underscore the need to optimize service frequency and coordination.
This study makes several relevant contributions to public transport research:
To address this gap, the present work provides a comprehensive analysis of public transport waiting times in Greater Valparaíso, identifying spatial patterns, factors influencing these waiting periods, and the most vulnerable user groups.
The specific objectives of this study are:
To analyze the spatial and temporal distribution of public transport waiting times in Greater Valparaíso.
To explore the variables that affect the duration of these waiting periods.
To determine which user groups are most disadvantaged by prolonged waiting times.
To propose recommendations aimed at improving the efficiency and equity of the public transport system based on the study’s findings.
To achieve these objectives, data from the 2014 Greater Valparaíso Mobility and Transport Survey were utilized, supplemented by exploratory analysis techniques, spatial autocorrelation methods, and clustering algorithms. This approach offers valuable information for planners and policymakers, facilitating the design of interventions that optimize accessibility and encourage broader use of public transport.
2. Literature Review
Waiting time is a crucial factor that influences users’ decisions to use public transport. Nikolaidou et al. [
10] observed that during the COVID-19 pandemic, the increase in waiting times caused by the reduction in service frequency led many users to abandon public transportation. An average increase of one minute in waiting times contributed to a 0.34% decrease in the number of users worldwide.
Kujala et al. [
11] emphasized that waiting times are a significant component of accessibility and user experience. They introduced a decision support framework that incorporates pre-trip waiting times into the analysis of accessibility and the planning of public transport networks. By integrating this element, they demonstrated its relevance not only for service optimization but also for improving user perception.
Luo et al. [
12] showed that initial and transfer waiting times are essential components of the Generalized Travel Cost (GTC), a key metric used to measure accessibility in public transport systems. These waiting times, together with in-vehicle travel times and transfer penalties, largely explain spatial disparities in accessibility across different areas, thereby impacting the perceived quality of the system.
In Amman, Jordan, Altarifi et al. [
13] observed peak-hour waiting times ranging from 12 to 23 min, underscoring the need to treat waiting as a primary planning variable. Likewise, Hernández and Monzón [
14] show that shortening transfer-stage waits is equally decisive for overall system efficiency. Although one study targets pre-trip waiting and the other focuses on inter-modal transfers, both converge on the broader conclusion that the total time passengers spend waiting is a key performance indicator that transit agencies must minimize.
Qin et al. [
15] contributed neuroscientific evidence underscoring the importance of waiting times. They identified out-of-vehicle waiting time as one of the most uncomfortable travel experiences, significantly influencing users’ willingness to use public transport. This finding demonstrates the necessity of addressing waiting times not only from an operational standpoint but also as a critical factor in improving overall system perception.
Tahmasbi and Haghshenas [
16] observed that passengers perceive station waiting times more negatively compared to in-vehicle travel times, as waiting exerts a stronger impact on their overall travel experience. This highlights the importance of reducing waiting times to improve accessibility and enhance user satisfaction.
In recent years, several data-driven approaches have been proposed to quantify and optimize public transport waiting and transfer performance. For example, Zhao et al. [
17] employed smart card data in Nanjing to isolate the highest-priority metro–bus transfer pairs and propose targeted measures for reducing transfer delays. Building on this, Lee and Lee [
18] developed an iterative Data Envelopment Analysis (iDEA) framework—augmented with explainable AI—to evaluate bus–metro transfer efficiency for elderly versus general users in Seoul, finding that an 11% reduction in transfer time and its variance would equalize user comfort across groups. Moreover, Lee [
19] introduced an XAI-enhanced DEA model to assess origin–destination pair efficiencies in multimodal networks, demonstrating that bus travel time is the predominant factor limiting overall efficiency. While these methods leverage high-resolution operational datasets and advanced optimization techniques, our study complements them by using spatial clustering (DBSCAN) and autocorrelation (Moran’s I) on the 2014 SECTRA survey to reveal latent spatial patterns of waiting times in the Greater Valparaíso Metropolitan Area.
2.1. Factors Affecting Waiting Times
A number of studies have identified factors that influence the duration of waiting times. Zhang et al. [
20] underscored that service frequency and route reliability are key factors for assessing public transport quality in Hangzhou, China. They found that bus systems exhibited greater variability in headways due to disruptions such as traffic, whereas the metro had more regular intervals owing to its predetermined schedule. These findings highlight the importance of considering both frequency and reliability in planning to decrease waiting time variability and improve users’ perception of service.
In central areas of public transport networks, waiting times tend to be shorter due to higher service frequencies, particularly during peak hours. In contrast, peripheral areas experience longer waiting times, which lead to higher generalized travel costs and reduced accessibility [
12]. This pattern underscores the importance of service frequency as a determining factor in public transport system planning.
Gadepalli et al. [
21] found in India that waiting times significantly influence transport mode choice. Their analysis revealed that paratransit services, offering higher frequencies, are more attractive to users on short journeys, whereas buses tend to be preferred for longer trips, where waiting time is less critical.
In their study on accessibility in Santiago, Chile, Tiznado-Aitken et al. [
22] noted that peripheral areas suffer from worse access to the transport network, including prolonged waiting times, which affect users’ ability to access essential services such as education. Lower service frequencies in these areas increase waiting times and deepen inequalities in transport access.
Roy et al. [
23] showed that prolonged waiting times in transfers posed a significant barrier for women in Kolkata, India, who faced heightened vulnerability due to unsafe transfer stations.
Altarifi et al. [
13] identified insufficient coverage of the public transport system in Amman as another factor contributing to extended waiting times. The lack of efficient connections among different transport modes exacerbated this issue, highlighting the need for integrated models to enhance accessibility and reduce waiting times.
Hernández and Monzón [
14] indicated that waiting times are directly influenced by the quality of the information provided and coordination among operators, factors that facilitate more efficient system use and reduce uncertainty for users during transfers.
Tahmasbi and Haghshenas [
16] underscored that the key factors affecting waiting times are service frequency, operator coordination, and transfer efficiency. Through their model based on door-to-door weighted times, they suggest that these elements be considered in the planning of accessibility and in optimizing public transport systems.
2.2. Perceived vs. Actual Waiting Times
The discrepancy between perceived and actual waiting times is a recurring topic in the literature. Čelan et al. [
24] found that passengers in Maribor, Slovenia, perceived waiting times to be about 35% longer than they actually were, especially on low-frequency routes where they experienced higher levels of frustration. The implementation of real-time passenger information (RTPI) systems has proven effective in reducing this negative perception.
In their study on the Shenzhen Metro in China, Luo and He [
25] observed that complaints about waiting times were frequent, particularly during peak hours. These negative perceptions were influenced not only by the actual duration of the wait but also by the lack of accurate information regarding train arrivals.
Hernández and Monzón [
14] argue that comfort conditions in transfer terminals significantly affect waiting time perception, emphasizing that an improved physical environment can partially mitigate the discomfort associated with prolonged waits.
Qin et al. [
15] provided neuroscientific evidence by demonstrating that waiting times are quantified in terms of “cognitive distance”, a factor that explains why users often perceive waiting times as longer than they really are. This finding underscores the importance of addressing not only actual waiting times but also subjective perceptions to enhance the overall user experience.
2.3. Impact on User Satisfaction
The impact of waiting times on user satisfaction has been widely documented. In their study of public transport in Istanbul, Genç et al. [
26] highlighted that prolonged waiting times were among the main causes of dissatisfaction among bus users. About 33.4% of those surveyed reported waiting times of between 6 and 10 min, while 5.8% noted waits of over 30 min, contributing substantially to dissatisfaction.
Kasturia and Verma [
27] pointed out that waiting time is one of the most uncomfortable factors for users, significantly influencing their travel decisions. Their proposal for a passenger information system (PIS) based on generalized costs incorporates waiting time as a key parameter in planning optimal routes. This approach is particularly relevant in multimodal contexts in developing countries, where lengthy intermodal transfer times exacerbate the negative perception of the service.
Waiting times and the transfer-related penalties directly affect user perception. According to Luo et al. [
12], these penalties reflect the discomfort and added effort involved in transfers, negatively influencing the user experience—especially in peripheral areas.
Altarifi et al. [
13] found that long waiting times during peak hours considerably decreased users’ willingness to use public transport, negatively affecting the perception of the BRT system in Amman.
In their analysis of Line 6 of the Santiago Metro, Pineda and Mella Lira [
28] noted that although users valued travel time savings, waiting times remained a significant source of dissatisfaction due to the lower train frequency compared to other lines.
Tahmasbi and Haghshenas [
16] support this discussion by indicating that waiting time is a key factor in user satisfaction, primarily because of its greater influence on the overall travel experience. The discomfort associated with waiting, compared to in-vehicle time, has a notably negative impact on users’ willingness to use public transport systems.
2.4. Proposals to Reduce Waiting Times
Numerous studies have proposed strategies to address waiting times. Altarifi et al. [
13] recommend integrating services such as on-demand transport with existing BRT systems to enhance accessibility and reduce waiting periods. This integration increased the willingness to use the integrated system in Amman from 30% to 70%, underscoring its effectiveness in improving public transport perception and encouraging its adoption.
Hernández and Monzón [
14] suggest that better coordination among operators and reducing transfer distances are fundamental measures for optimizing waiting times and enhancing the user experience at interchange terminals.
Qin et al. [
15] emphasize that in addition to objective metrics, subjective perceptions of waiting times must be taken into account. Proposals such as providing accurate information and improving terminal design can help mitigate the negative impact of perceived waiting times and significantly improve the user experience.
2.5. Identified Gaps and Research Justification
International scholarship on waiting times is dominated by mega-cities whose services run in exclusive rights-of-way or benefit from tight real-time control. Examples include London, where segregated bus lanes and dynamic headway management shape empirical work on stop-level delay distributions by Kaparias et al. [
29], and TfL’s studies of perceived versus actual wait costs [
30]; Seoul, where smart-card big-data analytics have served to improve bus scheduling models and optimize service intervals based on actual passenger demand by Nam and Park [
31]; and Beijing, where field observations and video recordings characterize waiting passenger distributions in a fully grade-separated subway environment by Zhou et al. [
32].
By contrast, Greater Valparaíso features a complex topography—steep hills forming a natural amphitheater-like setting—and a historic hillside core, inscribed on UNESCO’s World Heritage List in 2003 [
33] and examined in depth by Aprigliano Fernandes and Manríquez Tirado [
34]. Moreover, while over thirty funicular elevators were built during the 19th and 20th centuries to connect the hills with the flat areas, fewer than half remained operational at the turn of the 21st century, and several are now undergoing restoration by Giribas, Paredes and Riquelme [
35]. These traits generate irregular headways and highly localized delays that international models do not capture.
In addition, the 2014 Gran Valparaíso Mobility and Transport Survey remains the only publicly accessible micro-level dataset providing georeferenced origin–destination trip records alongside detailed socio-demographic attributes (see
Section 3.1 “Database Description and Preprocessing”). The implications of its ten-year age are discussed in the Outdated Database subsection (
Section 5.1), where official SECTRA and municipal reports for 2020–2024 indicate only minor changes in network layout and vehicle operation—validating the 2014 data as a reliable historical baseline for our spatial analysis.
Methodologically, while some equity analyses rely on regional averages, others apply spatial statistics like local Moran’s I to transit accessibility metrics to control for spatial autocorrelation and reveal local clusters (Griffin and Sener [
6]), while data-driven passenger segmentation relies on DBSCAN variants but omits spatial autocorrelation (Kieu et al. [
36]). Fast implementations of DBSCAN now leverage randomized kd-forest and priority-search k-means tree acceleration for approximate neighbor queries, as shown by Muja and Lowe [
37], yet none have been applied to public transport waiting time analysis. In Valparaíso, recent work examines metro ridership–built-environment interactions (Aprigliano et al. [
38]), whereas analyses of hillside mobility constraints in steep terrain characterize sustainable mobility patterns but do not address temporal reliability (Aprigliano Fernandes and Manríquez Tirado [
34]).
Consequently, gaps persist regarding (i) how Valparaíso’s unique mix of modes and topography modifies waiting time patterns; (ii) how spatial dependence interacts with user heterogeneity at a sub-municipal scale; and (iii) whether advanced clustering can reveal vulnerable groups invisible to aggregate metrics.
Our study addresses those gaps by combining local survey micro-data with an integrated workflow—exploratory analysis, global Moran’s I, and a kd-tree-optimized, expansion-factor-weighted DBSCAN—to map clusters of excessive waits and link them to socio-demographic profiles. The results inform frequency planning and equity-oriented policy for cities that share Valparaíso’s steep terrain and mixed heritage fleets.
3. Materials and Methods
3.1. Database Description and Preprocessing
The data used in this study come from the Greater Valparaíso Mobility and Transport Survey conducted by the Transport Planning Secretariat (SECTRA) between August 2014 and June 2015. This survey provides a comprehensive overview of mobility patterns in the Greater Valparaíso metropolitan area—covering both public and private transport—and includes information on sociodemographic characteristics, travel purposes and modes, schedules, durations, and frequencies of use. It employed a two-stage face-to-face interview design; trained enumerators first visited a stratified random sample of households to record sociodemographic data via structured netbook-based questionnaires, then conducted a follow-up visit to collect detailed travel diaries for each household member. Fieldwork yielded 8776 completed interviews and incorporated supervisory validation with directed and random re-interviews (≈20%) to ensure data consistency.
To investigate waiting times in public transportation, a thorough preprocessing of the original dataset was carried out, focusing exclusively on public transport trips. After narrowing down and refining the dataset, 17,951 records and 45 variables directly related to waiting times were obtained.
Table 1 shows the list of final selected variables.
3.2. Analysis Methods
This study adopted a quantitative approach to explore waiting times in public transport, using various analytical techniques and advanced tools. First, an Exploratory Data Analysis (EDA) was conducted to identify preliminary patterns and potential outliers. Then, spatial autocorrelation of waiting times was assessed using Moran’s I. Finally, the DBSCAN algorithm was applied to identify user clusters experiencing prolonged waiting times. The following sections detail each procedure and the rationale behind the chosen methods.
3.2.1. Exploratory Data Analysis (EDA)
EDA was used to understand the basic characteristics of waiting times and other relevant variables, identifying preliminary patterns and outliers that guided subsequent analyses.
Table 2 summarizes the main techniques employed.
3.2.2. Spatial Analysis: Moran’s I
To assess spatial autocorrelation of waiting times, Moran’s I was used to determine whether high waiting times are clustered in specific geographic areas. The formula for the index is:
where:
is the total number of observations;
is the total sum of spatial weights ;
are the spatial weights between locations and , which form part of the spatial weights matrix ;
and are the values of the variable of interest at locations and , respectively;
is the mean of the variable x.
The spatial weights matrix WW was constructed using the kk-nearest neighbors (KNN) method, assigning each point its kk closest neighbors based on Euclidean distance. This method is suitable for data with irregular spatial distribution, although it may leave some points “disconnected” (i.e., with no assigned neighbors) in very isolated or low-density areas. This issue is addressed in
Section 4.2, where the effect of including and excluding such points in the calculation of Moran’s I is demonstrated.
This analysis provided an initial view of the spatial correlation of waiting times prior to the clustering process.
3.2.3. Clustering Analysis (DBSCAN)
A variant of the DBSCAN (Density-Based Spatial Clustering of Applications with Noise) algorithm was employed to group trips according to waiting times and transport mode. Since the dataset, after applying the survey expansion factors, reached around 1,400,000 trips, using the standard DBSCAN algorithm presented computational limitations. To overcome this challenge, an adapted version was developed using a KD-Tree, a data structure that organizes points in a multidimensional space to optimize neighbor searches within a specified radius (eps_value). Rather than merely counting the number of neighbors, the dataset’s expansion factors were used as weights to identify core points. This adaptation maintained the density-based focus of the original DBSCAN [
39] and enabled a more efficient identification of user groups with prolonged waiting times. The expansion factors (weights) state how many real trips each survey record stands for. Weighting the neighbor count within radius ε makes the min_samples threshold operate on the estimated number of population trips, preventing over-sampled strata from distorting core formation. Consequently, the resulting clusters mirror the true population distribution and preserve the study’s external validity.
The use of KD-Tree in this context is common in research dealing with large volumes of data, as it accelerates neighbor searches and optimizes the algorithm’s execution time [
40].
During the initial exploration phase, the K-means algorithm was used. K-means partitions the data into a predefined number of clusters, assigning each point to the nearest cluster based on the mean of the points within that cluster. However, the clusters obtained with K-means proved too similar to one another because the algorithm tends to produce clusters of relatively uniform size, which did not adequately capture the variability in waiting times observed in the data. Given that the goal was to identify clusters with high waiting times, DBSCAN was chosen instead, as it is more suitable for data with varying densities and the presence of noise [
41]. DBSCAN proved more effective in identifying trip clusters with prolonged waiting times, aligning more closely with the study objectives.
After forming the clusters using DBSCAN (Scikit-learn version 1.6.1), a detailed characterization was performed. These clusters were analyzed to determine which user groups face the longest waiting times, focusing on variables such as origin commune, origin macrozone, and sex. Characterizing these clusters made it possible to identify sociodemographic and spatial patterns that explain which population segments suffer the most negative effects of extended waiting periods.
To further evaluate the clustering quality, the silhouette coefficient was applied, measuring internal cluster consistency and separation between clusters. The formula for the silhouette coefficient is:
where:
is the average distance between a point and all other points in its own cluster;
is the average distance between that point and the points in the nearest cluster;
is the maximum between and .
The silhouette coefficient ranges from −1 to 1:
close to 1 indicates that the point is well-matched to its own cluster.
close to 0 indicates that the point lies on or near the boundary between two clusters.
A negative suggests that the point may have been assigned to the wrong cluster.
This coefficient helped validate the robustness of the clusters formed based on the variables Mode of Travel and Waiting Time, ensuring that the identified clusters reflected the patterns observed in the data.
For the purposes of this study, a “most affected user” is formally defined as one who meets both of the following conditions: (i) an individual trip waiting time ≥ 20 min (the 90th percentile of the weighted distribution of wait times) and (ii) membership in a DBSCAN cluster whose mean waiting time exceeds the global average of 7.20 min with low intra-cluster variability. This combined criterion ensures that identified users experience delays that are both systematically long and statistically significant, rather than isolated outliers.
3.2.4. Software and Tools
All analyses were conducted in Python (version 3.11.12) using the Google Colab environment, employing the following libraries:
Pandas (version 2.2.2) and NumPy (version 2.0.2) for data manipulation and analysis.
Seaborn (version 0.13.2) and Matplotlib (version 3.10.0) for data visualization and plotting.
Scikit-learn (version 1.6.1) for clustering analysis, including the DBSCAN algorithm and KD-Tree functionality.
Folium (version 0.19.5) and KeplerGL (version 0.3.2) for geospatial analysis and visualization of heat maps and origin–destination data.
These tools were essential for data handling, spatial pattern visualization, and cluster identification in waiting times.
4. Results and Discussion
4.1. Descriptive Analysis (EDA)
A descriptive analysis of key numerical variables was conducted to characterize waiting times and related factors in Greater Valparaíso’s public transport system.
Table 3 presents the descriptive statistics of these variables.
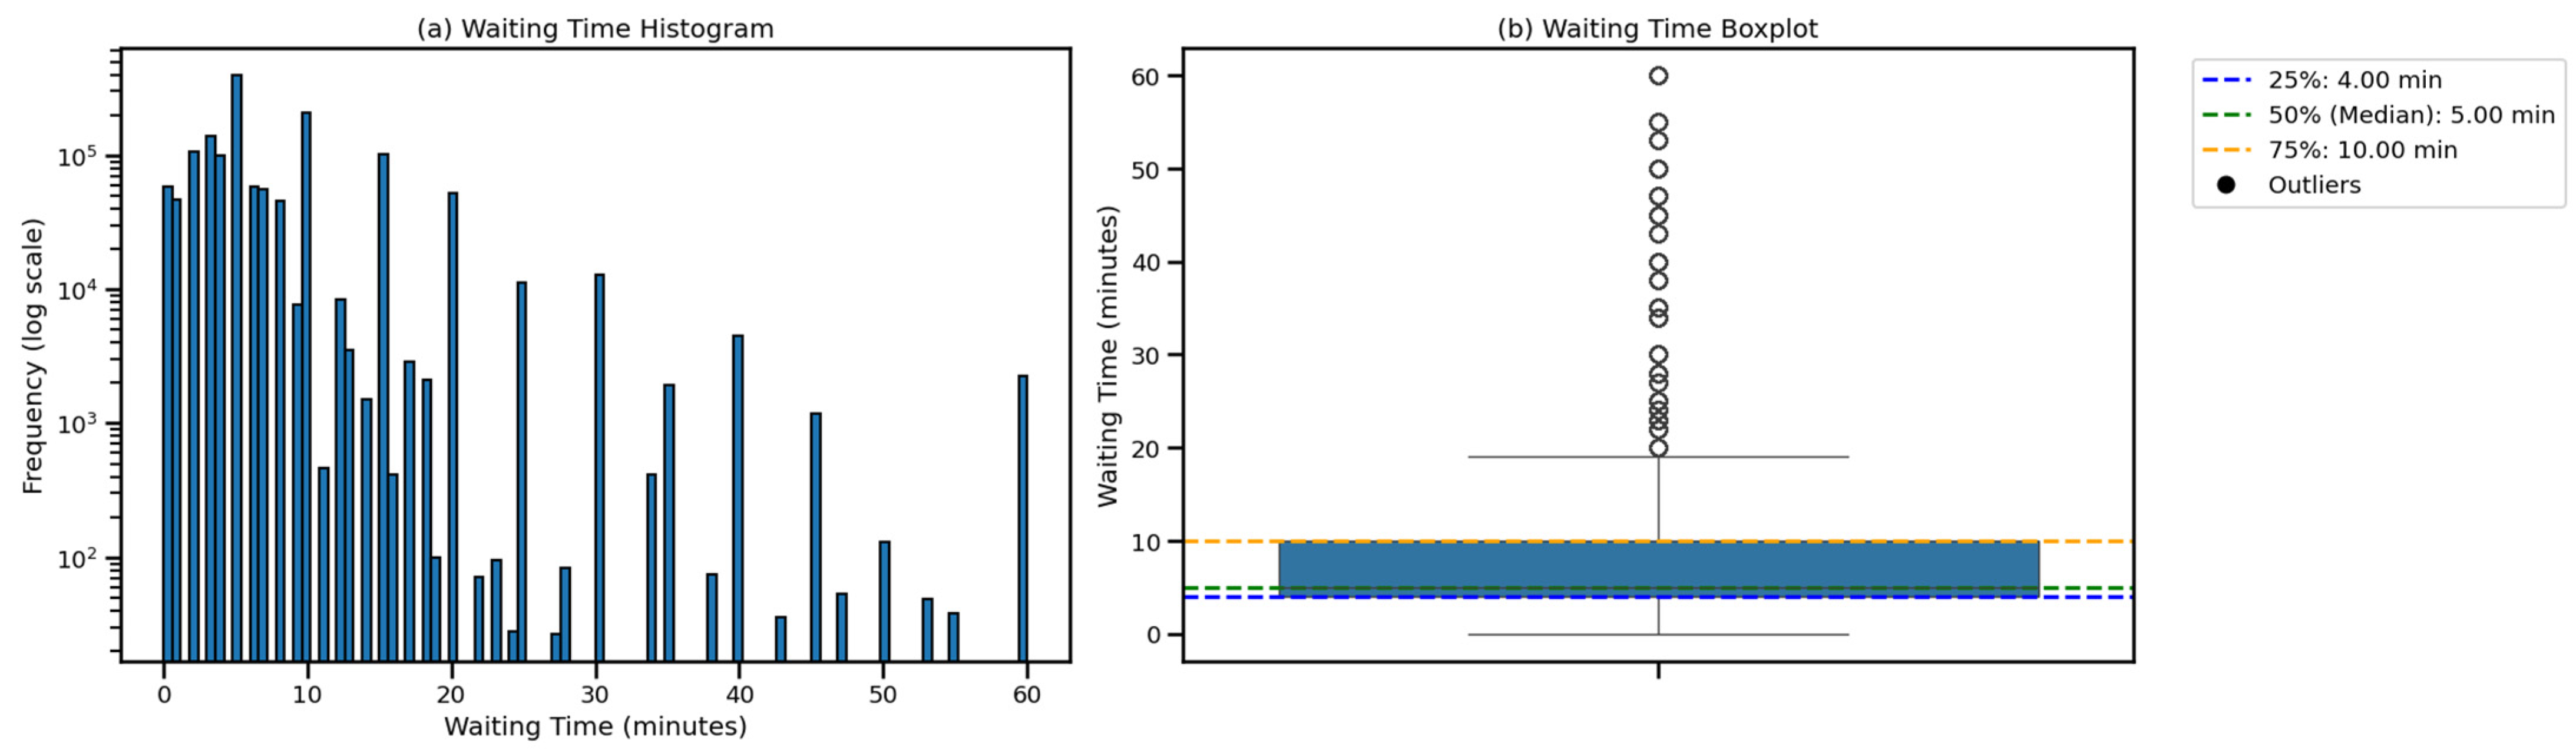
The average waiting time is 7.20 min (median = 5; mode = 5; std. = 6.27), yet individual waits reach 60 min, which can strongly affect perceived service quality. Travel time averages 36.23 min (median = 30; std. = 19.99) and spans from 3 to 315 min, reflecting the wide range of routes and distances within the study area. Walking times before and after the ride are shorter on average—3.57 min (median = 3; std. = 4.13) and 3.04 min (median = 2; std. = 3.62), respectively—but can extend to 45 and 60 min, indicating that some passengers cover considerable distances on foot. Finally, monthly individual income shows a pronounced socioeconomic spread, with a mean of CLP 189,757, a median of CLP 160,691, and an std. of CLP 242,526. These descriptive figures, drawn from
Table 3, provide the statistical context for the correlation patterns reported in
Table 4 and the right-skewed distributions visualized in
Figure 1, which are analyzed in detail in the following subsections.
4.1.1. Waiting Time Distribution
Most users wait between 0 and 10 min, although a smaller percentage exceed 30 min. The histogram (
Figure 1a), shown with a logarithmic scale, exhibits a peak around 5 min and a “long tail” extending to 60. The box plot (
Figure 1b) confirms a median of 5 min and indicates that, while public transport is relatively efficient for most users, there are groups experiencing very long waits, in some cases up to 60 min. These instances require further investigation into the conditions causing prolonged delays at certain times or on specific routes.
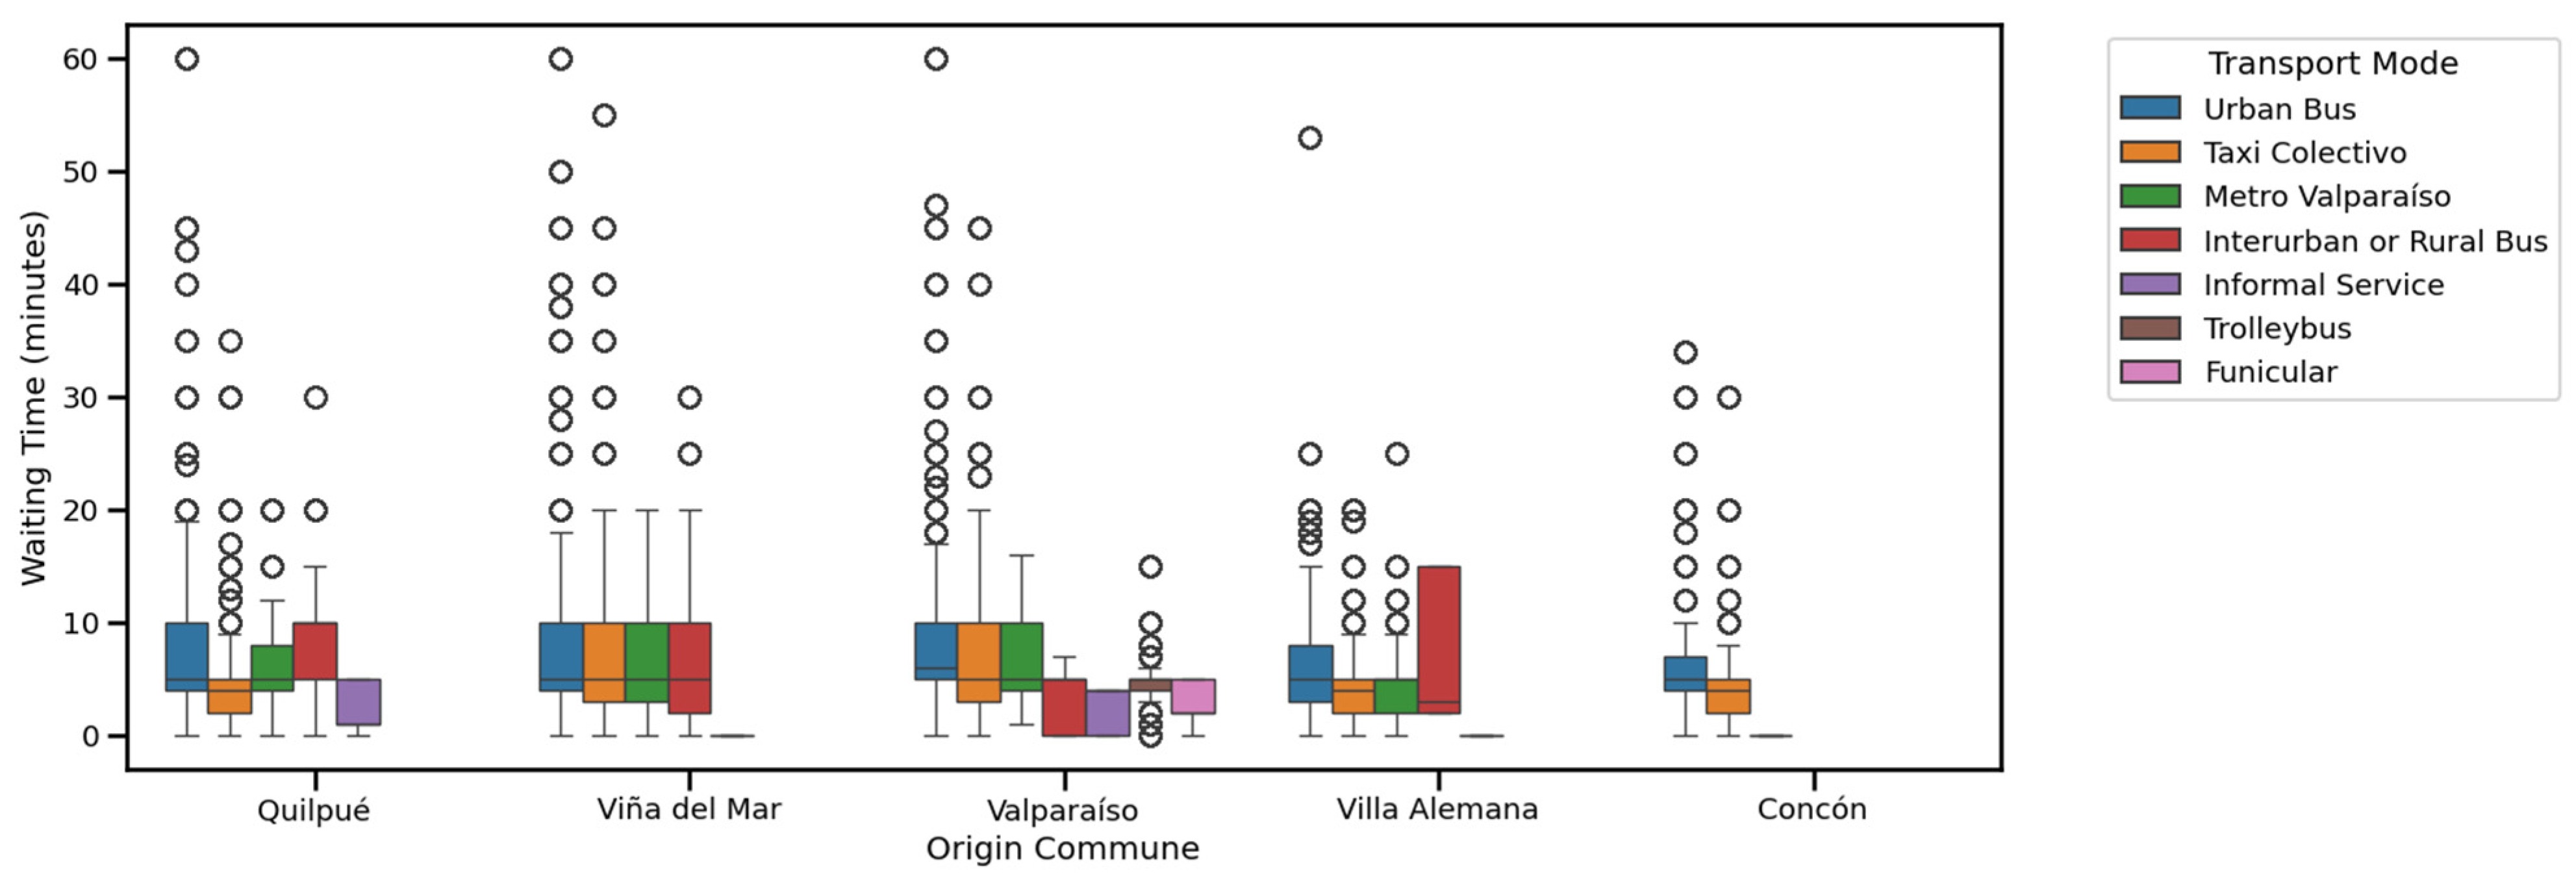
4.1.2. Differences by Transport Mode and Commune
To explore waiting time differences in greater depth, an analysis was conducted based on the origin commune and the mode of transport (
Figure 2). The key findings were as follows:
Urban bus: Exhibits highly variable waiting times, particularly in Valparaíso (median 6.0, std. 7.2 min) and Viña del Mar (median 5.0, std.6.3 min). Other communes show medians around 5.0 min with significant variability as well (Quilpué std.6.2, Concón std.6.0, Villa Alemana std.4.4). Peaks of up to 30–40 min, reflected in the high standard deviations, highlight frequency issues during peak hours, particularly in densely populated areas.
Metro Valparaíso: Shows lower and more consistent waiting times. The median is generally 5.0 min (Valparaíso std.3.2, Viña del Mar std.3.6, Quilpué std.4.0, Villa Alemana std.2.9), with low standard deviations suggesting higher reliability and punctuality. Concón registers a median of 0.0 (std.0.0). No instances above 20 min were observed in the communes analyzed.
Taxi Colectivo: Medians are relatively low, observed at 5.0 min in Valparaíso (std.6.1) and Viña del Mar (std.5.8), and 4.0 min in Quilpué (std.4.6), Concón (std.5.6), and Villa Alemana (std.3.7). However, the standard deviations (ranging from 3.7 to 6.1 min) and observed peaks up to 40–50 min indicate variability and suggest instances of longer waits, likely due to congestion or an insufficient fleet during periods of high demand.
Funicular and Trolleybus: In Valparaíso, both display low, stable waiting times. Funicular shows a median of 2.0 min (std.1.8), while the Trolleybus has a median of 5.0 min (std.2.7). The low standard deviations support their perceived stability, possibly related to their operation on fixed, short routes. (Note: Funicular data also exist for Villa Alemana: median 2.0, std.0.0; Viña del Mar: median 5.0, std.3.6).
Informal services: Show very short waiting times with little variability. Medians range from 0.0 (Villa Alemana std.0.0, Viña del Mar std.0.0) to 1.0 min (Quilpué std.1.9) and 4.0 min (Valparaíso std.2.0). The low standard deviations (0.0 to 2.0 min) confirm low variability, although use appears limited to specific areas.
Interurban or Rural Bus: Waiting time characteristics differ significantly between communes. Medians range from 3.0 min in Villa Alemana (std.5.6) and 5.0 min in Valparaíso (std.2.7) and Viña del Mar (std.8.0), up to 10.0 min in Quilpué (std.5.2). The wide range in both medians and standard deviations (from 2.7 to 8.0 min) indicates inconsistencies in scheduling and frequency.
In summary, notable disparities emerge depending on the commune and the mode of transport. Some services (e.g., Metro, Funicular) prove highly efficient, whereas others (e.g., Urban Bus, Taxi Colectivo) are prone to delays and may require targeted frequency and service-level adjustments.
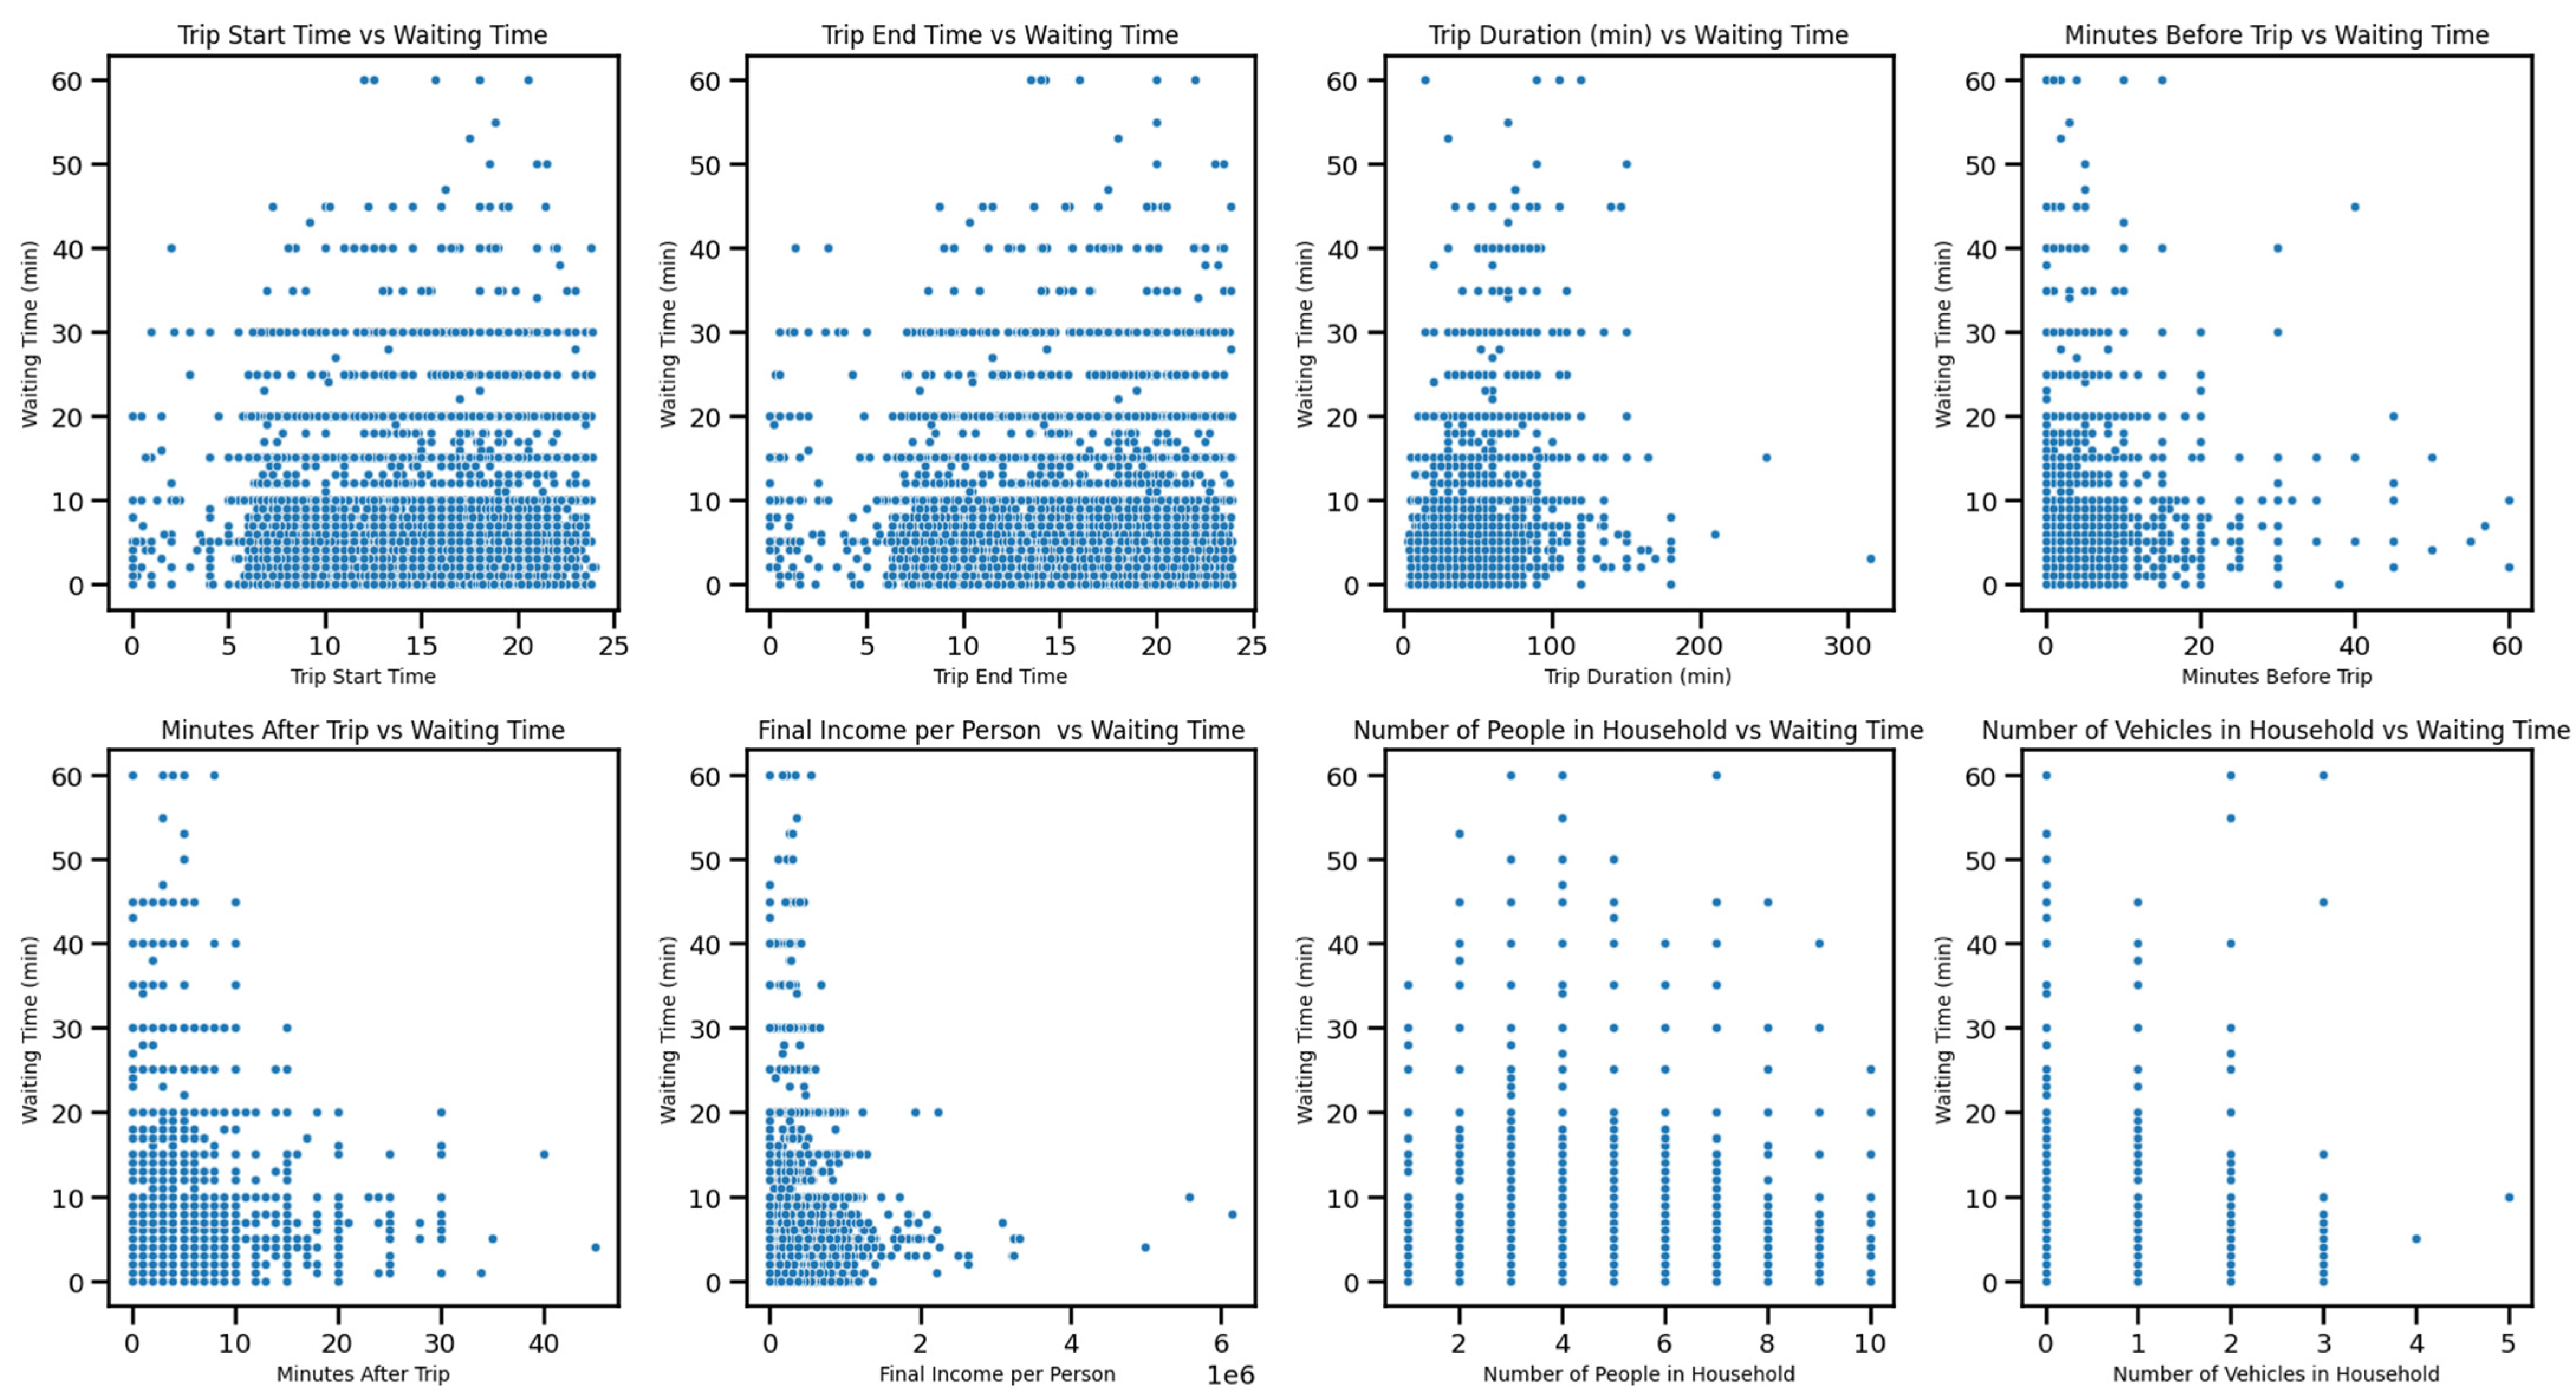
4.1.3. Relationship Between Waiting Time and Other Variables
An examination of waiting times in relation to key variables (
Figure 3) revealed the following:
Start and end times: The longest waits (over 30 min) occur between 11:00 and 21:00, when demand peaks and operational capacity tends to be lower.
Travel duration: On very long routes (>200 min), waiting time variability decreases slightly, suggesting some degree of consistency in long-distance travel, though outliers persist.
Walking minutes: Users who walk more than 20 min show a greater dispersion in waiting times, potentially due to distant stops or lower service frequencies in those areas.
Final income per person: The scatter plot shows no linear trend; nevertheless, lower-income strata display greater dispersion and contain most extreme waits (>40 min). These long upper tails point to localized accessibility gaps that merit targeted operational measures.
Number of persons/vehicles in the household: No strong correlation was found; however, a lack of a private vehicle can heighten dependence on public transport modes with longer waits.
These findings underscore the need to address periods of high demand and to focus on areas with fewer stops or lower-income populations in order to mitigate excessive wait times and improve equity in public transport services.
4.1.4. Temporal Analysis
To complement the above analysis, a temporal assessment of trips throughout the day was performed, considering both public transport demand and waiting times. This approach facilitates the identification of critical periods.
Number of trips vs. time of day (
Figure 4a): Peaks occur at 07:00 (99,734 trips) and, more notably, at 18:00 (121,363 trips), aligning with typical work/school rush hours. Inadequate service frequency during these intervals can significantly increase waiting times.
Average waiting time vs. time of day (
Figure 4b):
- ○
From 00:00 to 05:00, waiting times are high (exceeding 17 min at 03:00), likely due to low operational frequency.
- ○
Between 06:00 and 10:00, waits are below the overall average (7.20 min), with the most efficient period around 08:00 (approximately 6 min).
- ○
After 18:00, waiting times gradually rise again, reaching 9.79 min at 23:00—possibly due to reduced nighttime services.
It is worth noting that
Figure 4b represents the average waiting time for all transport modes; during peak hours, this value remains close to the daily mean because the higher scheduled frequencies of high-capacity services—such as Metro Valparaíso, which operates on segregated infrastructure—offset surface congestion, even though some user groups still experience longer waits.
These patterns highlight the importance of adjusting Urban Bus and Taxi Colectivo operations according to demand, particularly during peak and nighttime periods, to decrease waiting times.
4.1.5. Correlation Analysis
To identify significant linear relationships between waiting time and various variables, Pearson correlation coefficients were calculated using two approaches:
- 1.
General Correlation (
Table 4): Includes all trips.
Urban Bus (0.1035) and Valparaíso Commune (0.0947) exhibit positive correlations with waiting time, consistent with high demand and potential frequency constraints, particularly during peak hours.
Start Time (0.0756) suggests that later trips are slightly more prone to longer waits.
Minutes Before/After the Trip (0.0418 and 0.0348) show weak positive correlations; those who walk more may face lower service frequencies, although this relationship is minor.
Metro Valparaíso (−0.0414), Colectivo Taxi (−0.0844), Quilpué (−0.0433), and Villa Alemana (−0.0919) present negative correlations, associating these modes and communes with shorter waits, though the strength of these relationships is also weak.
- 2.
Correlation for Prolonged Waiting Times (
Table 5): Focuses on trips with waits exceeding 20 min (outliers).
Quilpué (0.1725) stands out with a moderately positive correlation, signaling a higher probability of extremely long waits, possibly due to interurban routes with reduced frequency or coordination issues.
Urban Bus (0.1044) and Trip Start Time (0.1050) remain influential, reflecting peak-demand pressure at specific times of day.
Metro Valparaíso (−0.0263) and Taxi Colectivo (−0.0986) confirm their role in limiting extreme waits.
Minutes Before/After become negative (−0.0447 and −0.0675), suggesting that in this subset of data, walking more might grant access to more regular services.
Valparaíso (−0.1598) shows a moderately negative correlation here, likely due to alternative modes (such as Funiculars or Trolleybuses) that reduce the likelihood of very long waits.
Comparing the two tables reveals both consistent patterns (urban bus emerges as a factor associated with longer waits) and differences, such as the change in Valparaíso’s correlation when focusing on very prolonged waiting times. This outcome underscores the need to analyze trips with extreme delays separately.
In the overall dataset, Valparaíso and urban bus exhibit positive correlations, while Quilpué and modes like Metro or Taxi Colectivo show negative correlations. In the subset featuring prolonged waits, Quilpué becomes more prominent due to a higher probability of severe delays, whereas Valparaíso’s correlation turns negative, possibly because alternative modes reduce waiting times there.
These observations reinforce the importance of improving service frequency and capacity on critical urban bus routes while promoting more reliable transport modes. Moreover, variability in “walking minutes” suggests that having frequent service can compensate for longer pedestrian journeys. Together, these findings support the subsequent spatial autocorrelation and clustering analyses, providing insights for optimizing public transport service.
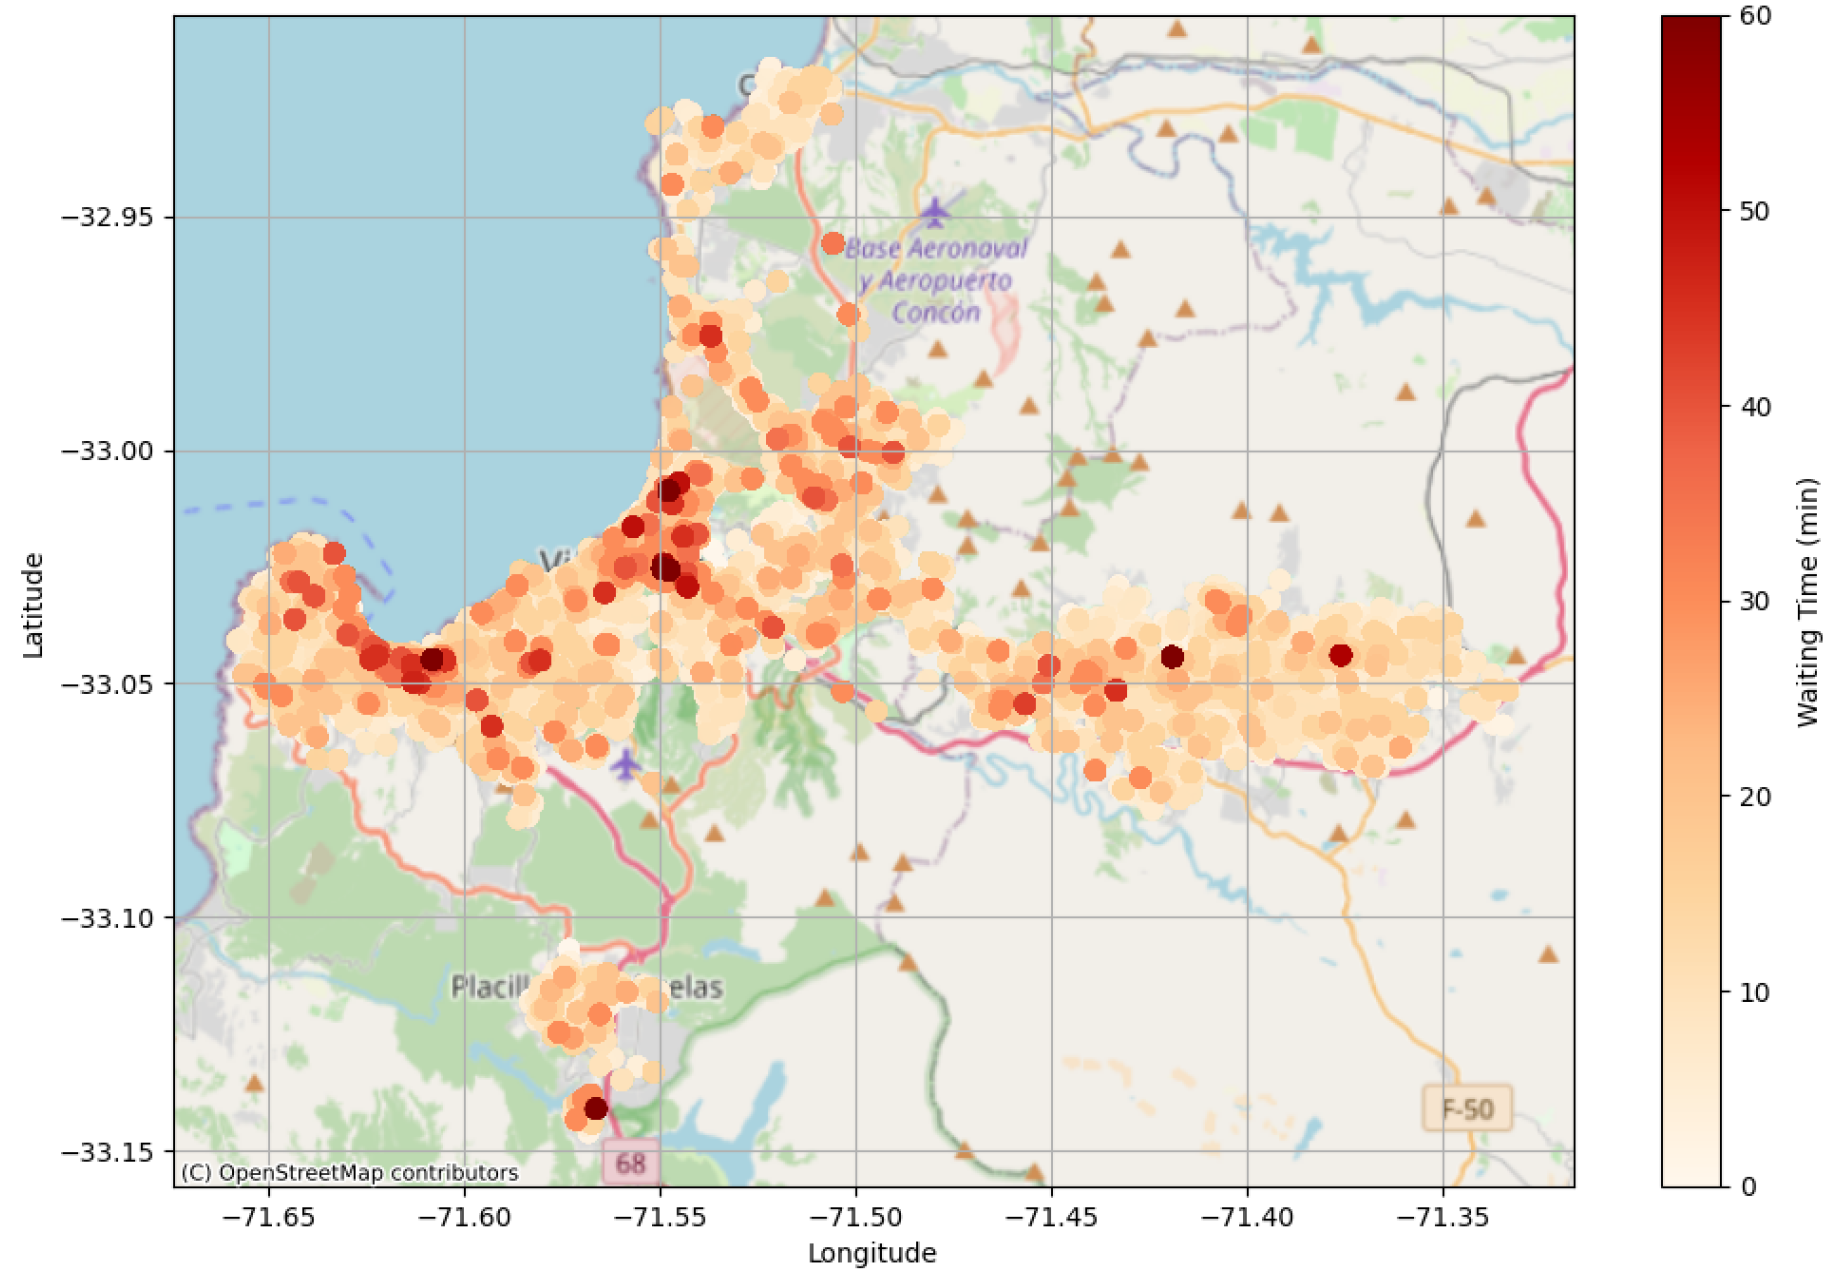
4.2. Spatial Analysis (Moran’s I)
The previous correlation analysis identified relationships between waiting times and variables such as transport mode, origin commune, and trip start time. However, that approach did not explicitly account for the spatial dimension. To determine whether high waiting times cluster geographically, Moran’s I was applied to evaluate the presence of spatial autocorrelation in the variable of interest.
As an initial step, a heat map (
Figure 5) was generated to visualize the distribution of waiting times in Greater Valparaíso. Key observations include:
Viña del Mar exhibits various areas with very long waits (30–60 min), aligning with previous findings on congestion and high demand on certain urban bus routes (see
Section 4.1.2).
Valparaíso, though it records a high volume of trips, shows specific sectors with prolonged waits (e.g., parts of the hillside areas), albeit fewer than in Viña del Mar.
Quilpué and outlying areas such as Placilla display some points with high waiting times, suggesting lower transport frequencies in peripheral regions.
While the heat map provides an initial view of where long waits are concentrated, a more robust statistical analysis is required to confirm whether these concentrations are statistically significant or merely random. Moran’s I serves this purpose.
The calculation and detailed interpretation of Moran’s I are presented in
Section 3.2.2, so only the main findings are discussed here. Initially, k = 12 was set for the k-nearest neighbors (KNN) method, which generated 5723 disconnected components. After various tests, k = 20 was deemed more appropriate, reducing the number of disconnected points to 5641 (less than 0.5% of about 1.4 million trips), thus assuming minimal impact.
Nonetheless, to ensure robustness, two Moran’s I calculations were performed:
Including all points, even those disconnected.
Excluding the disconnected points and using only effective spatial relationships.
The results were as follows:
As shown in
Table 6, Moran’s I (I ≈ 0.5177) and
p-value = 0.001 in both cases confirm a strong spatial autocorrelation. The slight variation in Z-scores (2663.38 vs. 2714.04) indicates that excluding disconnected points does not substantially alter the analysis. Hence, the observed spatial patterns in waiting times are not random; there are statistically significant clusters of similar values.
The high positive value of I indicates that areas with long waiting times are often surrounded by other areas that also experience lengthy waits (and vice versa for short waits), suggesting geographic or urban planning factors that influence transport efficiency. Since this strong spatial autocorrelation revealed inequalities in critical areas, the next step involved applying a clustering analysis to pinpoint these groupings more accurately, facilitating targeted interventions to improve service.
4.3. Clustering Analysis (DBSCAN) and Discussion
As described in
Section 3.2.3, an adapted version of the DBSCAN algorithm optimized with KD-Tree was used for the clustering analysis. This approach was chosen due to computational limitations arising from the size of the complete dataset (approximately 1,400,000 records). To ensure the feasibility of the analysis without sacrificing representativeness, an initial sample of 17,951 records was used, weighted with expansion factors reflecting the statistical distribution of the total population.
“Waiting Time” and “Mode of Transport” were exclusively selected because they describe operational attributes of the service, independent of travelers’ socioeconomic characteristics. In preliminary tests, the inclusion of additional variables (such as demographic or socioeconomic data) within the algorithm degraded cluster quality (silhouette coefficient < 0.15), blurring the distinction between trips with long and short waits and, consequently, reducing the interpretability and usefulness of the results. However, socioeconomic variables were applied ex post—outside the algorithm—to characterize each cluster.
Selection of eps_value and min_samples Parameters: Calibration of eps_value and min_samples followed an iterative approach. Ranges of eps_value from 0.1 to 1.0 and min_samples from 5 to 50 were tested. Low eps_value values (<0.3) generated excessive noise (>50%) and fragmented clusters, whereas higher values (>0.7) merged heterogeneous groups. Regarding min_samples, values above 30 eliminated small yet significant clusters, and values below 10 increased noise. After evaluating internal cohesion using the silhouette coefficient, eps_value = 0.5 and min_samples = 20 were selected, achieving a balance between robustness and granularity in cluster formation.
KD-Tree Implementation With Expansion Factors: In the implementation, expansion factors were incorporated as weights into the KD-Tree density calculation, ensuring each point reflected its representativeness in the total population. This strategy preserved the statistical fidelity of the clusters with respect to the actual transport system. Furthermore, KD-Tree optimization substantially reduced computational complexity, allowing efficient handling of weighted data volumes without compromising analysis quality.
Cluster Characterization
Using the adapted DBSCAN algorithm, clustering analysis identified user groups with similar patterns in waiting time and transport mode in Greater Valparaíso. With a weighted silhouette coefficient of 0.7247, the robustness and internal consistency of the resulting clusters were confirmed, indicating that waiting time patterns and transport modes were meaningfully captured.
A total of nine clusters were identified, along with a group of points classified as noise.
Table 7 summarizes the main characteristics of each cluster.
It is important to note that cluster −1 encompasses points that the DBSCAN algorithm classified as noise. These points do not meet the specified density criteria and, therefore, are not assigned to any particular cluster. Although they represent a small proportion of the dataset, their inclusion in the analysis provides a complete view and accounts for possible outliers or cases that do not follow the general patterns.
To clarify the analysis, clusters were grouped into three categories based on waiting times, as detailed in
Table 8.
Clusters with Low Waiting Times. These clusters represent users whose waiting times are below the overall average, indicating greater transport service efficiency. Commonly used modes of transport in these clusters include funicular (Cluster 7), trolleybus (Cluster 5), Taxi Colectivo (Cluster 1), and Metro Valparaíso (Cluster 2). The most frequent home macrozones are Valparaíso Alto and Villa Alemana Norte. The users in these clusters are mainly employees or workers and students, suggesting that these efficient modes of transport are used for both work-related and educational purposes.
Cluster with Waiting Times Near the Average. Cluster 0 is the largest group, encompassing users with waiting times close to the overall average. Most of these users are students who use urban buses in the Santa Julia macrozone to return home. Although the waiting times are not exceedingly long, there is some variability, indicating opportunities to enhance service regularity.
Clusters with High Waiting Times. These clusters are of particular interest because users experience waiting times significantly above the average, negatively affecting their experience and satisfaction with public transport. According to the definition provided in
Section 3.2.3, clusters with mean waiting times ≥ 20 min and above the global average of 7.20 min (i.e., clusters 3, 4, 6, and 8) are classified as ‘most affected users’.
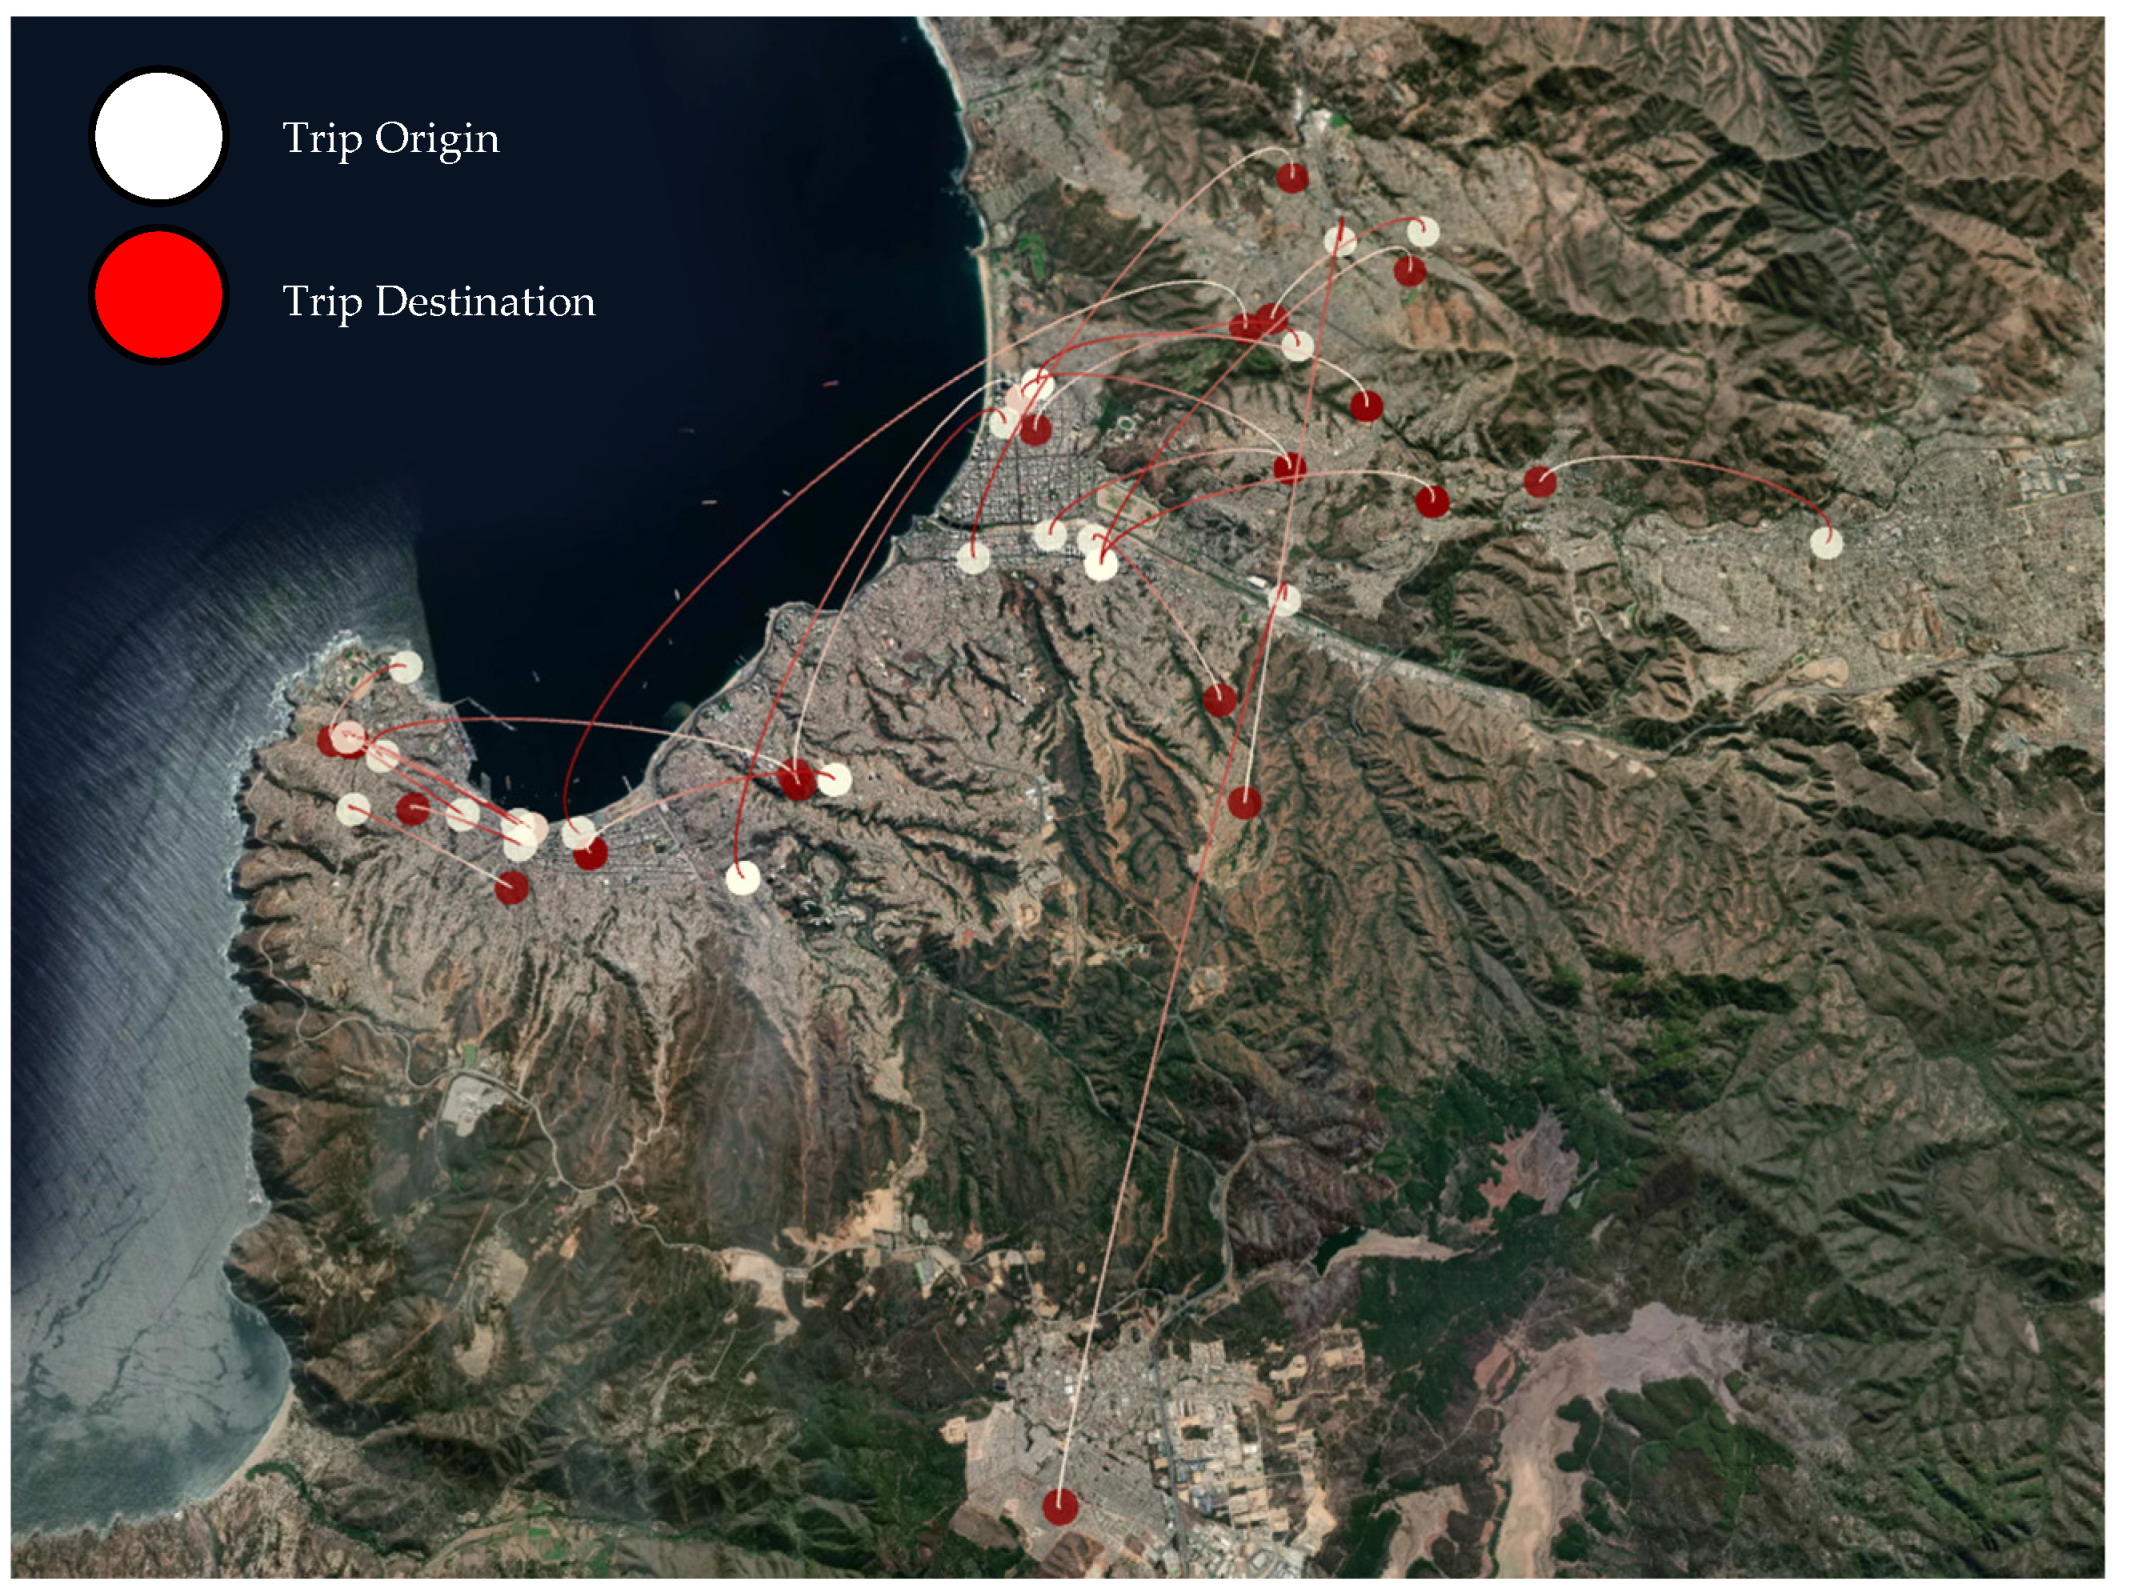
Cluster 3: Users predominantly from Santa Julia using urban buses, with an average waiting time of 39.88 min. Moreover, the low standard deviation indicates that all users in this cluster experience similar waiting times, pointing to a systemic frequency or availability issue in urban bus service in Santa Julia. As shown in
Figure 6, most trips start or end in a peripheral area.
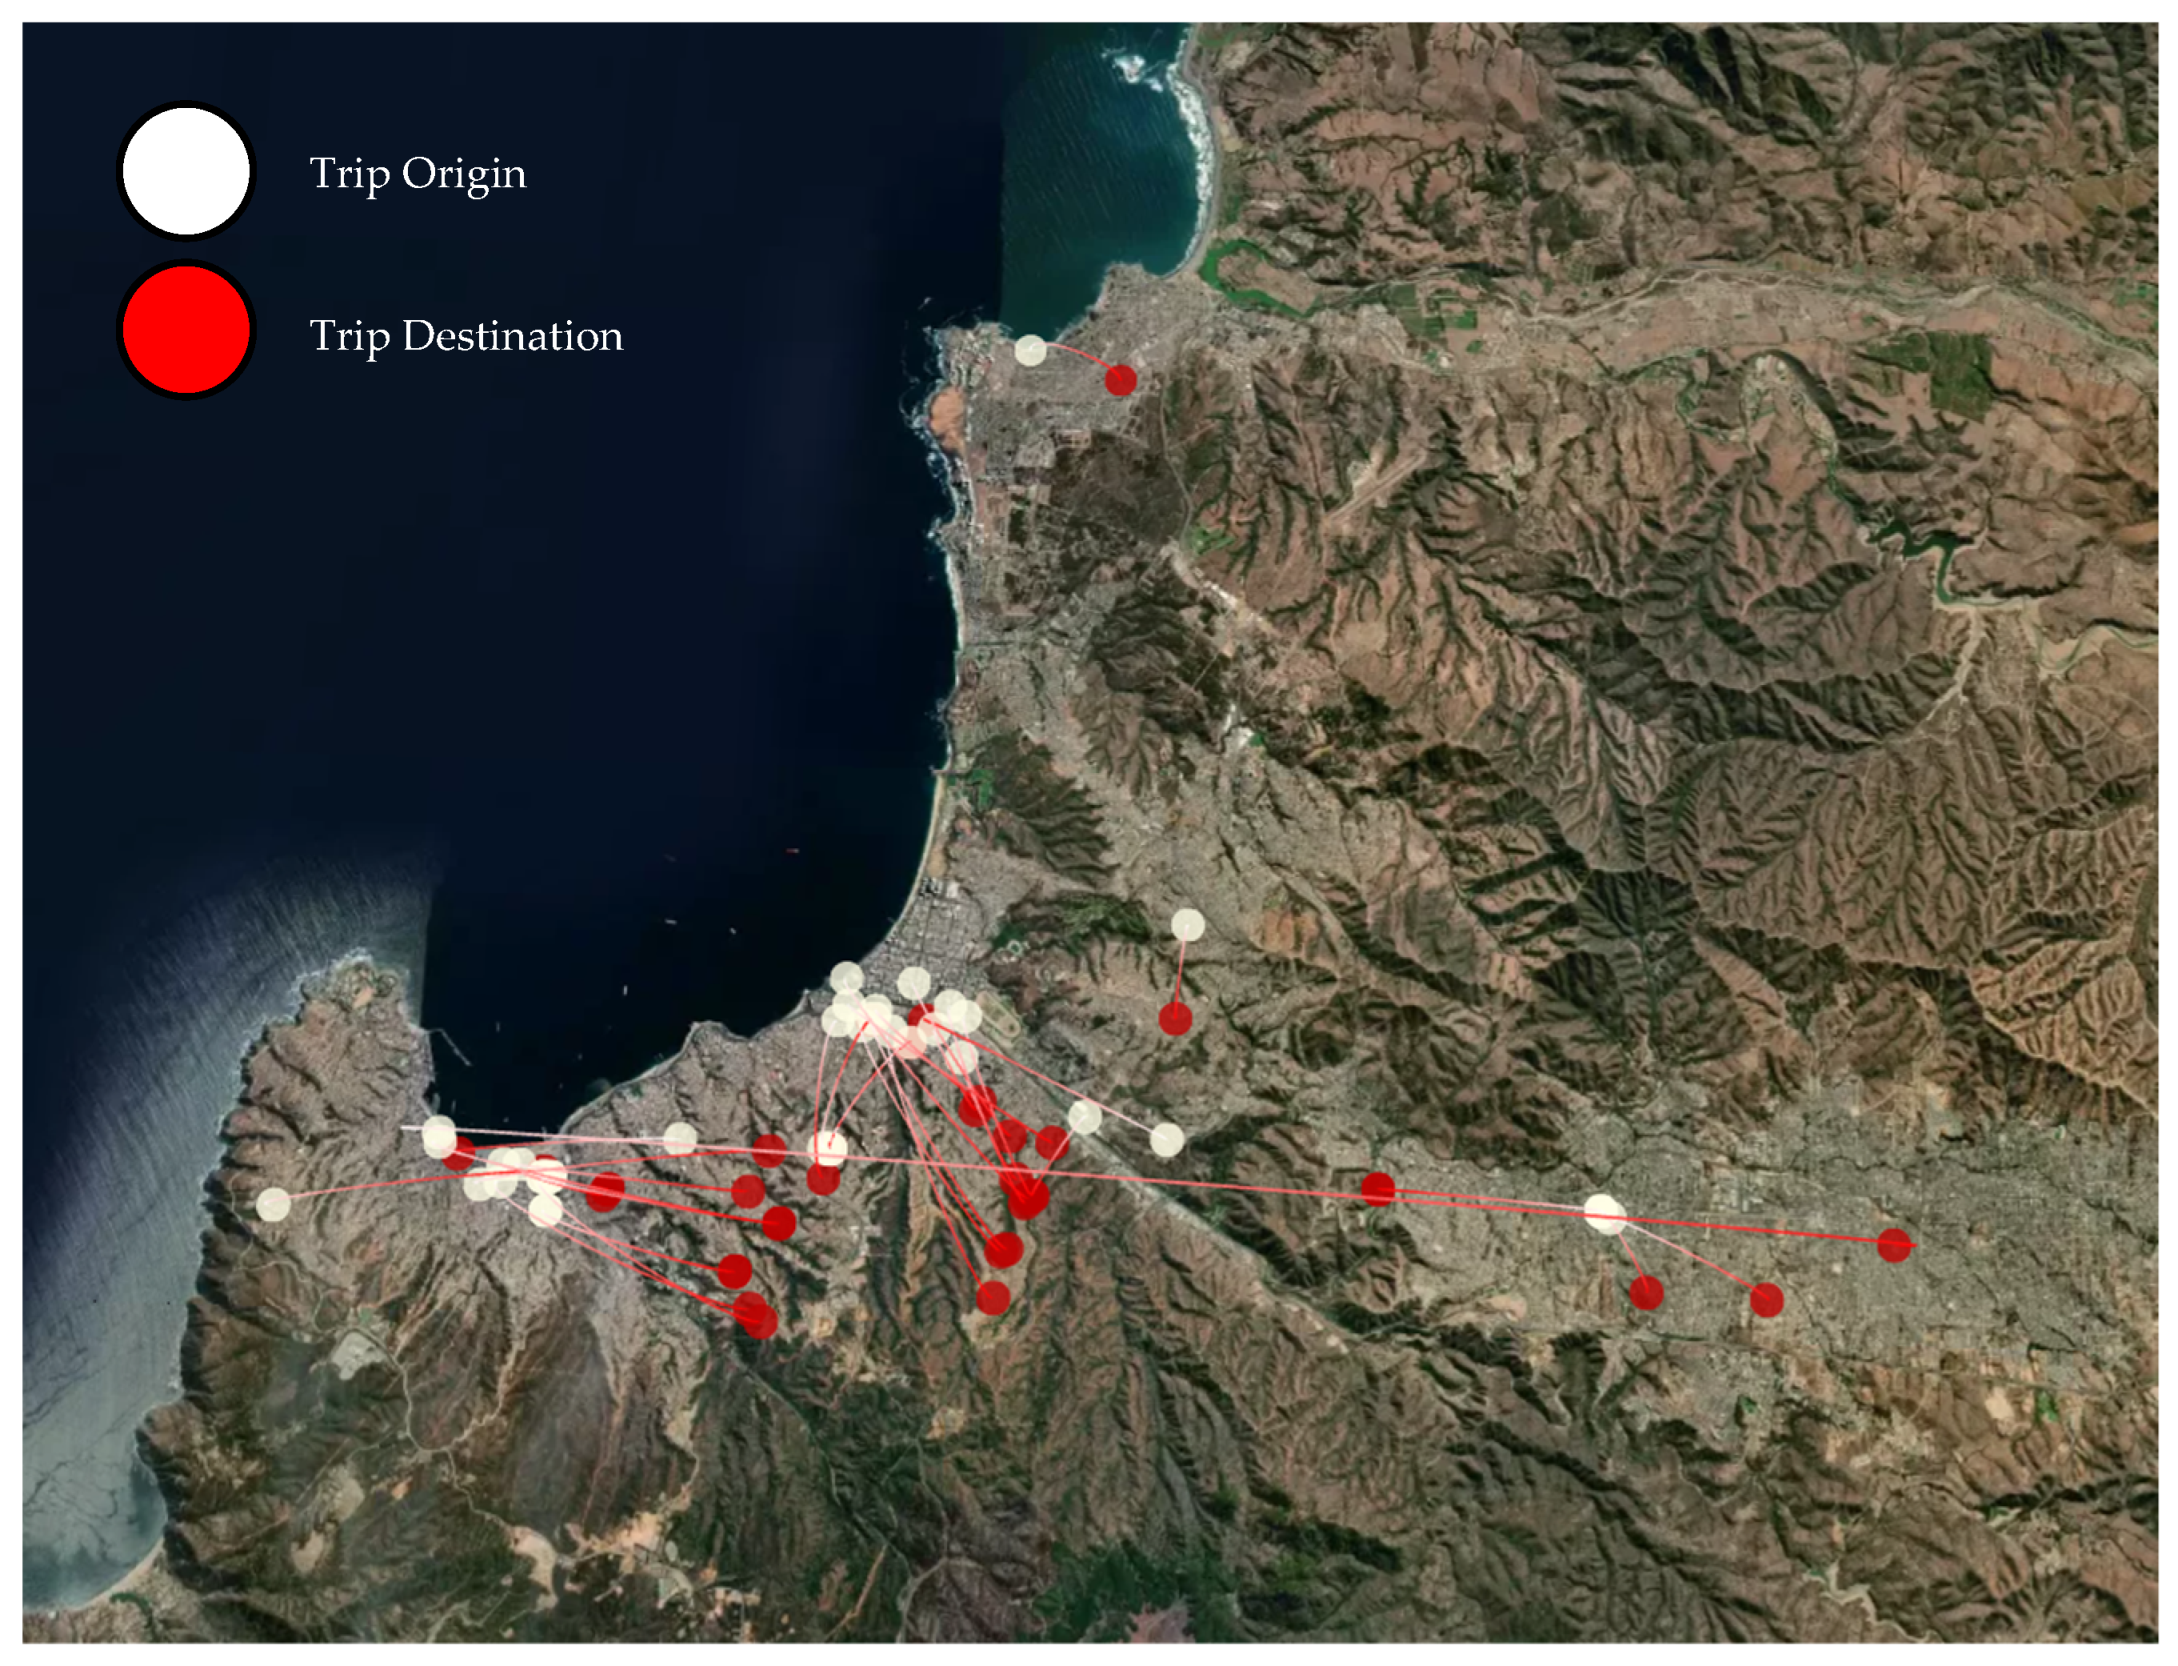
Cluster 4: Users primarily from Viña del Mar Oriente, also relying on urban buses, with an average waiting time of 34.95 min. Though this is a small cluster, it highlights a critical situation where vulnerable users, such as unpaid family members, face lengthy waits, potentially affecting their access to services and opportunities. The spatial distribution of trips in this cluster is shown in
Figure 7.
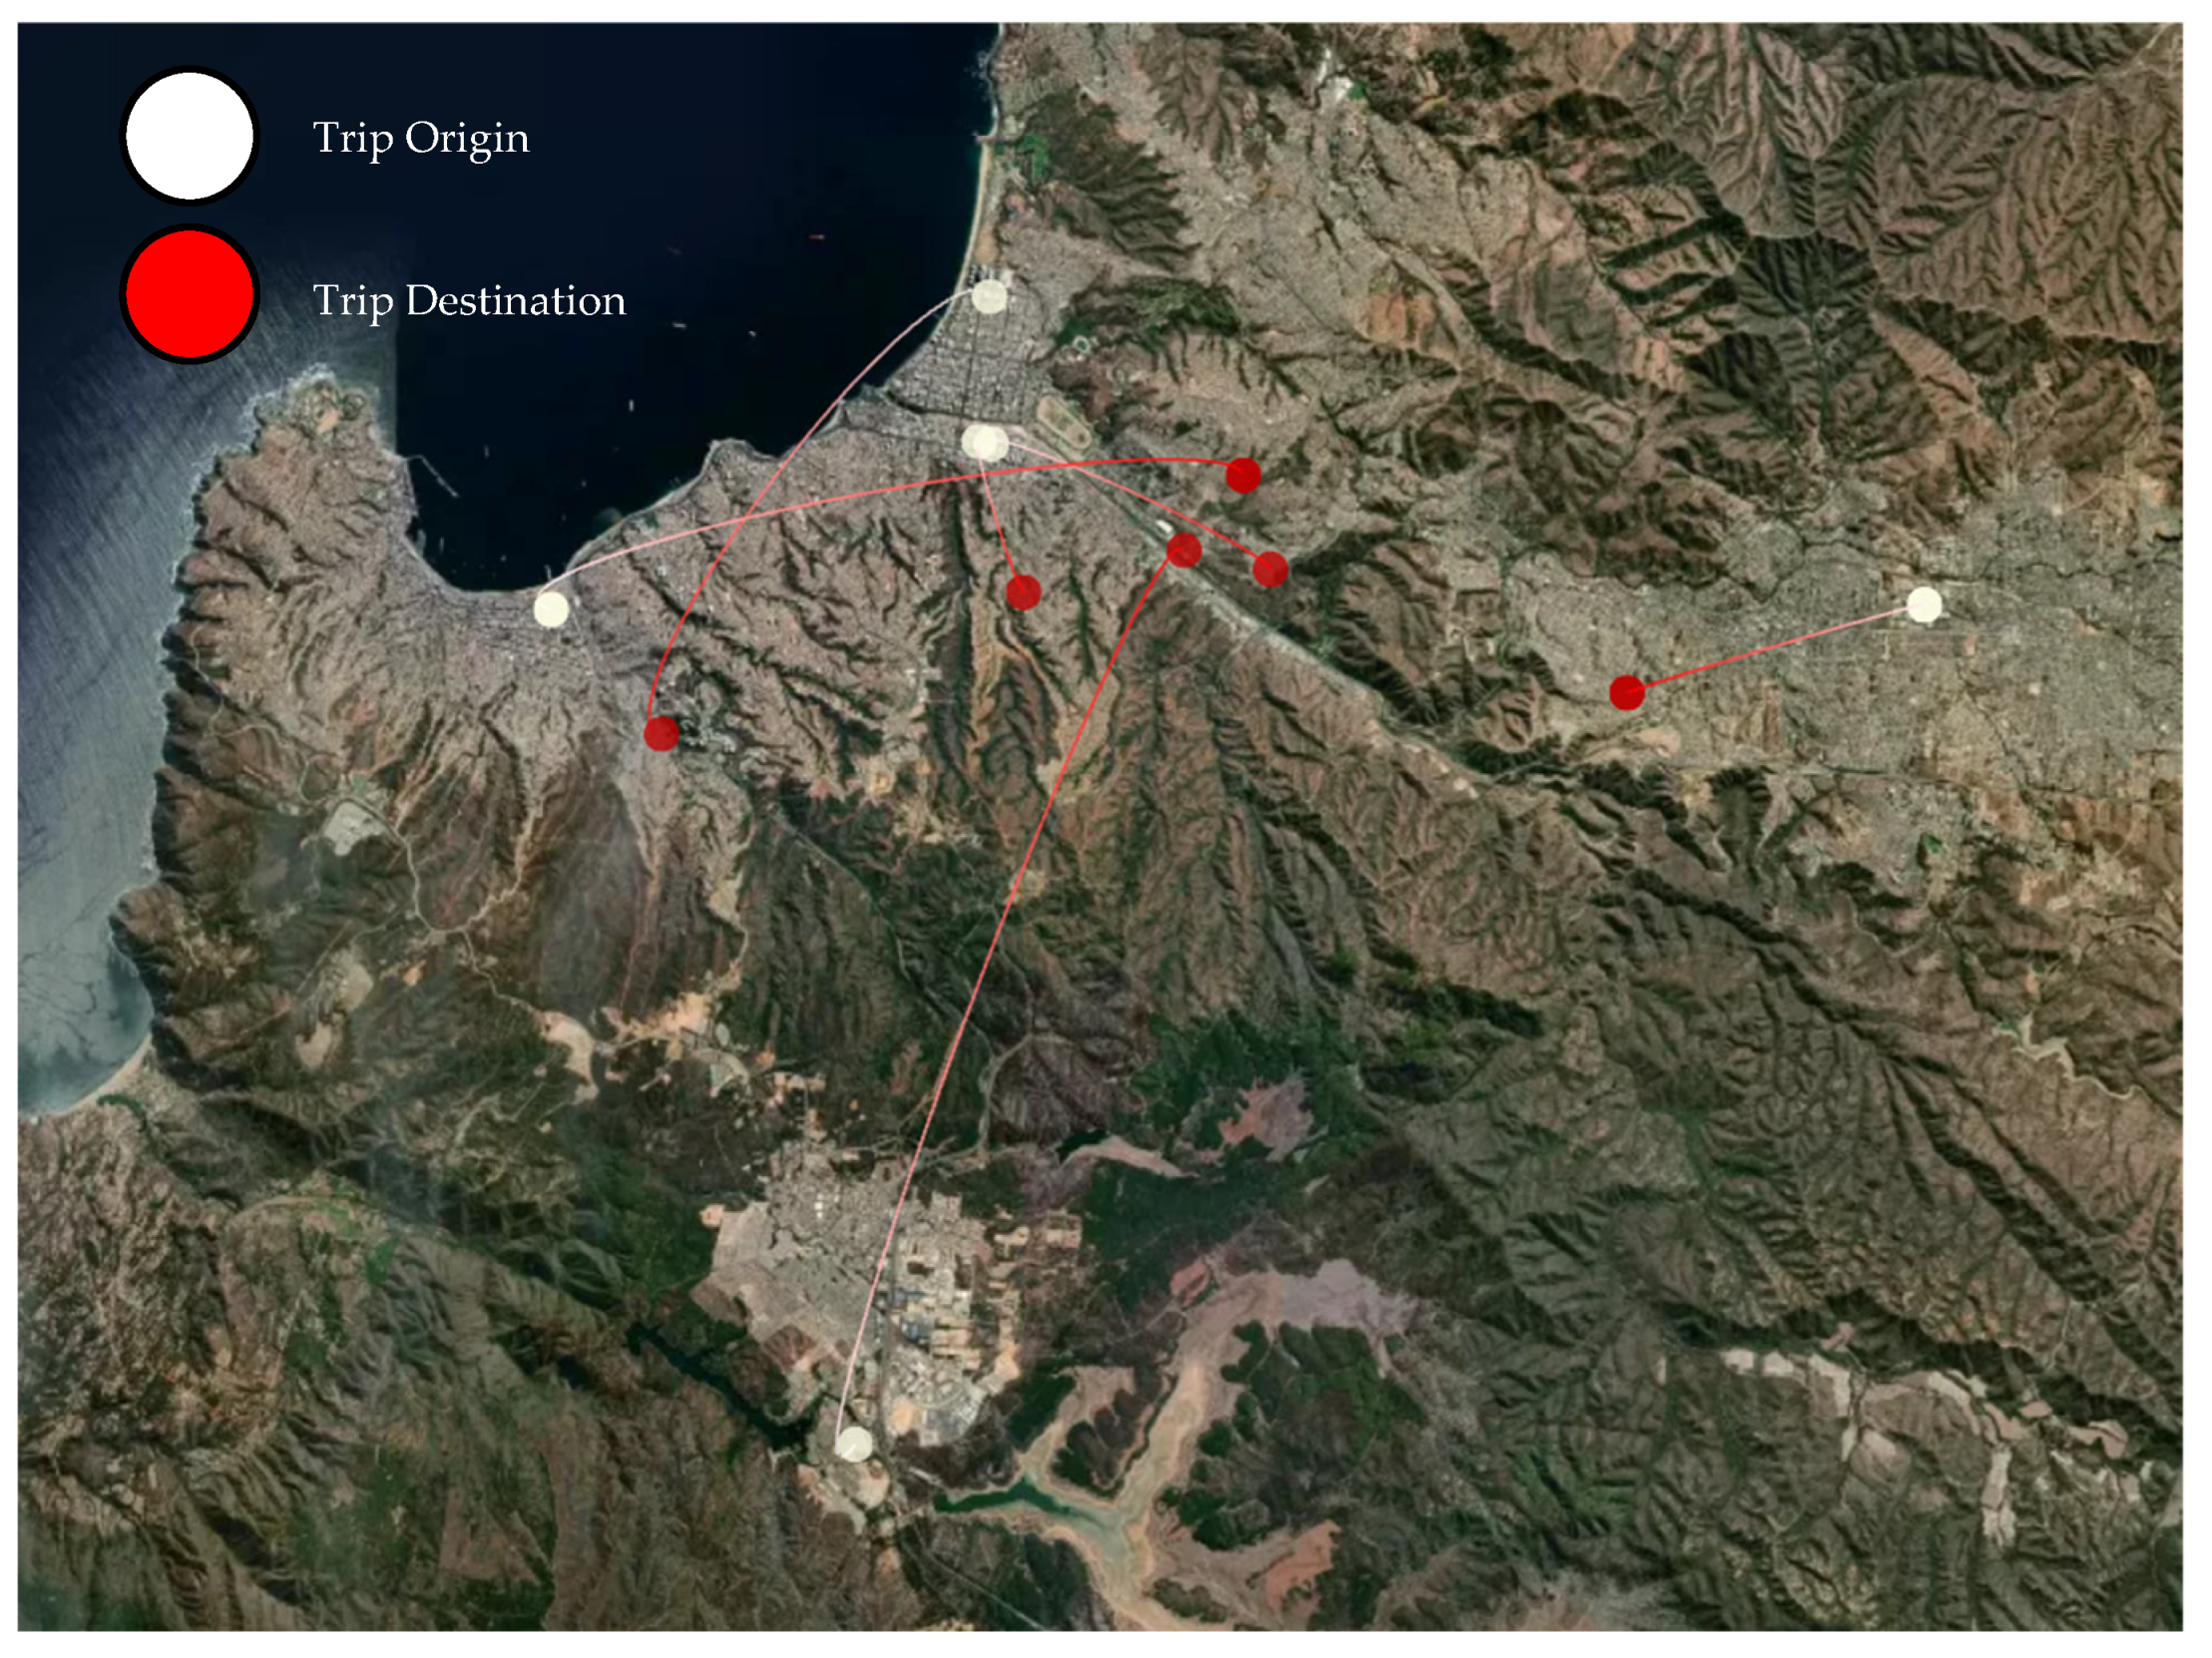
Cluster 6: Users primarily from Forestal who use Taxi Colectivos, with a fixed waiting time of 30.00 min. The absence of variability and the fixed wait time suggest specific schedules or limited Taxi Colectivo availability in Forestal, negatively impacting residents’ mobility. The spatial distribution of trips in this cluster is shown in
Figure 8.
Cluster 8: Users primarily from Miraflores who use urban buses, encountering a maximum waiting time of 60.00 min. This cluster has the longest waiting time, revealing an extreme situation in Miraflores where users wait a full hour for urban buses—an unacceptable circumstance that requires intervention. The spatial distribution of trips in this cluster is shown in
Figure 9.
Users in these clusters are primarily employees/workers and unpaid family members, indicating that these delays affect individuals who may have limited schedule flexibility or fewer resources to access alternative transport options.
4.4. Overall Discussion of Results
Integrating the findings from the EDA, the spatial autocorrelation (Moran’s I), and the clustering (DBSCAN) reveals that public transport in Greater Valparaíso exhibits notable disparities in waiting times. Three aspects, in particular, deserve attention:
Mode of Transport as a Key Factor
- ○
Clusters with low waiting times (e.g., Cluster 7 featuring Funiculars and Cluster 2 featuring Metro Valparaíso) underscore the importance of high-frequency services and fixed routes, aligning with previous studies that emphasize the relationship between frequency and reliability [
20].
- ○
In contrast, urban buses account for the longest delays (Cluster 8 at 60 min, Cluster 3 at 39.88 min), reinforcing findings from other research indicating congestion and operational variability as critical factors [
22]
- ○
Taxi Colectivo displays dual behavior: They are efficient in some areas (Cluster 1) but can present systematic delays in others (Cluster 6), possibly due to insufficient supply or a lack of coordination with local demand.
Spatial Distribution and Inequalities
- ○
The high spatial autocorrelation (Moran’s I = 0.5177, p < 0.001) confirms that waiting times are not randomly distributed but cluster in specific locations, such as Santa Julia, Viña del Mar Oriente, and Miraflores, a pattern also hinted at in the heat map.
- ○
These areas share distinctive urban and sociodemographic conditions: high density, limited infrastructure, and less access to efficient modes. This concentration of elevated waiting times is consistent with literature pointing to spatial factors in service availability Luo et al. [
12].
More Vulnerable User Groups
- ○
Individuals with lower incomes (unpaid family members) are hit hardest by prolonged waits (Cluster 4). This finding aligns with studies documenting inequalities in public transport access [
22].
- ○
Even users with near-average waiting times (Cluster 0) face notable variability, reflecting service inconsistencies and underscoring the need for frequency adjustments.
These conclusions call for prioritizing enhanced frequency and capacity of urban bus services, combined with bolstering more reliable modes (Metro Valparaíso, Trolleybuses, Funiculars). Real-time information, as proposed by other studies (Čelan et al. [
24]), could alleviate negative perceptions of waiting without necessitating significant infrastructure investments.
Collectively, these results suggest increasing bus frequency and capacity, in addition to reinforcing more reliable modes (Metro, Trolleybuses). Implementing real-time information systems (Čelan et al. [
24]) may reduce the negative perception of waiting times without requiring major infrastructure work. Furthermore, updating data emerges as a primary challenge; the findings reflect conditions as of 2014, and newer methodologies (e.g., image recognition and AI techniques) could enable more current data collection and ongoing diagnostics for the transport system.
5. Conclusions and Final Considerations
This study analyzed waiting times in Greater Valparaíso’s public transportation system using an approach that combines exploratory analysis, spatial autocorrelation, and clustering. The results are consistent with prior research [
20,
22] highlighting the importance of service frequency and geographic location in shaping the user experience.
The findings indicate that waiting times vary substantially depending on the mode of transportation and geographic location. Modes such as Metro Valparaíso, Trolleybuses, and Funiculars display short, stable waiting periods (3.14–5.90 min), whereas urban buses exhibit longer delays (up to 60 min) in areas such as Santa Julia, Viña del Mar Oriente, and Miraflores. Spatial autocorrelation confirms that these prolonged waits cluster in specific sectors, influenced by low service frequency and limited infrastructure. From a sociodemographic perspective, employees, laborers, and unpaid family members, typically low-income groups, are most affected, revealing an equity gap in access to transportation.
5.1. Limitations
Outdated Database. Although the SECTRA 2014 Origin–Destination Survey remains the only dataset that jointly provides georeferenced trip origins and destinations, detailed waiting times and traveller socio-economic attributes for the Greater Valparaíso Metropolitan Area, the time span of more than ten years means that our findings should be regarded as a historical baseline. Socio-economic change, the COVID-19 pandemic and subsequent operational adjustments may have reshaped mobility patterns. Nevertheless, official documents released between 2020 and 2024 suggest that the physical layout of the three key modes—Limache-Puerto commuter rail, the trunk bus corridor and the historic funicular network—has undergone only minor modifications [
42,
43,
44]. Accordingly, any projection of our results to the present should be made with appropriate caution, acknowledging potential shifts in demand and operation.
Network Structure Representation. It is important to acknowledge that the present spatial analysis of aggregated waiting times does not explicitly incorporate the structural characteristics of the transit network, such as route connectivity, headways, and overlapping service corridors. The survey-based nature of the SECTRA 2014 dataset provides user-reported waiting times aggregated at the commune and macrozone level, which reflect experiential delays across all served routes but do not permit disaggregation by specific route frequency or multi-route overlap. Consequently, zones with differing numbers of overlapping routes and service headways may exhibit apparent differences in waiting times that partly stem from the aggregation process rather than inherent spatial autocorrelation. While detailed transit schedule and route topology data were not available for the study period, the overall spatial patterns remain robust given the high positive Moran’s I value and the clustering results derived from user-experienced waiting times. Future research should integrate transit network attributes—such as route graphs and headway-weighted spatial weights matrices—to more precisely account for network structure and to mitigate potential aggregation bias.
Lack of Subjective Perception. The absence of qualitative data or satisfaction metrics constrains a deeper understanding of the real impact of waiting times. Future studies could incorporate surveys or urban neuroscience methods [
15] to gain insights into users’ psychological responses.
Transferability. While the results offer valuable guidance for comparable contexts, replicating the methodology with more recent data and in other urban regions would strengthen external validity.
5.2. Future Research Directions
Building on the temporal constraints identified above, future work could:
deploy computer-vision passenger counts at stations and stops;
exploit smart-card validation records and AVL/GPS feeds to reconstruct door-to-door trajectories and measure observed waiting times;
integrate these streams with iterative or explainable Data Envelopment Analysis (DEA) to assess origin–destination or transfer efficiencies in multimodal contexts.
In this way, the present work can be extended and strengthened, using the 2014 baseline as a reference point.
Based on the above, three practical implications arise:
5.3. Implications for Practice
Increase Service Frequency and Coverage. Reinforce bus schedules and routes in areas and during times of high demand (especially for urban buses) to reduce variability in waiting times. A temporal analysis (
Figure 6) shows that from midnight to 05:00, the average waiting time exceeds 17 min, likely due to very low service frequency. Between 06:00 and 10:00, waiting times decrease (reaching a minimum of around 6 min at 08:00), while starting at 18:00, they gradually rise again, reaching about 9.8 min by 23:00. These sub-periods differ from the general correlations (e.g., 11:00–21:00), demonstrating the necessity of adjusting schedules hourly and enhancing fleet capacity during peak or nighttime hours.
Expand Alternative Modes and Real-Time Information. Promote modes such as Metro Valparaíso and Trolleybuses, which exhibit consistently better performance, and implement real-time information systems [
24] to enhance users’ perception of service quality.
Assess Cost-Effectiveness and Operational Impact. While boosting service frequency and enlarging the fleet can shorten waiting times, these measures entail substantial capital and operating expenses and may introduce vehicle interactions that generate internal delays. We therefore recommend preliminary cost–benefit analyses and small-scale pilot tests to ensure both financial and operational viability.
Despite the temporal constraints noted above, increasing service frequency, improving the spatial distribution of transportation options, and utilizing emerging technologies for data collection and analysis are key strategies for optimizing service and reducing inequalities in Greater Valparaíso’s public transport. Supported by additional research and the involvement of local stakeholders, these measures can foster a more equitable and efficient transport system.
Author Contributions
Conceptualization, F.G. and V.A.; Methodology, F.G.; Software, F.G.; Validation, F.G, V.A. and S.S.; Formal analysis, F.G.; Investigation, F.G. and V.A.; Resources, A.P.; Data curation, F.G.; Writing—original draft, F.G.; Writing—review and editing, F.G., V.A., S.S. and A.P.; Visualization, F.G.; Supervision, V.A.; Project administration, V.A.; Funding acquisition, A.P. All authors have read and agreed to the published version of the manuscript.
Funding
This research was funded by Agencia Nacional de Investigación y Desarrollo (ANID) Chile, grant number Fondecyt 11230050.
Data Availability Statement
The raw data used in this study are publicly available from the Greater Valparaíso Mobility and Transport Survey conducted by SECTRA. Researchers interested in examining the raw dataset should visit the official SECTRA website and follow the instructions provided there to download the data. The processed datasets derived from the clustering analysis and other procedures were generated by the authors and are available from the corresponding author upon reasonable request.
Conflicts of Interest
The authors declare no conflicts of interest.
Abbreviations
The following abbreviations are used in this manuscript:
| BRT | Bus Rapid Transit |
| DBSCAN | Density-Based Spatial Clustering of Applications with Noise |
| EDA | Exploratory Data Analysis |
| KD-Tree | K-Dimensional Tree |
| KNN | K-Nearest Neighbors |
| SECTRA | Transportation Planning Secretariat |
References
- Bauernschuster, S.; Hener, T.; Rainer, H. When labor disputes bring cities to a standstill: The impact of public transit strikes on traffic, accidents, air pollution, and health. Am. Econ. J. Econ. Policy 2017, 9, 1–37. [Google Scholar] [CrossRef]
- López, C.; Ruiz-Benítez, R.; Vargas-Machuca, C. On the environmental and social sustainability of technological innovations in urban bus transport: The EU case. Sustainability 2019, 11, 1413. [Google Scholar] [CrossRef]
- Gallotti, R.; Barthelemy, M. Anatomy and efficiency of urban multimodal mobility. arXiv 2014. [Google Scholar] [CrossRef]
- Lachapelle, U.; Boisjoly, G. Breaking down public transit travel time for more accurate transport equity policies: A trip component approach. Transp. Res. Part A Policy Pract. 2023, 175, 103756. [Google Scholar] [CrossRef]
- Vaishnav, P.; Tsuchiya, M.; Cobb, A. Chicago riders’ choice of Uber and Lyft over transit implies a median breakeven value of travel time. Environ. Sci. Technol. 2025, 59, 1921–1931. [Google Scholar] [CrossRef]
- Griffin, G.P.; Sener, I.N. Public transit equity analysis at metropolitan and local scales: A focus on nine large cities in the US. J. Public Transp. 2016, 19, 126–143. [Google Scholar] [CrossRef]
- Kieu, L.-M.; Bhaskar, A.; Chung, E. A modified density-based scanning algorithm with noise for spatial travel pattern analysis from Smart Card AFC data. Transp. Res. Part C Emerg. Technol. 2015, 58, 193–207. [Google Scholar] [CrossRef]
- Zhang, X.; Lauber, L.; Liu, H.; Shi, J.; Wu, J.; Pan, Y. Research on the method of travel area clustering of urban public transport based on Sage-Husa adaptive filter and improved DBSCAN algorithm. PLoS ONE 2021, 16, e0259472. [Google Scholar] [CrossRef]
- SECTRA. Diagnóstico Transporte Público Zonas Altas de Valparaíso. In Informe Ejecutivo; Ministerio de Transportes y Telecomunicaciones: Valparaíso, Chile, 2019; Available online: https://www.ascenval.cl/documentos/Diagnóstico_tpte_público_zonas_altas_Valpo_Inf_Ejec.pdf (accessed on 28 April 2025).
- Nikolaidou, A.; Kopsacheilis, A.; Georgiadis, G.; Noutsias, T.; Politis, I.; Fyrogenis, I. Factors affecting public transport performance due to the COVID-19 outbreak: A worldwide analysis. Cities 2023, 134, 104206. [Google Scholar] [CrossRef]
- Kujala, R.; Weckström, C.; Mladenović, M.N.; Saramäki, J. Travel times and transfers in public transport: Comprehensive accessibility analysis based on Pareto-optimal journeys. Comput. Environ. Urban Syst. 2018, 67, 41–54. [Google Scholar] [CrossRef]
- Luo, D.; Cats, O.; van Lint, H.; Currie, G. Integrating network science and public transport accessibility analysis for comparative assessment. J. Transp. Geogr. 2019, 80, 102505. [Google Scholar] [CrossRef]
- Altarifi, F.; Louzi, N.; Abudayyeh, D.; Alkhrissat, T. User preference analysis for an integrated system of bus rapid transit and on-demand shared mobility services in Amman, Jordan. Urban. Sci. 2023, 7, 111. [Google Scholar] [CrossRef]
- Hernandez, S.; Monzon, A. Key factors for defining an efficient urban transport interchange: Users’ perceptions. Cities 2016, 50, 158–167. [Google Scholar] [CrossRef]
- Qin, T.; Dong, W.; Huang, H. Perceptions of space and time of public transport travel associated with human brain activities: A case study of bus travel in Beijing. Comput. Environ. Urban Syst. 2023, 99, 101919. [Google Scholar] [CrossRef]
- Tahmasbi, B.; Haghshenas, H. Public transport accessibility measure based on weighted door to door travel time. Comput. Environ. Urban Syst. 2019, 76, 163–177. [Google Scholar] [CrossRef]
- Zhao, D.; Wang, W.; Woodburn, A.; Ryerson, M.S. Isolating high-priority metro and feeder bus transfers using smart card data. Transportation 2017, 44, 1535–1554. [Google Scholar] [CrossRef]
- Lee, E.H.; Lee, E. Iterative DEA for public transport transfer efficiency in a super-aging society. Cities 2025, 162, 105957. [Google Scholar] [CrossRef]
- Lee, E.H. eXplainable DEA approach for evaluating performance of public transport origin–destination pairs. Res. Transp. Econ. 2024, 108, 101491. [Google Scholar] [CrossRef]
- Zhang, G.; Wang, D.; Cai, Z.; Zeng, J. Competitiveness of public transit considering travel time reliability: A case study for commuter trips in Hangzhou, China. J. Transp. Geogr. 2024, 114, 103768. [Google Scholar] [CrossRef]
- Gadepalli, R.; Tiwari, G.; Bolia, N. Role of user’s socio-economic and travel characteristics in mode choice between city bus and informal transit services: Lessons from household surveys in Visakhapatnam, India. J. Transp. Geogr. 2020, 88, 102307. [Google Scholar] [CrossRef]
- Tiznado-Aitken, I.; Muñoz, J.C.; Hurtubia, R. Public transport accessibility accounting for level of service and competition for urban opportunities: An equity analysis for education in Santiago de Chile. J. Transp. Geogr. 2021, 90, 102919. [Google Scholar] [CrossRef]
- Roy, S.; Bailey, A.; van Noorloos, F. The everyday struggles of accessing public transport for women in the first- and last-mile stretches in Kolkata. J. Transp. Geogr. 2024, 117, 103892. [Google Scholar] [CrossRef]
- Čelan, M.; Klemenčič, M.; Mrgole, A.L.; Lep, M. Bus-stop based real time passenger information system: Case study Maribor. IOP Conf. Ser. Mater. Sci. Eng. 2017, 245, 042008. [Google Scholar] [CrossRef]
- Luo, S.; He, S.Y. Using data mining to explore the spatial and temporal dynamics of perceptions of metro services in China: The case of Shenzhen. EPB Urban. Anal. City Sci. 2021, 48, 449–466. [Google Scholar] [CrossRef]
- Genç, A.; Alkhaledi, K.; Sağlam, S.; Bendak, S. Commuters opinion on public transport services in mega cities: The case of Istanbul buses. Front. Sustain. Cities 2023, 5, 1291914. [Google Scholar] [CrossRef]
- Kasturia, S.; Verma, A. Multiobjective transit passenger information system design using GIS. J. Urban. Plan. Dev. 2010, 136, 34–41. [Google Scholar] [CrossRef]
- Pineda, C.; Mella Lira, B. Travel time savings perception and well-being through public transport projects: The case of Metro de Santiago. Urban. Sci. 2019, 3, 35. [Google Scholar] [CrossRef]
- Kaparias, I.; Rossetti, C.; Trozzi, V. Analysing passenger arrival rates and waiting time at bus stops. In Proceedings of the 94th Annual Meeting of the Transportation Research Board, Washington, DC, USA, 11–15 January 2015. [Google Scholar]
- Accent; RAND Europe. Value of Time for Bus Passengers; Transport for London: London, UK, 2016. Available online: https://content.tfl.gov.uk/value-of-time-at-the-stop-report.pdf (accessed on 26 April 2025).
- Nam, K.; Park, M. Improvement of an optimal bus scheduling model based on transit smart card data in Seoul. Transport 2018, 33, 981–992. [Google Scholar] [CrossRef]
- Zhou, M.; Ge, S.; Liu, J.; Dong, H.; Wang, F.-Y. Field observation and analysis of waiting passengers at subway platform—A case study of Beijing subway stations. Phys. A Stat. Mech. Its Appl. 2020, 556, 124779. [Google Scholar] [CrossRef]
- UNESCO World Heritage Centre. Historic Quarter of the Seaport City of Valparaíso. Available online: https://whc.unesco.org/en/list/959 (accessed on 26 April 2025).
- Aprigliano Fernandes, V.; Manríquez Tirado, H. Sustainable mobility in Valparaíso, Chile, and its relationship with topography and socio-spatial conditions. J. Sustain. Sci. Manag. 2021, 16, 122–134. [Google Scholar] [CrossRef]
- Giribas, C.; Paredes, G.; Riquelme, A. Recovering Valparaíso’s urban elevators: The restoration of the Cordillera funicular. Int. Arch. Photogramm. Remote Sens. Spat. Inf. Sci. 2020, XLIV-M-1-2020, 535–541. [Google Scholar] [CrossRef]
- Kieu, L.M.; Bhaskar, A.; Chung, E. Passenger Segmentation Using Smart Card Data. IEEE Trans. Intell. Transp. Syst. 2015, 16, 1507–1518. [Google Scholar] [CrossRef]
- Muja, M.; Lowe, D.G. Scalable Nearest Neighbor Algorithms for High Dimensional Data. IEEE Trans. Pattern Anal. Mach. Intell. 2014, 36, 2227–2240. [Google Scholar] [CrossRef]
- Aprigliano, V.; Seriani, S.; Toro, C.; Rojas, G.; Fukushi, M.; Cardoso, M.; Silva, M.A.V.d.; Cucumides, C.; de Oliveira, U.R.; Henríquez, C.; et al. Built Environment Effect on Metro Ridership in Metropolitan Area of Valparaíso, Chile, under Different Influence Area Approaches. ISPRS Int. J. Geo-Inf. 2024, 13, 266. [Google Scholar] [CrossRef]
- Ester, M.; Kriegel, H.-P.; Sander, J.; Xu, X. A density-based algorithm for discovering clusters in large spatial databases with noise. In Proceedings of the Second International Conference on Knowledge Discovery and Data Mining (KDD-96), Portland, OR, USA, 2–4 August 1996; AAAI Press: Menlo Park, CA, USA, 1996; pp. 226–231. Available online: https://dl.acm.org/doi/10.5555/3001460.3001507 (accessed on 15 May 2025).
- Kumar, K.M.; Reddy, A.R.M. A fast DBSCAN clustering algorithm by accelerating neighbor searching using Groups method. Pattern Recognit. 2016, 58, 39–48. [Google Scholar] [CrossRef]
- Birant, D.; Kut, A. ST-DBSCAN: An algorithm for clustering spatial-temporal data. Data Knowl. Eng. 2007, 60, 208–221. [Google Scholar] [CrossRef]
- Ministerio de Transportes y Telecomunicaciones. Resolución Exenta No. 1681/2020 que Modifica el Programa de Operación UN02 del Perímetro de Exclusión del Gran Valparaíso; MTT: Santiago, Chile, 2020; Available online: https://dtpr.cl/pdf/Perimetros/Valparaiso/exogenos/Res.Ex._1681_29.10.2020_excluye_exigenciaUN02_.pdf (accessed on 28 April 2025).
- Empresa de los Ferrocarriles del Estado (EFE). Tren Limache–Puerto: Servicio y Trazado; EFE Trenes de Chile: Santiago, Chile, 2024; Available online: https://www.efe.cl/nuestros-servicios/limache-puerto/servicio-y-trazado/ (accessed on 28 April 2025).
- Asociación de Conservación de Ascensores de Valparaíso (ASCENVAL). Carta a UNESCO sobre la Conservación de los Ascensores de Valparaíso; ASCENVAL: Valparaíso, Chile, 2024; Available online: https://www.ascenval.cl/documentos/carta_unesco_ascenval.pdf (accessed on 28 April 2025).
| Disclaimer/Publisher’s Note: The statements, opinions and data contained in all publications are solely those of the individual author(s) and contributor(s) and not of MDPI and/or the editor(s). MDPI and/or the editor(s) disclaim responsibility for any injury to people or property resulting from any ideas, methods, instructions or products referred to in the content. |
© 2025 by the authors. Licensee MDPI, Basel, Switzerland. This article is an open access article distributed under the terms and conditions of the Creative Commons Attribution (CC BY) license (https://creativecommons.org/licenses/by/4.0/).


