1. Introduction
The availability of accessible, free, or reasonably priced parking is a critical factor influencing the decision to use a private vehicle for urban travel. In line with economic and environmental objectives, parking management strategies aim to balance supply and demand, particularly when the parking system is integrated with local public transport. Parking fees act as a mechanism to influence travel mode choices [
1], making parking policy an essential component of urban transport policy [
2].
Parking characteristics and research methodologies are detailed in [
3,
4,
5]. Parking can be classified by motivation—residential, business, commercial, public, or tourism-oriented, and by duration, as either short-term or long-term. Parking volume refers to the total number of parked vehicles over a specific period, while parking accumulation denotes the number of vehicles parked at a given moment. Additional relevant characteristics include turnover, the time spent searching for a parking space and walking distance to the destination. The utility of parking data in policymaking is discussed in [
6], its role in developing parking information systems in [
7], and its application in evaluating different parking strategies in [
8].
Charging for parking is a key instrument in parking policy and an essential aspect of urban planning as it helps improve traffic flow, optimize land use, and support environmental conservation. Well-designed pricing strategies increase vehicle turnover and discourage car trips to city centers [
9]. The conceptualization of off-street parking reform is discussed in [
10].
Pricing also facilitates the achievement of desired modal splits [
11]. Studies examining the impact of parking prices on travel choices, including demographic factors, trip conditions, and parking discounts, as presented in [
12,
13,
14], account for demographic factors, trip conditions, and parking discounts or privileges. The effects of reduced parking supply on price increases are addressed in [
15], while the influence of parking prices on street-level service and congestion reduction is explored in [
16,
17].
Among immediate travel costs, parking fees exert the most significant influence on trip decisions [
18]. A demand elasticity model relating to total travel cost and the impact of on-street parking on congestion is presented in [
19]. The model assumes equal users who drive to their destination and either park or circle while searching. The findings support our main hypothesis (1) by confirming that raising fees can lower the overall parking demand. Variations in demand elasticity by day and time are explored in [
20] using data from Dublin, revealing stronger elasticity in the morning and consistent elasticity throughout the week, except for Thursdays, which are characterized by increased shopping activity.
An econometric model predicting on-street parking demand based on price elasticity is introduced in [
21]. Users are willing to pay more to reduce walking distance. Data limitations due to city authorities’ access policies hindered this research.
The theory in [
22] demonstrates the impossibility of defining a single parking price that ensures maximum garage occupancy. Over two years, 14 garages in San Francisco underwent iterative price adjustments, resulting in only acceptable price ranges. That study identified three key elements for sustainable garage operations: high occupancy, revenue generation, and the availability of free spaces. These elements are also the primary variables simulated in our study.
Previous research has primarily calculated demand elasticity coefficients discreetly, often based on user surveys. Price–demand effects and predictions from stated preference surveys are discussed in [
23,
24], though these methods risk discrepancies between stated and actual behavior. Therefore, researchers are encouraged to use revealed preference data, as in [
20,
25,
26,
27]; however, such studies are rare due to infrequent price changes and limited data availability. A review in [
13] highlights research gaps and provides recommendations.
Most existing models focus on spatial demand distribution, with temporal aspects often underrepresented, typically limited to adjustments in payment start times or parking durations to reduce policy restrictiveness [
28]. To enhance policymaking, it is essential to assess the influence of prices on user composition across different times of day, enabling sustainable parking management based on revealed preferences.
Our research presents a model that determines optimal parking prices based on garage occupancy and user composition. Two criteria guide the price simulations: first, prices must not result in forecasted occupancy above 95%; second, they must generate higher revenue than current prices. The first criterion ensures sufficient available spaces number (hypothesis 1), while the second supports economic sustainability. The model contributes to more effective parking and urban transport policies, thereby enhancing the overall quality of urban life.
The foundational economic models of parking elasticity [
19,
20] provide important theoretical insights but generally assume constant demand across user categories and time periods. In contrast, our model adopts a predictive and scenario-based approach. Unlike [
22], which implemented iterative block-level price adjustments based on occupancy data without differentiating user types or analyzing how pricing affects user composition, our model explicitly supports user-class-specific demand simulation. This capability enables more detailed analysis of price impacts on distinct user categories and supports the development of targeted parking policy interventions. Similarly, current machine-learning models used for parking demand forecasting achieve high predictive accuracy at the level of aggregate occupancy, but they generally do not support policy simulations or modeling of user-class-specific scenarios [
29]. Our simulation-based framework addresses this gap by enabling user-class-specific pricing optimization and providing a practical tool for operational policy evaluation based on revealed preference data.
Urban traffic congestion is significantly exacerbated by drivers cruising in search of available parking spaces. Studies report that up to 30% of urban traffic congestion in OECD countries can be attributed to vehicles engaged in parking search circulation. This behavior generates substantial air pollution and fuel consumption, contributing to environmental harm through elevated greenhouse gas emissions, and imposing social costs through lost productivity. The cumulative effect of billions of vehicle kilometers driven in search of parking results in considerable time loss and economic inefficiency [
30]. To address these challenges, this study introduces a simulation-based pricing model that seeks to optimize garage occupancy, reduce cruising traffic, and mitigate the associated environmental and social impacts of parking-related congestion.
While much of the earlier literature has focused on demand elasticity and static pricing strategies, recent developments in parking management increasingly emphasize simulation-based demand forecasting and the application of phase transition theory to traffic systems. Simulation-based tools offer robust methods for forecasting complex demand responses to varying pricing schemes, thereby supporting more effective decision-making in parking management. Phase transition theory is particularly relevant in this context, as it explains how traffic systems transition from free-flow conditions to congested states, especially when parking availability is constrained.
Conceptual frameworks such as the congestion boundary approach [
31] and the lattice hydrodynamic model [
32] provide valuable methodologies for modeling, calibrating, and validating these dynamics, and contribute foundational insights for managing critical transitions in parking demand and urban traffic congestion. Building on these perspectives, our approach leverages simulation-based pricing models specifically designed to forecast demand shifts and to prevent congestion-induced phase transitions while maintaining optimal occupancy levels within parking facilities.
2. Methodology
The demand and price model developed in this study is grounded in the negative price elasticity of demand and is designed to predict and quantify the effects of parking charges. For a given demand function
, which calculates the demand for parking spaces
depending on the price
, the elasticity coefficient
is defined as the ratio between the relative change in demand
and the relative change in price
:
The core hypothesis of this study is that if provided with sufficient parking spaces, then the elasticity
cannot be positive:
A high elasticity coefficient indicates that demand is highly sensitive to price changes, such that a small price increase leads to a substantial decrease in demand. It is essential that when enough parking spaces are available, demand always decreases as price increases. Hence, the elasticity coefficient (1) cannot be positive because of
. The proof is simple, as a sufficient price increase
will arbitrarily reduce demand
, as demonstrated in [
19].
The model classifies users into categories: short-term users (STU) utilizing hourly tickets under either a day or night tariff; monthly subscribers include Daily Monthly Pass (DMP), Night Monthly Pass (NMP), and Complete Monthly Pass (CMP) users. The model determines optimal prices for these categories via price simulation-based demand forecasting, adjusting category composition to achieve profitable and sustainable garage management. The formalization of the causal relationship between pricing and demand, based on collected and analyzed data, enables parking charge policy to manage user composition and facilitate sustainable garage operation.
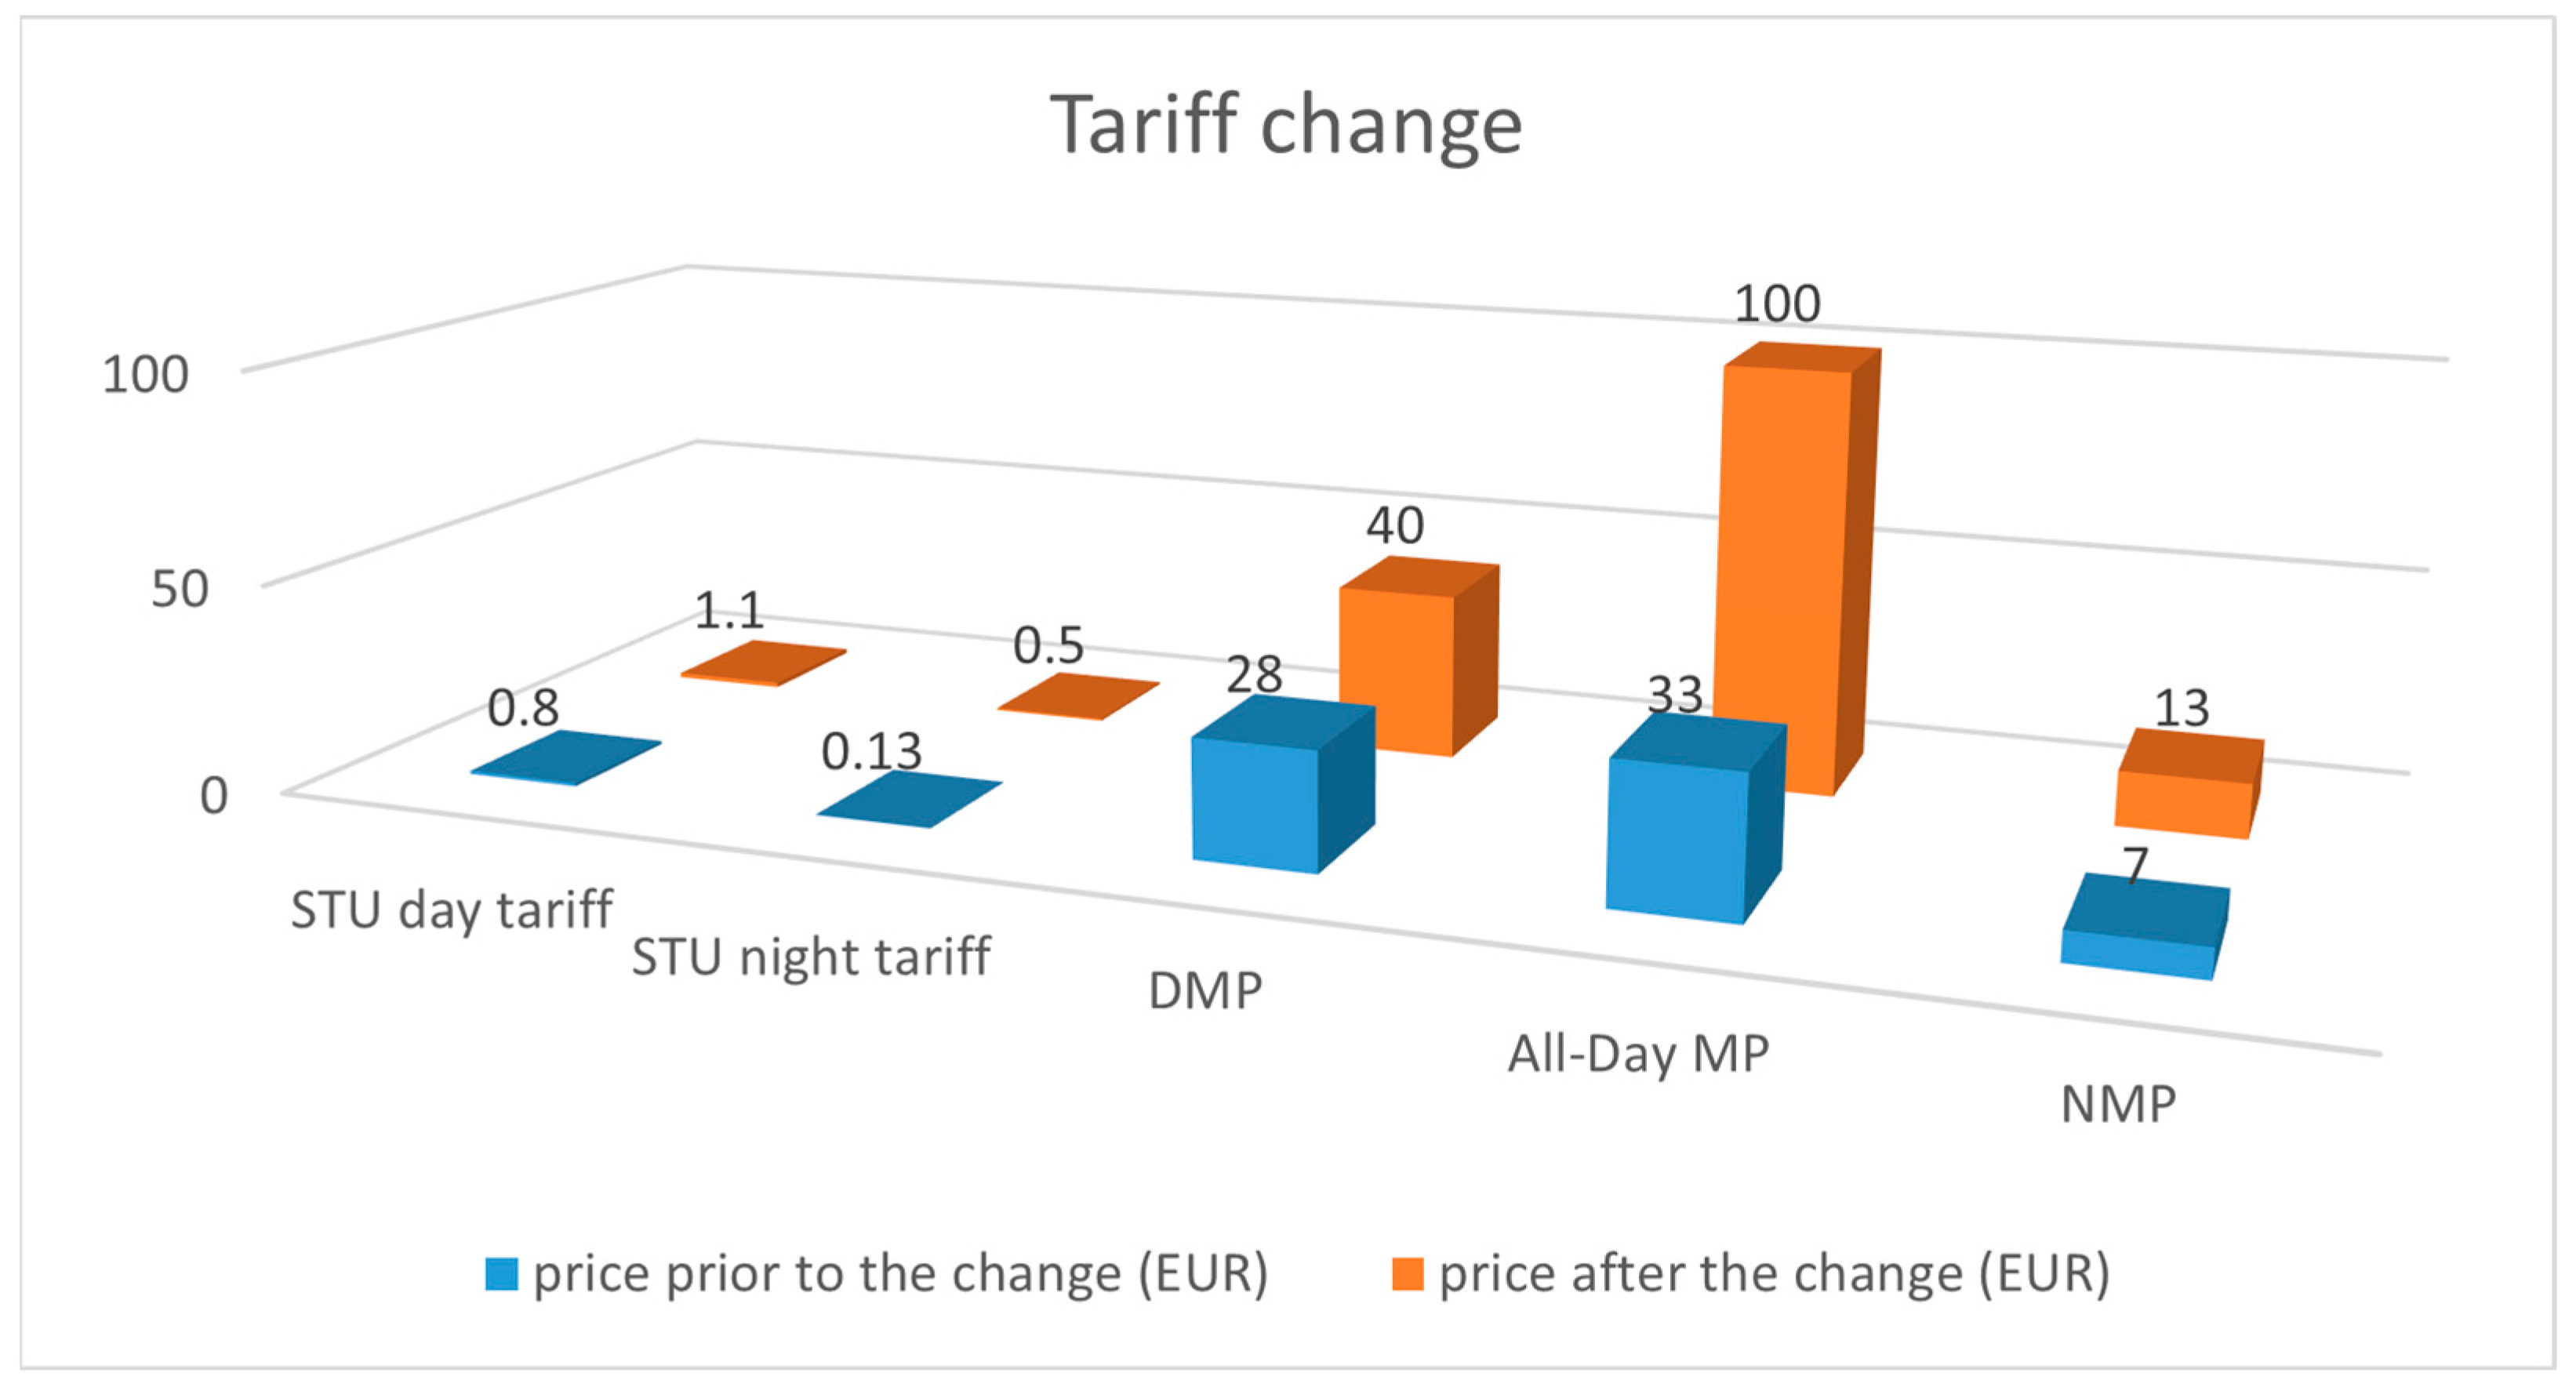
Vehicle license plates entering and exiting the garage are recorded by the management system, which extracts relevant business data. This method ensures accurate, continuous data collection for robust analysis, but requires careful selection due to the large data volume. The research was conducted in the city of Zagreb, at the Gorica Public Garage (PG), located on the edge of the city center with 353 parking spaces. Data gathered from the garage management system during one weekday, broken down into hourly intervals, served as the basis for the study design. For method demonstration, we used data from one weekday before and after the price change on 1 January 2023. A comparison of parking prices is shown in
Figure 1.
From the accumulation of parked vehicles
during hours
, in a space with a total of
spots, the occupancy rate (
) in hour
t is calculated as the ratio of the number of accumulated vehicles at a given time to the total number of spaces in the observed area, typically expressed as a percentage:
Based on the data, users of the garage are divided into categories by parking duration. Thus, STUs use the garage at an hourly rate from 08:00 to 18:00 (day rate) or 18:00–08:00 (night rate). Long-term DMP users can access the garage every day from 06:00 to 21:00, NMP users from 21:00 to 07:00 and all day on weekends, while CMP subscribers have access 24/7. The accumulation
is determined for each user category
:
Total hourly accumulation
is then calculated as follows:
Using these characteristics and comparisons, the forecasting model can determine optimal prices in the garage by simulating category-specific prices that forecast demand. The basic requirement must be met alongside the goal of revenue maximization:
- -
Occupancy
must not exceed 95%:
- -
Revenues should be maximized for parking accumulations
by user categories forecasted after price simulations
:
represents the hourly equivalent price for each user category. For STU (short-term users), corresponds directly to the hourly parking rate applied at the time of usage. The revenue for STU is calculated based on the actual number of vehicles per hour and the corresponding hourly price. For CMP, DMP, and NMP categories (monthly and daily passes), the hourly equivalent price is computed by dividing the total subscription price by the total number of hours covered by that subscription.
The revenue function in Equation (5) represents the sum of revenues from all user categories. The total revenue is calculated as follows:
where
indexes the user categories (STU, DMP, NMP, CMP). The optimization process simultaneously adjusts the vector of prices
to maximize the combined total revenue, subject to operational constraints such as the maximum occupancy limit of 95%.
The model implements a constraint to maintain maximum occupancy at 95% to guarantee parking availability and minimize user frustration from searching for unoccupied spaces. The threshold derives from empirical data collected at the Gorica PG and recognized best practices in urban parking management. The study in [
22] proposes that the best operational performance for parking systems occurs when occupancy levels stay within the 85 to 95 percent capacity range to maintain equilibrium between utilization and space availability. A flexible policy parameter within the simulation sets a limit for maximum occupancy at the 95% threshold. It can be adjusted by planners depending on strategic objectives; setting a lower threshold improves accessibility and turnover while a higher threshold emphasizes maximizing revenue.
For instance,
is the accumulation of NMP users based on the simulated price, calculated after determining the formula
. The associated occupancy is derived using the total accumulation formula:
Once the number of vehicles in the garage at the beginning of an hourly interval is recorded, entry and exit data for users in that hour are used to determine individual accumulations per category and hour, and to calculate the corresponding occupancy using Formula (6). From vehicle accumulation data, key parameters of demand functions are calculated separately for each user category. Separate data was extracted for short-term and long-term parking.
For simulated prices and resulting demand, revenues are calculated using Formula (5) under the main condition (4). This ensures sustainable garage operation with increased revenue. Condition (4) ensures that the occupancy level does not exceed capacity, thereby ensuring enough free parking spaces. It is crucial to influence the composition of users at specific times of day using pricing to ensure availability of spaces (condition 4), forecasted by demand functions (3), and to increase revenues (5). A challenge in data analysis lies in the fact that the existing system does not calculate basic parking demand parameters. Through detailed analysis of collected data, it is possible to precisely determine the composition of users based on garage monitoring data, thus enabling the development of a model for determining parking demand using simulation-based pricing.
The simulation model is implemented in a deterministic Microsoft Excel spreadsheet environment, where demand for each user category is calculated using analytical exponential functions without the incorporation of random variables or probabilistic elements. As such, the model operates without iterations or randomness handling; its behavior is fully determined by the input prices and the derived elasticity parameters. Each pricing scenario is evaluated once per time slot, with results assessed against predefined occupancy and revenue criteria.
The demand functions used in the model are analytically derived from economic theory and calibrated using observed price–demand data. Because the model operates deterministically, rather than through statistical learning or stochastic simulation, traditional model fit metrics such as R2 or RMSE are not applicable in this context. Instead, the model’s reliability is demonstrated through its internal consistency and its ability to reproduce observed user behavior patterns following price adjustments.
3. Results and Data Analysis
For the proposed model, data were selected regarding the accumulation
by user category from Formula (3) over a single workday divided into hourly intervals, which were then used to calculate occupancy
using Formula (6). Data was collected both before and after the price increase. The analysis identified the composition of garage user categories.
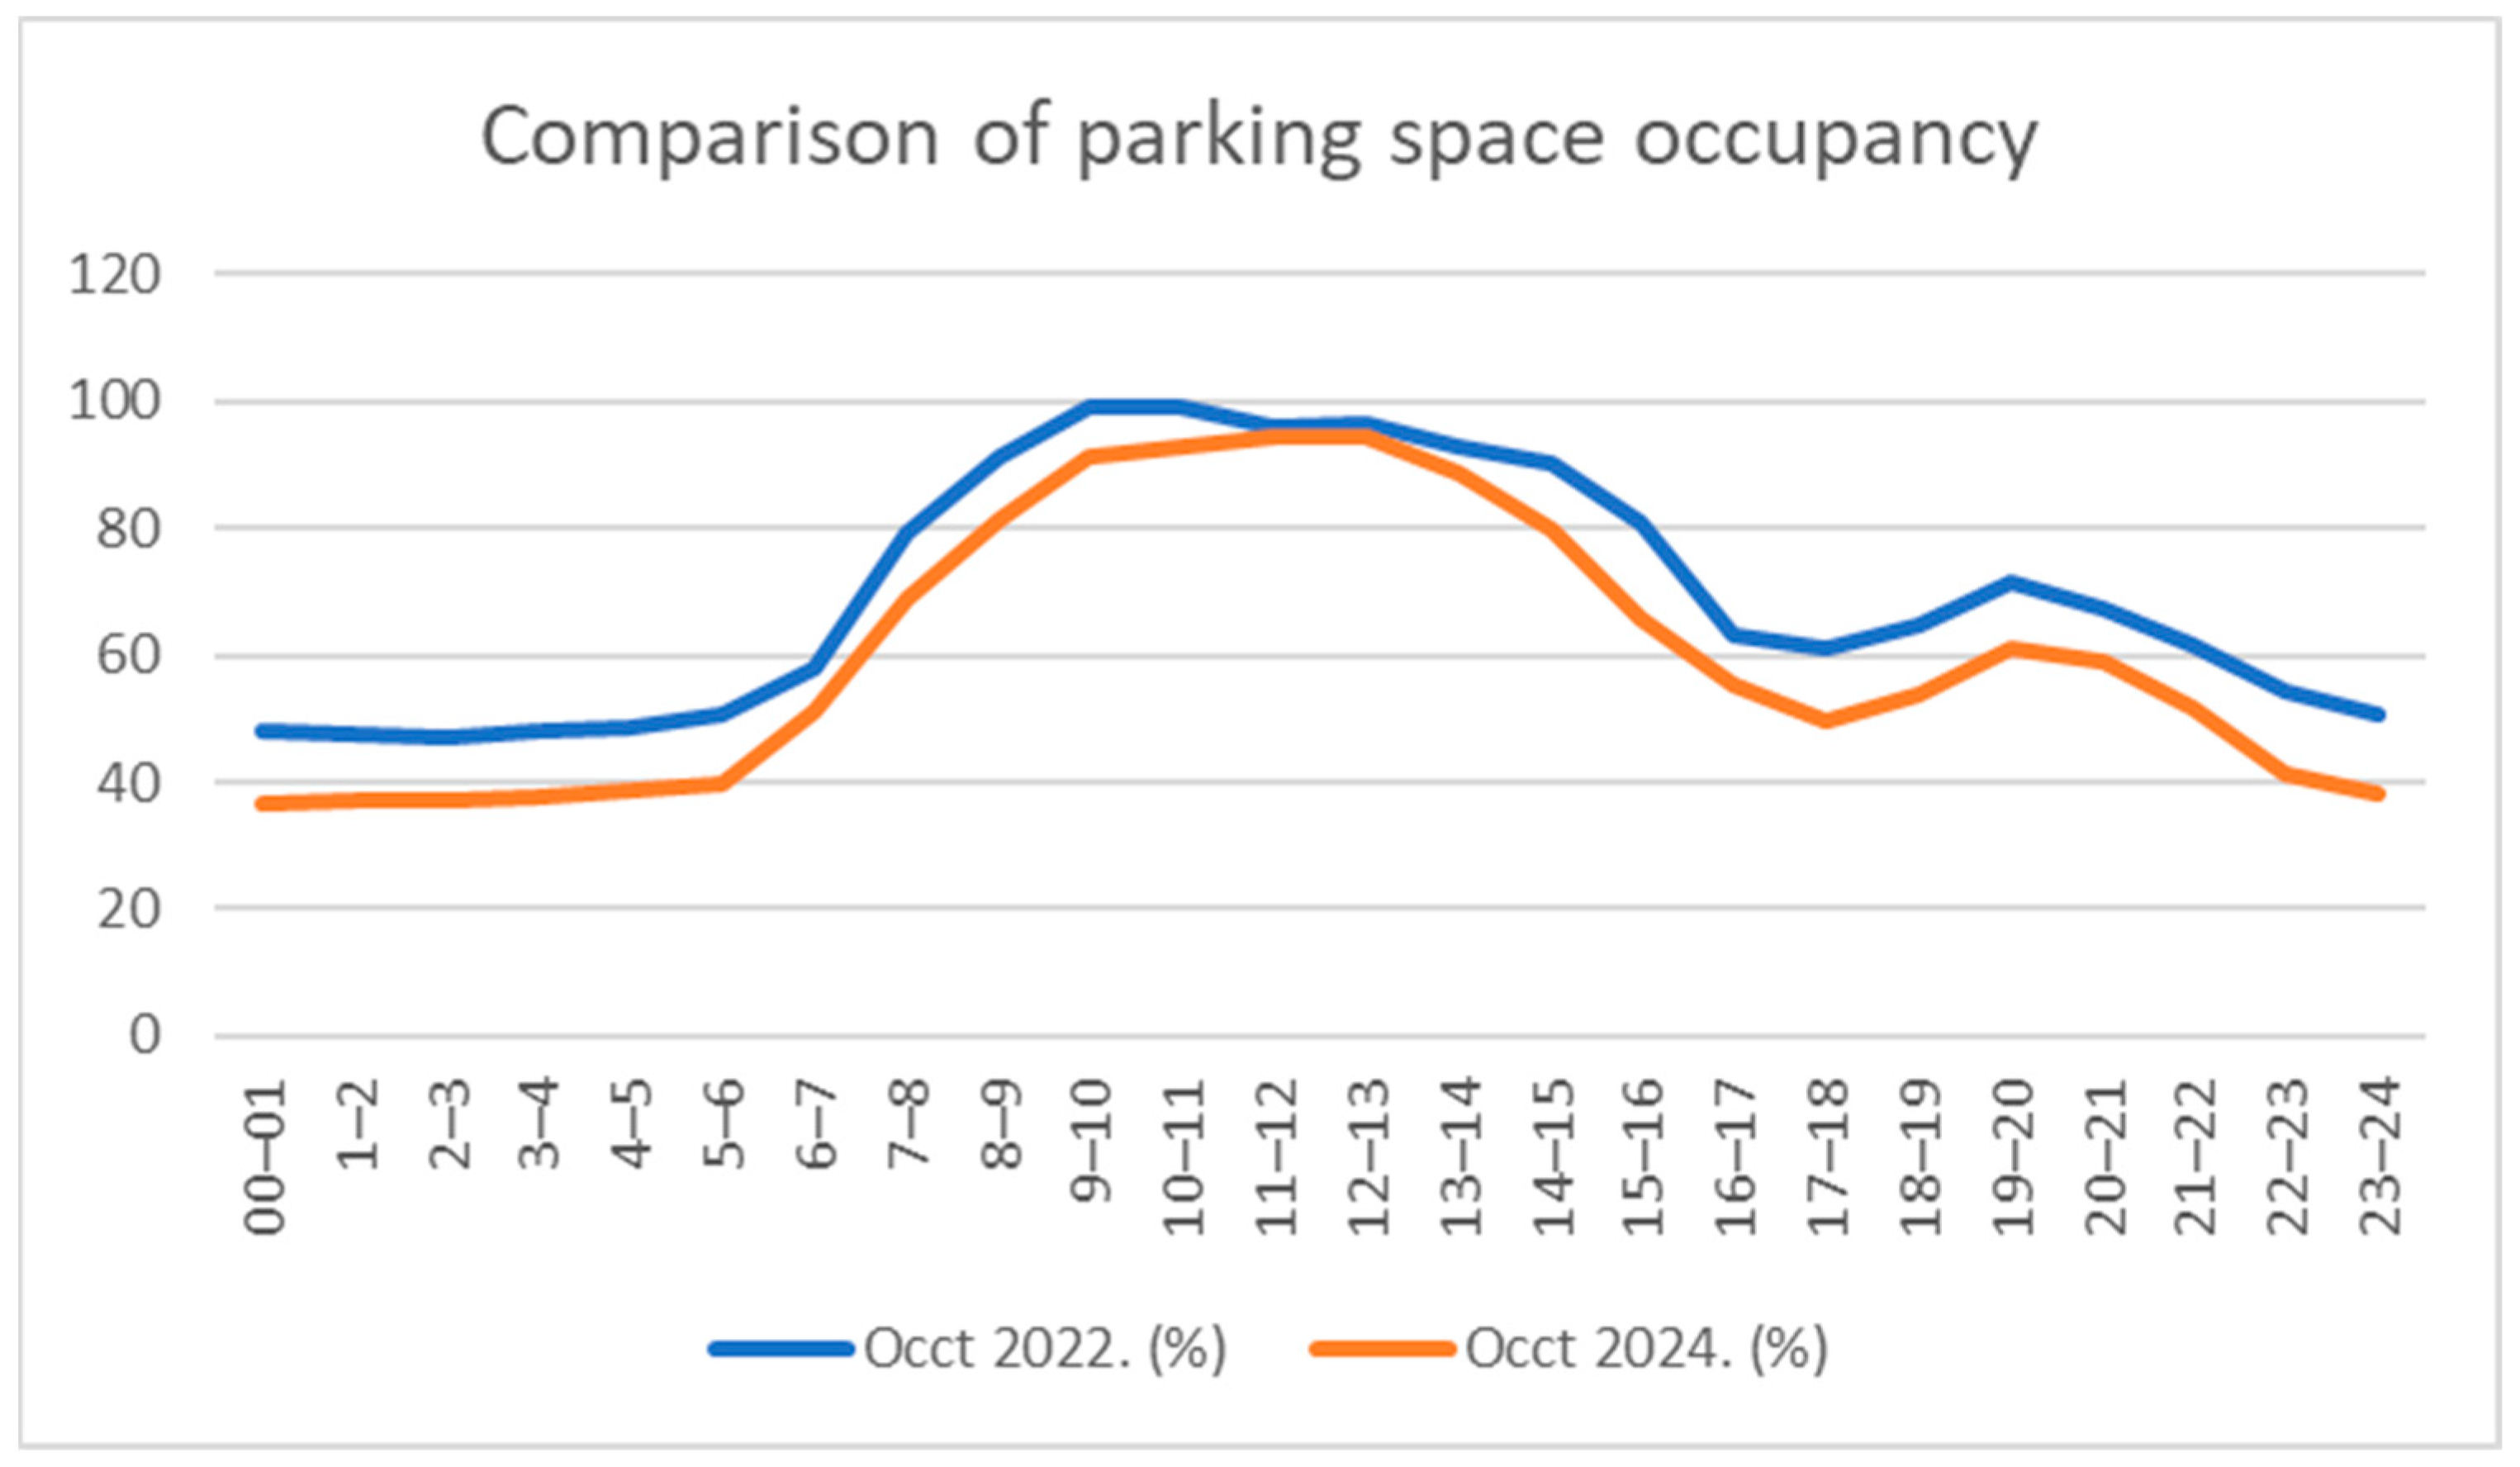
Figure 2 shows a comparison of overall occupancy (
) by hour for two days of the same date before and after the price increase.
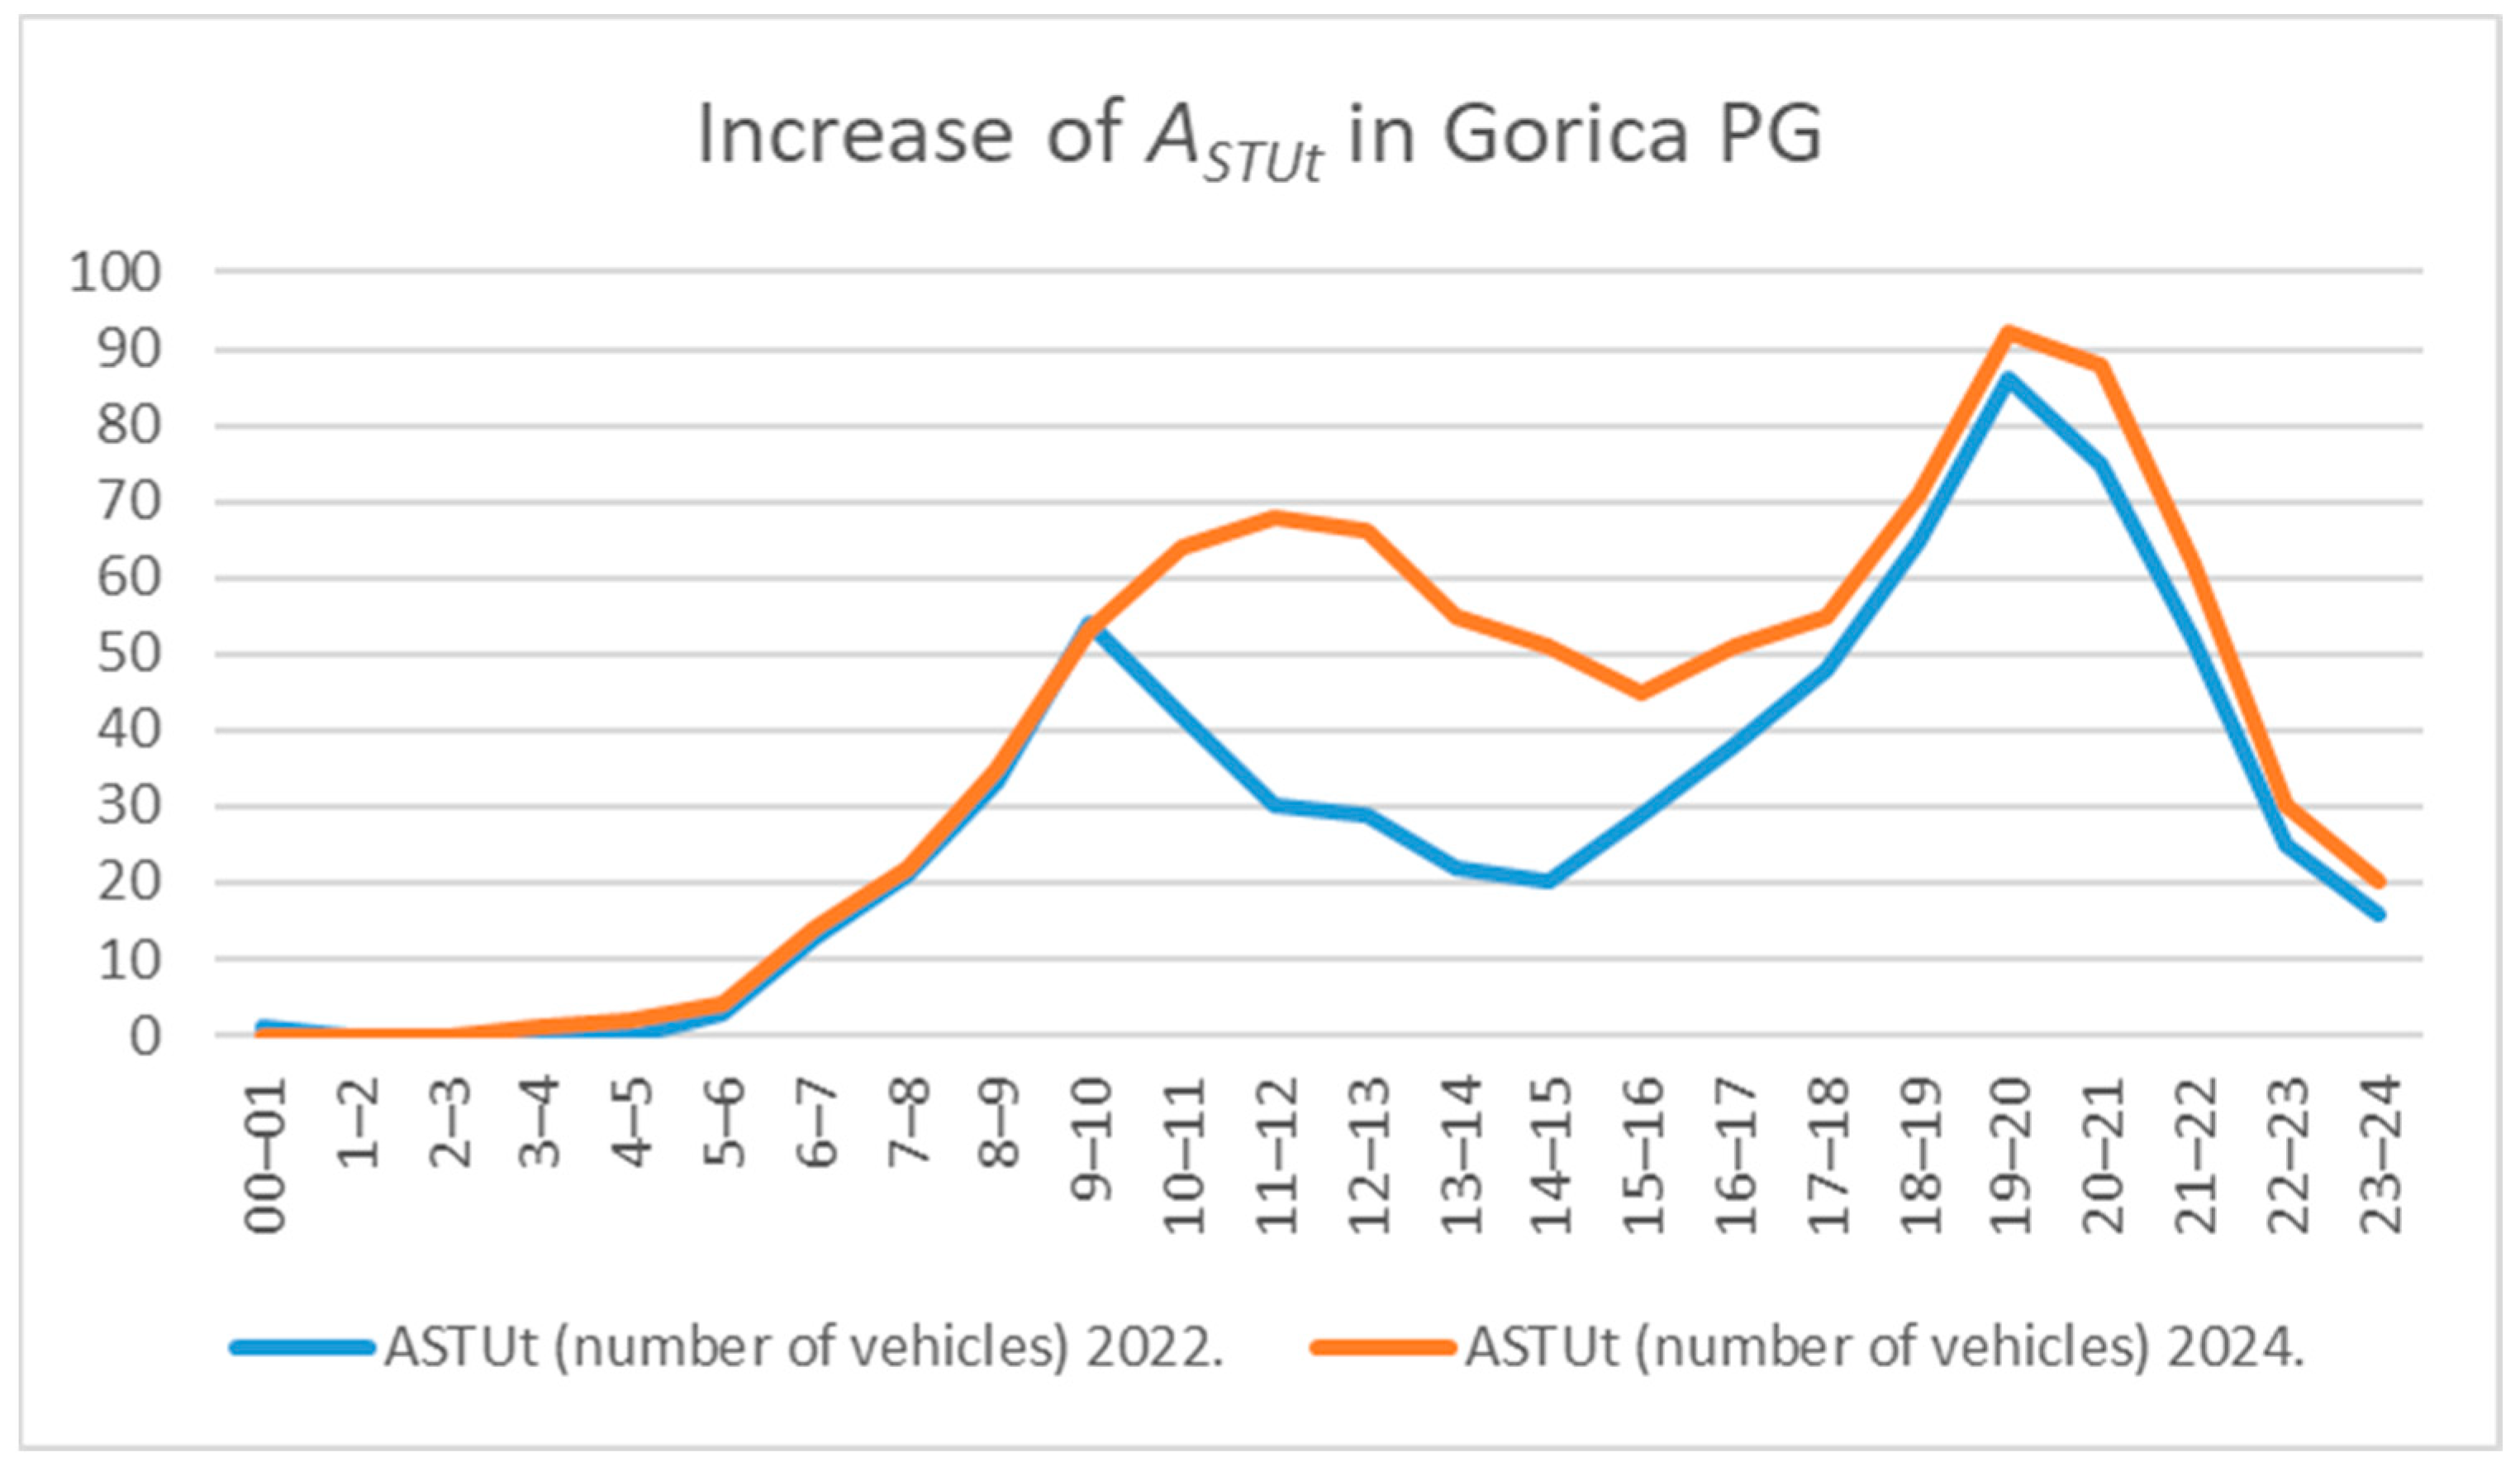
The implemented price increase resulted in a reduction in garage occupancy across all hourly intervals. The adjustment of the pricing policy was prompted by overcapacity observed between 09:00 and 13:00, during which Gorica PG operated at over 95% occupancy. Following the adjustment, occupancy levels consistently remained below the 95% threshold. Subsequent analysis focused on the user composition and the structural shifts in user categories following the price change. Notably, despite the price increase, demand from STU rose, which stands in contrast to the core assumption embedded in Formula (1). This trend is illustrated in
Figure 3.
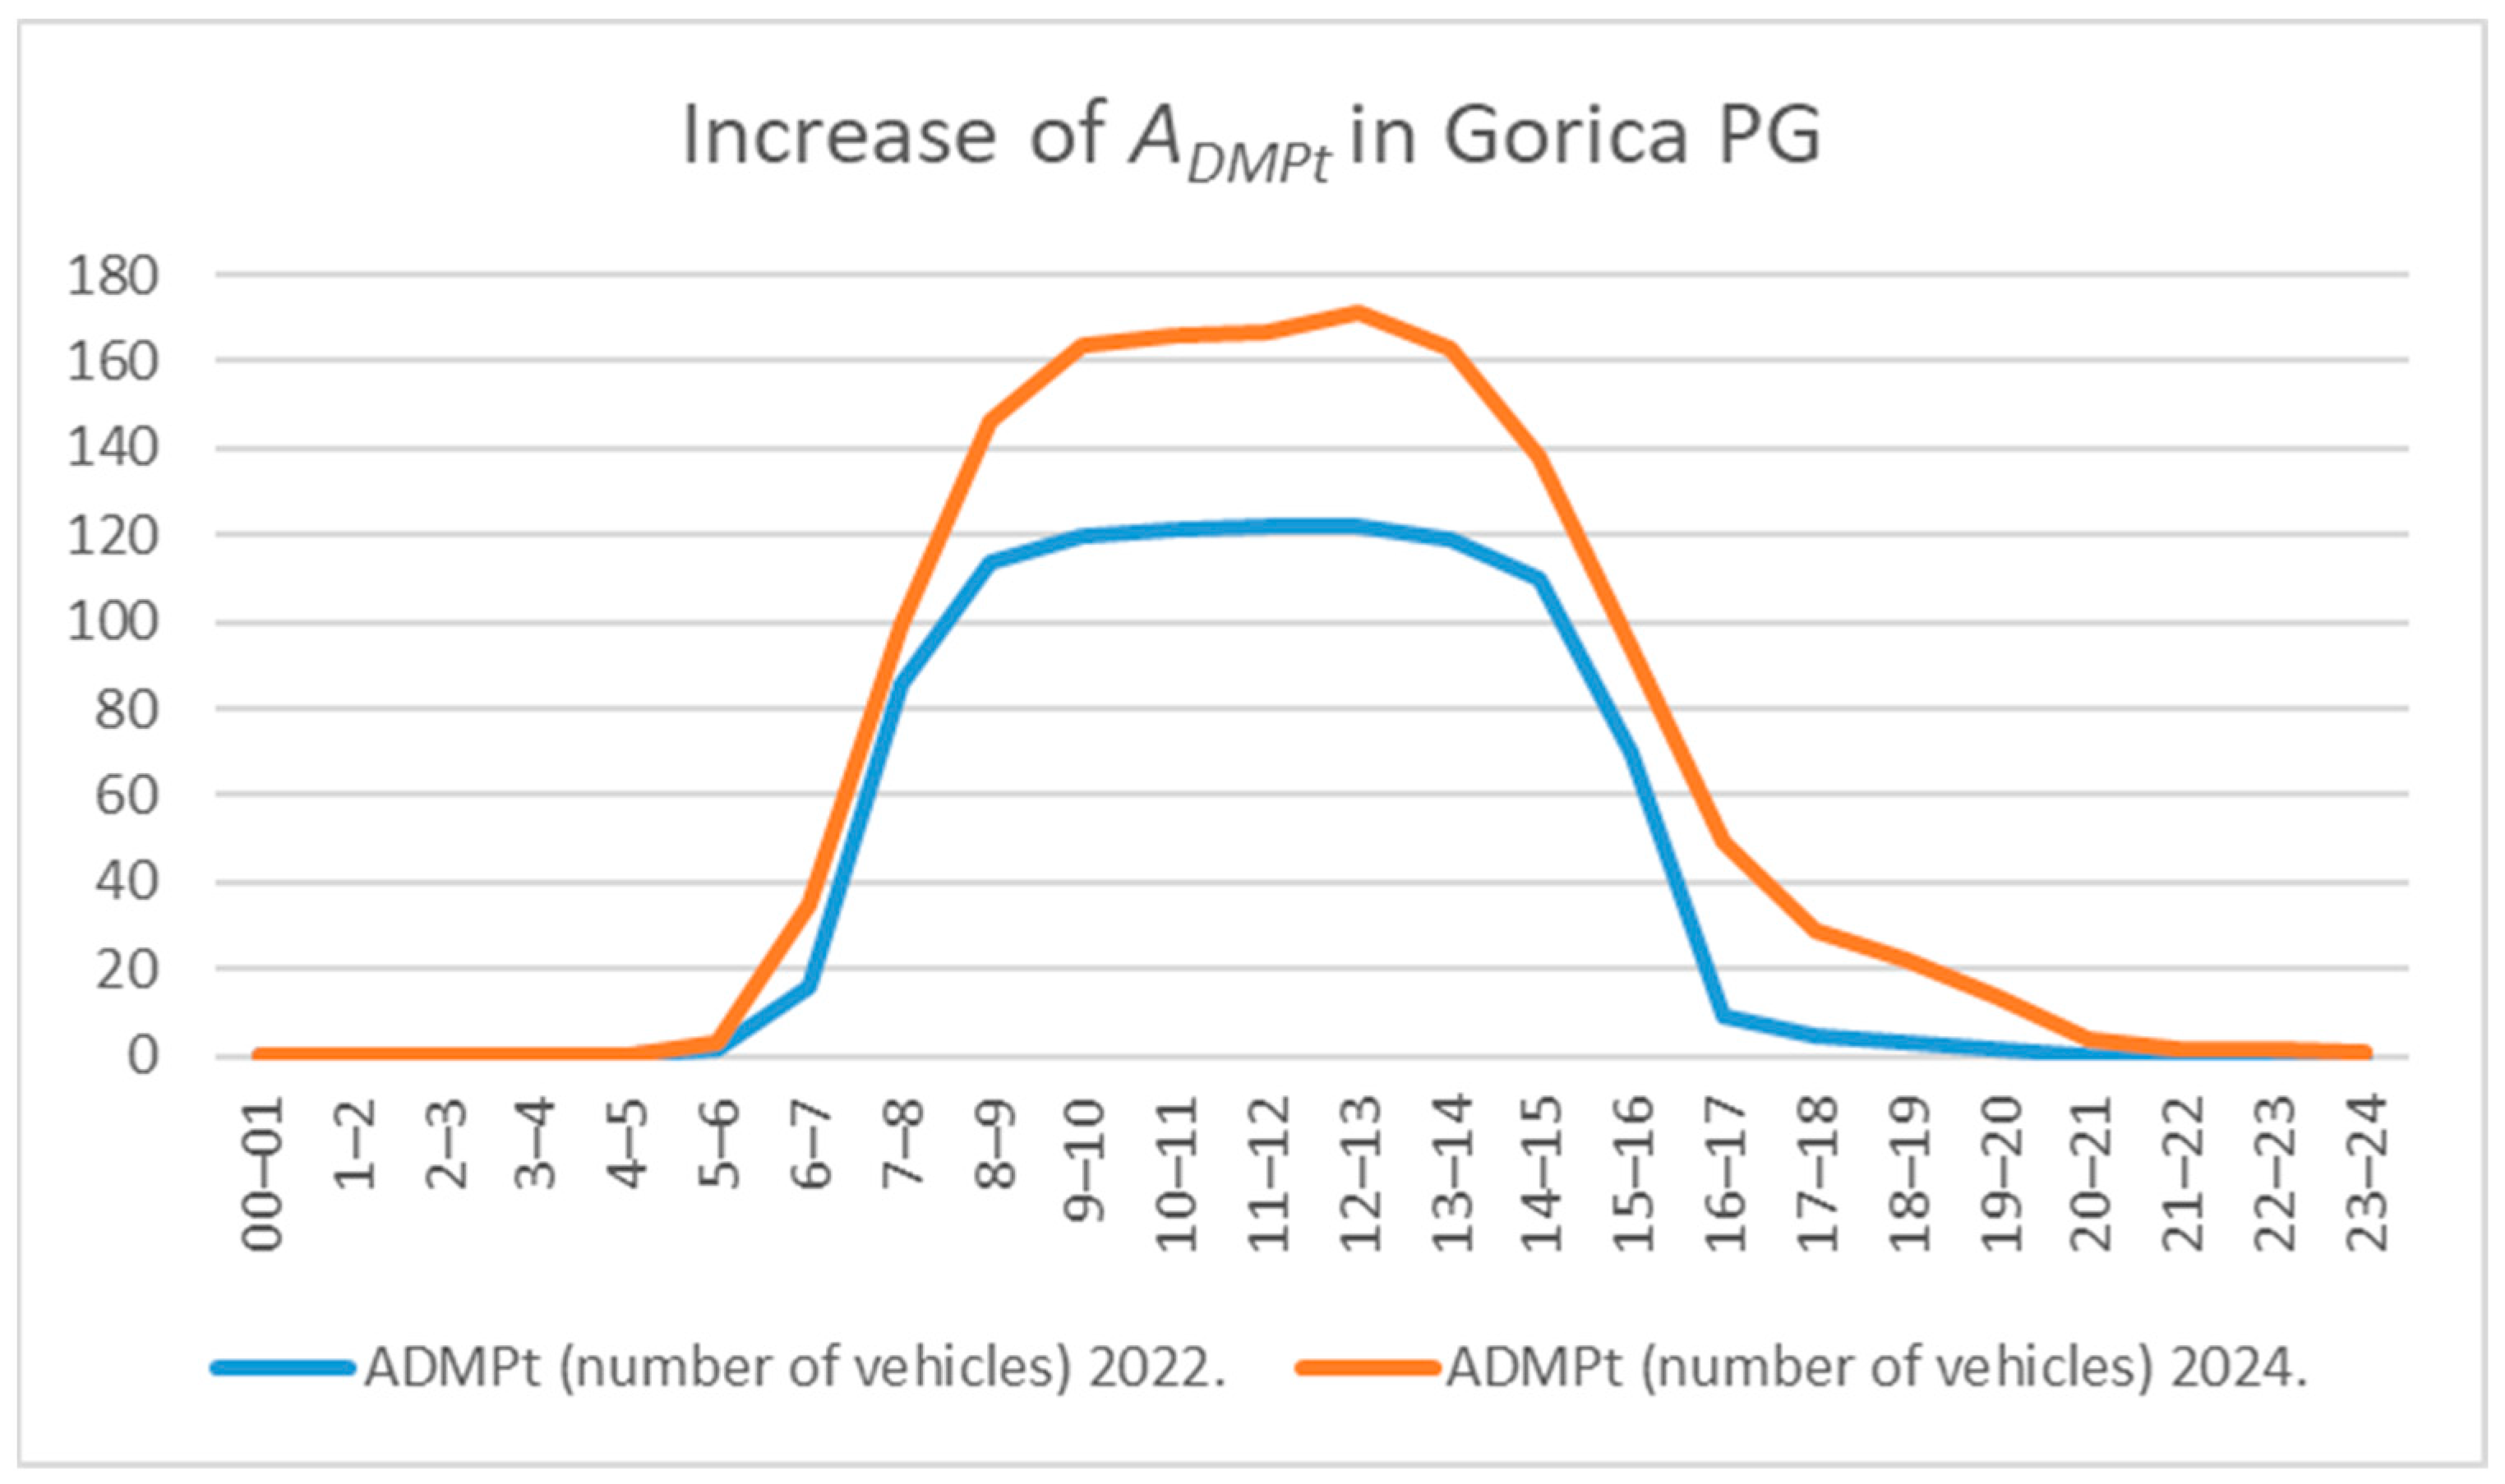
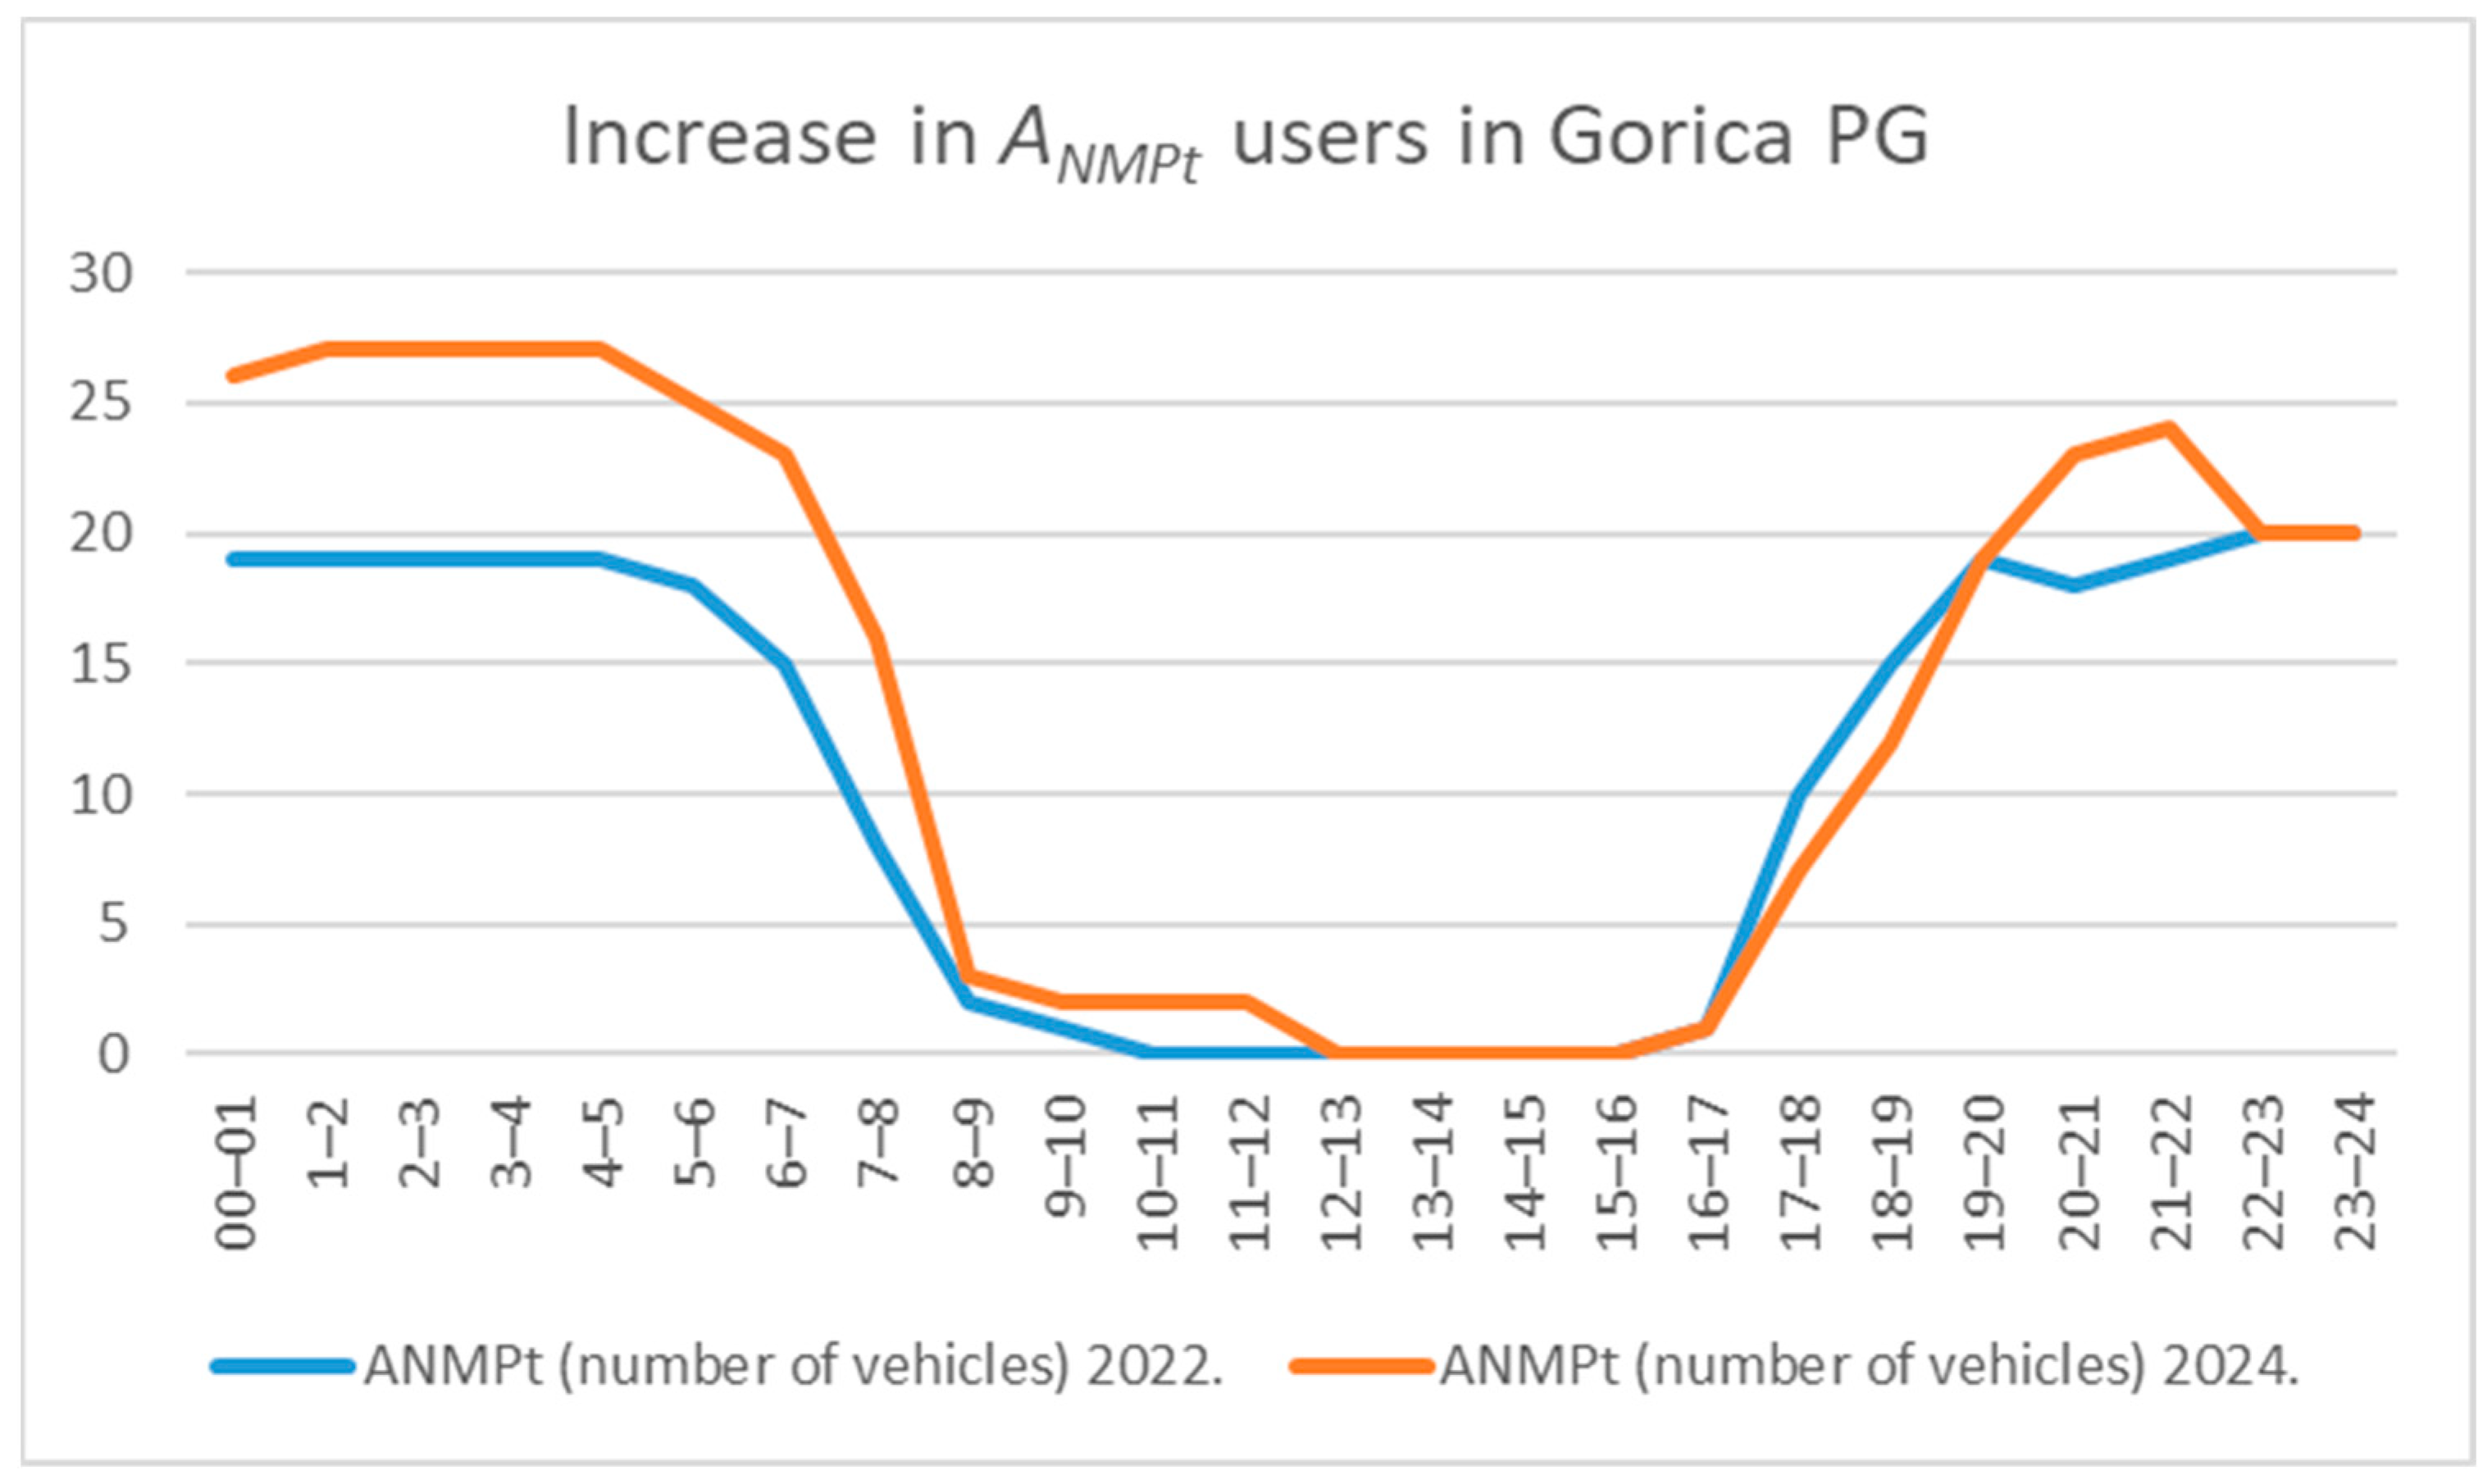
After the price increase,
user demand also rose, as shown in
Figure 4.
In accordance with the hypothesis (1),
user numbers decreased, shown in
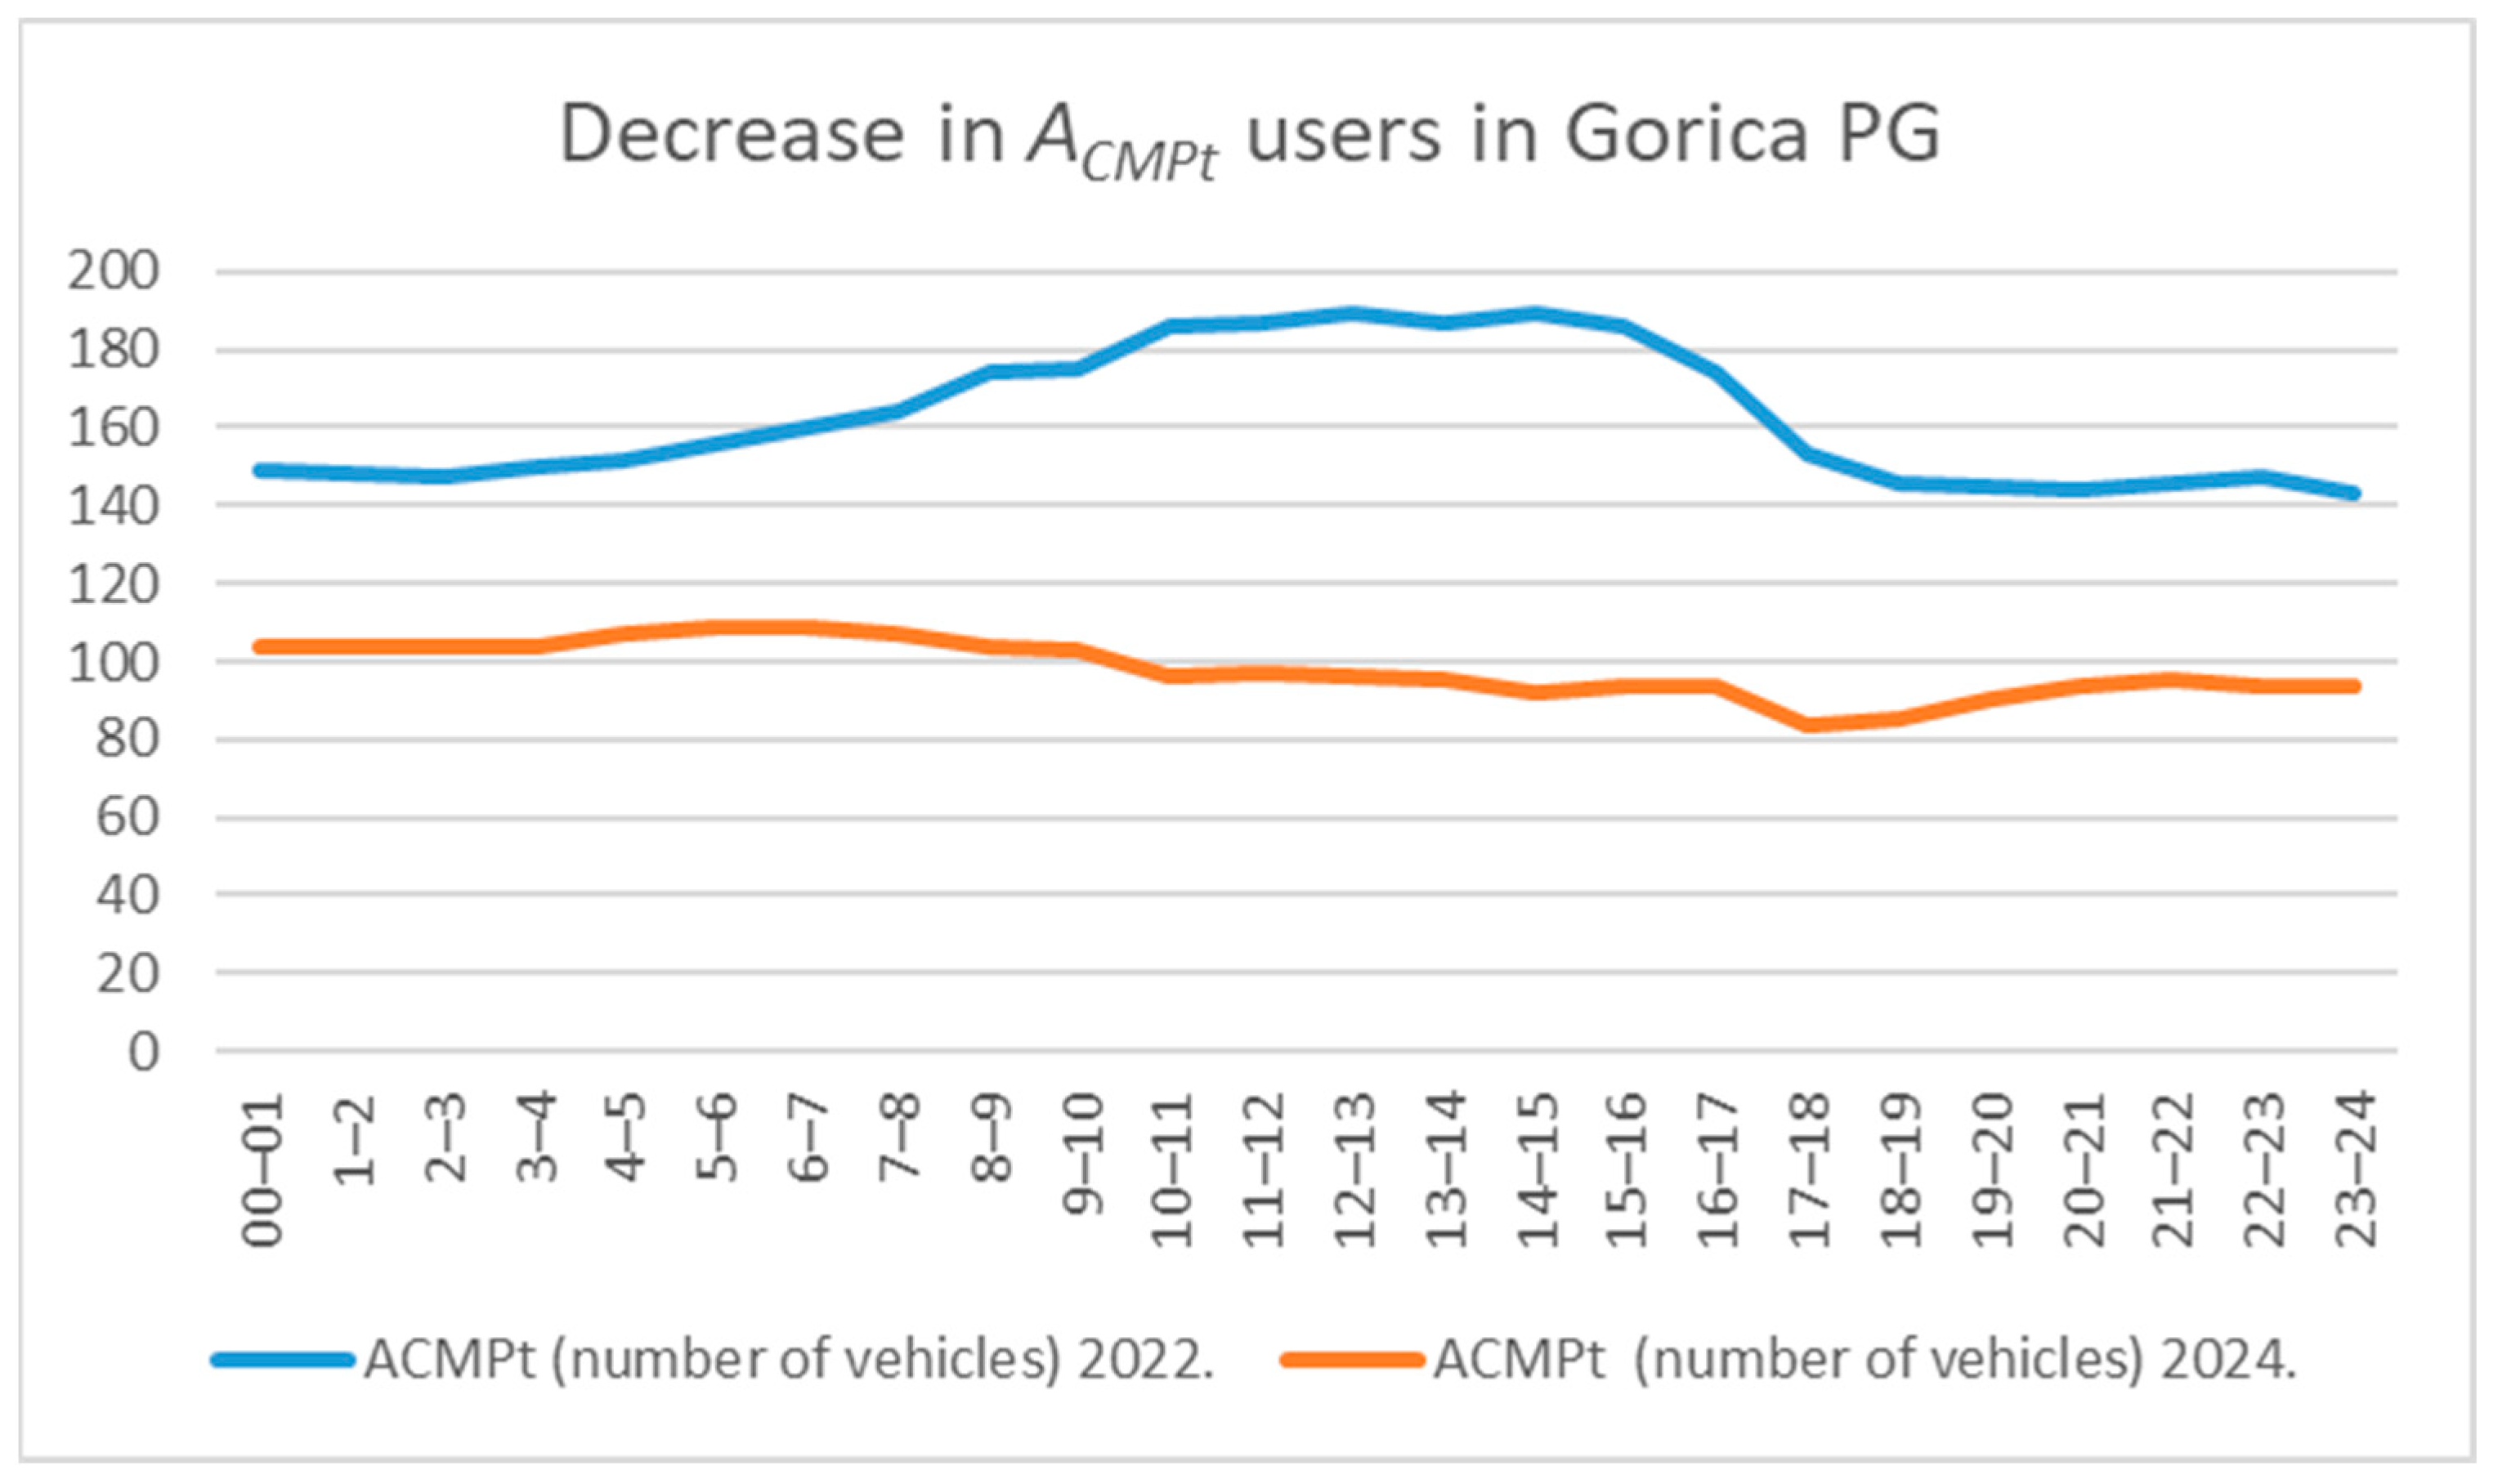
Figure 5.
Interestingly,
users also increased, as shown in
Figure 6.
The rise in STU after the price adjustment occurred because the garage had been operating beyond its effective capacity before the change, which kept demand suppressed. The significant decrease in CMP users opened parking spaces which allowed more STU to park despite the elevated parking price. The system displays a chaotic demand regime because unmet demand becomes active when availability limitations ease as shown in
Figure 3,
Figure 4 and
Figure 5.
3.1. Mathematical Model of Demand
This study observes multiple types of demand. The total accumulation () is broken down into the user categories accumulations () and calculated using Formula (3). It is assumed that all this depends on the prices according to the same economic principle, changing proportionally to the values they have at the current prices . Therefore, in this chapter, the demands of all user categories () are denoted by the common symbol , which is standard in economics.
3.1.1. Natural Demand for Parking Spaces
If demand
depends on the price
according to some unknown function
, we inferred from the data collected, shown in
Figure 2, a proportional dependency:
Differential Equation (7) indicates that the decline in demand is proportional to the current demand
: with an increase in price, the reduction in demand will be greater the higher the current demand is. The differential equation is solved by separating variables, where the right-hand side is negative, corresponding to the observed natural decline in demand with a positive price change in a parking area that has sufficient available spaces number (1). When solving, the variables are treated equally:
.
where
is an arbitrary constant. Furthermore:
where
is the base of the natural logarithm, and
is again some arbitrary but positive constant. The unknown function
is now given by the following explicit formula:
The parameters and are determined from two known pairs of prices and corresponding demands taken from the collected data:
—higher price and (lower) demand at the higher price
—lower price and (higher) demand at the lower price.
The parameter
is calculated by substituting the price–demand pairs into Formula (8), followed by solving the system of exponential equations:
By dividing the equations, we get the following:
which ultimately gives the parameter
a positive value; since the logarithm is negative as the demand at the higher price is naturally less than the demand at the lower price by (1):
From (8), it follows that for the price–demand pair at the higher price we have
, so by substituting
from (9), we obtain the value of parameter
with a positive argument in the exponential function. The same value of
would be obtained using the pair with the lower price and higher demand.
The parameter
gives the number of users in the case that the service is free and is therefore referred to in this work as the gravitational demand, representing all potential users of the garage. The normal demand is calculated using the final formula:
Calculating the elasticity coefficient by (1), and using (8), we get the following:
With from (9), Equation (12) indeed results in negative elasticity, and the decline in demand is greater the higher the price at which the increase occurs.
3.1.2. Chaotic Demand for Parking Spaces
In this model, chaotic demand behavior is not enforced through an explicit formula switch or threshold rule, instead, it emerges from the actual observed dynamics of the parking system. In cases where pre-price-change demand exceeded capacity, the release of suppressed demand after capacity becomes available can result in positive elasticity (η > 0), contrary to the basic hypothesis (1), as seen in
Figure 3,
Figure 4 and
Figure 5. This outcome reflects the real-world behavior of the system and is consistent with the simulation results. The root cause lies in the insufficient number of parking spaces, as (1) holds only for parking demand in areas with enough free spaces. In addition to (1), the second hypothesis of our paper is that enough parking spaces can be ensured through price changes, which alter the composition of user categories in line with the initial basic condition (4) and requirement (5).
Due to only one price change, for each hour on selected days, there are only two data pairs of prices and observed demand
, before and after the price increase, shown in
Figure 3,
Figure 4,
Figure 5 and
Figure 6. Therefore, the unknown function
is approximated under the assumption that the change
is proportional to the price change
at the demand value
for the current price
. According to the collected real data, with an increase in price
, the demand
also increases. Hence, we now define an analogous proportional differential equation, where the right-hand side is positive, consistent with the observed increase in demand due to a positive price change:
Solving it is analogous to solving Equation (7):
where
C is an arbitrary constant. Furthermore,
where
is again an arbitrary but positive constant. The unknown chaotic demand function now becomes as follows:
The parameters and are determined again from two known price–demand pairs:
—higher price and (higher) demand at the higher price
)—lower price and (lower) demand at the lower price
The parameter
, which gives the demand elasticity as per (1), is calculated by substituting the price–demand pairs into Formula (14) and solving the system of exponential equations:
By dividing the equations, we eliminate the parameter
K:
Which finally gives the following:
The parameter
μ is positive, as assumed in the differential Equation (13), in line with the data obtained for STU, DMP, and NMP user categories. Thus,
since
. The elasticity function defined by (1) is now positive, since we get
.
Since elasticity cannot be positive when parking capacity is sufficient, and we are changing the price precisely to ensure enough free parking spaces (4), parameter
is calculated from (14) by substituting
, opposite to the parameter
from (15). By substituting the higher price and the corresponding higher demand at the higher price, and after substituting
from (15), we get the following:
The formula for parameter
is now as follows:
Substituting (15) into (17) yields the final value of
as follows:
where
, as in the case of natural demand. Formula (18) gives meaningful values in simulation for zero demand or the number of users gravitating toward the garage in the case of chaotic demand. Without taking the negative value
from (13), simulation results would be meaningless.
The chaotic demand formula is obtained by substituting the parameters
and
into solution (14):
Elasticity
calculated by Formula (1) is not positive:
Namely, from definition (1):
where
and
are naturally non-negative numbers. Note that for something free of charge, elasticity is undefined in case no one wants it even when free. If there is demand for parking, the elasticity of free parking is zero. The parameters
and
represent the levels of demand at which parking is free, so we refer to them as gravitating demands.
3.2. Simulations
When simulating the number of parked vehicles in any category, STU, DMP, NMP, or CMP, all simulated demands will generally be denoted as
and calculated for simulated prices
using the following:
The model assumes an exponential (non-linear) relationship between price and demand, with category-specific parameters calibrated from observed data. For natural demand categories, parameter is taken from (9), and for categories with chaotic demand, the parameter in (21) is applied as calculated in (15), as explained in the following sections.
For natural demand categories, the Formula (21) is calculated with the parameter from (9), and the parameter is taken as from (10). When simulating categories with chaotic demand, we also use (21), but now we take as , and is from (15). Parameter is taken as , and is from (18). Then, the elasticity (1) for function in (21) is negative in both simulating categories. Namely, simulating prices must be taken to ensure enough parking place according to condition (4).
When simulating the number of users in any category,
prices are again denoted as and calculated for the simulated number of users
. The price that should be set for the corresponding simulated number of users is predicted with the following formula:
For normal demand, is from (9), and from (10). If a chaotic change in demand is observed, the price is again proposed using (22), but now from (15) is substituted in place of and is replaced by from (18).
From the demand functions, natural (11) and chaotic (19), the total revenue function
is obtained by multiplying price and demand:
where
and
are substituted by the constants
or
respectively. From this definition follows the Theorem on the price that maximizes revenue.
Theorem 1. The price that achieves maximum revenue, as defined by Formula (22) for normal demand, is as follows:and the maximum revenue is as follows: Proof. A necessary condition for a maximum is that the first derivative of the function (16) with respect to the only variable equals zero:
Thus, the statement of the theorem directly follows from (23), since and are positive, and if (24), then . The same applies analogously in the case of chaotic demand. □
4. The Simulation Model Application in Gorica PG
Based on the formulas from the model and depending on whether the demand for parking spaces is natural or chaotic, the coefficients and were calculated. For time slots in which certain categories of users did not park vehicles in the garage, the parameters and could not be calculated. Since such time slots were few or always the same for a given user category, the number of vehicles after the price change was used in the simulation. The maximum possible hourly parking price in the simulation must be lower than the price of on-street parking in the vicinity of the garage. Gorica PG is in an area where the hourly price of on-street parking is €1.60. The garage parking price should be lower, since garages are built specifically to reduce the demand for on-street parking. This approach supports a sustainable parking and traffic policy in urban areas.
Using from (18) and from (15), the price was simulated for each individual hour of the day, and Formula (21) provided a forecasted number of users based on the simulated price. In this way, each hourly demand was calculated via simulation such that the initial occupancy criterion (4), garage occupancy up to 95%, was satisfied. Subsequently, the revenue based on simulated prices was calculated to confirm whether increasing total revenue requirement (5) was met.
In the simulation of pricing scenarios for Gorica PG, price adjustments were applied differently for each user category, reflecting their distinct pricing structures and operational logic: hourly rates for STU (short-term users) ranged from €0.50 to €1.50 with €0.10 steps for each of the 24 h while CMP, DMP, and NMP pricing changed in €1 steps. In each simulation iteration, the model tested price increases or decreases in €1 steps, under the following operational constraints: the system operates under a strict limit that occupancy cannot surpass 95% while the goal remains to generate the highest possible revenue within this occupancy restriction. The iterative adjustment of prices across all categories enabled the discovery of an optimal pricing structure for Gorica PG by balancing revenue optimization with acceptable occupancy levels.
The simulation results confirmed that differentiated pricing by three daily time slots better aligns with demand patterns observed after the initial price change. In particular, a moderate reduction in the 15:00–22:00 slot improved vehicle turnover while still meeting the revenue objective (requirement 5).
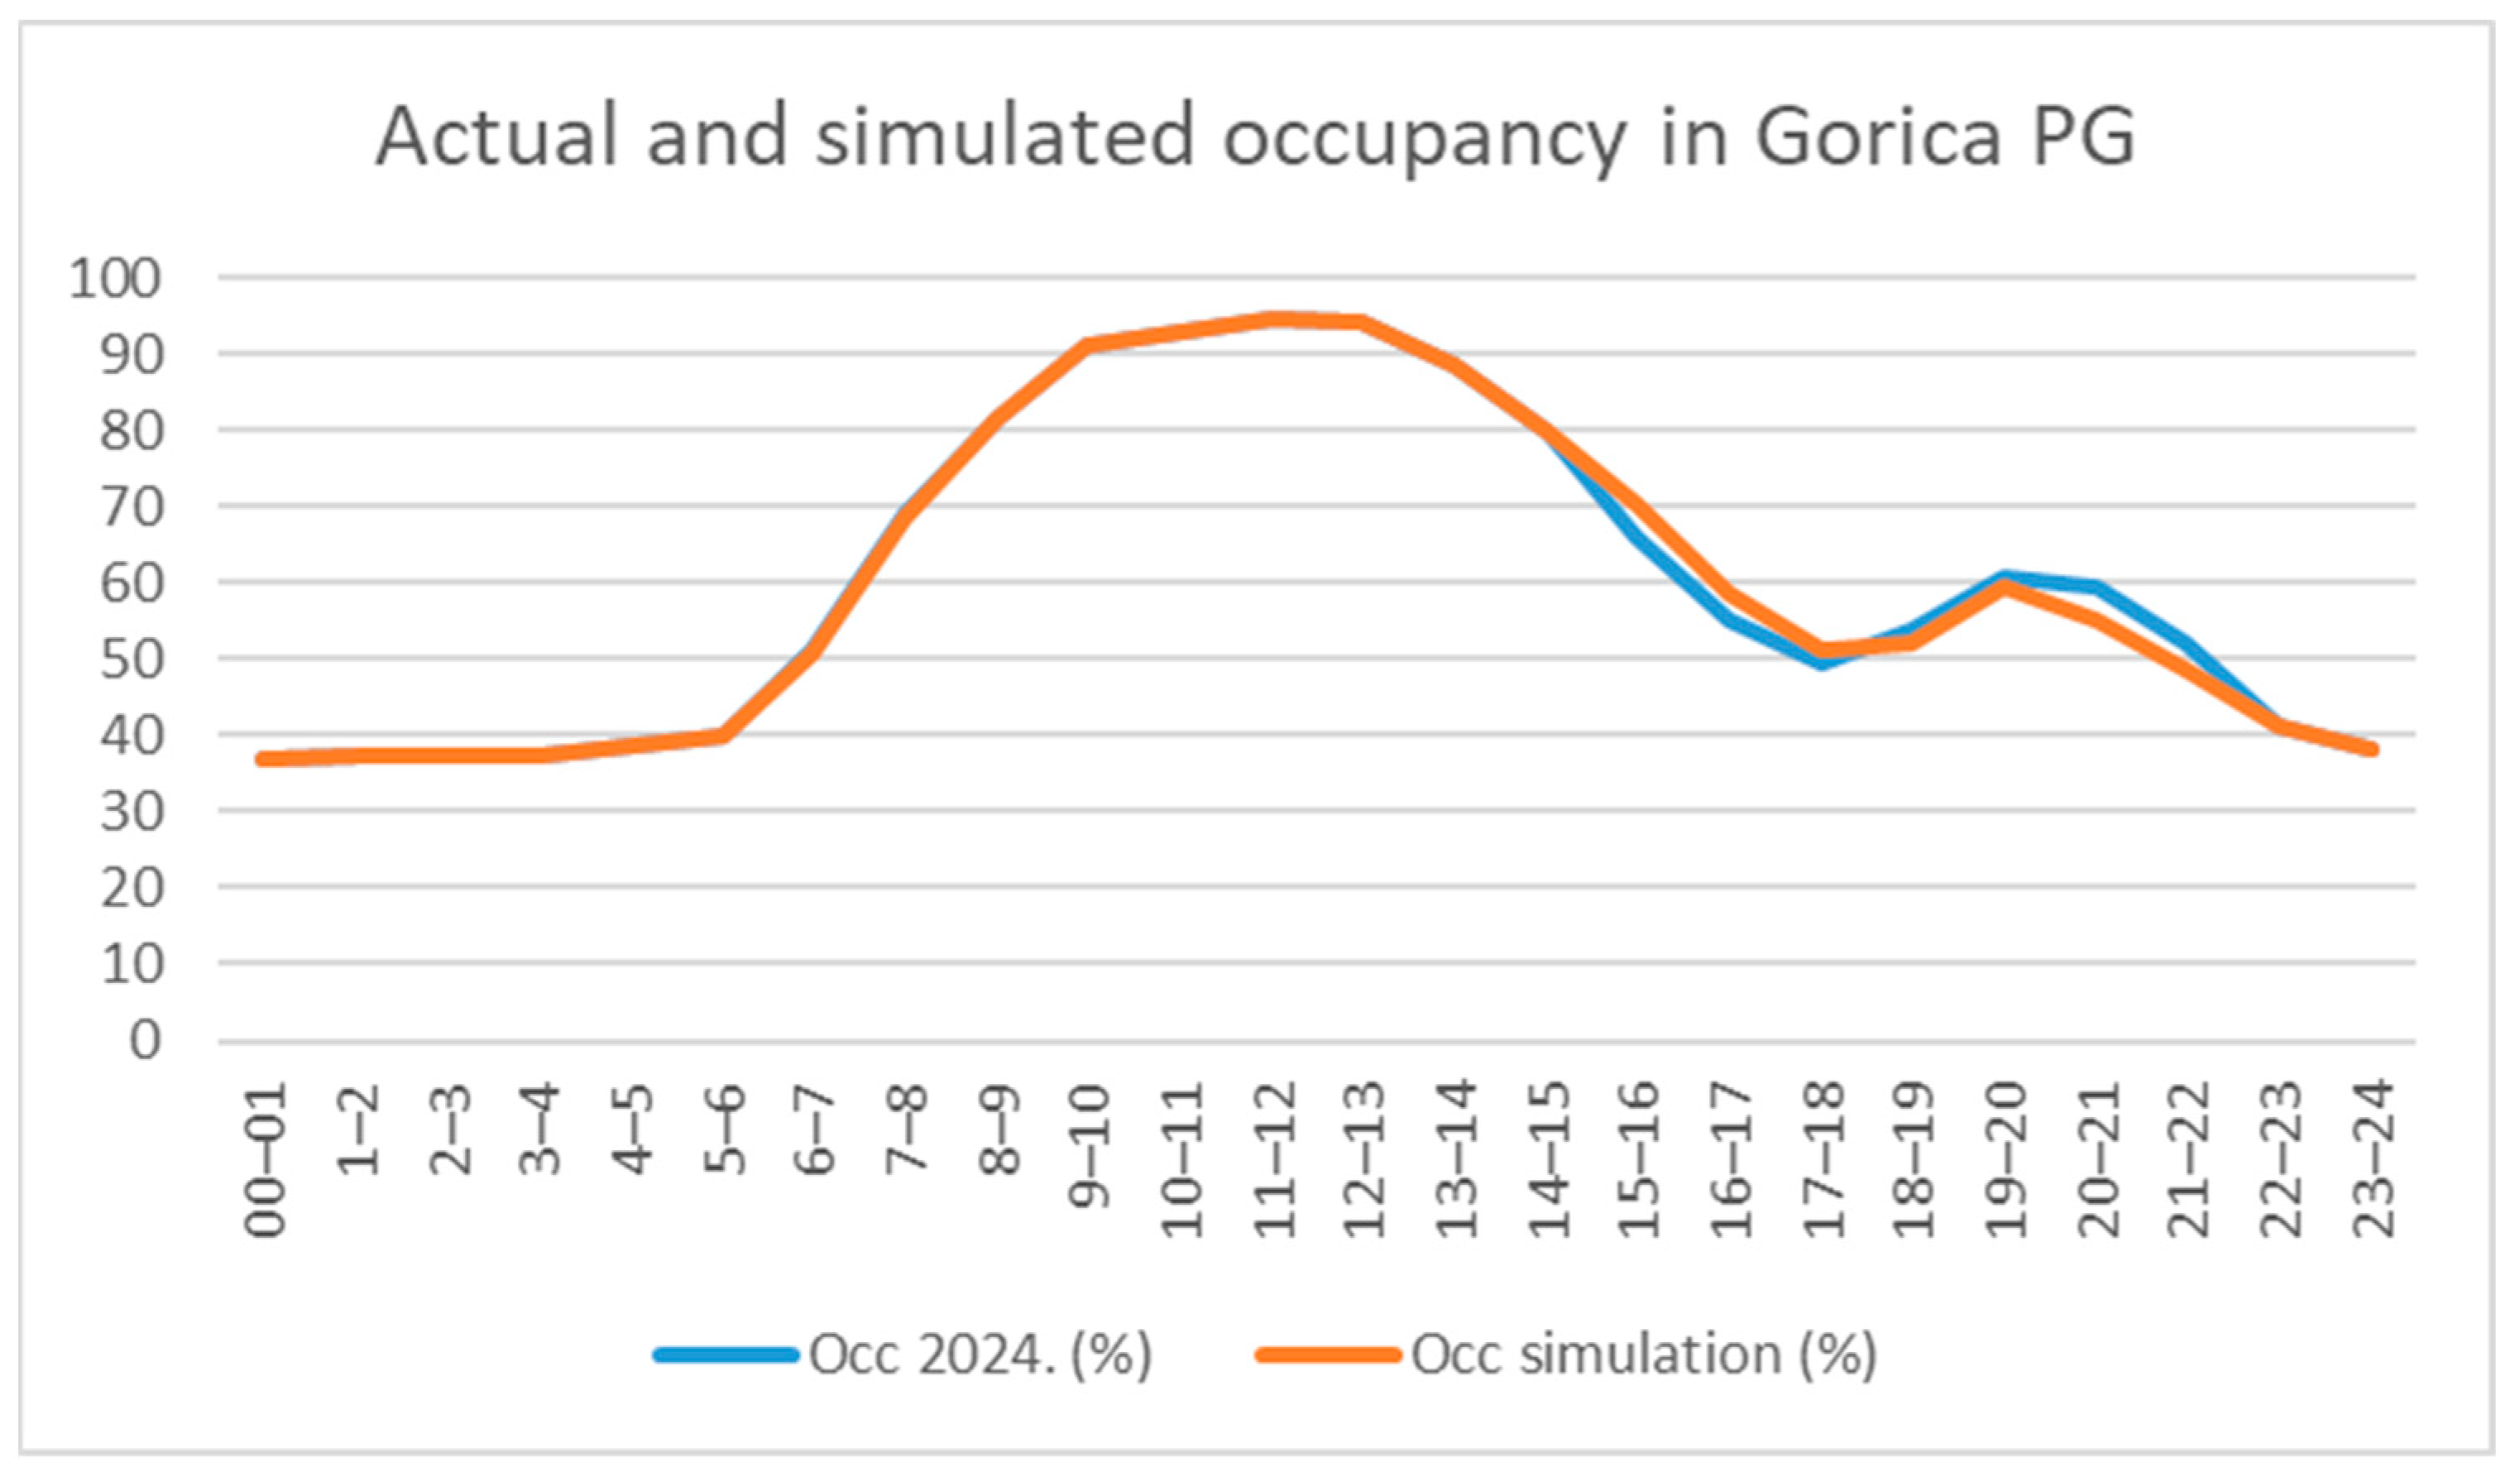
Table 1 presents a comparison of the current and simulated occupancy levels, simulated prices per time slot, and a comparison of the current (
) and simulated number (
) of STU. The simulation maintained occupancy within the defined operational limit (≤95%), as previously observed following the real-life price adjustment.
In time slots where the simulated price increased, the number of parked vehicles or accumulation decreased, and when the price decreased, accumulation increased, as shown in
Figure 7. Since there is no longer overcapacity, parking demand behaves naturally, in line with the discussion around Formula (1), and the initial condition (4) is fulfilled.
The next requirement is to increase total monthly revenue based on simulated revenue for the STU category. The number of vehicles in each hourly interval is multiplied by the price valid in that interval, then by 20 working days, as the data were collected on weekdays, not weekends. A month is assumed to have 20 working days. The sum of these products gives the monthly revenue for working days, excluding Saturdays and Sundays. For subscriptions (DMP, NMP, and CMP), the maximum number of subscribers observed in any hour is taken and multiplied by the monthly subscription price. Summing up, all these values yield the total monthly garage revenue for both short-term tickets and subscriptions.
This simulation approach demonstrates the pricing model’s capacity to align occupancy and revenue objectives by leveraging differentiated demand responses across user categories.
Table 2 presents the revenue data before and after the price simulation, as well as potential monthly revenue according to the simulation.
The prices and time slots for other categories were not changed in the simulation, which confirmed that the pricing policy listed in
Table 1 satisfies the initial occupancy condition (4) and requirement (5). When the CMP price is increased from €100 to €110, the DMP price is increased from 40 to €42, and the simulated STU price remains as shown in
Table 1, the simulated revenue becomes the highest (€36,635). During this scenario, occupancy in none of the time slots exceeds 90%. This revenue is the highest; however, the goal of every garage is to maximize vehicle occupancy to relieve on-street parking. Therefore, the initial occupancy condition (4) should be replaced with condition (25), as the garage should be maximally filled without exceeding 95% occupancy:
For this reason, to satisfy both condition (25) and requirement (5), the ideal simulation of prices and time slots is the one shown in
Table 1.
5. Conclusions
This study was motivated by an economically atypical situation in which an increase in parking prices paradoxically resulted in higher demand among certain user categories. This counter-intuitive outcome was observed during periods when total demand exceeded supply, leading to full occupancy of the parking facility. Under such circumstances, it was necessary to apply the chaotic demand model to determine the actual demand or to propose prices that satisfied the initial condition (4) and requirement (5).
The central hypothesis of this research posited that, provided with enough available parking spaces, an increase in price would lead to a decrease in parking demand. Our analysis of aggregate data supported this hypothesis, as total demand declined in response to higher prices. However, a more detailed examination of individual user categories revealed that demand for some segments increased. This phenomenon was attributed to the prior shortage of available spaces during peak periods, which suppressed demand for these categories until the price adjustment was implemented. Following the price increase, overcapacity was eliminated, and higher-revenue user groups gained improved access to parking.
Initial attempts to estimate gravitational demand parameters within the chaotic demand framework used the previously derived elasticity parameter μ from Formula (15). Therefore, the model for optimal pricing required recalibration. The chaotic gravitational demand parameter K was subsequently adjusted using Formula (18) to align with the basic hypothesis (1). This modification produced gravitational demand values that aligned with observed outcomes and enabled the simulation model to generate valid demand forecasts.
Once total demand was established, the model used simulated pricing to calculate demand while verifying the initial condition (4) and the revenue maximization requirement (5). During the research, the initial condition (4) was updated and now reads as condition (25). The analysis of demand changes and the factors influencing demand across different user categories was limited due to the infrequent price changes. Our model modifies user category demand through price simulation while meeting the updated initial model condition (25), and points to more profitable management in line with requirement (5).
The model’s structure is adaptable to a variety of parking environments, but it requires new demand parameter estimation for each specific application. Substantial variations in user composition and willingness to pay across different urban contexts necessitate local calibration based on observed responses to pricing adjustments. The model framework supports such calibration using relatively limited datasets, relying on basic before-and-after price comparisons to adjust key parameters to the local context.
The simulation model highlights the fundamental trade-off between maximizing parking revenue and preserving user access through the management of occupancy limits. By identifying pricing strategies that maintain parking availability below 95% occupancy, the model offers a practical approach to simultaneously reduce traffic congestion and ensure financial sustainability. Policymakers can apply this method to develop dynamic pricing strategies tailored to time of day and user category, with the aim of achieving outcomes such as higher turnover rates, reduced emissions from cruising traffic, and more balanced utilization of parking facilities.
While the model structure is adaptable, several limitations should be acknowledged.
The model’s key demand parameters were estimated from two observed data points per time slot—before and after a single price adjustment—collected during a single 24 h period at one public garage. This limited empirical foundation introduces the risk of overfitting to short-term fluctuations or context-specific anomalies. The current parameters should therefore be regarded as initial estimates, capturing the direction and relative magnitude of price responsiveness, but lacking validation for reliable predictive performance across varied operational contexts. To improve the precision of parameter estimates and enhance statistical robustness, future research should incorporate multi-day observations across a range of facilities, pricing levels, and temporal conditions. Larger datasets will enable the calculation of confidence intervals for demand parameters, identification of potential non-linear effects and threshold responses to price adjustments, and the differentiation between structural demand patterns and isolated anomalies. Such refinement is essential to strengthen both the model’s generalizability and its predictive accuracy.
Independent or out-of-sample data has not yet been used to validate the model. This limitation stems from the restricted data scope, as elasticity parameters were calibrated using a single 24 h before-and-after observation period at one facility. Without validation on out-of-sample data, the model currently cannot provide formal measures of predictive accuracy or report evaluation metrics such as RMSE, MAE, or confidence intervals. As a result, the current parameter values should be interpreted as contextual indicators, rather than as statistically validated estimates. We acknowledge this as a primary limitation of the present study. However, we have already begun acquiring multi-day occupancy and pricing data from multiple facilities. The expanded dataset will support back-casting, statistical validation, and sensitivity analysis which will enhance the model’s generalizability and predictive reliability.
The current version of the simulation model treats hourly intervals as independent units. As a result, it does not capture temporal dependencies in user behavior—specifically, how parking decisions at a given time may be influenced by parking space availability in earlier hours. For example, users who encounter access denial during morning hours may choose not to attempt parking later in the day, resulting in temporal spillover effects that the model does not currently represent. Future development of the model will consider incorporating dynamic simulation techniques or agent-based modeling to better account for these cumulative behavioral effects.
The model currently assumes that user categories remain fixed and independent and does not account for potential substitution effects between different user segments. For example, a reduction in CMP demand may cause some users to switch to STU services or to seek alternative local parking options. Future enhancements to the model may incorporate cross-elasticity functions and behavioral modeling techniques to capture such interdependencies and more accurately represent substitution dynamics across user categories.
The present simulation study analyzes pricing as the sole adjustable policy variable. Other instruments—such as parking time limits, targeted discounts, digital reservation systems, and congestion-responsive pricing—also influence parking demand, but were excluded from this analysis due to data limitations. These factors represent important avenues for future model enhancements, and their incorporation will enable a more comprehensive representation of parking management strategies.
The model currently assumes uniform behavior within each user category and does not account for individual-level variations such as walking distance tolerance, likelihood of repeat visits, or time-of-day preferences. Future versions of the model will seek to incorporate behavioral heterogeneity through the use of more detailed data sources, and by applying agent-based modeling or choice modeling frameworks.
The simulation was conducted using data from a single public garage, which limits the model’s ability to generalize to other contexts. Validating the model’s broader applicability will require testing it across a variety of parking environments, including residential and commercial areas, and across different city types. Future research should also incorporate structured sensitivity analysis to formally evaluate the model’s robustness under parameter changes and across varying time-slot pricing scenarios.
