Article

Pattern Recognition in Dried Milk Droplets Using Lacunarity and Deep Learning

by
Josías N. Molina-Courtois
1,
Yaquelin Josefa Aguilar Morales
1,
Luis Escalante-Zarate
1,
Mario Castelán
2,
Yojana J. P. Carreón
1,3 and
Jorge González-Gutiérrez
1,*
1
Facultad de Ciencias en Física y Matemáticas, Universidad Autónoma de Chiapas, Tuxtla Gutiérrez 29050, Chiapas, Mexico
2
Robotics and Advanced Manufacturing, Center for Research and Advanced Studies of the National Polytechnic Institute, Ramos Arizpe 25900, Coahuila, Mexico
3
Secretaría de Ciencia, Humanidades, Tecnología e Innovación (SECIHTI), Mexico City 03940, Mexico
*
Author to whom correspondence should be addressed.
Appl. Sci. 2025, 15(10), 5676; https://doi.org/10.3390/app15105676
Submission received: 17 April 2025 / Revised: 14 May 2025 / Accepted: 14 May 2025 / Published: 19 May 2025

Abstract

:
This study introduces a novel method for classifying whole and lactose-free milk and the detection of water adulteration through analyzing dried droplets. The key innovation is the addition of NaCl, which modulates crystallization to enhance structural differentiation and facilitate the classification of milk types and detection of adulteration. Dried droplets of milk containing NaCl concentrations of 0 % , 2 % , and 4 % were analyzed, revealing distinct morphologies, including amorphous, cross-shaped, and dendritic crystals. These structures were quantitatively characterized using lacunarity to assess their discriminatory power. Two classification approaches were evaluated: one based on lacunarity analysis alone and another incorporating deep learning. Both methods yielded high classification accuracies, with lacunarity achieving 95.04 % ± 6.66 % , while deep learning reached 95.22 % ± 4.47 % . Notably, the highest performance was obtained with 2 % NaCl, where lacunarity reached 97.08 % ± 2.27 % and deep learning 96.88 % ± 2.8 % , indicating improved precision and stability. While deep learning demonstrated more consistent performance across test cases, lacunarity alone captured highly discriminative structural features, making it a valuable complementary tool. The integration of NaCl and lacunarity analysis offers a robust and interpretable methodology for ensuring the quality and authenticity of dairy products, particularly in detecting adulteration, where morphological contrast is less evident.

1. Introduction

Milk, recognized as a rich source of calcium, proteins, fats, vitamins, and minerals, serves as an essential food for both children and adults, owing to its accessibility and affordability. However, milk adulteration remains a pressing issue, posing risks to both public health and economic stability [1]. A striking example is the 2008 incident in China, where melamine-adulterated milk led to the intoxication of 294,000 children and six reported deaths [2]. Among the prevalent practices employed to increase milk volume and to reduce production costs, two methods are particularly concerning: the substitution of milk with lower-quality variants and adulteration with water [3]. Consequently, the development of reliable detection methods to identify different types of milk and water adulteration is of utmost importance.
The evaporation of a droplet on a substrate leads to a distinctive deposit with unique morphological features [4]. The interplay between capillary and Marangoni flows generates various intricate patterns [5]. Capillary flows emanate from the droplet’s interior, moving radially towards the edge [6]. Non-volatile particles in the droplet fluid are pushed outward by capillary flows, creating the well-known “coffee ring effect” [7]. Conversely, Marangoni flows, driven by concentration gradients, induce recirculation within the droplet, which leads to a homogeneous deposit [8].
Analysis of patterns in dried droplets has proven instrumental in detecting macromolecules and their conformational changes [9,10]. This breakthrough has not only enabled the development of diagnostic alternatives for various health disorders [11,12] but has also paved the way for creating strategies to ensure quality control in liquid consumables [13,14] and medicines [15,16]. In the context of milk adulteration detection, Kumar and Dash estimated the total evaporation time and droplet mass to identify added urea and water in milk [17], while another study successfully detected starch and water adulteration in milk using Raman spectroscopy, light microscopy, and surface profilometry [18]. Additionally, a recent breakthrough came with the introduction of a deep learning algorithm capable of identifying adulteration, coagulation, andspoilage in cows milk [19].
Salts significantly influence droplet drying by acting as essential crystal nucleators, leaving behind crystal structures that can act as fingerprints for samples [20]. Experimental evidence shows crystalline hydrates growing near the contact line, distorting the droplet profile [21]. The concentration and composition of salts in the solution notably affect the structure, size, and distribution of aggregates formed during drying, as well as the droplet’s evaporation rate [22,23]. Saline droplets display low crystallization rates [24,25], with crystallization starting at the contact line and progressing towards the center [26,27], due to the combined effect of the maximum evaporation rate and higher salt concentration at the droplet’s edge.
Lacunarity analysis, a metric that characterizes the translational invariance of an object’s topology [28,29,30], has shown predictive capability in various fields. It has been successfully employed to predict telomerase reverse transcriptase (TERT) promoter mutation status in grade 2 meningiomas [31], osteoporotic fracture risk in women over fifty [32], and detect drug-induced changes in tumor vascularities. High lacunarity indicates heterogeneity, gaps, or holes in objects, while low lacunarity suggests homogeneity, smoothness, and translational invariance. Notably, lacunarity analysis has demonstrated its potential in distinguishing motile and non-motile sperm cells in dried droplets with a recognition accuracy of 95% and 85%, respectively [33]. In the context of dried droplets and milk adulteration detection, lacunarity analysis presents a promising approach to explore new patterns that could serve as valuable biomarkers and enhance quality control mechanisms for milk.
Recent studies focusing on pattern analysis of dried droplets have made significant contributions to the detection of adulteration in milk. However, differentiating among various types of milk, such as whole or lactose-free, remains elusive. Identifying new patterns in deposits could potentially lead to the discovery of biomarkers, thus enhancing the quality control mechanisms for milk.
Despite significant advancements in milk adulteration detection, an important gap remains unaddressed: current methods primarily focus on identifying specific contaminants such as starch, urea, or spoilage-related alterations, but fail to effectively differentiate between different milk types. Moreover, while salts have been recognized as key modulators in droplet pattern formation, their potential role in enhancing classification accuracy in milk analysis has been largely unexplored. Deep learning approaches have demonstrated high accuracy in identifying adulteration [34], yet they often lack interpretability and require extensive training datasets. In contrast, lacunarity analysis provides a robust quantitative framework for characterizing pattern complexity, offering a potentially more interpretable and scalable approach for milk classification. Addressing this gap, our study investigates how the addition of NaCl influences the formation of dried droplet patterns and evaluates whether NaCl-enhanced morphology improves the reliability of lacunarity analysis, particularly in the context of adulteration detection.
In this study, we present a novel approach for differentiating whole milk from lactose-free milk and detecting water adulteration in each of these types of milk, through the analysis of dried droplets. The key innovation lies in the controlled addition of NaCl, which modulates the crystallization process and enhances the structural differentiation, especially in adulterated samples where intrinsic morphological differences are subtle. By leveraging lacunarity analysis, we quantitatively characterize the complexity of these structures and evaluate their discriminatory power using ROC curve analysis. Our results demonstrate that lacunarity alone achieves high classification accuracy ( 95.04 % ± 6.66 % ), while the integration of deep learning further improves performance ( 95.22 % ± 4.47 % ). Notably, the highest accuracy is achieved with 2 % NaCl, where lacunarity reaches 97.08 % ± 2.27 % and deep learning 96.88 % ± 2.8 % , indicating enhanced precision and stability. Our findings support NaCl-enhanced lacunarity analysis as a robust and interpretable methodology for detecting adulteration and, to a lesser extent, for classifying milk types when intrinsic differences are insufficiently distinctive.

2. Experimental Details

2.1. Sample Preparation and Storage

We used whole and lactose-free commercial milk to carry out our experiments (see the nutritional values in Table 1). All samples for each milk type were sourced from the same supplier and production batch to ensure compositional consistency and minimize batch-to-batch variability. Each milk sample was diluted using commercially purified drinking water (Electropura™, GEPP, Mexico)), which undergoes reverse osmosis and ultraviolet treatment, ensuring minimal ionic and organic content. This choice ensured a consistent and reproducible dilution medium. Adulterated samples were prepared by adding purified water to achieve water concentrations ranging from 20% to 90%. Sodium chloride (NaCl) was then added to generate concentrations of ϕ = 2% and 4% in the final mixtures. To minimize any potential changes in chemical composition induced by NaCl addition or dilution, all samples were stored at 4 ± 1 °C in sealed containers and used within 6 h of preparation. This refrigeration protocol is consistent with standard short-term preservation practices for dairy-based matrices and helps ensure chemical stability prior to droplet deposition and analysis.

2.2. Drop Evaporation

Twelve droplets with a volume of 3 µL were carefully deposited onto a brand-new Poly(methyl methacrylate) (PMMA) substrate. The droplets were dried inside an enclosed box, under precisely controlled temperature conditions ranging from 22 to 25 °C, while maintaining a Relative Humidity (RH) level between 30 and 35%. To ensure accurate measurements, temperature and humidity were monitored using a sensor (Model: LYWSD03MMC, CMIIT ID: 2019DP8115; Miaomiaoce Technology (Beijing) Co., Ltd., Beijing, China). The relative humidity was meticulously regulated using the water activity parameter a w = ρ / ρ 0 , wherein ρ represents the vapor pressure of water in the substance, and ρ 0 signifies the pressure of pure water vapor at the same temperature.

2.3. Image Acquisition

The observation of deposits, which formed through evaporation under ambient conditions, was carried out using a Velab microscope (Model: VE-M4; Velab Co., Pharr, TX, USA). with magnifications of 4× and 10×, in conjunction with a Nikon camera (D3200). The images were captured at a resolution of 300 PPI, resulting in approximately 4000 pixels in length for the longest side. To analyze the drying process of the droplets, we measured the contact angle, drop height, and radius using the ImageJ software (version 1.52a).

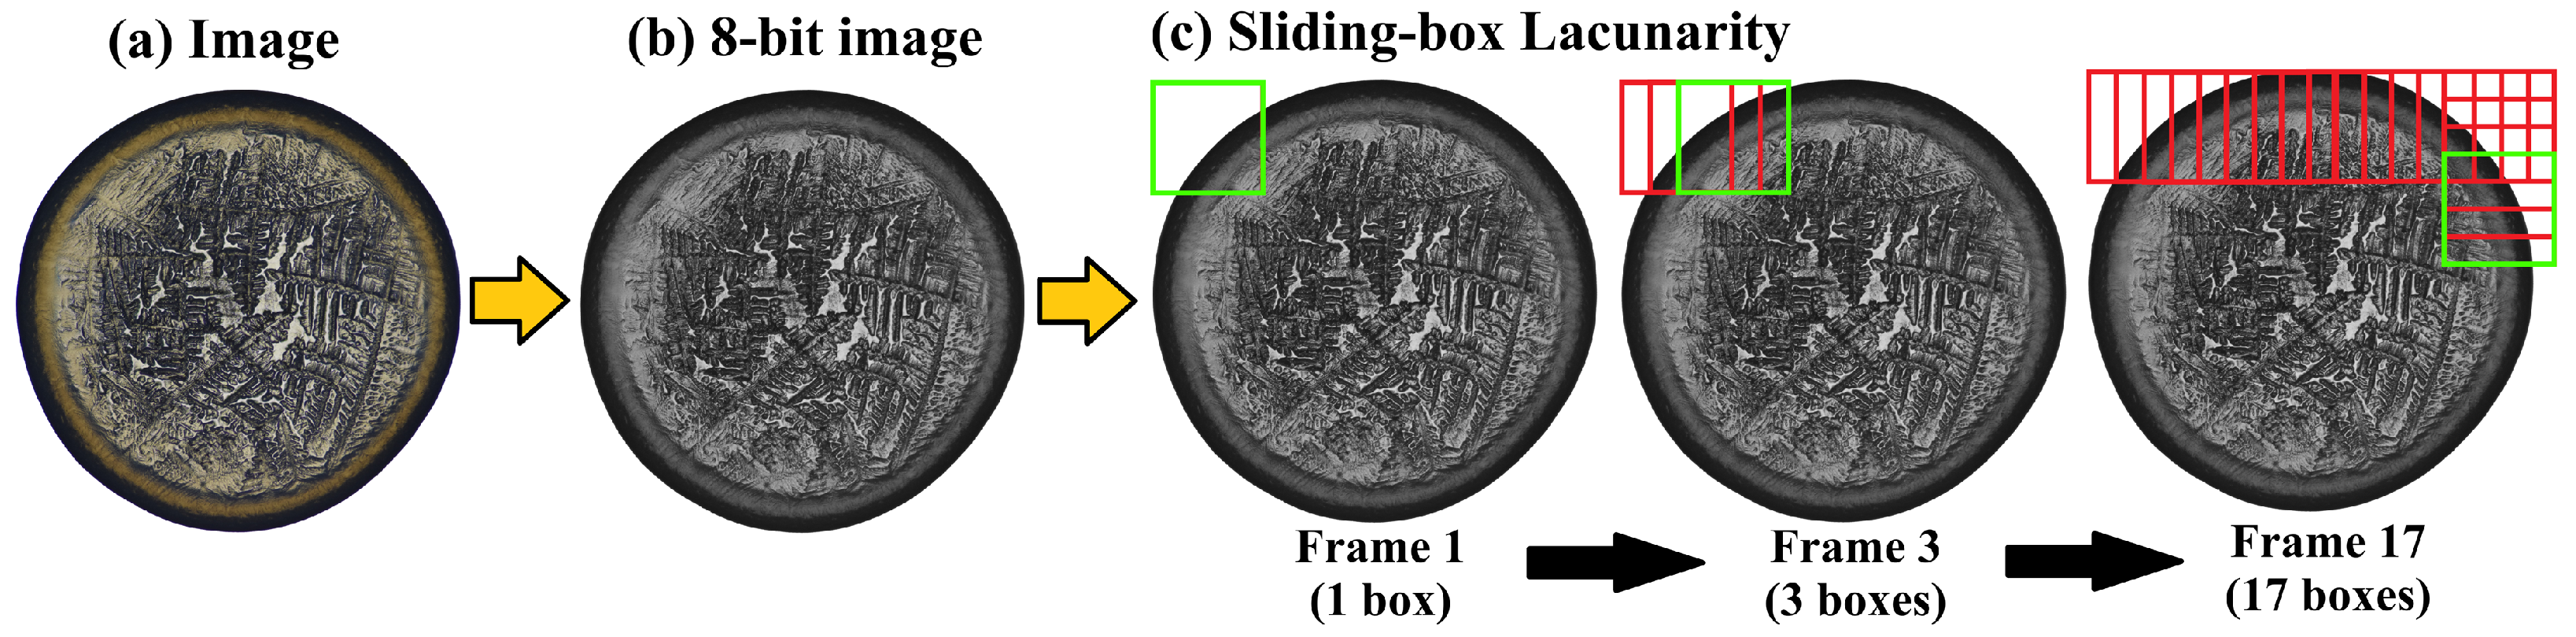
2.4. Lacunarity Analysis of Dried Droplets

The “lacunarity” λ quantifies the surface heterogeneity and roughness of an object at different scales [29,33,35]. Mathematically, lacunarity is formally defined as the nondimensional ratio of the second and first moments of mass distribution within a box of side length l, defined as:
λ ( l ) = 1 + σ ( l ) μ ( l ) 2
where μ ( l ) and σ ( l ) represent the mean and the standard deviation of pixel intensity in a specific region of a digital image. Lacunarity is estimated using the sliding box count method in computer vision (see Figure 1), where the number of pixels within a box of side length l is counted. We analyze 310 × 310 pixel images using boxes of side l = 2, 5, 10, 20, 30, 40, 50, 60, 70, 80, 90, 100, 110, 120, 130, 140, 150, 160, 170, 180, 190, and 200 pixels, with corresponding total numbers of boxes to cover the image: 1763, 1763, 1680, 1520, 1368, 1224, 1088, 960, 840, 728, 624, 528, 440, 360, 288, 224, 168, 120, 80, 48, 24, and 8.

2.5. The Receiver Operating Characteristic (ROC) Curve

A receiver operating characteristic (ROC) graph evaluates and compares classifiers’ effectiveness [36,37,38]. It demonstrates a classifier’s ability to distinguish between positive and negative instances by plotting true positive rate (Sensitivity) against false positive rate (1-Specificity) for various threshold values on the confidence score [36,39]. Sensitivity is the proportion of correctly classified positive samples, and Specificity (true negative rate) is the proportion of correctly classified negative samples. These quantities are defined mathematically in Equations (2) and (3). Note that Specificity and 1-Specificity are complementary; Specificity represents correctly classified negative samples, while 1-Specificity indicates incorrectly classified negative samples.
Sensitivity = T P T P + F N , Specificity = T N T N + F P
1 Specificity = F P F P + T N
The ROC curve provides a two-dimensional representation of classifier performance, illustrating the trade-off between Sensitivity and 1-Specificity. Each point on the ROC curve corresponds to a threshold value used for sample classification. The Area Under the ROC Curve is a widely used metric for comparing classifier performance in ROC analysis. It represents the probability that the classifier algorithm ranks a randomly chosen positive instance higher than a randomly chosen negative instance. For a detailed procedure on ROC curve analysis, refer to [36,39].

2.6. Lacunarity Analysis and Classification Using Deep Learning

The lacunarity analysis of dried droplet deposits was conducted using an image processing algorithm that integrates thresholding, segmentation, and structural quantification techniques. Subsequently, a deep learning model based on the DenseNet-121 architecture was employed to classify the patterns formed in the dried droplets.

2.6.1. Image Processing and Lacunarity Calculation

High-resolution images ( 4000 × 4000 pixels) of dried deposits were processed using OpenCV and the scikit-image library. Initially, each image was converted to grayscale and binarized using Otsu’s thresholding method to facilitate the segmentation of relevant structures. Then, the images were systematically segmented into consecutive, non-overlapping regions of interest (ROIs) of dimensions 128 × 128 pixels, covering the entire image to ensure a detailed analysis of the relevant substructures.
Lacunarity ( λ ) was calculated using a sliding box counting method with a box size of 4 pixels, following Equation (1), where μ and σ represent the mean and standard deviation of pixel intensity values within each ROI. Only ROIs with lacunarity values exceeding a threshold of 1.5 were selected.

2.6.2. Classification Using Deep Learning

The ROIs selected based on the lacunarity threshold were used in their original RGB format to train a model based on the DenseNet-121 convolutional network, adapted by adding a global pooling layer and a fully connected layer with 1024 neurons with ReLU activation, followed by a softmax output layer.
The number of images and ROIs selected for each experimental condition is detailed in Table 2 and Table 3. The dataset was randomly divided into training and validation subsets, using 80% of the selected ROIs for training and 20% for validation, which were normalized and categorically encoded before training. The Adam optimizer was used with a learning rate of 1 × 10 4 and a categorical cross-entropy loss function. The model was trained for 10 epochs with a batch size of 32.

2.6.3. Model Evaluation and Statistical Testing

The model’s performance was evaluated based on standard metrics derived from the confusion matrix: precision, recall, specificity, and the F1-score. Additionally, to validate the observed differences in the lacunarity distributions between classes, the Kolmogorov–Smirnov (K-S) test was performed. This test compared the distribution of lacunarity values in both classes and reported the test statistic D and the p value, which was less than 0.05, indicating statistically significant differences between the distributions.
To facilitate result interpretation, accuracy and loss graphs over epochs were generated, along with heatmaps of the confusion matrix. Additionally, a function was implemented to visually highlight the selected ROIs with high lacunarity in the original images. All related outputs, including performance metrics, training history, and confusion matrix visualizations, are available in the Supplementary Materials.

3. Results

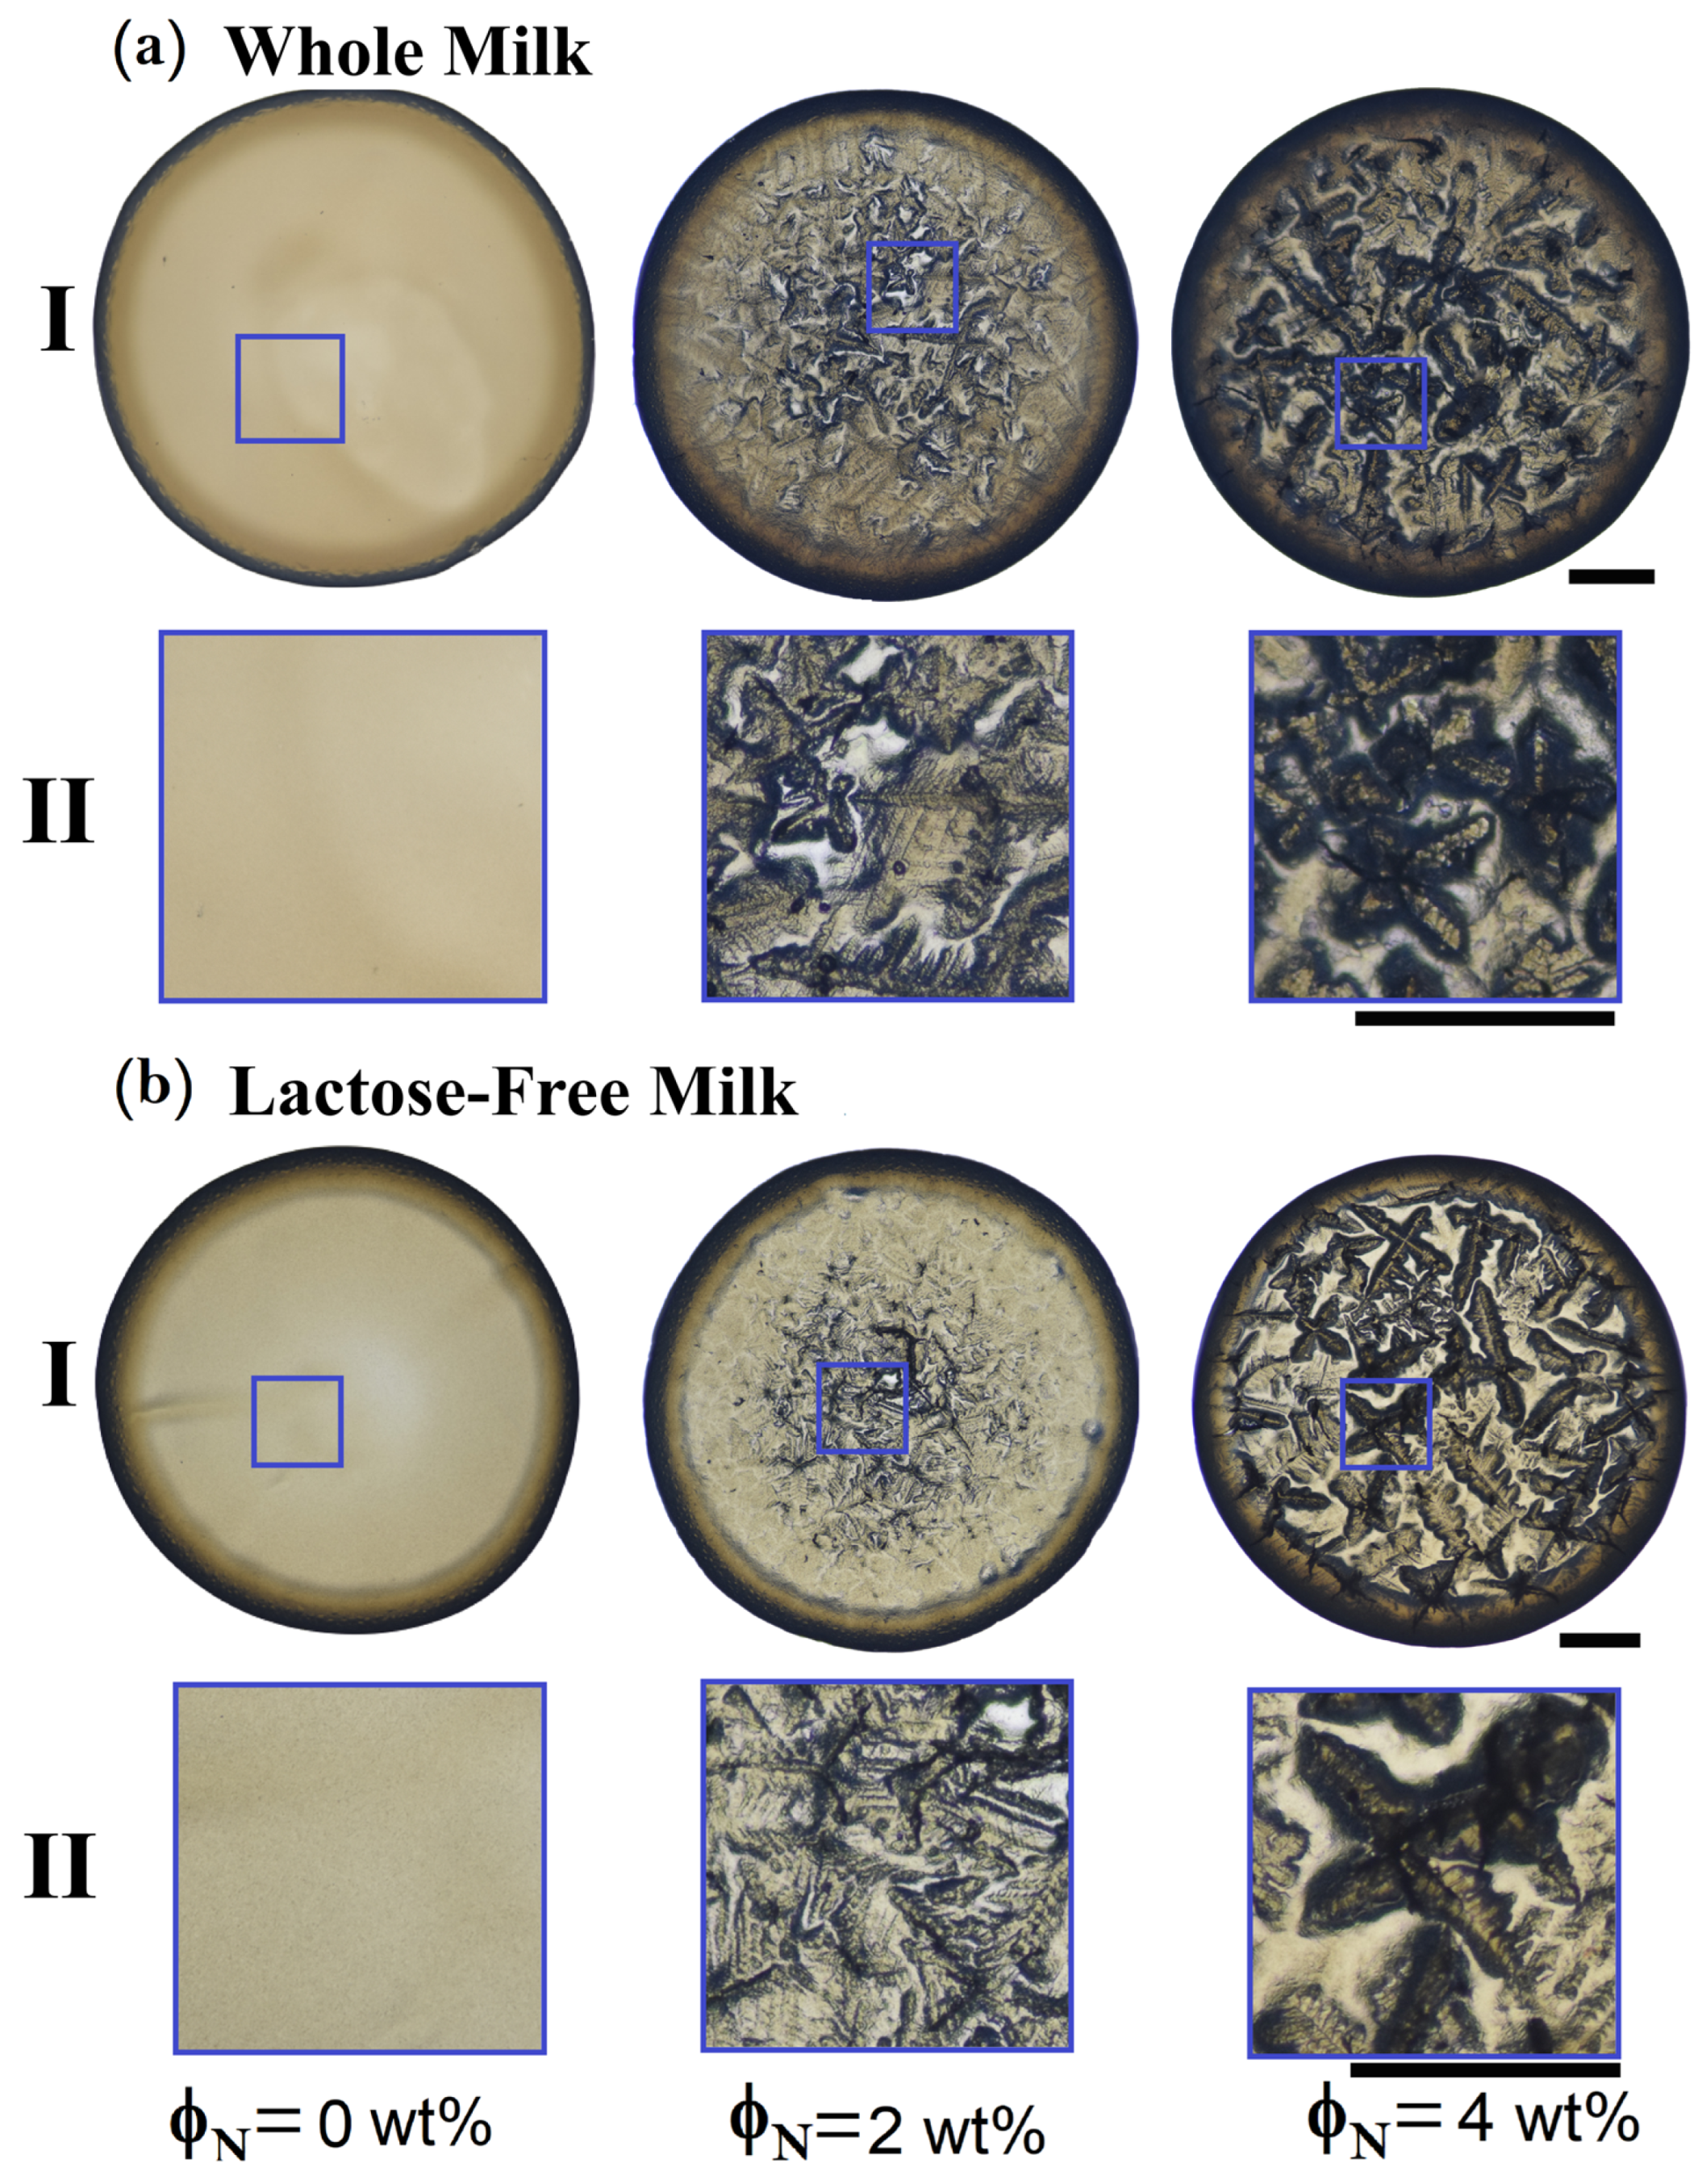
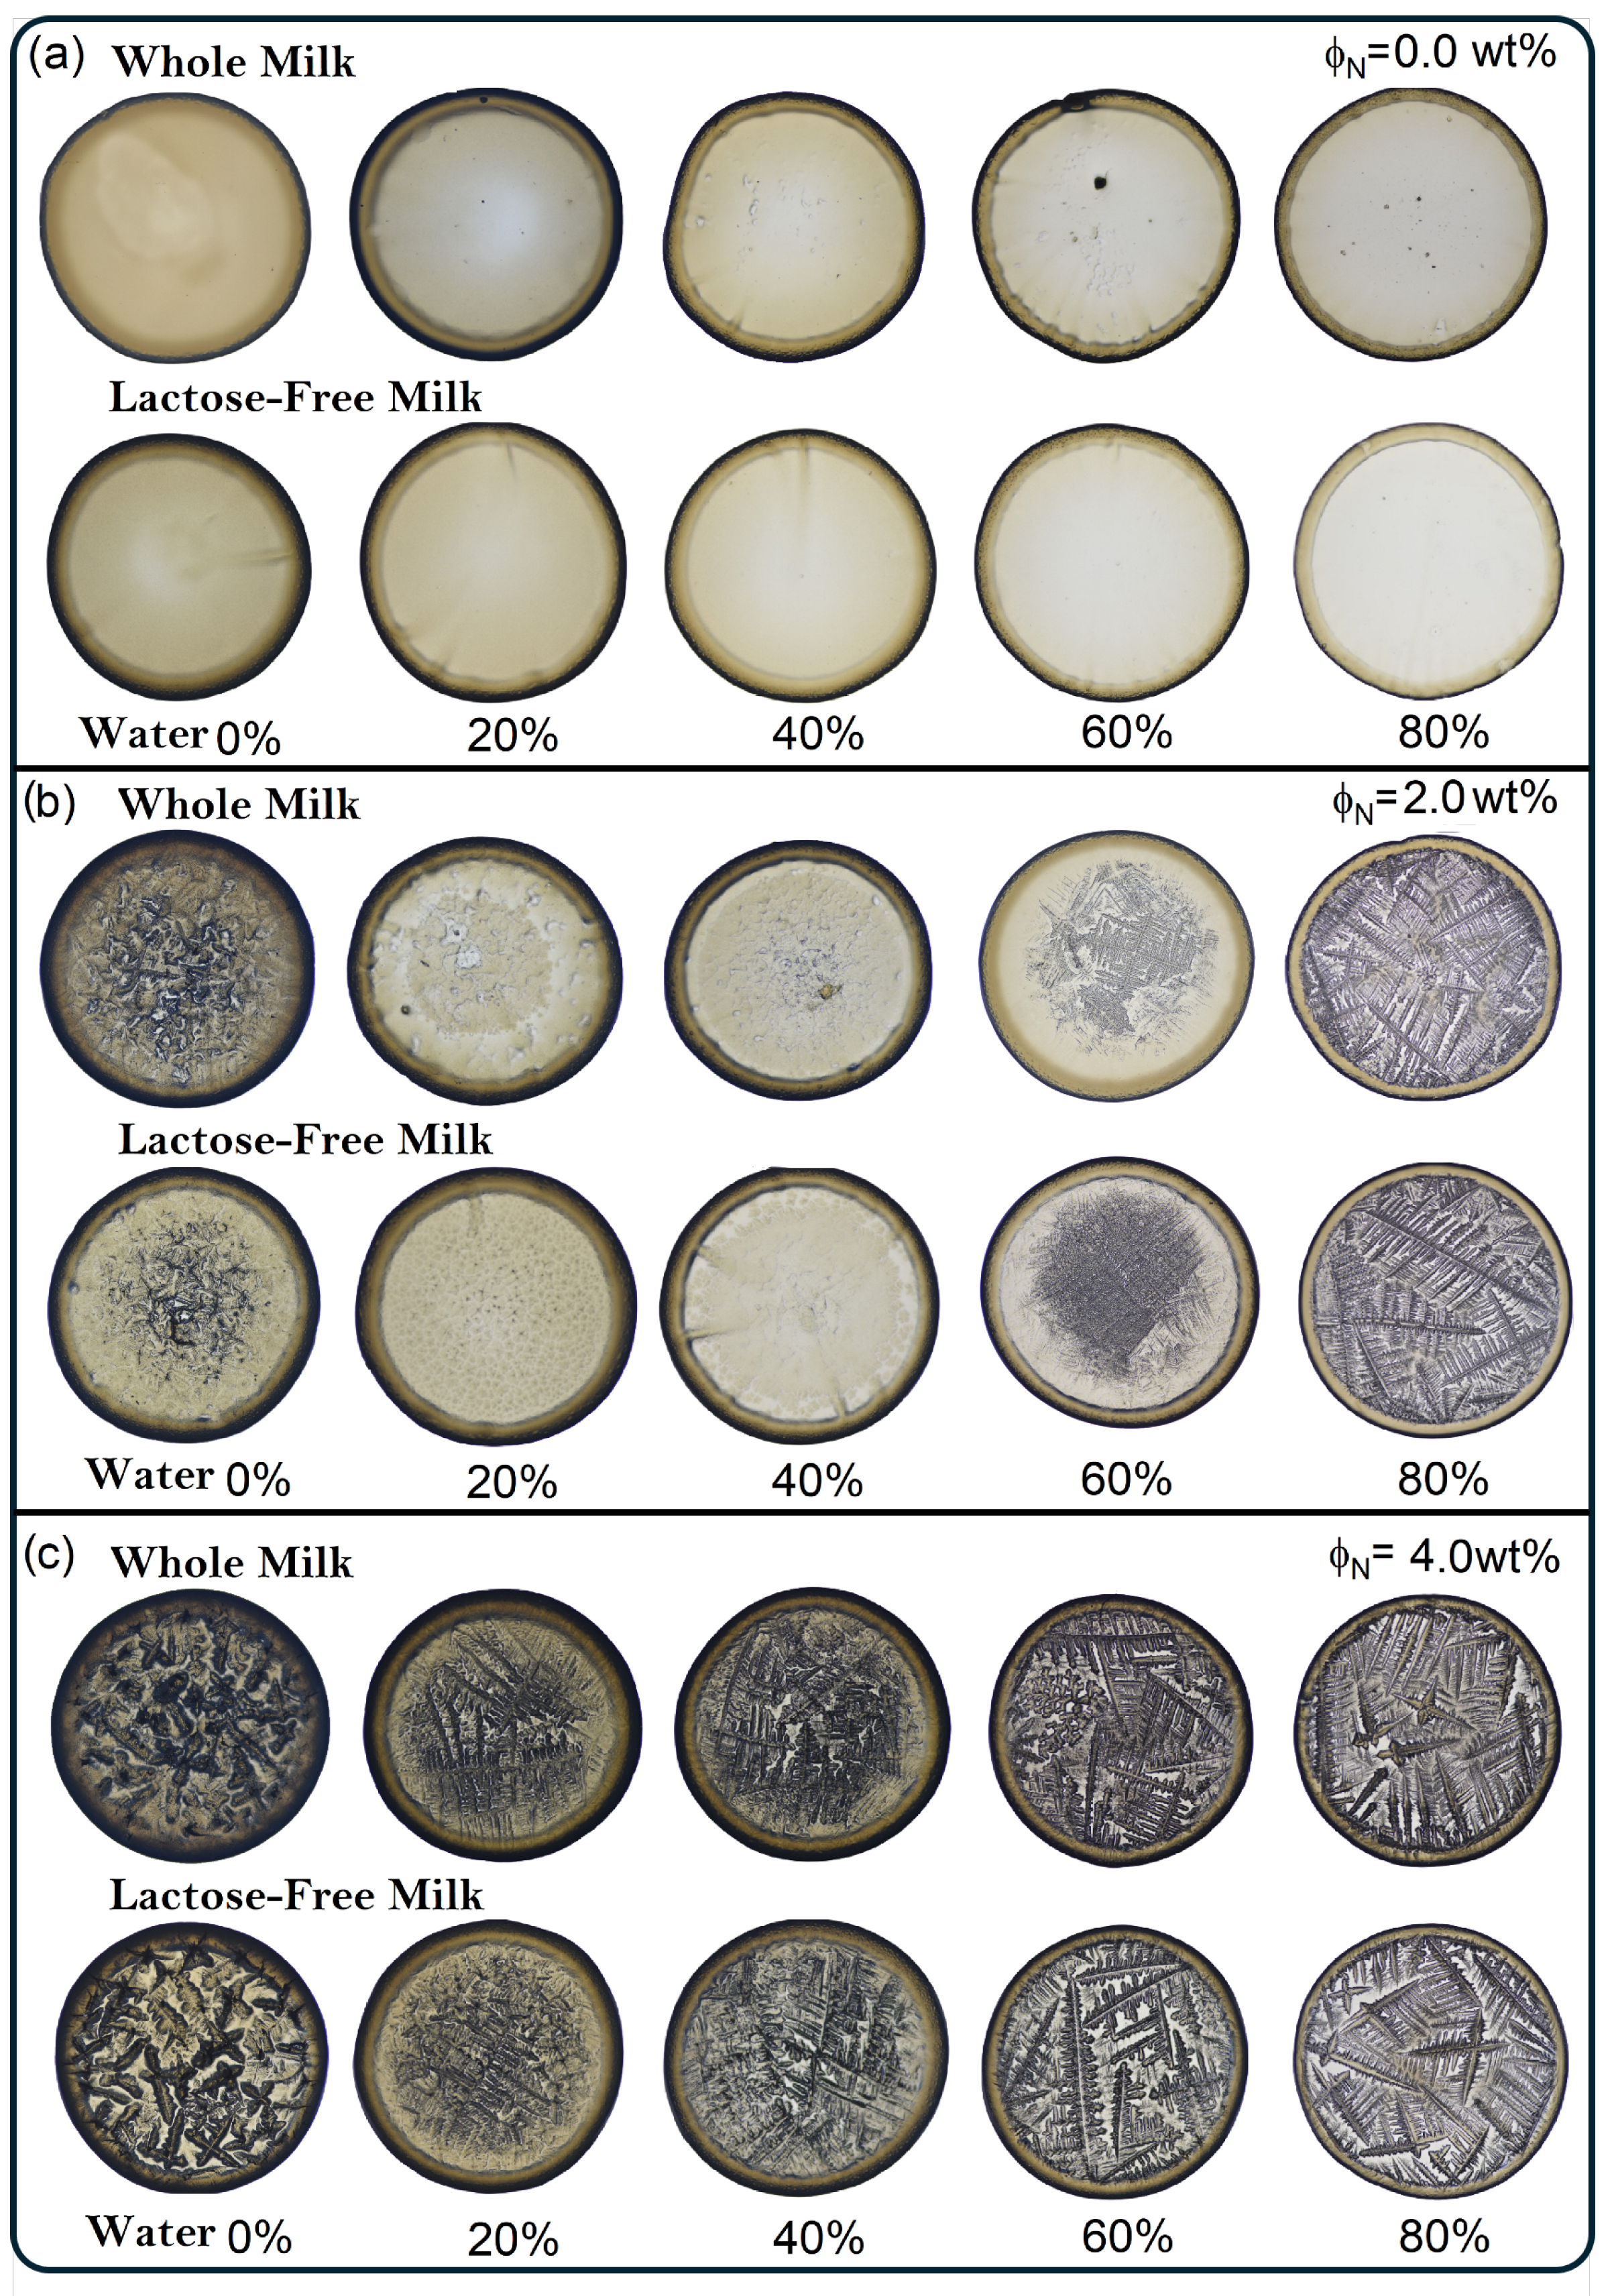
3.1. Pattern in Dried Droplets of Milk with NaCl

Figure 2 displays the dried deposits of whole milk (a) and lactose-free milk (b) at varying concentrations of NaCl ( ϕ N = 0–4 wt%). At ϕ N = 0 % , both types of milk exhibit a well-defined coffee ring with a homogeneous central region. As the NaCl concentration increases to ϕ N = 2 wt % , a noticeable thickening of the coffee ring occurs, accompanied by the formation of amorphous crystalline structures in the central area of the deposits. In lactose-free milk, an intermediate homogeneous region is observed between the coffee ring and the amorphous crystalline structures, which is less pronounced in whole milk. At ϕ N = 4 % , the deposits show well-defined coffee rings and prominently structured cross-shaped crystalline formations that cover the entire deposit surface. Notably, the crystalline structure density is more pronounced in the whole milk deposits compared to the lactose-free samples.

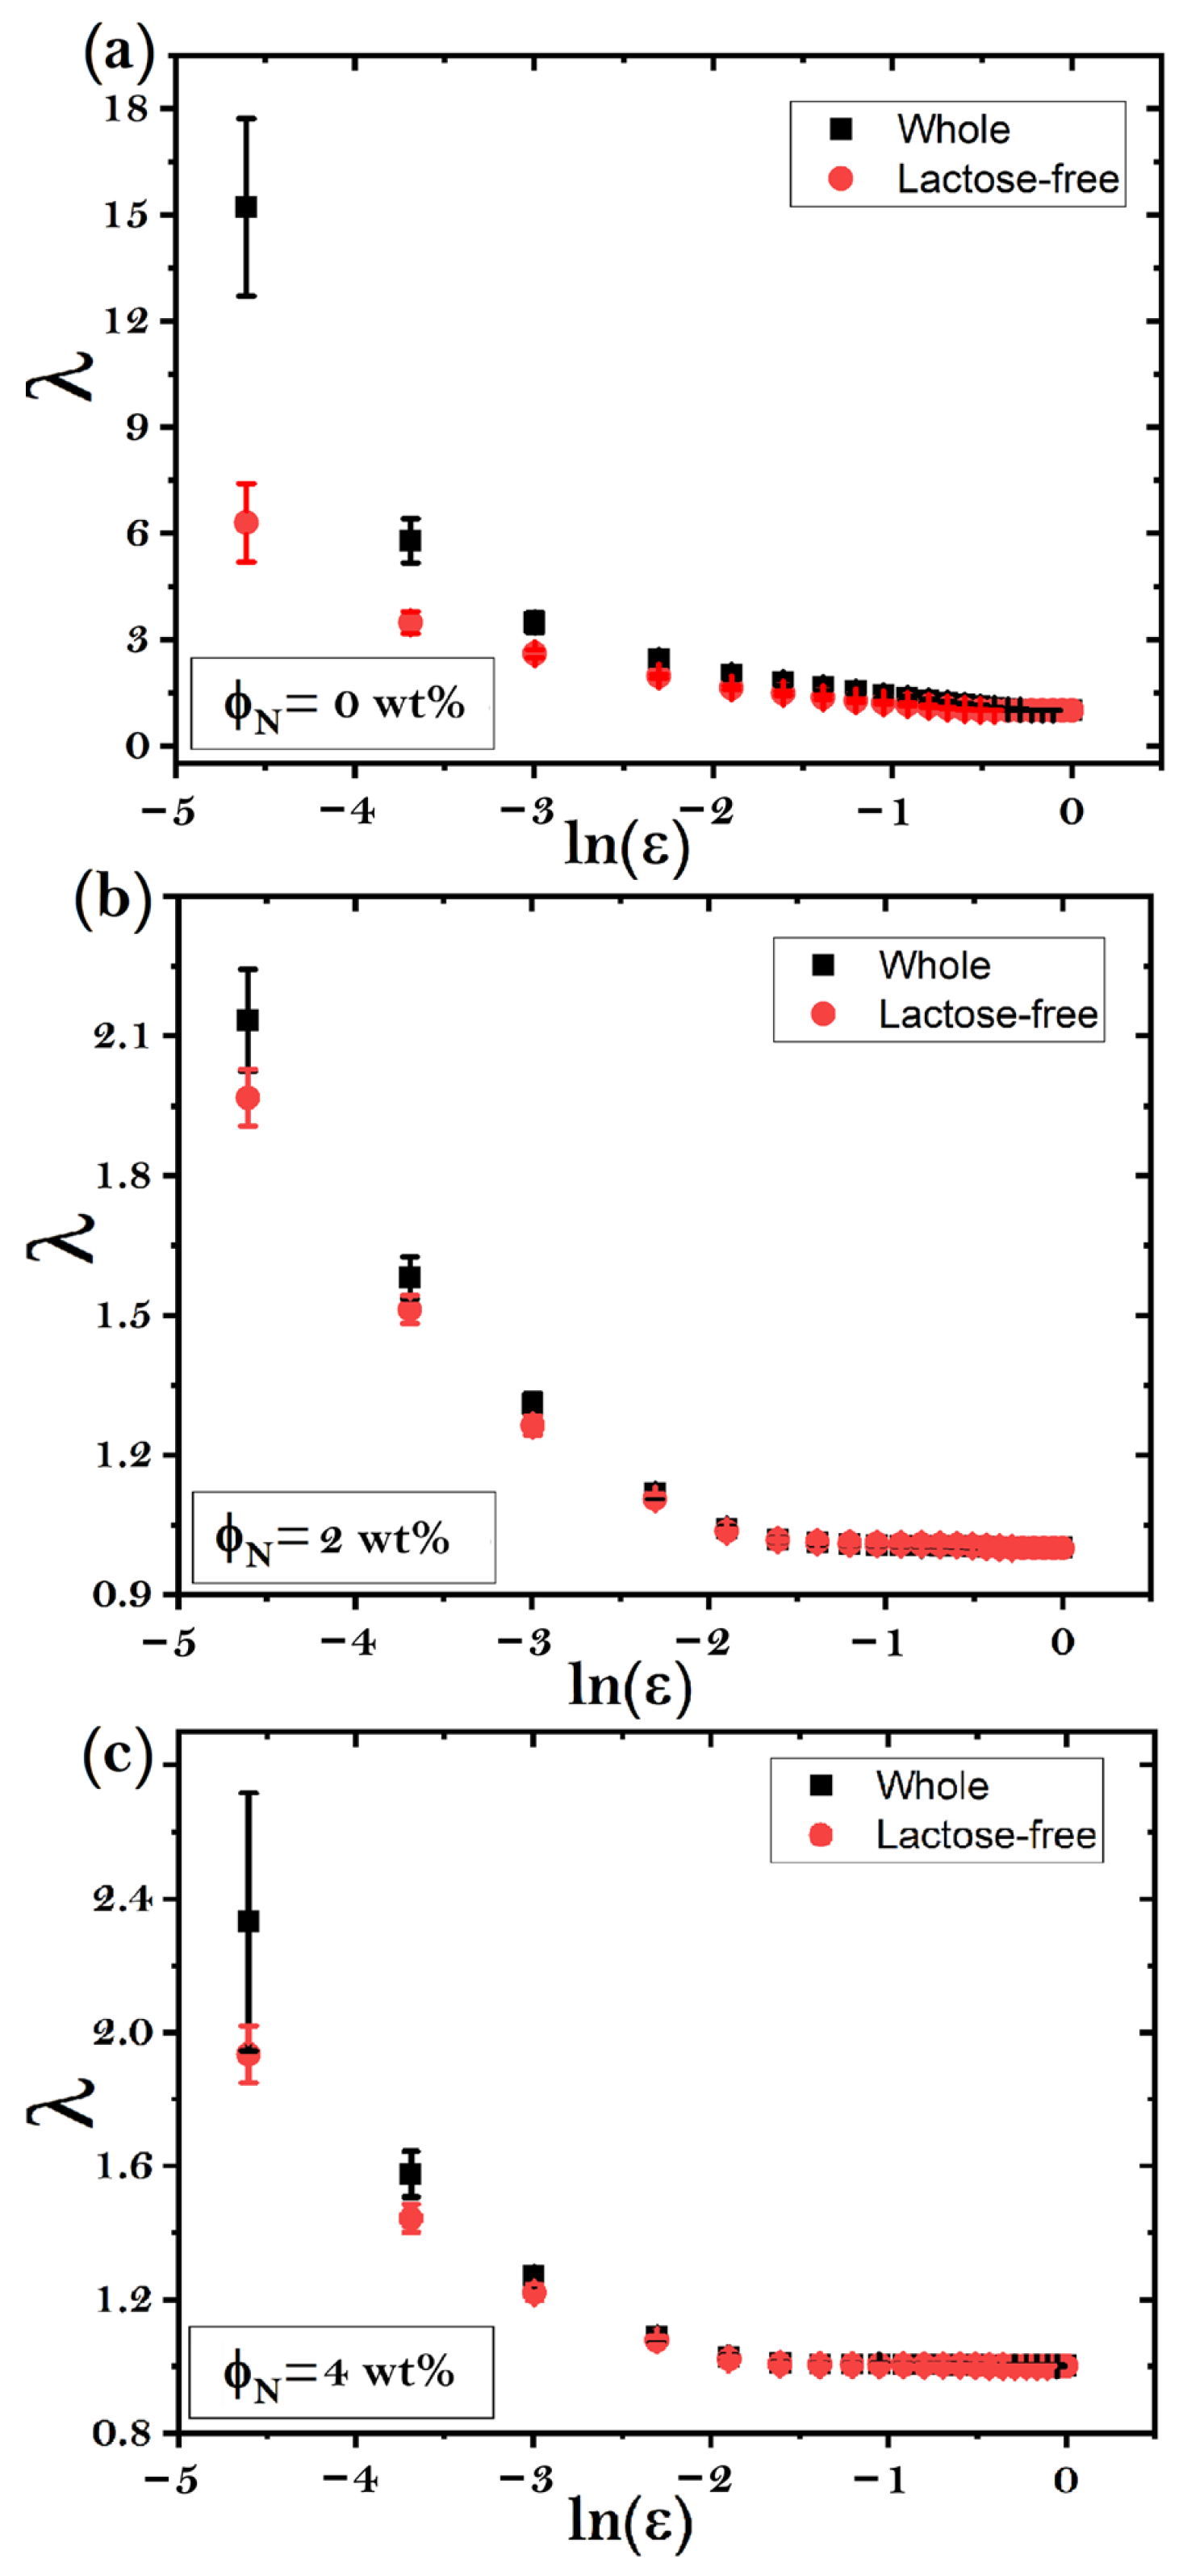
3.2. Discrimination Between Milk Types Using Lacunarity Analysis

Figure 3 presents the decrease in lacunarity ( λ ) as a function of the natural logarithm of the normalized box size ( ln ( ϵ ) ) for dried drops of whole and lactose-free milk with varying NaCl concentrations. In Figure 3a, lactose-free milk deposits without NaCl show a maximum lacunarity value of λ m a x = 6.29 at ln ( ϵ ) = 4.60 , whereas whole milk without NaCl reaches a considerably higher maximum lacunarity of λ m a x = 15.21 at the same ln ( ϵ ) . No significant differences in λ are observed between the two milk types as the box size decreases. In Figure 3b, at a NaCl concentration of ϕ N = 2 wt%, lactose-free milk deposits exhibit a maximum lacunarity value of λ m a x = 1.97 at ln ( ϵ ) = 4.60 , while whole milk deposits reach a slightly higher maximum of λ m a x = 2.13 at the same value of ln ( ϵ ) . The overall trend remains consistent with no substantial variations between the two milk types. Figure 3c, for NaCl concentrations of ϕ N = 4 wt%, shows significant differences between the two types of milk. Lactose-free milk deposits reach a maximum lacunarity of λ m a x = 1.93 at ln ( ϵ ) = 4.60 , while whole milk deposits achieve a higher maximum value of λ m a x = 2.33 at the same point.
We determined the optimal box sizes for the lacunarity analysis by calculating the relative differences | λ D λ E | / λ E , where λ D and λ E represent the mean lacunarity values for whole milk and lactose-free milk, respectively. As shown in Figure 4a, the smallest box sizes display the most significant differences between the lacunarity values, with ln ( ϵ ) = 4.6 ( l = 2 pixels, ϵ = 0.01 ), corresponding to the largest observed discrepancy. Based on these findings, we utilized the aforementioned lacunarity values to perform discriminant analysis using Receiver Operating Characteristic (ROC) curves. Panel I in Figure 4b demonstrates the typical behavior of excellent performance between Sensitivity and 1-Specificity for deposits at ϕ N = 0 wt%. Panels II and III in Figure 4b show that the ROC curve’s shape for ϕ N = 2 wt% and 4 wt% indicates very good differentiation between elements of the two groups, respectively.
The area under the ROC curve (AUC) quantifies a classification method’s efficiency in distinguishing between two groups. Specifically, the ROC curve represents the probability of correctly classifying a given deposit. In this study, the AUC was employed to assess the accuracy of the classification between whole milk and lactose-free milk deposits. Figure 5 presents the accuracy of the lacunarity analysis applied to dry milk drops with varying NaCl concentrations. The highest classification performance was observed at ϕ N = 0 wt%, where the accuracy reached 1.0, while the values decreased to 0.92 and 0.91 at ϕ N = 2 wt% and ϕ N = 4 wt%, respectively.

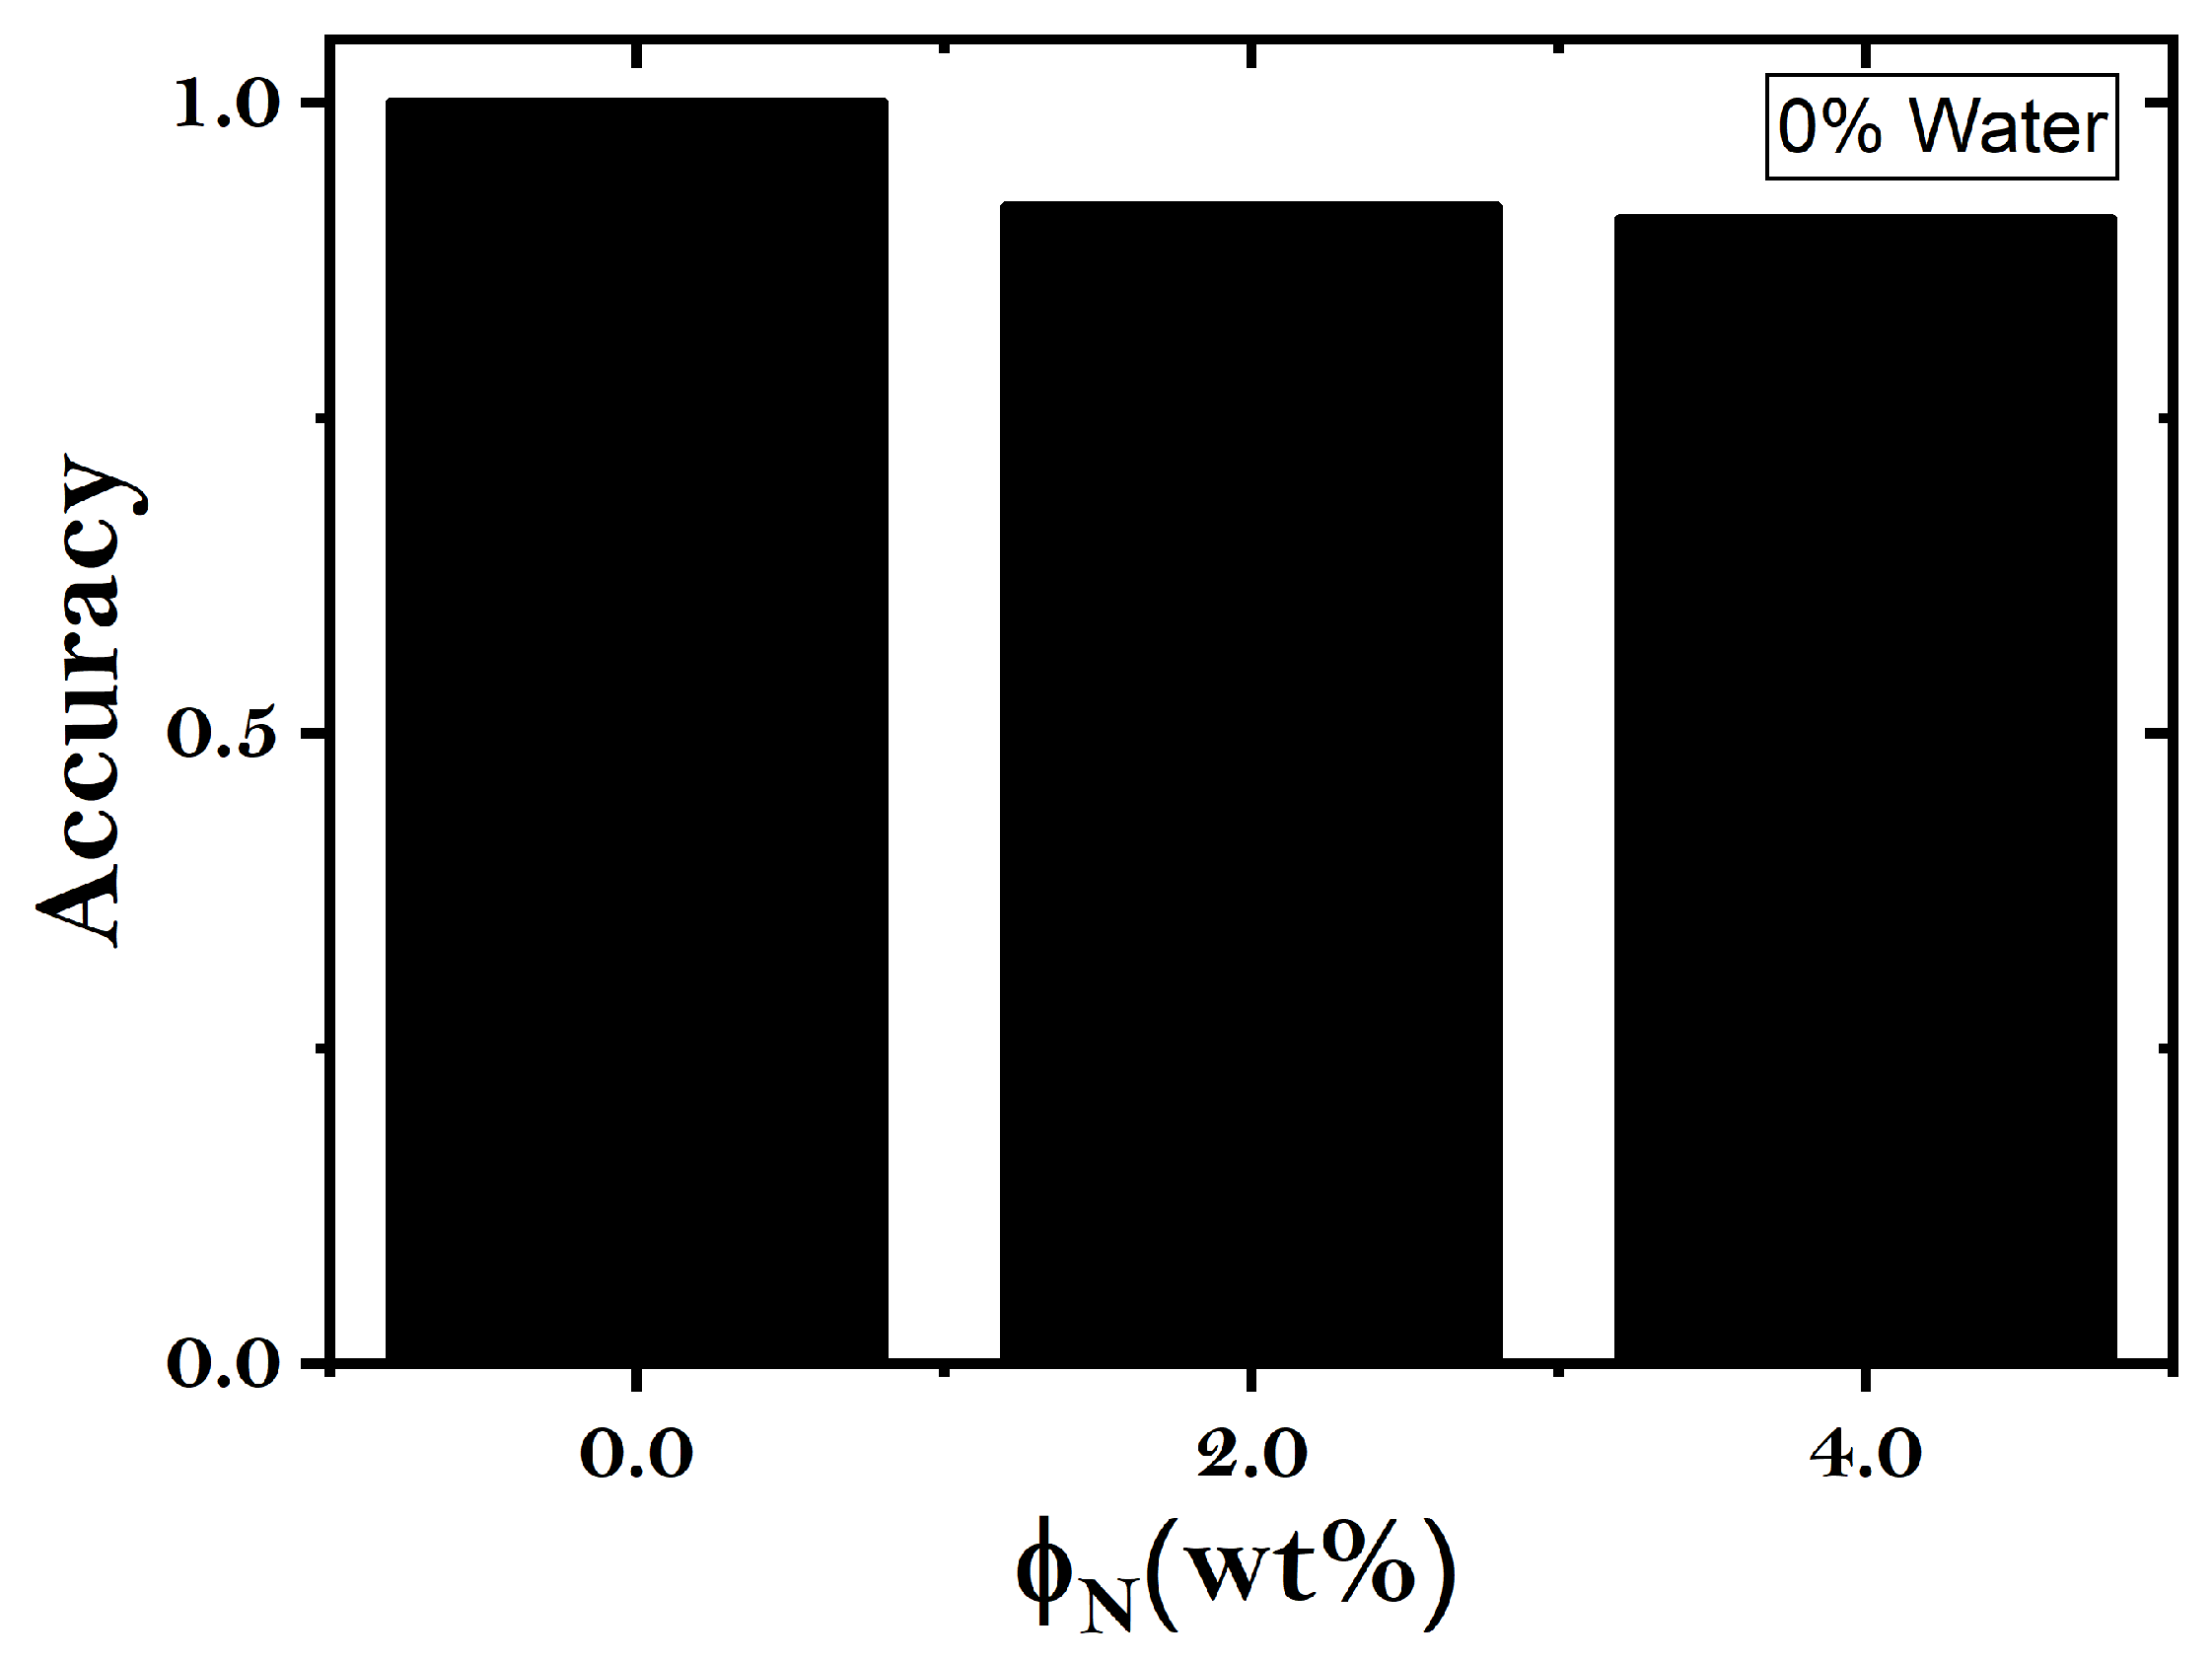
3.3. Deep Learning-Based Differentiation Between Milk Types

Figure 6 presents the classification accuracy obtained using a convolutional neural network (CNN) model, complementing the lacunarity-based analysis shown in Figure 5. The CNN model follows a different approach, leveraging hierarchical feature extraction rather than direct structural characterization. Despite these methodological differences, the results exhibit a similar trend: the highest classification performance is achieved at ϕ N = 0 wt%, reaching an accuracy of 1.0, while at ϕ N = 2 wt% and ϕ N = 4 wt%, the accuracy decreases to 0.9 and 0.89, respectively. This consistency between both methods suggests that the structural variations induced by NaCl concentrations are inherently discernible, regardless of the analytical approach employed. Notably, the CNN model demonstrates a slight decrease in stability across different NaCl concentrations compared to the lacunarity-based method.

3.4. Pattern in Dried Droplets of Milk with NaCl and Added Water

An interesting question pertains to the method’s effectiveness in detecting additional water content in milk. Figure 7 illustrates the milk deposits generated with varying levels of additional water content and different NaCl concentrations. In Figure 7a, distinct deposits corresponding to whole milk and lactose-free milk without NaCl are evident, featuring varying concentrations of additional water. Both milk types display a coffee ring pattern. The deposits associated with whole milk demonstrate a consistent, uniform deposition. However, for whole milk deposits from 40% of additional water, some minor aggregates emerge. Conversely, deposits linked to lactose-free milk exhibit a uniform deposition regardless of the added water concentration. Notably, the coffee ring’s clarity is enhanced as the volume of additional water increases.
In Figure 7b, the depicted deposits correspond to whole milk and lactose-free milk with ϕ N = 2 wt%, featuring varying concentrations of additional water. Regardless of milk type or added water content, all deposits exhibit a distinct coffee ring. Deposits of both whole milk and lactose-free milk, lacking extra water content, display amorphous crystalline structures in the central region. Additionally, deposits of lactose-free milk showcase homogeneity between the coffee ring and crystalline structures. The addition of 20% water content in deposits of whole milk results in randomly distributed protrusions. Conversely, lactose-free milk deposits reveal branched dendritic crystal structures. At a 40% increase in water concentration, deposits of whole milk reveal scattered small aggregates, whereas lactose-free milk deposits display high-density aggregates centrally, decreasing towards the coffee ring. At a 60% increase in water, for both milk types, a palm leaf-like crystalline pattern emerges at the center. This structure features four well-defined axes stemming from a central point, capable of extending across the deposit, with perpendicular ramifications originating from these axes. This crystalline pattern is enveloped by a homogeneous region. Notably, lactose-free milk deposits showcase a well-defined coffee ring and an increased count of internal crystalline structures. At 80% additional water content, both milk deposits display an entire covering of a palm leaf-like crystalline pattern.
In Figure 7c, we observe the depositions of whole milk and lactose-free milk with ϕ N = 4 wt%, at varying concentrations of added water. Notably, regardless of the milk type, the most substantial structural distinction occurs between deposits without added water and those with additional water content. Deposits containing 0% added water display an indistinct coffee ring and diverse cross-shaped aggregates dispersed throughout. It is worth highlighting that deposits associated with whole milk exhibit a higher density of crystalline structures. Conversely, deposits containing 20% and 40% added water exhibit a leaf-like crystalline arrangement. Furthermore, deposits with 60% and 80% additional water content, irrespective of milk type, reveal a well-defined coffee ring and a symmetrical leaf-like crystalline pattern. Notably, the main axes of these structures can span the width of the deposit. It’s noteworthy that the width of the axes is slightly greater for a content of 80% water.
Figure 8 demonstrates the reproducibility of the drying patterns observed in Figure 7, confirming the consistency of the deposition structures across multiple trials for different water contents and NaCl concentrations in both whole and lactose-free milk.

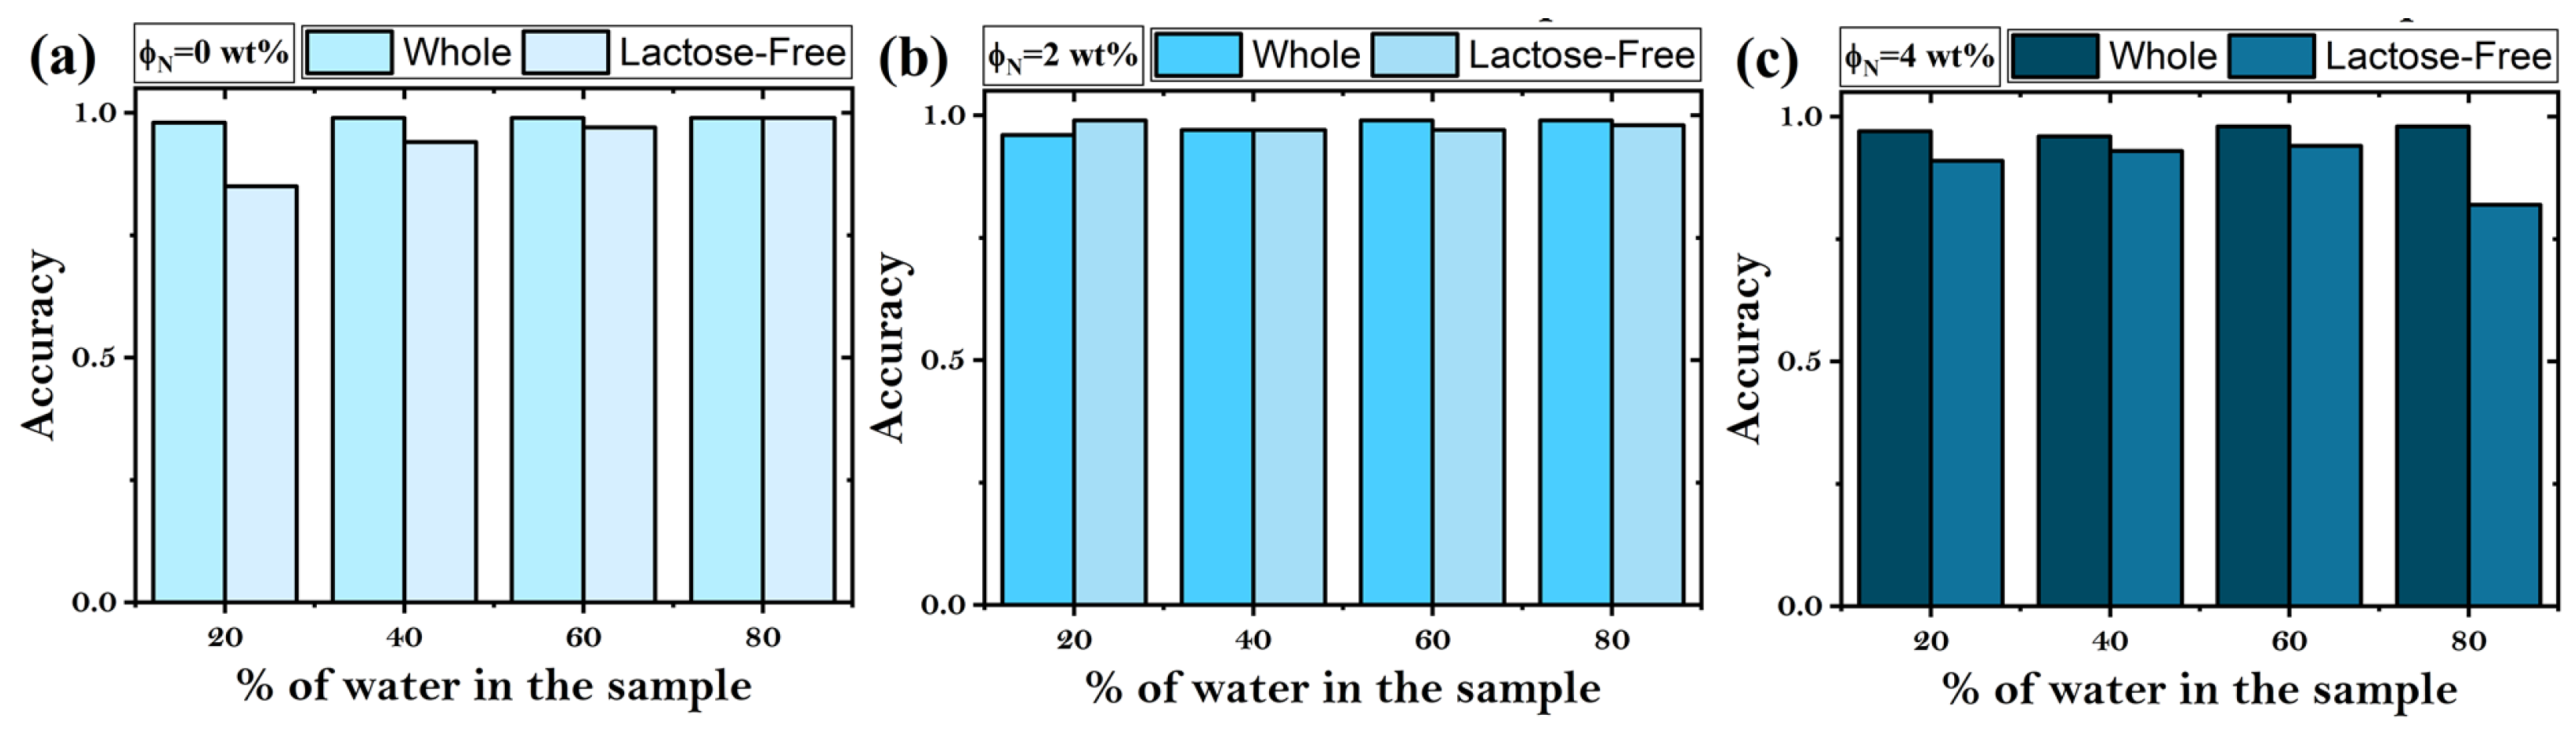
3.5. Detection of Water Adulteration Using Lacunarity Analysis

Regardless of the concentrations of added water and NaCl, the lacunarity demonstrates a consistent decreasing trend concerning the normalized box size ln ( ϵ ) for dried drop patterns, see Figure 9. Furthermore, through a comparison of the maximum lacunarity values at low ln ( ϵ ) of the curves for each NaCl concentration, we observed that the lacunarity decreases with increasing NaCl concentration, irrespective of the milk type. We utilize the estimated lacunarity values at ln ( ϵ ) = 4.6 ( l = 2 pixels) to conduct discriminant analysis based on ROC curves, enabling differentiation between milk and milk with water content. Notably, for deposits with ϕ = 0 wt%, the effectiveness exceeds 0.98 in detecting 20% added water in whole milk but declines to above 0.75 when detecting 20% added water in lactose-free milk, see Figure 10a. Comparatively, deposits with ϕ = 2 wt% exhibit effectiveness values above 0.99, irrespective of milk type and added water concentration (Figure 10b). In contrast, deposits with ϕ = 4 wt% and 20% added water demonstrate effectiveness values lower than 0.85, but increase to above 0.97 for milk containing 60% and 80% added water, see Figure 10c.

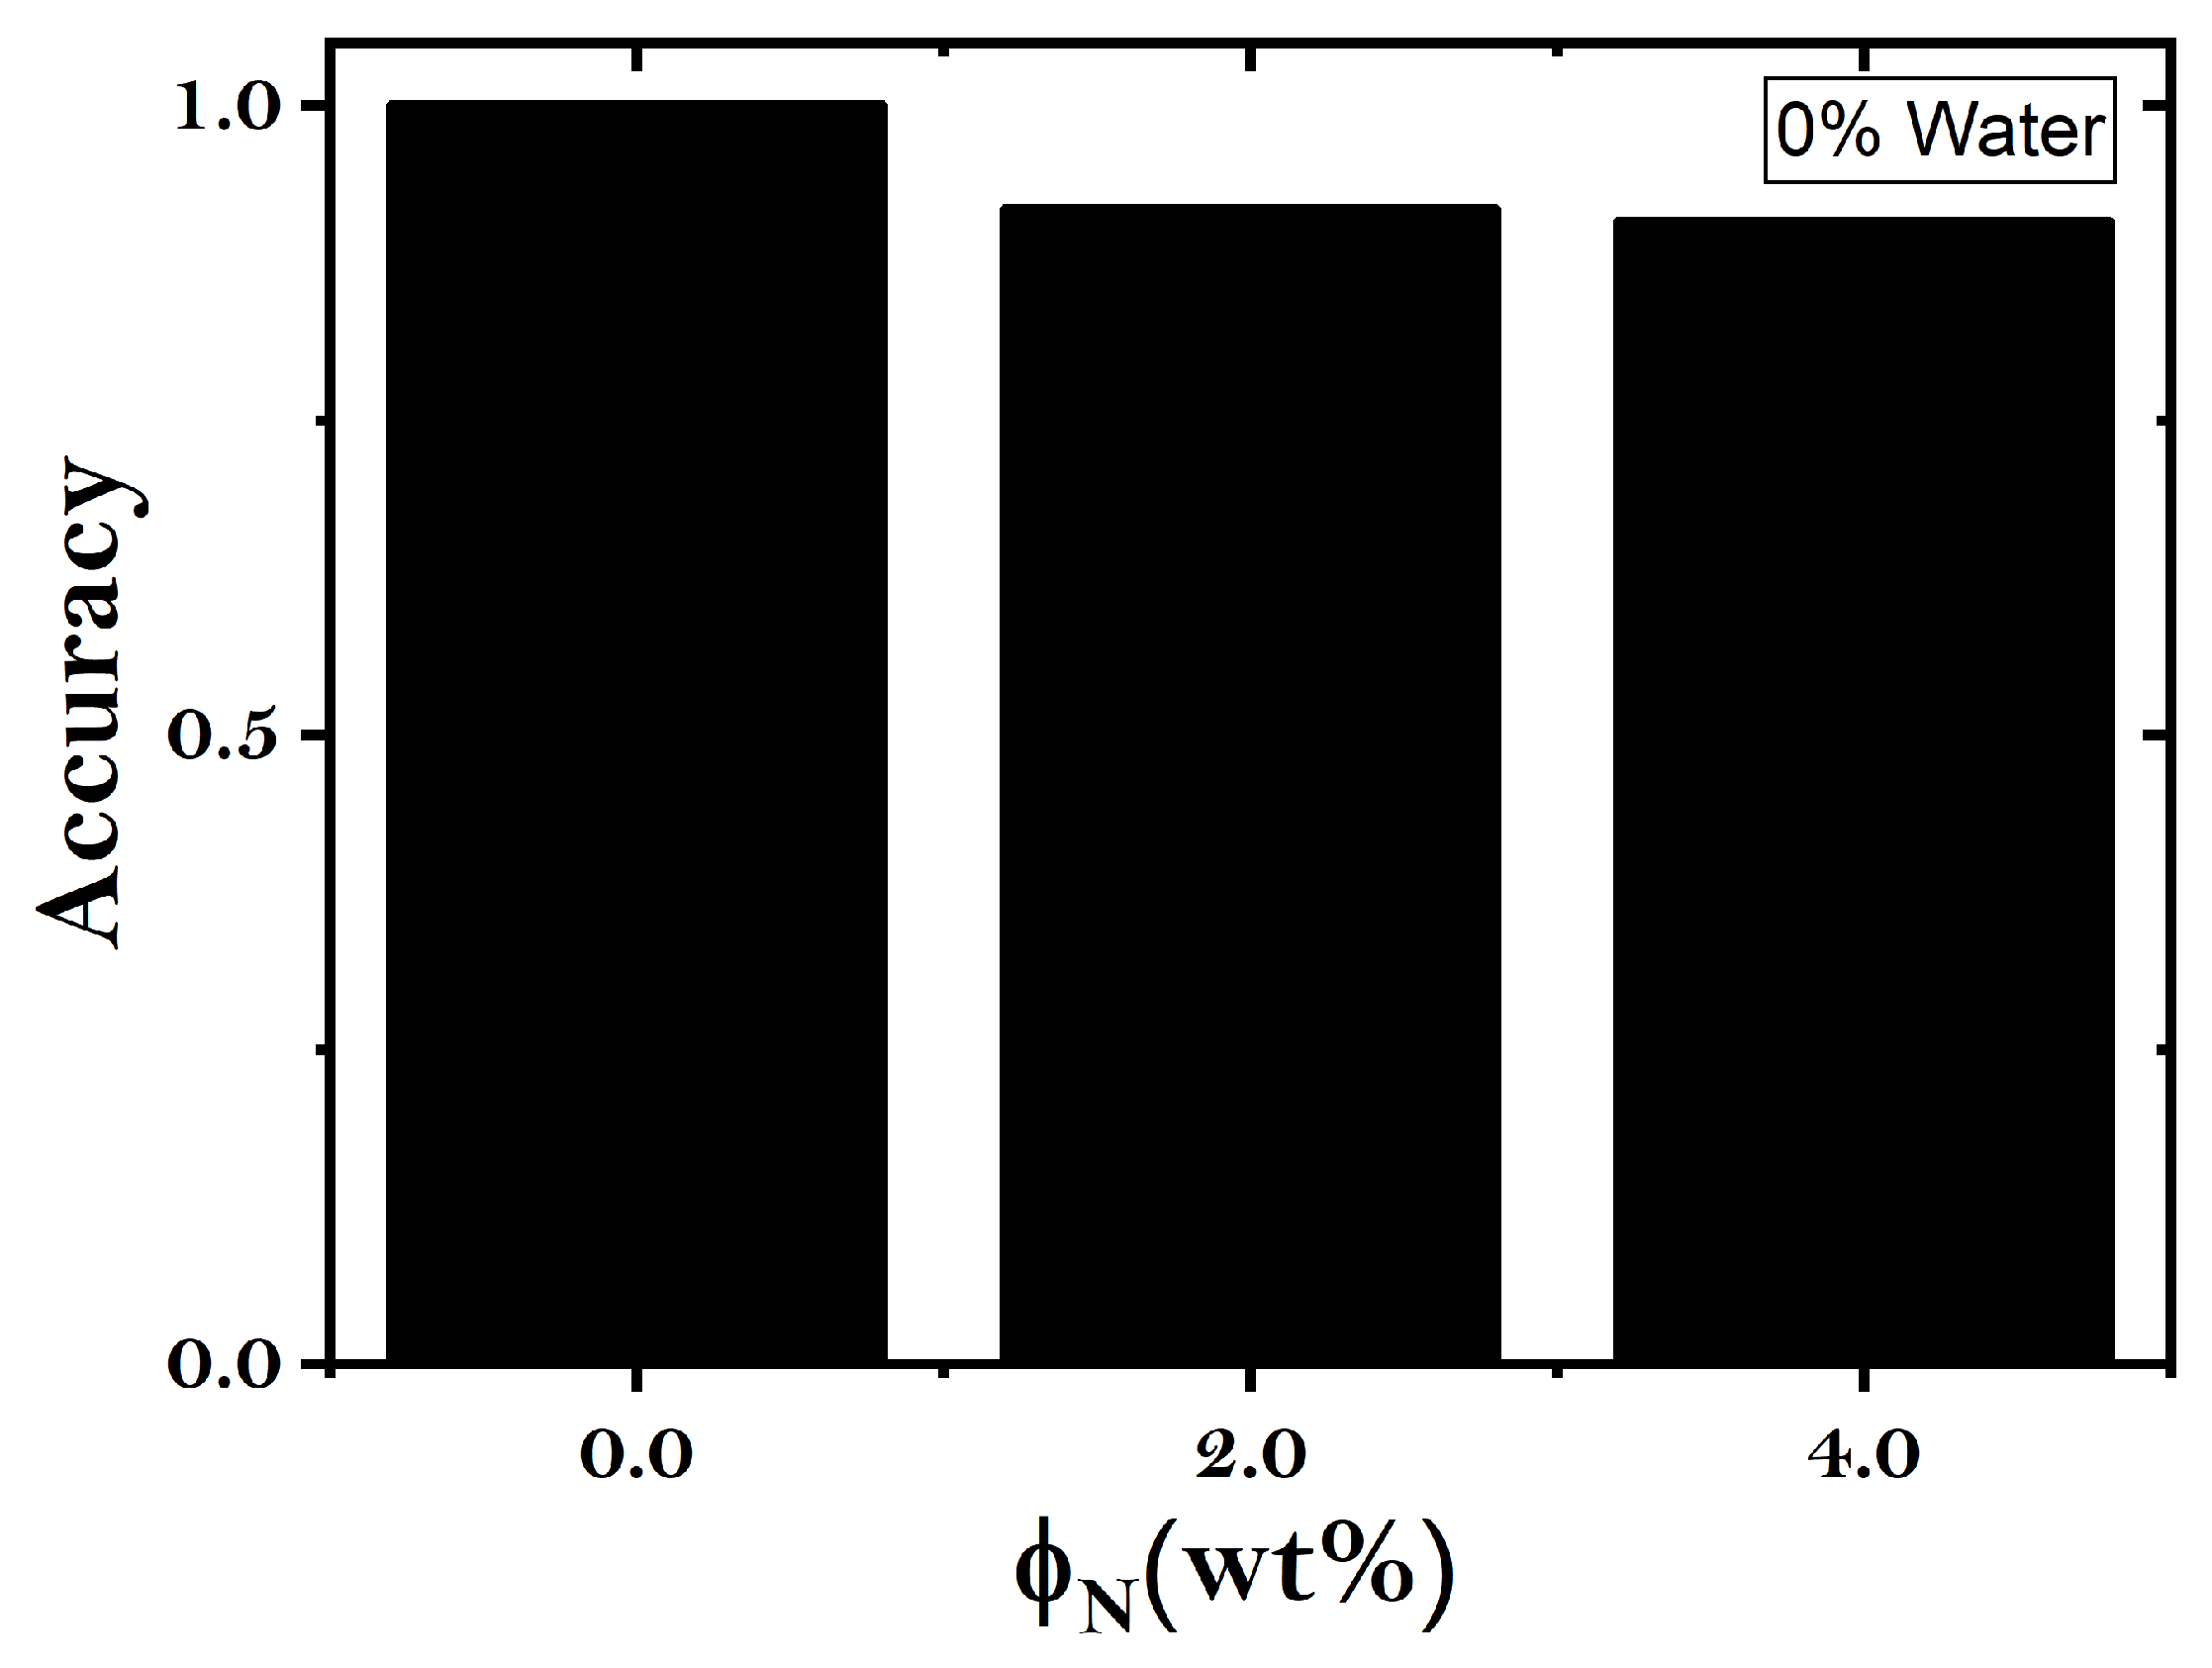
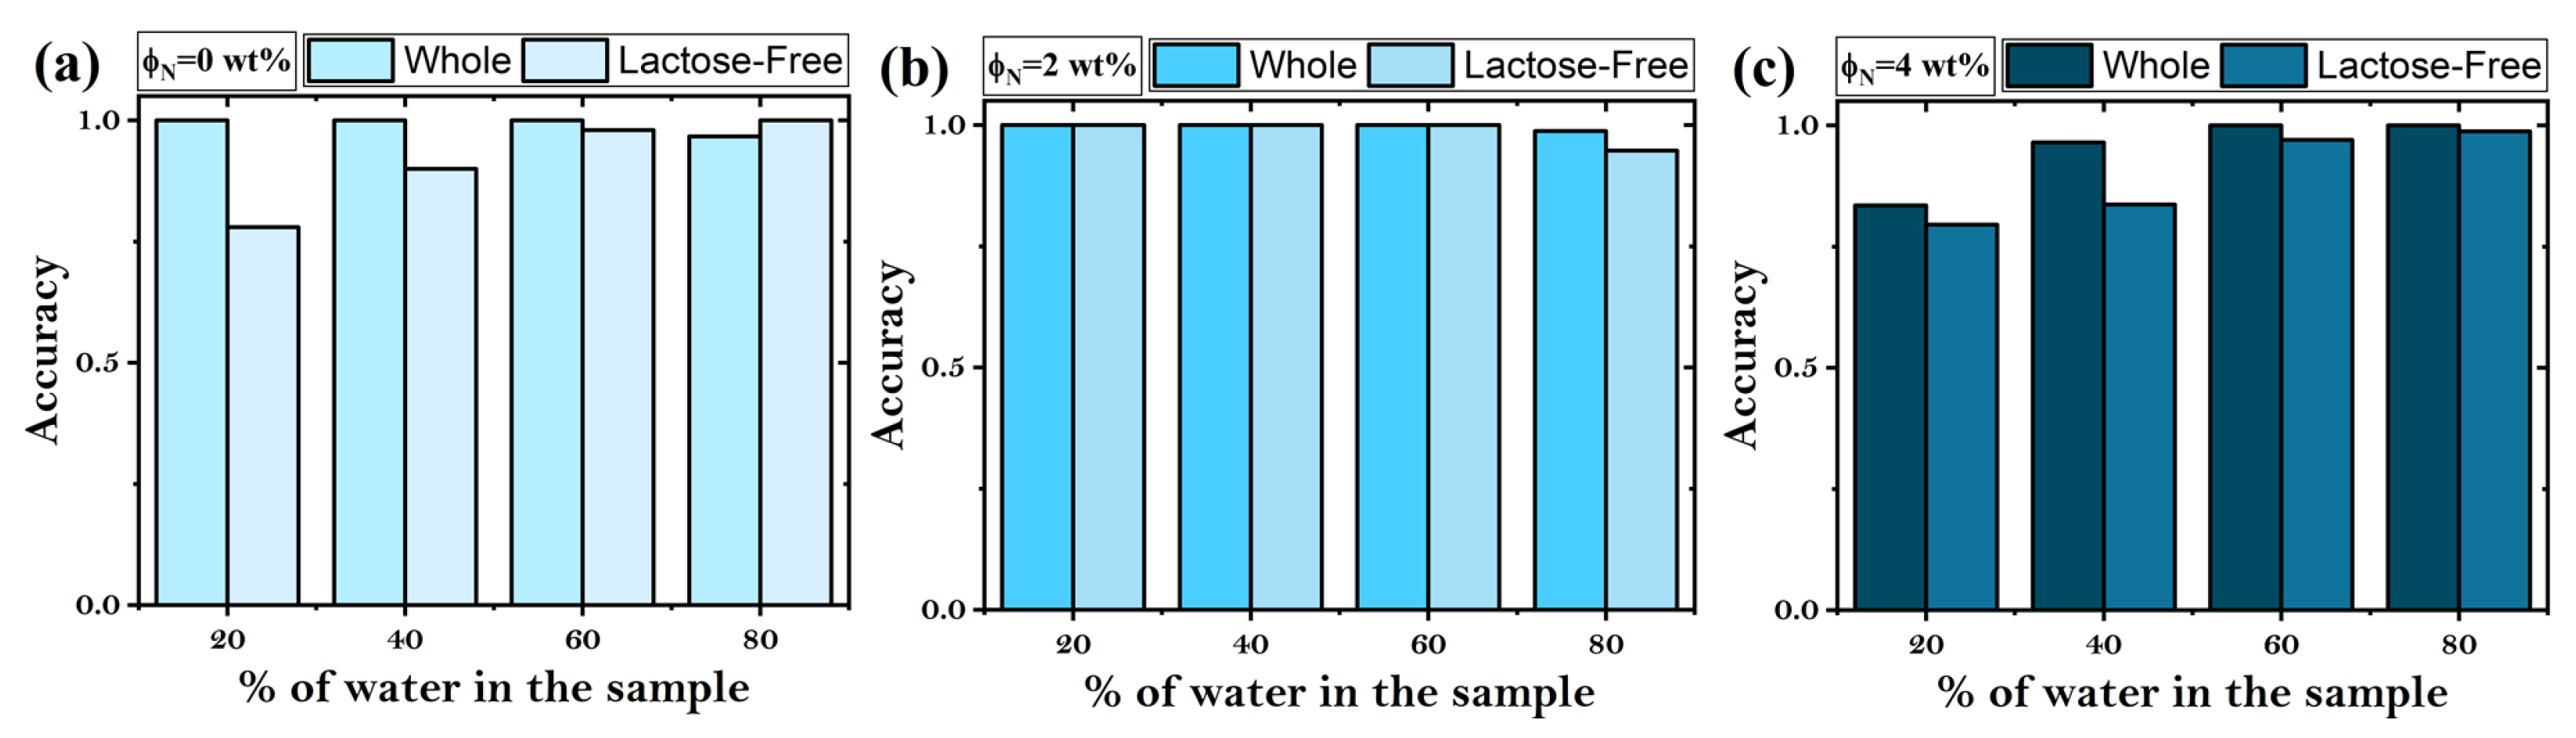
3.6. Deep Learning-Based Detection of Water Adulteration in Milk

Figure 11 presents the efficiency levels achieved in detecting different water concentrations (20%, 40%, 60%, and 80%) in whole and lactose-free milk samples under three NaCl conditions (0, 2, and 4 wt%). In general, droplet pattern analysis using the deep learning-based model proves to be an effective tool for detecting milk adulteration. Although a slight decrease in efficiency is observed in certain specific cases compared to Figure 9, the deep learning-based model maintains precision values above 90% in most of the evaluated scenarios, exhibiting a more homogeneous and consistent performance across different NaCl concentrations and water content. This suggests that the method not only optimizes water detection in milk but also improves accuracy across a broader range of experimental conditions. Specifically, with 4% NaCl, the efficiency in detecting 20% added water in lactose-free milk increases from 0.78 (lacunarity) to 0.99 (machine learning), while for 40% water, it improves from 0.83 to 0.96. The observed differences indicate that machine learning enables more precise classification in scenarios where lacunarity shows lower sensitivity. However, for higher water concentrations (60% and 80%), both approaches maintain high performance.

4. Discussion

Our work investigated the role of NaCl in the structural differentiation of dried milk droplets, focusing on the classification of whole and lactose-free milk and the detection of water adulteration. The findings demonstrated that NaCl modulates the crystallization process, inducing morphological changes such as amorphous, cross-shaped, and dendritic structures. The different variations were quantified using lacunarity and further analyzed using a convolutional neural network (CNN)-based model to assess their discriminatory power. The classification performance of both approaches, based on confusion matrix evaluations, was assessed through ROC curve analysis for the lacunarity-based method and precision for the CNN model, establishing a robust framework to compare the effectiveness between lacunarity and deep learning in milk differentiation.
A key observation was that lacunarity-based classification achieved high accuracy ( 95.04 % ± 6.66 % ), with deep learning providing a slight improvement ( 95.22 % ± 4.47 % ). The highest accuracy was obtained at 2 % NaCl, where lacunarity reached 97.08 % ± 2.27 % and deep learning 96.88 % ± 2.8 % . The results suggest that NaCl enhances structural differentiation primarily in adulterated milk deposits. Furthermore, the consistency between both approaches demonstrates that the structural variations induced by NaCl are inherently discernible and confirm the reliability of lacunarity analysis as a classification tool.
Notably, the lowest classification performance for both methods was observed in the detection of 20% added water in whole milk and lactose-free milk without NaCl. This outcome can be attributed to the uniformity of the resulting deposits, which significantly impairs the differentiation between sample groups. In the absence of NaCl, the drying dynamics of milk are governed by capillary-driven flow and Marangoni recirculation; however, the complex interplay between proteins, lipids, and residual salts leads to heterogeneous deposition patterns, which arise from phase separation, protein aggregation, and structural rearrangements during solvent evaporation. The final effect of such interplay is the introduction of spatial variability in the final dried deposit.
As far as the NaCl addition is concerned, it induces localized crystallization and anisotropic structural variations that enhance pattern differentiation. The resulting heterogeneous morphologies exhibit increased textural contrast and regional inhomogeneities, thereby amplifying the discriminatory power of both analytical techniques. The reduced classification sensitivity in water detection for salt-free samples suggests that the method’s effectiveness relies on the presence of structural discontinuities or solute-driven phase separation events, which are absent in uniformly deposited films. Therefore, the results show that the morphology of the deposit plays a key role in classification accuracy; when the deposits are too uniform, both methods struggle to differentiate between samples, which reinforces the idea that structural variations are essential for effective pattern recognition.
For higher NaCl concentrations, the deep learning-based model maintained precision values above 90% in most evaluated scenarios and exhibited a more homogeneous and consistent performance across varying salt concentrations and water content. These results confirm that deep learning effectively stabilizes classification performance under conditions of increased structural complexity caused by salt crystallization. The ability of CNN models to capture hierarchical spatial correlations strengthens their robustness in these conditions and establishes them as a suitable complement to lacunarity-based classification.
Methodologically, the study demonstrates that smaller box sizes ( ϵ = 0.01, 0.025, and 0.05) improve the sensitivity of lacunarity analysis to structural differences [33]. In parallel, deep learning exhibited greater stability across NaCl concentrations, driven by its ability to detect complex spatial correlations beyond those quantified by lacunarity.
Despite the promising results, certain limitations must be considered. This study focused exclusively on two types of milk (whole and lactose-free), both from a single supplier and production batch, which may limit the applicability of the findings to other dairy products, such as powdered milk or processed derivatives. Only two fixed NaCl concentrations (2% and 4%) were evaluated, which restricts our ability to explore the full response landscape. While NaCl enhanced structural differentiation in adulterated samples, the highest classification accuracy for milk type differentiation was observed in the absence of added salt. This result indicates that the effect of NaCl depends on the classification task, and a universal concentration to optimize performance is unlikely. Furthermore, our research did not evaluate other additives, contaminants, or broader adulteration levels. Future research should address these aspects.
Additionally, future studies could explore the drying process under controlled environmental conditions, such as varying humidity and temperature, to assess their role in deposit formation and classification accuracy. From a computational perspective, refining deep learning architectures to incorporate multimodal data, such as texture features from lacunarity analysis combined with spectral or morphological descriptors, could improve classification robustness. Expanding the dataset with larger sample variations and real-world adulteration scenarios would further validate the generalizability of the proposed methodologies. Finally, translating these findings into practical applications, such as rapid screening techniques for quality control in dairy products, represents an important step toward bridging fundamental research with industrial application.

5. Conclusions

We demonstrated that the addition of NaCl plays a key role in enhancing the structural differentiation of dried milk droplets, in adulterated samples, facilitating their classification. The analysis of dried droplets containing NaCl concentrations of 0 wt%, 2 wt%, and 4 wt% revealed that NaCl modulates the crystallization process and produces distinct morphologies, such as amorphous, cross-shaped, and dendritic structures. These morphologies were quantitatively characterized using lacunarity analysis.
The results confirmed that lacunarity alone achieved a high classification accuracy ( 95.04 % ± 6.66 % ), while integrating deep learning further improved performance ( 95.22 % ± 4.47 % ). Notably, the highest accuracy was obtained with 2 % NaCl, where lacunarity reached 97.08 % ± 2.27 % and deep learning 96.88 % ± 2.8 % , indicating enhanced precision and stability. These findings highlight the effectiveness of lacunarity analysis, combined with ROC curve evaluation and precision-based assessment of deep learning, in distinguishing milk types and detecting water adulteration.
Beyond its classification capabilities, our study underscores the importance of selecting appropriate box sizes for lacunarity estimation to optimize differentiation. Additionally, the potential of this method extends to quality control in the dairy industry, offering a robust and interpretable approach for ensuring product authenticity.
Overall, this work provides new insights into the structural analysis of dried milk droplets and establishes NaCl-enhanced lacunarity analysis as a valuable tool for milk classification. Future research should explore its applicability to other milk types and processing conditions, further refining its potential for industrial implementation.

Supplementary Materials

The following supporting information can be downloaded at: https://www.mdpi.com/article/10.3390/app15105676/s1, Figure S1: Confusion matrices obtained from the deep learning model for differentiating whole and lactose-free milk; Figure S2: Training history curves (accuracy and loss) for the classification between whole and lactose-free milk; Figure S3: Confusion matrices obtained from the classification of adulterated whole milk (0 wt% NaCl); Figure S4: Confusion matrices obtained from the classification of adulterated whole milk (2 wt% NaCl); Figure S5: Confusion matrices obtained from the classification of adulterated whole milk (4 wt% NaCl); Figure S6: Training history curves (accuracy and loss) for the classification of adulterated whole milk (0 wt% NaCl); Figure S7: Training history curves (accuracy and loss) for the classification of adulterated whole milk (2 wt% NaCl); Figure S8: Training history curves (accuracy and loss) for the classification of adulterated whole milk (4 wt% NaCl); Figure S9: Confusion matrices obtained from the classification of adulterated lactose-free milk (0 wt% NaCl); Figure S10: Confusion matrices obtained from the classification of adulterated lactose-free milk (2 wt% NaCl); Figure S11: Confusion matrices obtained from the classification of adulterated lactose-free milk (4 wt% NaCl); Figure S12: Training history curves (accuracy and loss) for the classification of adulterated lactose-free milk (0 wt% NaCl); Figure S13: Training history curves (accuracy and loss) for the classification of adulterated lactose-free milk (2 wt% NaCl); Figure S14: Training history curves (accuracy and loss) for the classification of adulterated lactose-free milk (4 wt% NaCl); Table S1: Classification metrics (precision, recall, and F1-score) for the differentiation between whole and lactose-free milk; Table S2: Classification metrics (precision, recall, and F1-score) for the detection of water adulteration in whole milk; Table S3: Classification metrics (precision, recall, and F1-score) for the detection of water adulteration in lactose-free milk.

Author Contributions

J.N.M.-C.: Investigation, Methodology, Validation, Formal analysis. Y.J.A.M.: Investigation, Methodology, Validation. L.E.-Z.: Methodology, Writing—Review and Editing, Visualization. M.C.: Resources, Funding Acquisition, Formal analysis, Writing—Review and Editing. Y.J.P.C.: Conceptualization, Resources, Writing—Review and Editing, Visualization. J.G.-G.: Conceptualización, Resources, Supervision, Formal analysis, Project administration, Writing—Original Draft, Writing—Review and Editing. All authors have read and agreed to the published version of the manuscript.

Funding

This research was funded by the Secretaría de Ciencia, Humanidades, Tecnología e Innovación (SECIHTI), grant number CF-2023-G-454. The APC was funded by the same grant.

Institutional Review Board Statement

Not applicable.

Informed Consent Statement

Not applicable.

Data Availability Statement

The original contributions presented in the study are included in the article, further inquiries can be directed to the corresponding author.

Acknowledgments

Y.J.P.C. wishes to acknowledge financial support by the SECIHTI Postdoctoral fellowship. J.N.M.C. wish to acknowledge financial fellowship by the SECIHTI.

Conflicts of Interest

The authors declare no conflicts of interest. The funders had no role in the design of the study; in the collection, analyses, or interpretation of data; in the writing of the manuscript; or in the decision to publish the results.

References

  1. Azad, T.; Ahmed, S. Common milk adulteration and their detection techniques. Int. J. Food Contam. 2016, 3, 1–9. [Google Scholar] [CrossRef]
  2. Qian, G.; Guo, X.; Guo, J.; Wu, J. China’s dairy crisis: Impacts, causes and policy implications for a sustainable dairy industry. Int. J. Sustain. Dev. World Ecol. 2011, 18, 434–441. [Google Scholar] [CrossRef]
  3. Banach, J.K.; Żywica, R.; Szpendowski, J.; Kiełczewska, K. Possibilities of using electrical parameters of milk for assessing its adulteration with water. Int. J. Food Prop. 2012, 15, 274–280. [Google Scholar] [CrossRef]
  4. Schumacher, O.; Ates, C.; Börnhorst, M.; Koch, R.; Stephan, P. Deposit formation from evaporating urea-water droplets on substrates of different wettability. J. Colloid Interface Sci. 2023, 634, 1–13. [Google Scholar] [CrossRef]
  5. Weon, B.M.; Je, J.H. Fingering inside the coffee ring. Phys. Rev. E 2013, 87, 013003. [Google Scholar] [CrossRef]
  6. Kolegov, K.; Barash, L.Y. Joint effect of advection, diffusion, and capillary attraction on the spatial structure of particle depositions from evaporating droplets. Phys. Rev. E 2019, 100, 033304. [Google Scholar] [CrossRef] [PubMed]
  7. Mampallil, D.; Eral, H.B. A review on suppression and utilization of the coffee-ring effect. Adv. Colloid Interface Sci. 2018, 252, 38–54. [Google Scholar] [CrossRef]
  8. Kim, H.; Boulogne, F.; Um, E.; Jacobi, I.; Button, E.; Stone, H.A. Controlled uniform coating from the interplay of Marangoni flows and surface-adsorbed macromolecules. Phys. Rev. Lett. 2016, 116, 124501. [Google Scholar] [CrossRef]
  9. Carreón, Y.J.; Gómez-López, M.L.; Díaz-Hernández, O.; Vazquez-Vergara, P.; Moctezuma, R.E.; Saniger, J.M.; González-Gutiérrez, J. Patterns in dried droplets to detect unfolded BSA. Sensors 2022, 22, 1156. [Google Scholar] [CrossRef]
  10. Jeihanipour, A.; Lahann, J. Deep-Learning-Assisted Stratification of Amyloid Beta Mutants Using Drying Droplet Patterns. Adv. Mater. 2022, 34, 2110404. [Google Scholar] [CrossRef]
  11. Ancheyta-Palacios, M.; Velasco-Terán, I.G.; Carreón, Y.J.; González-Gutiérrez, J. Dried Droplets of Diluted Blood to Detect a High Concentration of Lipids. Processes 2023, 11, 2047. [Google Scholar] [CrossRef]
  12. Pal, A.; Gope, A.; Sengupta, A. Drying of bio-colloidal sessile droplets: Advances, applications, and perspectives. Adv. Colloid Interface Sci. 2023, 102870. [Google Scholar] [CrossRef]
  13. González-Gutiérrez, J.; Pérez-Isidoro, R.; Ruiz-Suárez, J. A technique based on droplet evaporation to recognize alcoholic drinks. Rev. Sci. Instrum. 2017, 88, 074101. [Google Scholar] [CrossRef]
  14. Beigtan, M.; Hwang, Y.; Weon, B.M. Inhibiting Cracks in Latte Droplets. Langmuir 2023, 39, 5275–5283. [Google Scholar] [CrossRef]
  15. Carreón, Y.J.; Díaz-Hernández, O.; Escalera Santos, G.J.; Cipriano-Urbano, I.; Solorio-Ordaz, F.J.; González-Gutiérrez, J.; Zenit, R. Texture Analysis of Dried Droplets for the Quality Control of Medicines. Sensors 2021, 21, 4048. [Google Scholar] [CrossRef] [PubMed]
  16. Wilkinson, J.; Tam, C.; Askounis, A.; Qi, S. Suppression of the coffee-ring effect by tailoring the viscosity of pharmaceutical sessile drops. Colloids Surf. Physicochem. Eng. Asp. 2021, 614, 126144. [Google Scholar] [CrossRef]
  17. Kumar, V.; Dash, S. Evaporation-based low-cost method for the detection of adulterant in milk. ACS Omega 2021, 6, 27200–27207. [Google Scholar] [CrossRef]
  18. Ishwarya S, P.; Dugyala, V.R.; Pradhan, S.; Basavaraj, M.G. Sessile drop evaporation approach to detect starch adulteration in milk. Food Control 2023, 143, 109272. [Google Scholar] [CrossRef]
  19. Harindran, A.; Hashmi, S.; Madhurima, V. Pattern formation of dried droplets of milk during different processes and classifying them using artificial neural networks. J. Dispers. Sci. Technol. 2022, 43, 1838–1847. [Google Scholar] [CrossRef]
  20. Liang, Y.; Wang, S. Evaporation-Induced Crystal Nucleation and Morphology of Dried Poly (Vinylidene Fluoride) Droplets. Crystals 2021, 11, 1442. [Google Scholar] [CrossRef]
  21. Kuznetsov, G.; Feoktistov, D.; Orlova, E.; Misyura, S.; Morozov, V.; Islamova, A. Evaporation modes of LiBr, CaCl2, LiCl, NaCl aqueous salt solution droplets on aluminum surface. Int. J. Heat Mass Transf. 2018, 126, 161–168. [Google Scholar] [CrossRef]
  22. Soulié, V.; Karpitschka, S.; Lequien, F.; Prené, P.; Zemb, T.; Moehwald, H.; Riegler, H. The evaporation behavior of sessile droplets from aqueous saline solutions. Phys. Chem. Chem. Phys. 2015, 17, 22296–22303. [Google Scholar] [CrossRef]
  23. Perrin, L.; Akanno, A.; Guzman, E.; Ortega, F.; Rubio, R.G. Pattern formation upon evaporation of sessile droplets of polyelectrolyte/surfactant mixtures on silicon wafers. Int. J. Mol. Sci. 2021, 22, 7953. [Google Scholar] [CrossRef] [PubMed]
  24. Linnow, K.; Steiger, M.; Lemster, C.; De Clercq, H.; Jovanović, M. In situ Raman observation of the crystallization in NaNO 3–Na 2 SO 4–H 2 O solution droplets. Environ. Earth Sci. 2013, 69, 1609–1620. [Google Scholar] [CrossRef]
  25. Shahidzadeh, N.; Schut, M.F.; Desarnaud, J.; Prat, M.; Bonn, D. Salt stains from evaporating droplets. Sci. Rep. 2015, 5, 10335. [Google Scholar] [CrossRef] [PubMed]
  26. Qazi, M.; Salim, H.; Doorman, C.; Jambon-Puillet, E.; Shahidzadeh, N. Salt creeping as a self-amplifying crystallization process. Sci. Adv. 2019, 5, eaax1853. [Google Scholar] [CrossRef]
  27. Misyura, S. The crystallization behavior of the aqueous solution of CaCl2 salt in a drop and a layer. Sci. Rep. 2020, 10, 256. [Google Scholar] [CrossRef]
  28. Mandelbrot, B.B.; Mandelbrot, B.B. The Fractal Geometry of Nature; WH Freeman: New York, NY, USA, 1982; Volume 1. [Google Scholar]
  29. Plotnick, R.E.; Gardner, R.H.; Hargrove, W.W.; Prestegaard, K.; Perlmutter, M. Lacunarity analysis: A general technique for the analysis of spatial patterns. Phys. Rev. E 1996, 53, 5461. [Google Scholar] [CrossRef]
  30. Guidolin, D.; Nico, B.; Mazzocchi, G.; Vacca, A.; Nussdorfer, G.; Ribatti, D. Order and disorder in the vascular network. Leukemia 2004, 18, 1745–1750. [Google Scholar] [CrossRef]
  31. Won, S.Y.; Lee, J.H.; Lee, N.; Park, Y.W.; Ahn, S.S.; Kim, J.; Chang, J.H.; Kim, S.H.; Lee, S.K. Three-dimensional fractal dimension and lacunarity features may noninvasively predict TERT promoter mutation status in grade 2 meningiomas. PLoS ONE 2022, 17, e0276342. [Google Scholar] [CrossRef]
  32. Zaia, A.; Rossi, R.; Galeazzi, R.; Sallei, M.; Maponi, P.; Scendoni, P. Fractal lacunarity of trabecular bone in vertebral MRI to predict osteoporotic fracture risk in over-fifties women. The LOTO study. BMC Musculoskelet. Disord. 2021, 22, 1–13. [Google Scholar] [CrossRef] [PubMed]
  33. Ríos-Ramírez, M.; Reyes-Figueroa, A.; Ruiz-Suárez, J.; González-Gutiérrez, J. Pattern formation of stains from dried drops to identify spermatozoa motility. Colloids Surf. B 2018, 169, 486–493. [Google Scholar] [CrossRef]
  34. Mamgain, A.; Kumar, V.; Dash, S. Image-based detection of adulterants in milk using convolutional neural network. ACS Omega 2024, 9, 27158–27168. [Google Scholar] [CrossRef]
  35. Yasar, F.; Akgunlu, F. Fractal dimension and lacunarity analysis of dental radiographs. Dentomaxillofacial Radiol. 2005, 34, 261–267. [Google Scholar] [CrossRef] [PubMed]
  36. Fawcett, T. An introduction to ROC analysis. Pattern Recognit. Lett. 2006, 27, 861–874. [Google Scholar] [CrossRef]
  37. Munir, K.; Elahi, H.; Ayub, A.; Frezza, F.; Rizzi, A. Cancer diagnosis using deep learning: A bibliographic review. Cancers 2019, 11, 1235. [Google Scholar] [CrossRef]
  38. D’Amico, A.V.; Whittington, R.; Malkowicz, S.B.; Schultz, D.; Schnall, M.; Tomaszewski, J.E.; Wein, A. A multivariate analysis of clinical and pathological factors that predict for prostate specific antigen failure after radical prostatectomy for prostate cancer. J. Urol. 1995, 154, 131–138. [Google Scholar] [CrossRef]
  39. Tharwat, A. Classification assessment methods. Appl. Comput. Inform. 2020, 17, 168–192. [Google Scholar] [CrossRef]
Figure 1. Schematic of the lacunarity analysis algorithm. (a) Original deposit. (b) Image converted to 8-bit grayscale. (c) Application of the sliding-box algorithm. A fixed-size box of side length l (green) systematically slides across the image in 5-pixel steps, quantifying the pixel intensity within each position; previously visited positions are marked in red. The scanning continues until the entire deposit is covered. Finally, lacunarity ( λ ( l ) ) is computed as a global descriptor of spatial heterogeneity.
Applsci 15 05676 g001
Figure 2. Morphological patterns of dried milk droplets at different NaCl concentrations. (a) Whole milk and (b) lactose-free milk, with NaCl concentrations of ϕ N = 0 wt%, 2 wt%, and 4 wt%. Panel I shows the full deposits formed under controlled conditions (T = 25 °C, RH = 30%, V = 3 μL). Panel II displays magnified views of the central regions, indicated by blue squares in Panel I. Scale bars correspond to 0.5 mm.
Applsci 15 05676 g002
Figure 3. Lacunarity of milk deposits. Lacunarity λ as a function of natural logarithm of the normalized box size ln ( ϵ ) at ϕ N = 0 wt% (a), 2 wt% (b), and ϕ N = 4 wt% (c). Black and red colors represent whole milk and lactose-free milk, respectively.
Applsci 15 05676 g003
Figure 4. Relative difference of lacunarity and Receiver Operating Characteristic (ROC). (a) Relative difference of lacunarity | λ D λ E | / λ E between whole milk and lactose-free milk at ϕ N = 0 wt% (Panel I), 2 wt% (Panel II), and ϕ N = 4 wt% (Panel III). (b) ROC curves estimated from lacunarity for ln ( ϵ ) = 4.6 at ϕ N = 0 wt% (Panel I), 2 wt% (Panel II), and ϕ N = 4 wt% (Panel III).
Applsci 15 05676 g004
Figure 5. Accuracy of lacunarity-based differentiation among milk types. Accuracy of differentiation between whole milk and lactose-free milk for different concentrations ϕ N = 0 wt%, 2 wt%, and 4 wt%.
Applsci 15 05676 g005
Figure 6. Accuracy of CNN-based differentiation among milk types. Classification accuracy of a convolutional neural network (CNN) model for differentiating whole milk from lactose-free milk at different NaCl concentrations, ϕ N = 0 wt%, 2 wt%, and 4 wt%. The CNN model exhibits a similar trend to the lacunarity-based approach (Figure 4), achieving the highest accuracy at ϕ N = 0 wt% and slightly improved stability across different concentrations.
Applsci 15 05676 g006
Figure 7. Milk deposits with different NaCl and water concentrations. Dry drops of whole and lactose-free milk, each with distinct water concentrations (0, 20, 40, 60, and 80%) at ϕ N = 0 wt% (a), 2 wt% (b), and ϕ N = 4 wt% (c).
Applsci 15 05676 g007
Figure 8. Reproducibility of milk deposit patterns with varying NaCl and water concentrations. Dry deposits of whole and lactose-free milk with different water concentrations (0, 20, 40, 60, and 80%) at ϕ N = 0 wt% (a), 2 wt% (b), and 4 wt% (c). Each condition is shown to illustrate the reproducibility of the patterns.
Applsci 15 05676 g008
Figure 9. Lacunarity of milk deposits with water. Lacunarity λ as a function of natural logarithm of the normalized box size ln ( ϵ ) for whole and lactose-free milk at ϕ N = 0 wt% (a), 2 wt% (b), and 4 wt% (c) at different added water concentrations 0, 20, 40, 60, and 80%. The lacunarity of dried drop patterns decreases systematically with normalized box size and higher NaCl concentrations, which indicates structural sensitivity to changes in sample composition.
Applsci 15 05676 g009
Figure 10. Accuracy of lacunarity-based water detection in milk. Accuracy of differentiation between 100% milk (whole lactose and lactose-free milk) and milk with added distinct water concentrations (0, 20, 40, 60, and 80%) at ϕ N = 0 wt% (a), 2 wt% (b), and ϕ N = 4 wt% (c).
Applsci 15 05676 g010
Figure 11. Accuracy of CNN-based water detection in milk. Efficiency levels in detecting different water concentrations (20%, 40%, 60%, and 80%) in whole and lactose-free milk samples under three NaCl conditions: ϕ N = 0 wt% (a), 2 wt% (b), and 4 wt% (c). The deep learning-based model demonstrates a high capacity for detecting milk adulteration, maintaining precision above 90% in most cases. Compared to the lacunarity approach (Figure 10), the machine learning model exhibits a more homogeneous and stable performance across varying NaCl concentrations and water content, particularly improving sensitivity in cases with 20% and 40% added water.
Applsci 15 05676 g011
Table 1. Nutritional value.
Nutritional Information of 100 mL Whole MilkLactose-Free Milk
Energy content (kcal) 6148
Energy content (kJ) 256201
Proteins, g 3.13.1
Total fat, g 3.31.8
Saturate fat, g21.1
Trans fat, mg00
Available carbohydrates, g 4.84.8
Sugars, g4.84.8
Added sugars, g00
Dietary fiber, g 00
Sodium, mg 4646
Calcium, mg116116
Vitamin A, µg66.466.4
Vitamin D, µg0.50.5
Table 2. Number of images acquired and ROIs selected for whole milk samples at different ϕ values and water concentrations.
ϕ (wt%)Water (%)Number of ImagesNumber of ROIs
001207268
201205209
401206341
601208003
801205209
2013614,393
201288535
401368058
601085782
801288269
4014818,028
2014816,038
4011216,388
6013619,510
8010815,406
Table 3. Number of images acquired and ROIs selected for lactose-free milk samples at different ϕ values and water concentrations.
ϕ (wt%)Water (%)Number of ImagesNumber of ROIs
0012410,025
201006416
401247137
60844955
801005403
201329825
20806839
401329924
601207912
8012013,592
4014016,647
208410,238
4010010,194
6014018,054
8012016,021
Disclaimer/Publisher’s Note: The statements, opinions and data contained in all publications are solely those of the individual author(s) and contributor(s) and not of MDPI and/or the editor(s). MDPI and/or the editor(s) disclaim responsibility for any injury to people or property resulting from any ideas, methods, instructions or products referred to in the content.

