
18F-Fluorodeoxyglucose Uptake in Cerebrospinal Fluid Reflects Both Brain Glucose Demand and Impaired Blood–Brain Barrier Transport in Alzheimer’s Disease

 , ,
, ,  ,
,  and
and
Abstract
1. Introduction
2. Materials and Methods
2.1. Patients Enrolment and Study Design
2.2. CSF Collection and Biomarker Analysis
2.3. F-FDG-PET Data
2.4. Statistical Analysis
3. Results
3.1. Participant Characteristics
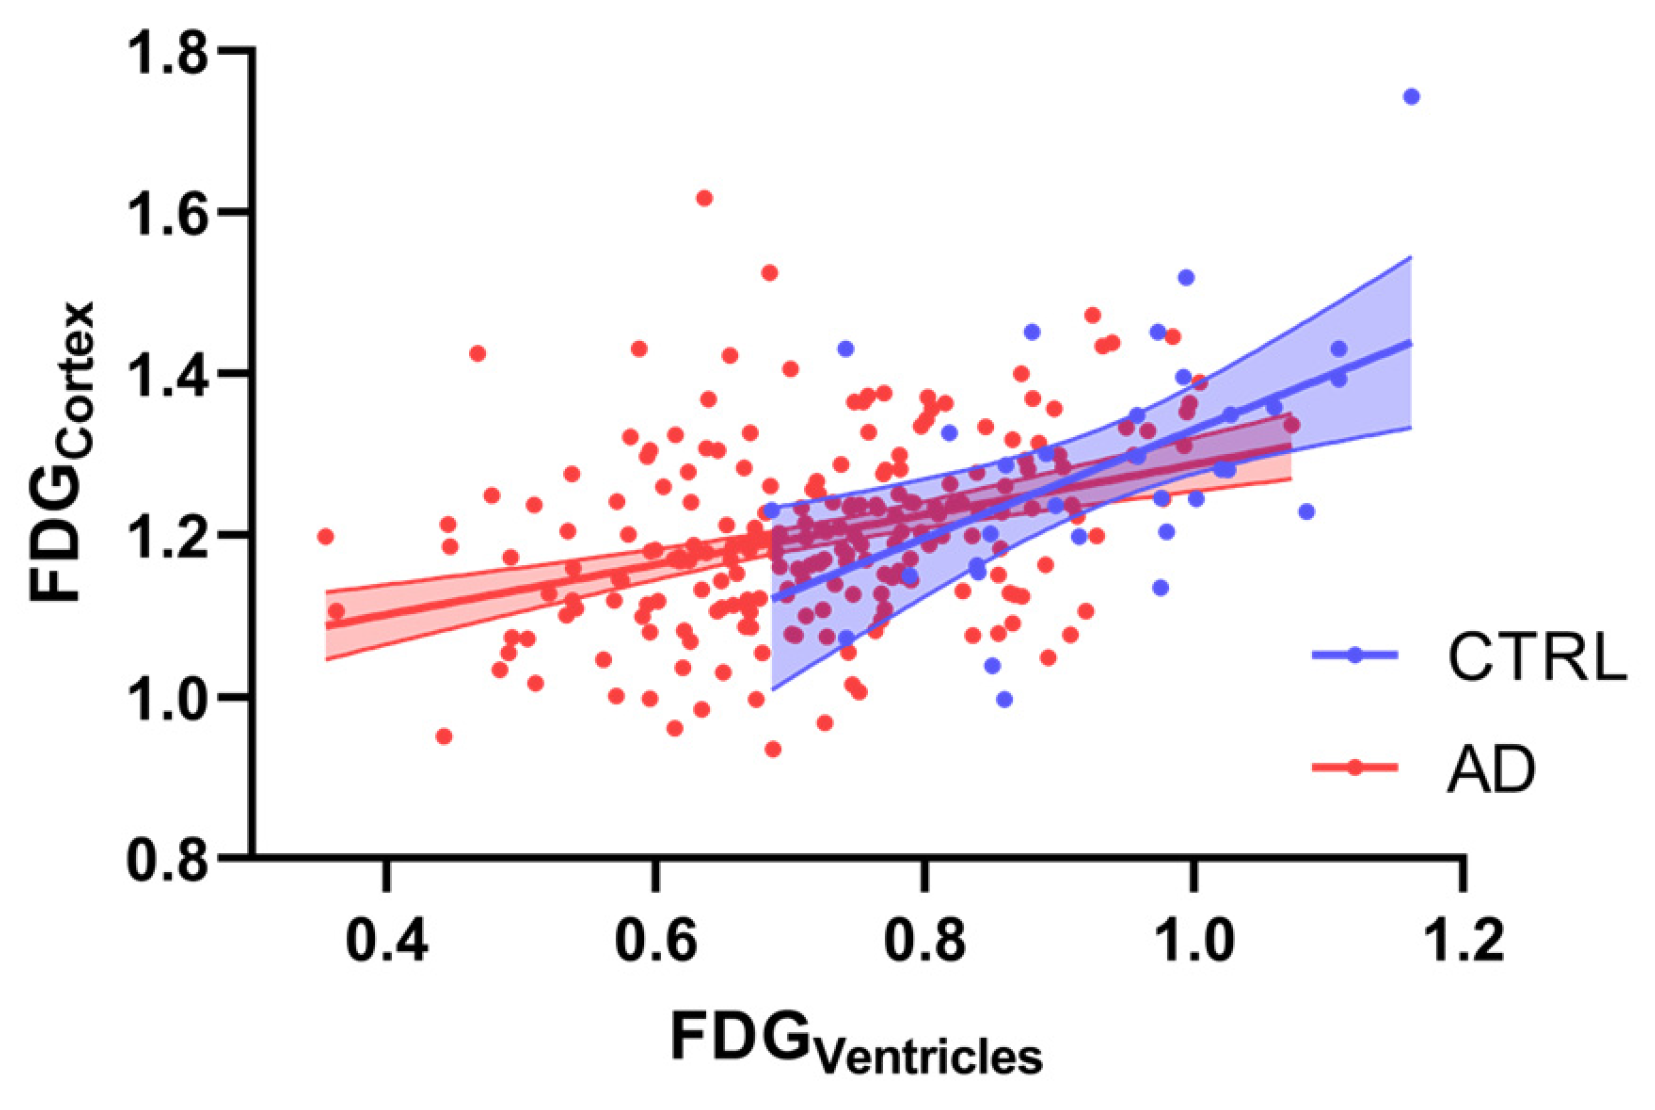
3.2. Correlation Analysis Between 18F-FDG Parameters
3.3. Regression Analyses
4. Discussion
5. Conclusions
Supplementary Materials
Author Contributions
Funding
Institutional Review Board Statement
Informed Consent Statement
Data Availability Statement
Acknowledgments
Conflicts of Interest
Abbreviations
| AD | Alzheimer’s disease |
| APOE | Apolipoprotein E |
| Aβ42 | amyloid-β 1–42 |
| CSF | cerebrospinal fluid |
| F | female |
| FDG | fluorodeoxyglucose |
| GLUT | glucose transporter |
| CTRL | control |
| n | number |
| p | p-value |
| p-tau | phosphorylated-tau |
| Qalb | Albumin Quotient |
| t-tau | total tau |
| 18F-FDG-PET | positron emission tomography with [18F]fluoro-2-deoxyglucose |
References
- Sweeney, M.D.; Montagne, A.; Sagare, A.P.; Nation, D.A.; Schneider, L.S.; Chui, H.C.; Harrington, M.G.; Pa, J.; Law, M.; Wang, D.J.J.; et al. Vascular Dysfunction-The Disregarded Partner of Alzheimer’s Disease. Alzheimers Dement. 2019, 15, 158–167. [Google Scholar] [CrossRef]
- Zlokovic, B.V. Neurovascular Pathways to Neurodegeneration in Alzheimer’s Disease and Other Disorders. Nat. Rev. Neurosci. 2011, 12, 723–738. [Google Scholar] [CrossRef]
- Salmon, E.; Collette, F.; Bastin, C. Cerebral Glucose Metabolism in Alzheimer’s Disease. Cortex 2024, 179, 50–61. [Google Scholar] [CrossRef]
- Mosconi, L.; Berti, V.; Glodzik, L.; Pupi, A.; De Santi, S.; De Leon, M.J. Pre-Clinical Detection of Alzheimer’s Disease Using FDG-PET, with or without Amyloid Imaging. J. Alzheimers Dis. 2010, 20, 843–854. [Google Scholar] [CrossRef]
- Nordberg, A.; Rinne, J.O.; Kadir, A.; Lngström, B. The Use of PET in Alzheimer Disease. Nat. Rev. Neurol. 2010, 6, 78–87. [Google Scholar] [CrossRef]
- Hunt, A.; Schönknecht, P.; Henze, M.; Seidl, U.; Haberkorn, U.; Schröder, J. Reduced Cerebral Glucose Metabolism in Patients at Risk for Alzheimer’s Disease. Psychiatry Res. 2007, 155, 147–154. [Google Scholar] [CrossRef]
- Ibáñez, V.; Pietrini, P.; Alexander, G.E.; Furey, M.L.; Teichberg, D.; Rajapakse, J.C.; Rapoport, S.I.; Schapiro, M.B.; Horwitz, B. Regional Glucose Metabolic Abnormalities Are Not the Result of Atrophy in Alzheimer’s Disease. Neurology 1998, 50, 1585–1593. [Google Scholar] [CrossRef] [PubMed]
- Patching, S.G. Glucose Transporters at the Blood-Brain Barrier: Function, Regulation and Gateways for Drug Delivery. Mol. Neurobiol. 2017, 54, 1046–1077. [Google Scholar] [CrossRef]
- Winkler, E.A.; Nishida, Y.; Sagare, A.P.; Rege, S.V.; Bell, R.D.; Perlmutter, D.; Sengillo, J.D.; Hillman, S.; Kong, P.; Nelson, A.R.; et al. GLUT1 Reductions Exacerbate Alzheimer’s Disease Vasculo-Neuronal Dysfunction and Degeneration. Nat. Neurosci. 2015, 18, 521–530. [Google Scholar] [CrossRef]
- Ma, Q.; Zhao, Z.; Sagare, A.P.; Wu, Y.; Wang, M.; Owens, N.C.; Verghese, P.B.; Herz, J.; Holtzman, D.M.; Zlokovic, B.V. Blood-Brain Barrier-Associated Pericytes Internalize and Clear Aggregated Amyloid-Β42 by LRP1-Dependent Apolipoprotein E Isoform-Specific Mechanism. Mol. Neurodegener. 2018, 13, 57. [Google Scholar] [CrossRef]
- Kalaria, R.H.N.; Harik, S.I. Reduced Glucose Transporter at the Blood-Brain Barrier and in Cerebral Cortex in Alzheimer Disease. J. Neurochem. 1989, 53, 1083–1088. [Google Scholar] [CrossRef] [PubMed]
- Patching, S. Roles of Facilitative Glucose Transporter GLUT1 in [18F]FDG Positron Emission Tomography (PET) Imaging of Human Diseases. J. Diagn. Imaging Ther. 2015, 2, 30–102. [Google Scholar] [CrossRef]
- Zhou, Z.; Zhao, T.; Gardus, J.; Wen, Q.; Feng, Y.; DeLorenzo, C.; Parsey, R.; Huang, C. Quantifying Ventricular CSF Clearance in the Human Brain Using Dynamic 18F-FDG PET: Insights into Age-Related Glymphatic Impairment. medRxiv 2025. [Google Scholar] [CrossRef]
- Yao, J.; Rettberg, J.R.; Klosinski, L.P.; Cadenas, E.; Brinton, R.D. Shift in Brain Metabolism in Late Onset Alzheimer’s Disease: Implications for Biomarkers and Therapeutic Interventions. Mol. Asp. Med. 2011, 32, 247–257. [Google Scholar] [CrossRef] [PubMed]
- Serrano-Pozo, A.; Das, S.; Hyman, B.T. APOE and Alzheimer’s Disease: Advances in Genetics, Pathophysiology, and Therapeutic Approaches. Lancet Neurol. 2021, 20, 68–80. [Google Scholar] [CrossRef]
- Johnson, L.A. APOE and Metabolic Dysfunction in Alzheimer’s Disease. Int. Rev. Neurobiol. 2020, 154, 131–151. [Google Scholar] [CrossRef]
- Wu, L.; Zhang, X.; Zhao, L. Human ApoE Isoforms Differentially Modulate Brain Glucose and Ketone Body Metabolism: Implications for Alzheimer’s Disease Risk Reduction and Early Intervention. J. Neurosci. 2018, 38, 6665–6681. [Google Scholar] [CrossRef]
- McKhann, G.M.; Knopman, D.S.; Chertkow, H.; Hyman, B.T.; Jack, C.R.; Kawas, C.H.; Klunk, W.E.; Koroshetz, W.J.; Manly, J.J.; Mayeux, R.; et al. The Diagnosis of Dementia Due to Alzheimer’s Disease: Recommendations from the National Institute on Aging-Alzheimer’s Association Workgroups on Diagnostic Guidelines for Alzheimer’s Disease. Alzheimers Dement. 2011, 7, 263–269. [Google Scholar] [CrossRef]
- Albert, M.S.; DeKosky, S.T.; Dickson, D.; Dubois, B.; Feldman, H.H.; Fox, N.C.; Gamst, A.; Holtzman, D.M.; Jagust, W.J.; Petersen, R.C.; et al. The Diagnosis of Mild Cognitive Impairment Due to Alzheimer’s Disease: Recommendations from the National Institute on Aging-Alzheimer’s Association Workgroups on Diagnostic Guidelines for Alzheimer’s Disease. Alzheimers Dement. 2011, 7, 270–279. [Google Scholar] [CrossRef]
- Guedj, E.; Varrone, A.; Boellaard, R.; Albert, N.L.; Barthel, H.; van Berckel, B.; Brendel, M.; Cecchin, D.; Ekmekcioglu, O.; Garibotto, V.; et al. EANM Procedure Guidelines for Brain PET Imaging Using [18F]FDG, Version 3. Eur. J. Nucl. Med. Mol. Imaging 2022, 49, 632–651. [Google Scholar] [CrossRef]
- D’Agostino, E.; Maes, F.; Vandermeulen, D.; Suetens, P. Atlas-to-Image Non-Rigid Registration by Minimization of Conditional Local Entropy. Inf. Process. Med. Imaging 2007, 20, 320–332. [Google Scholar] [CrossRef] [PubMed]
- Mazziotta, J.C.; Toga, A.W.; Evans, A.; Fox, P.; Lancaster, J. A Probabilistic Atlas of the Human Brain: Theory and Rationale for Its Development. Neuroimage 1995, 2, 89–101. [Google Scholar] [CrossRef] [PubMed]
- Maldjian, J.A.; Laurienti, P.J.; Kraft, R.A.; Burdette, J.H. An Automated Method for Neuroanatomic and Cytoarchitectonic Atlas-Based Interrogation of FMRI Data Sets. Neuroimage 2003, 19, 1233–1239. [Google Scholar] [CrossRef]
- Verger, A.; Doyen, M.; Campion, J.Y.; Guedj, E. The Pons as Reference Region for Intensity Normalization in Semi-Quantitative Analysis of Brain 18FDG PET: Application to Metabolic Changes Related to Ageing in Conventional and Digital Control Databases. EJNMMI Res. 2021, 11, 31. [Google Scholar] [CrossRef]
- Minoshima, S.; Mosci, K.; Cross, D.; Thientunyakit, T. Brain [F-18]FDG PET for Clinical Dementia Workup: Differential Diagnosis of Alzheimer’s Disease and Other Types of Dementing Disorders. Semin. Nucl. Med. 2021, 51, 230–240. [Google Scholar] [CrossRef]
- Demetrius, L.A.; Magistretti, P.J.; Pellerin, L. Alzheimer’s Disease: The Amyloid Hypothesis and the Inverse Warburg Effect. Front. Physiol. 2015, 5, 522. [Google Scholar] [CrossRef]
- Pellerin, L.; Pellegri, G.; Bittar, P.G.; Charnay, Y.; Bouras, C.; Martin, J.L.; Stella, N.; Magistretti, P.J. Evidence Supporting the Existence of an Activity-Dependent Astrocyte-Neuron Lactate Shuttle. Dev. Neurosci. 1998, 20, 291–299. [Google Scholar] [CrossRef]
- Peters, A.; Sprengell, M.; Kubera, B. The Principle of “brain Energy on Demand” and Its Predictive Power for Stress, Sleep, Stroke, Obesity and Diabetes. Neurosci. Biobehav. Rev. 2022, 141, 104847. [Google Scholar] [CrossRef]
- Cornford, E.M.; Hyman, S.; Swartz, B.E. The Human Brain GLUT1 Glucose Transporter: Ultrastructural Localization to the Blood-Brain Barrier Endothelia. J. Cereb. Blood Flow Metab. 1994, 14, 106–112. [Google Scholar] [CrossRef]
- Lee, W.H.; Bondy, C.A. Ischemic Injury Induces Brain Glucose Transporter Gene Expression. Endocrinology 1993, 133, 2540–2544. [Google Scholar] [CrossRef]
- Magistretti, P.J.; Pellerin, L. Cellular Mechanisms of Brain Energy Metabolism and Their Relevance to Functional Brain Imaging. Philos. Trans. R. Soc. B Biol. Sci. 1999, 354, 1155–1163. [Google Scholar] [CrossRef] [PubMed]
- Liguori, C.; Chiaravalloti, A.; Sancesario, G.; Stefani, A.; Sancesario, G.M.; Mercuri, N.B.; Schillaci, O.; Pierantozzi, M. Cerebrospinal Fluid Lactate Levels and Brain [18F]FDG PET Hypometabolism within the Default Mode Network in Alzheimer’s Disease. Eur. J. Nucl. Med. Mol. Imaging 2016, 43, 2040–2049. [Google Scholar] [CrossRef] [PubMed]
- Redzic, Z. Molecular Biology of the Blood-Brain and the Blood-Cerebrospinal Fluid Barriers: Similarities and Differences. Fluids Barriers CNS 2011, 8, 3. [Google Scholar] [CrossRef]
- Chiaravalloti, A.; Fiorentini, A.; Francesco, U.; Martorana, A.; Koch, G.; Belli, L.; Torniolo, S.; Di Pietro, B.; Motta, C.; Schillaci, O. Is Cerebral Glucose Metabolism Related to Blood-Brain Barrier Dysfunction and Intrathecal IgG Synthesis in Alzheimer Disease? A 18 F-FDG PET/CT Study. Medicine 2016, 95, e4206. [Google Scholar] [CrossRef]
- Rhea, E.M.; Leclerc, M.; Yassine, H.N.; Capuano, A.W.; Tong, H.; Petyuk, V.A.; Macauley, S.L.; Fioramonti, X.; Carmichael, O.; Calon, F.; et al. State of the Science on Brain Insulin Resistance and Cognitive Decline Due to Alzheimer’s Disease. Aging Dis. 2024, 15, 1688–1725. [Google Scholar] [CrossRef]
- Onos, K.; Lin, P.B.; Pandey, R.S.; Persohn, S.A.; Burton, C.P.; Miner, E.W.; Eldridge, K.; Kanyinda, J.N.; Foley, K.E.; Carter, G.W.; et al. Assessment of Neurovascular Uncoupling: APOE Status Is a Key Driver of Early Metabolic and Vascular Dysfunction. Alzheimer’s Dement. 2024, 20, 4951–4969. [Google Scholar] [CrossRef]
- Williams, H.C.; Farmer, B.C.; Piron, M.A.; Walsh, A.E.; Bruntz, R.C.; Gentry, M.S.; Sun, R.C.; Johnson, L.A. APOE Alters Glucose Flux through Central Carbon Pathways in Astrocytes. Neurobiol. Dis. 2020, 136, 104742. [Google Scholar] [CrossRef]


| CTRL (n = 35) | All AD (n = 224) | p | |||
|---|---|---|---|---|---|
| Mean ± SD | Median (IQR) | Mean ± SD | Median (IQR) | ||
| MMSE | 28.60 ± 1.22 | 29.00 (2.22) | 22.73 ± 2.79 | 23.50 (3.00) | <0.001 |
| CSF Aβ42 (pg/mL) | 1028.22 ± 290.34 | 1005.00 (334.00) | 391.57 ± 140.25 | 390.50 (182.20) | <0.001 |
| CSF p-tau (pg/mL) | 35.75 ± 15.19 | 32.35 (23.00) | 84.57 ± 44.37 | 73.50 (53.00) | <0.001 |
| CSF t-tau (pg/mL) | 212.05 ± 133.80 | 169.00 (158.95) | 616.98 ± 351.76 | 555.81 (457.65) | <0.001 |
| CSF p-tau/Aβ42 | 0.036 ± 0.018 | 0.034 (0.020) | 0.252 ± 0.201 | 0.200 (0.147) | <0.001 |
| Qalb | 7.21 ± 2.15 | 6.98 (2.42) | 6.72 ± 2.87 | 6.05 (3.54) | <0.001 |
| CSF lactates (pg/mL) | 1.63 ± 0.40 | 1.50 (0.69) | 1.79 ± 0.35 | 1.80 (0.40) | <0.001 |
| Age (y) | 67.09 ± 7.33 | 67.00 (11.50) | 70.25 ± 6.83 | 71.00 (9.00) | 0.085 |
| % | % | ||||
| Sex (F) | 40.0 | 53.5 | 0.007 | ||
| APOE (ε4) | 14.3 | 44.3 | 0.014 | ||
| mean ± SD | mean ± SD | ||||
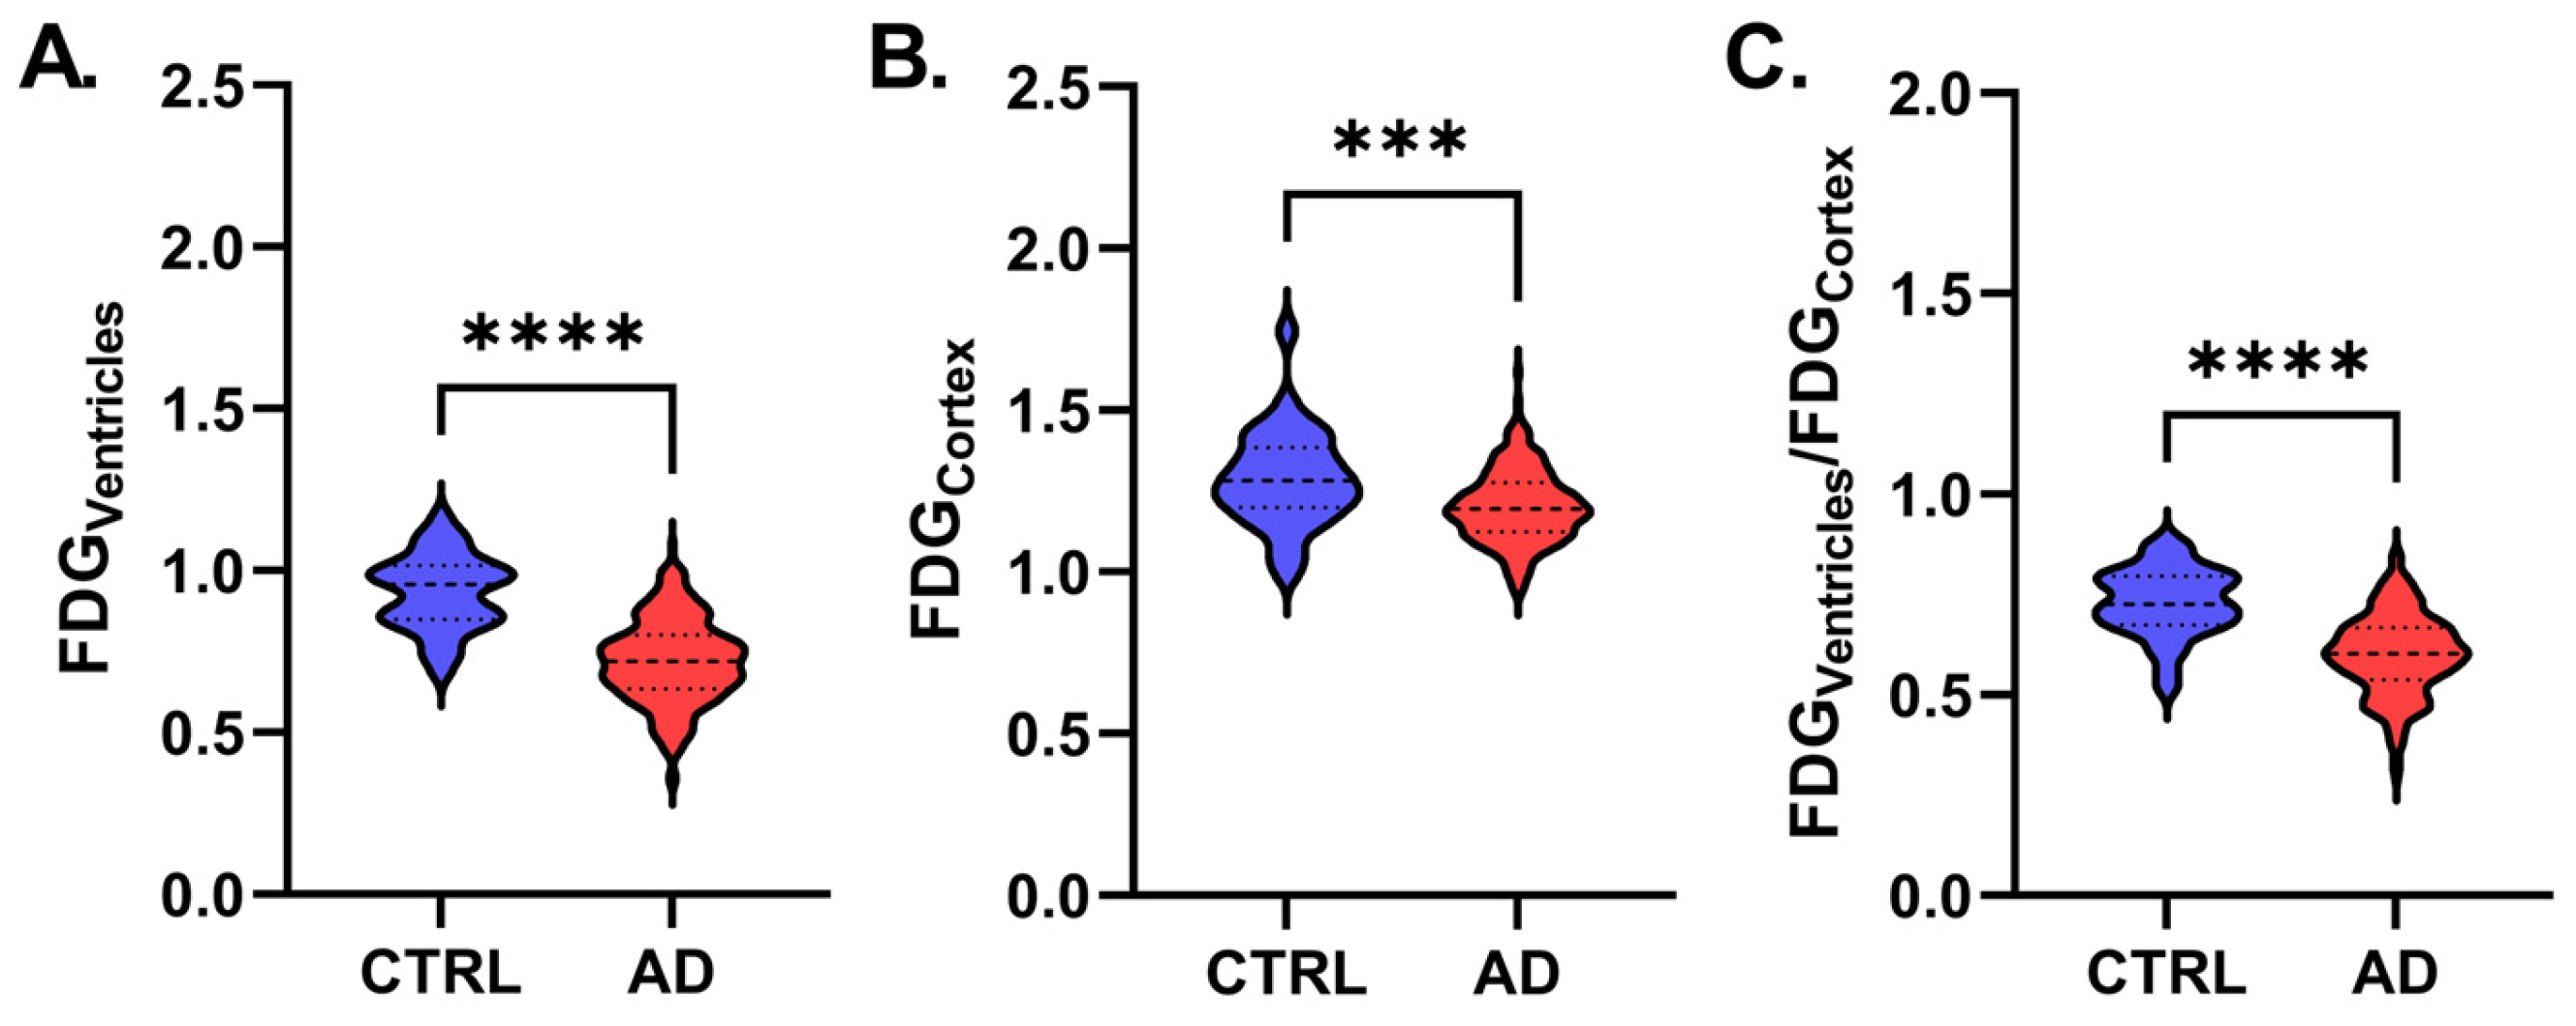
| FDGVentricles | 0.94 ± 0.22 | 0.72 ± 0.13 | <0.001 | ||
| FDGCortex | 1.28 ± 0.15 | 1.20 ± 0.11 | <0.001 | ||
| FDGVentricles/FDGCortex | 0.71 ± 0.11 | 0.60 ± 0.10 | <0.001 | ||
| CTRL | All AD | |||
|---|---|---|---|---|
| β | p | β | p | |
| FDGCortex | ||||
| Age | −0.455 | 0.044 | −0.013 | 0.854 |
| Sex | n.a. | 0.532 | n.a. | 0.480 |
| Plasma glucose (mg/dL) | −0.080 | 0.689 | −0.147 | 0.036 |
| Qalb | 0.098 | 0.588 | −0.158 | 0.033 |
| CSF p-tau/Aβ42 | 0.037 | 0.869 | −0.071 | 0.295 |
| CSF lactates | 0.082 | 0.698 | 0.011 | 0.876 |
| Adjusted R2 | 0.019 | 0.036 | ||
| FDGVentricles | ||||
| Age | −0.608 | 0.004 | −0.255 | <0.001 |
| Sex | n.a. | 0.188 | n.a. | 0.053 |
| Plasma glucose (mg/dL) | 0.013 | 0.940 | −0.002 | 0.978 |
| Qalb | 0.226 | 0.173 | −0.067 | 0.333 |
| CSF p-tau/Aβ42 | 0.254 | 0.207 | 0.075 | 0.238 |
| CSF lactates | 0.026 | 0.893 | −0.207 | 0.002 |
| Adjusted R2 | 0.212 | 0.148 | ||
| FDGVentricles/FDGCortex | ||||
| Age | −0.200 | 0.397 | −0.264 | <0.001 |
| Sex | n.a. | 0.481 | n.a. | 0.100 |
| Plasma glucose (mg/dL) | 0.081 | 0.707 | 0.082 | 0.213 |
| Qalb | 0.152 | 0.439 | 0.010 | 0.885 |
| CSF p-tau/Aβ42 | 0.213 | 0.375 | 0.136 | 0.034 |
| CSF lactates | −0.047 | 0.838 | −0.214 | 0.002 |
| Adjusted R2 | −0.139 | 0.144 | ||
| APOE ε3 | APOE ε4 | |||
|---|---|---|---|---|
| β | p | β | p | |
| FDGCortex | ||||
| Age | −0.126 | 0.900 | −0.032 | 0.747 |
| Plasma glucose (mg/dL) | −0.059 | 0.544 | −0.268 | 0.010 |
| Qalb | −0.138 | 0.166 | −0.240 | 0.019 |
| CSF p-tau/Aβ42 | −0.096 | 0.311 | −0.071 | 0.468 |
| CSF lactates | 0.141 | 0.151 | −0.085 | 0.431 |
| Adjusted R2 | −0.001 | 0.126 | ||
| FDGVentricles | ||||
| Age | −0.247 | 0.008 | −0.289 | 0.002 |
| Plasma glucose (mg/dL) | 0.061 | 0.511 | −0.080 | 0.395 |
| Qalb | −0.032 | 0.742 | −0.218 | 0.020 |
| CSF p-tau/Aβ42 | −0.057 | 0.531 | 0.253 | 0.006 |
| CSF lactates | −0.201 | 0.035 | −0.142 | 0.155 |
| Adjusted R2 | 0.069 | 0.261 | ||
| FDGVentricles/FDGCortex | ||||
| Age | −0.238 | 0.010 | −0.303 | 0.002 |
| Plasma glucose (mg/dL) | 0.089 | 0.341 | 0.071 | 0.457 |
| Qalb | 0.041 | 0.669 | −0.120 | 0.202 |
| CSF p-tau/Aβ42 | 0.015 | 0.866 | 0.334 | <0.001 |
| CSF lactates | −0.260 | 0.006 | −0.118 | 0.243 |
| Adjusted R2 | 0.086 | 0.248 | ||
Disclaimer/Publisher’s Note: The statements, opinions and data contained in all publications are solely those of the individual author(s) and contributor(s) and not of MDPI and/or the editor(s). MDPI and/or the editor(s) disclaim responsibility for any injury to people or property resulting from any ideas, methods, instructions or products referred to in the content. |
© 2025 by the authors. Licensee MDPI, Basel, Switzerland. This article is an open access article distributed under the terms and conditions of the Creative Commons Attribution (CC BY) license (https://creativecommons.org/licenses/by/4.0/).
Share and Cite
Motta, C.; Bonomi, C.G.; Poli, M.; Mercuri, N.B.; Martorana, A.; Chiaravalloti, A. 18F-Fluorodeoxyglucose Uptake in Cerebrospinal Fluid Reflects Both Brain Glucose Demand and Impaired Blood–Brain Barrier Transport in Alzheimer’s Disease. Appl. Sci. 2025, 15, 5677. https://doi.org/10.3390/app15105677
Motta C, Bonomi CG, Poli M, Mercuri NB, Martorana A, Chiaravalloti A. 18F-Fluorodeoxyglucose Uptake in Cerebrospinal Fluid Reflects Both Brain Glucose Demand and Impaired Blood–Brain Barrier Transport in Alzheimer’s Disease. Applied Sciences. 2025; 15(10):5677. https://doi.org/10.3390/app15105677
Chicago/Turabian StyleMotta, Caterina, Chiara Giuseppina Bonomi, Martina Poli, Nicola Biagio Mercuri, Alessandro Martorana, and Agostino Chiaravalloti. 2025. "18F-Fluorodeoxyglucose Uptake in Cerebrospinal Fluid Reflects Both Brain Glucose Demand and Impaired Blood–Brain Barrier Transport in Alzheimer’s Disease" Applied Sciences 15, no. 10: 5677. https://doi.org/10.3390/app15105677
APA StyleMotta, C., Bonomi, C. G., Poli, M., Mercuri, N. B., Martorana, A., & Chiaravalloti, A. (2025). 18F-Fluorodeoxyglucose Uptake in Cerebrospinal Fluid Reflects Both Brain Glucose Demand and Impaired Blood–Brain Barrier Transport in Alzheimer’s Disease. Applied Sciences, 15(10), 5677. https://doi.org/10.3390/app15105677