1. Introduction
In recent years, machine learning (ML) has driven innovation across various fields with its exceptional predictive accuracy. ML has become an indispensable tool in industries such as healthcare, logistics, climate science, and marketing, thanks to its ability to analyze vast amounts of data and uncover complex patterns. Accurate predictions in these areas often guide critical decisions with significant impacts on outcomes.
ML-based models have demonstrated superior performance in financial market predictions by processing large datasets, identifying complex patterns, and incorporating new information more effectively than traditional methods. For example, advanced neural network models have been applied to predict the Borsa Istanbul Banks Index, achieving better results than traditional approaches [
1]. Similarly, the effectiveness of fuzzy clustering combined with artificial neural networks for financial market predictions has been highlighted [
2], while the advantages of deep reinforcement learning in option pricing have also been demonstrated [
3]. These advancements highlight ML’s growing role in financial analytics, delivering more accurate and timely insights into market dynamics.
Traditional financial models, such as linear regression and time-series analysis, often fail to capture the nonlinear and complex nature of financial data. In contrast, LSTM networks effectively handle long-term dependencies and extract meaningful patterns from time-series data. However, standard LSTM models treat all input features equally, limiting their ability to prioritize the most important information. Attention mechanisms address this limitation by dynamically focusing on the most relevant parts of the input sequence, thereby enhancing prediction accuracy. Studies have demonstrated the superior performance of Attention-LSTM models in financial market predictions, establishing them as a vital tool in this domain [
4,
5,
6]. Recent Attention-augmented architectures have further validated this trend. Li et al. [
7] developed a CNN–LSTM model enhanced with attention for the credit risk prediction of listed companies, achieving superior accuracy over traditional neural and statistical approaches. Sang and Li [
8] proposed an Attention Mechanism Variant LSTM (AMV-LSTM) for stock price forecasting, demonstrating improved generalization and robustness compared to standard LSTM models. Finally, Luo et al. [
9] introduced a CNN–BiLSTM–Attention (CLATT) framework for short-term stock correlation forecasting, in which the Attention layer dynamically re-weighs BiLSTM outputs to further boost predictive performance.
The strength of ML lies in its ability to process high-dimensional data and uncover nonlinear relationships, allowing it to deliver more accurate and reliable predictions. Unlike traditional statistical models, ML adapts to dynamic environments, making it particularly effective in domains characterized by frequent changes. For instance, LSTM models have been shown to excel in capturing long-term dependencies in time-series data [
10,
11]. Furthermore, studies have demonstrated that when enhanced with Attention mechanisms, LSTM models improve predictive accuracy by focusing on the most critical features of input sequences [
5,
12]. A multi-feature approach using LSTM networks has also been shown to significantly outperform single-feature models in financial time-series forecasting, highlighting the importance of incorporating diverse market indicators [
13]. Additionally, a hybrid model combining empirical mode decomposition (EMD) and Akima spline interpolation with LSTM has been proposed, effectively handling financial data’s nonlinearity and improving prediction accuracy [
14].
In financial markets, ML’s predictive power is particularly impactful. Accurate forecasts of asset prices and market volatility are essential for investors, financial institutions, and policymakers. Asset price predictions directly influence investment strategies, portfolio management, and market efficiency, helping investors maximize returns and minimize risks. Market volatility, which represents the degree of fluctuation in asset prices over time, serves as a key indicator of market risk. Accurate volatility predictions provide insights into market uncertainty, enabling better risk management and ensuring market stability.
The objective of this paper is to propose the VMD-Cascaded LSTM with Attention model, a novel prediction framework designed to improve the accuracy of forecasting financial time-series data, particularly the market VIX. This model integrates LSTM networks with Attention mechanisms to effectively capture long-term dependencies and focus on key moments in the data.
The VIX, often referred to as the “fear index,” is a benchmark indicator of market volatility and investor sentiment. It is calculated based on the implied volatility of S&P 500 index options, directly linking it to expectations of future fluctuations in the U.S. stock market. Reflecting the sentiment toward the S&P 500—the most widely followed equity index—the VIX serves as a sensitive and timely measure of anticipated market risk. Accurate forecasting of the VIX is essential not only for volatility management but also for informing asset allocation, derivative pricing, and portfolio risk control. Its intrinsic connection to S&P 500 options makes the VIX a forward-looking barometer of equity market volatility.
To complement the deep learning approach, Variational Mode Decomposition (VMD) is introduced as a preprocessing step to decompose financial time-series data into multiple IMFs. VMD separates short-term fluctuations from long-term trends, enabling the model to better capture the complexities of financial volatility. By reducing noise and providing cleaner, more structured data, VMD enhances the model’s ability to identify meaningful patterns and improve prediction accuracy. Similar methodologies have been successfully applied in water quality forecasting [
15] and wind speed prediction [
16], where VMD improved pattern recognition and reduced noise. In financial markets, decomposition methods have been shown to significantly enhance predictive performance, further validating the use of VMD for financial time-series data [
17].
While Transformer-based architectures have recently shown strong performance in time-series forecasting due to their ability to model long-range dependencies through self-attention, their computational complexity scales quadratically with sequence length, making them less suitable for long financial time series. Additionally, the data-hungry nature of such models increases the risk of overfitting in domains where historical data are often limited, such as financial volatility prediction.
Similarly, CNN-LSTM hybrid models can capture both local and sequential patterns but tend to suffer from structural complexity and a heavy reliance on extensive hyperparameter tuning, which hinders fair and reproducible evaluation under constrained computational environments.
To address these issues, we adopt a VMD-Cascaded LSTM architecture with integrated Multi-Head Attention. VMD decomposes the original signal into IMFs, which are individually modeled by LSTMs in a cascaded fashion to capture hierarchical temporal patterns. Multi-Head Attention allows the model to selectively focus on important time steps, improving interpretability and performance. This approach balances forecasting accuracy and computational efficiency, making it well-suited for nonstationary and data-constrained financial time-series environments.
Given the complex and nonlinear nature of financial time series—particularly volatility indices like the VIX—traditional statistical models and even standard LSTM-based approaches often struggle to capture the full range of dynamic and multi-frequency patterns. To address these challenges, this study investigates a hybrid architecture that combines VMD, Cascaded LSTM layers, and a multi-head attention mechanism.
Based on this motivation, this study is guided by the following research questions:
RQ1: Can the integration of VMD, Cascaded LSTM, and Attention mechanisms significantly enhance VIX forecasting accuracy compared to conventional deep learning models?
RQ2: Does the proposed hybrid model maintain robust predictive performance across different market regimes, such as periods of high versus low volatility?
To empirically address these questions, we formulate the following hypotheses:
H1: The VMD-Cascaded LSTM with Attention model yields statistically significantly lower forecasting errors (MSE and MAE) than standard LSTM-based benchmark models.
H2: The proposed model demonstrates stable performance across varying levels of market volatility.
Our research findings significantly contribute to the existing literature. First, this study empirically evaluates the effectiveness of the VMD-Cascaded LSTM with the Attention model in predicting VIX volatility and demonstrates its potential to contribute significantly to volatility management and investment strategy formulation in financial markets. Second, the empirical results demonstrate that our model outperforms benchmark models, achieving substantial improvements in MSE, RMSE, and MAE, highlighting the effectiveness of integrating the Attention mechanism. Third, by leveraging the Attention mechanism within a sequential process, our model enhances its overall stability rather than merely listing machine learning methods, offering a more robust framework for volatility forecasting. These contributions provide valuable insights for volatility management and investment strategy formulation in financial markets.
This study presents a VMD-Cascaded LSTM with the Attention model to improve market volatility forecasts, thereby enhancing risk management and investment strategies. Beyond finance, the architecture’s adaptability extends to domains such as healthcare for early disease detection and climate science for flood risk forecasting. Moreover, in environments equipped with high-performance GPUs, the model can deliver even faster training and inference times. This enables investors and risk managers to reassess volatility forecasts for specific indices or financial instruments in near real time, supporting more agile and responsive decision-making. Such applicability underscores the model’s potential integration into automated trading systems or real-time risk monitoring platforms.
The remainder of this study is structured as follows.
Section 2 provides a brief review of previous studies on financial forecasting using LSTM models and volatility prediction through machine learning techniques.
Section 3 describes the dataset and outlines the proposed methodology.
Section 4 presents the experimental results, highlighting the performance of the proposed model. Finally,
Section 5 offers concluding remarks and discusses potential future research directions.
3. Data Description and Methods
3.1. Data Description
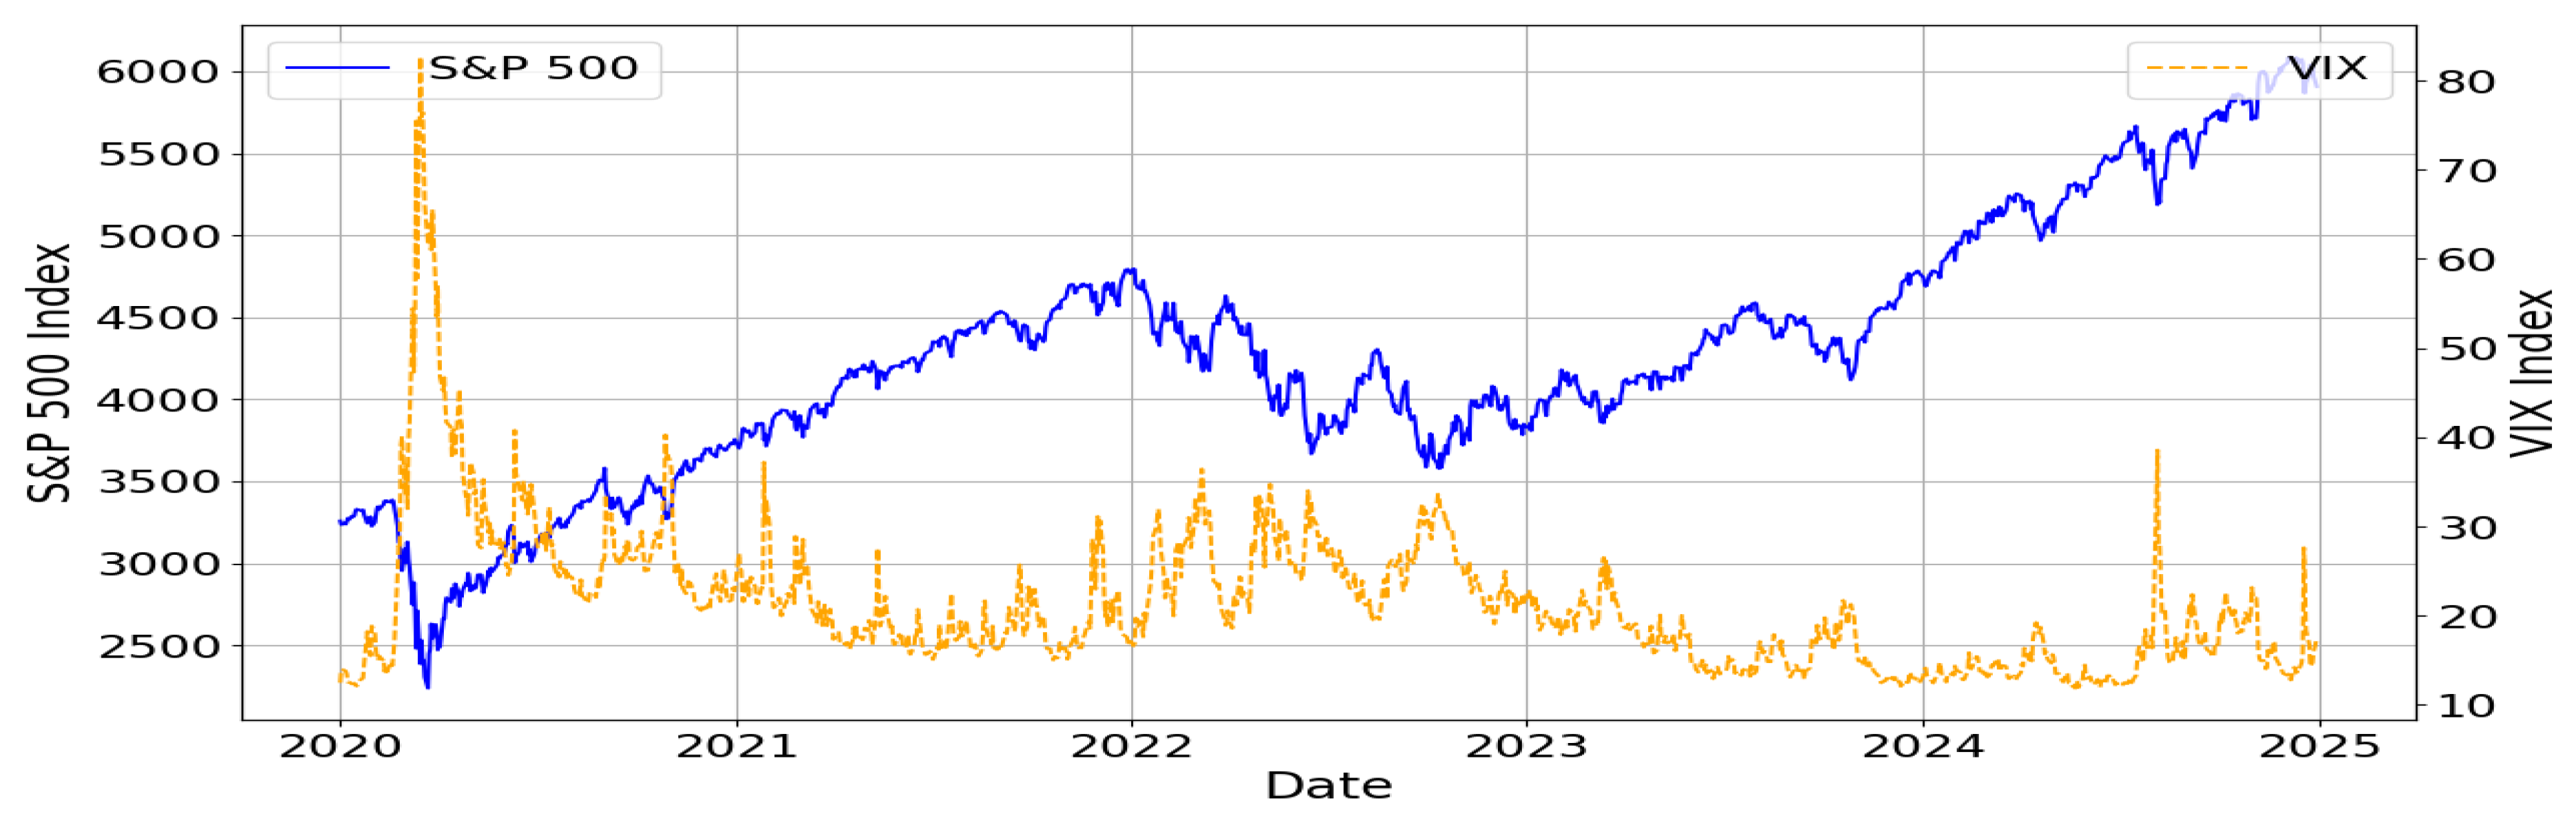
The data used in this study include the VIX and the closing prices of the S&P 500, which were utilized to analyze market volatility and movements. The data cover the period from January 2020 to December 2024 and were collected from the Yahoo Finance platform. This study specifically employed data starting from 2020 to minimize discrepancies with pre-COVID-19 data and to effectively reflect structural changes in the market.
Figure 1 visualizes the movements of the S&P 500 and VIX over the selected period. The blue solid line represents the S&P 500 index, while the orange dashed line shows the VIX index. The graph highlights that S&P 500 and VIX generally exhibit an inverse relationship. For example, during the early pandemic phase in 2020, VIX experienced sharp spikes while the S&P 500 declined. As the market stabilized, VIX decreased and the S&P 500 resumed an upward trend. This inverse pattern is also observed during correction periods in 2022 and 2023.
To better understand the characteristics of the data, statistical analyses were conducted. The results are summarized in
Table 1.
The statistical analysis results indicate that VIX data exhibit high skewness (2.5211) and kurtosis (11.1301), reflecting frequent extreme market events. In contrast, S&P 500 data follow a near-normal distribution with slight positive skewness (0.2480) and a kurtosis close to zero (−0.0865). The Jarque–Bera test confirms that both datasets significantly deviate from a normal distribution. Moreover, the Augmented Dickey–Fuller (ADF) test results show that VIX data are stationary, whereas S&P 500 data are nonstationary. These findings highlight the necessity of proper preprocessing techniques, such as VMD, to address the nonstationary characteristics of the S&P 500 data and account for extreme events in the VIX data.
3.2. The Baseline Methodologies
In this section, we provide a brief overview of the methodologies that form the foundation of the proposed model. Specifically, we introduce and explain VMD, LSTM, Cascaded LSTM, and the Attention mechanism.
3.2.1. VMD
VMD is a decomposition technique frequently utilized in the analysis of nonstationary signals. It decomposes complex signals with various frequency components into multiple narrow-band modes. This method was proposed to overcome the drawbacks of the traditionally widely used EMD. In EMD, issues such as mode mixing, boundary effects, and sensitivity to noise have been identified during the sequential decomposition of the signal into IMFs. VMD mitigates these problems by adopting a variational optimization approach to simultaneously estimate the modes. Here, the concept of variational optimization means setting an objective function to efficiently identify multiple narrow-band components inherent in the signal and minimizing it through an iterative update process.
The core idea pursued by VMD is to express the original signal as a sum of multiple modes, each assumed to be a narrow-band component with a central frequency, while simultaneously updating all modes. Mathematically, the given signal
can be represented as the sum of
K modes
and their corresponding central frequencies
:
VMD is formulated as an optimization problem that minimizes the following objective function to ensure each mode
maintains narrow-band characteristics:
The algorithm initializes the central frequencies and the initial modes . It then iteratively performs mode updates, recalculates the central frequencies, and updates the Lagrange multipliers and penalty parameters. The process continues until the rate of change falls below a threshold or a maximum number of iterations is reached, resulting in the convergence to the final modes. To ensure that the sum of the decomposed modes matches the original signal, Lagrange multipliers are introduced to impose this constraint, and penalty terms are used to maintain accuracy.
Unlike traditional EMD, which extracts one mode at a time, VMD simultaneously optimizes a predetermined number of modes that interact with each other. This simultaneous optimization reduces interference between modes and enhances robustness against noise. In the frequency domain, VMD updates each mode’s frequency component and recalculates the central frequency to maintain narrow-band characteristics. When applying VMD, several key parameters must be appropriately set. The most important parameter is the number of modes to decompose, which should be chosen based on the frequency characteristics of the signal to achieve proper decomposition. Additionally, the penalty parameter controls the narrow-bandness of the modes and is typically set empirically or determined through cross-validation to find the optimal value.
3.2.2. LSTM
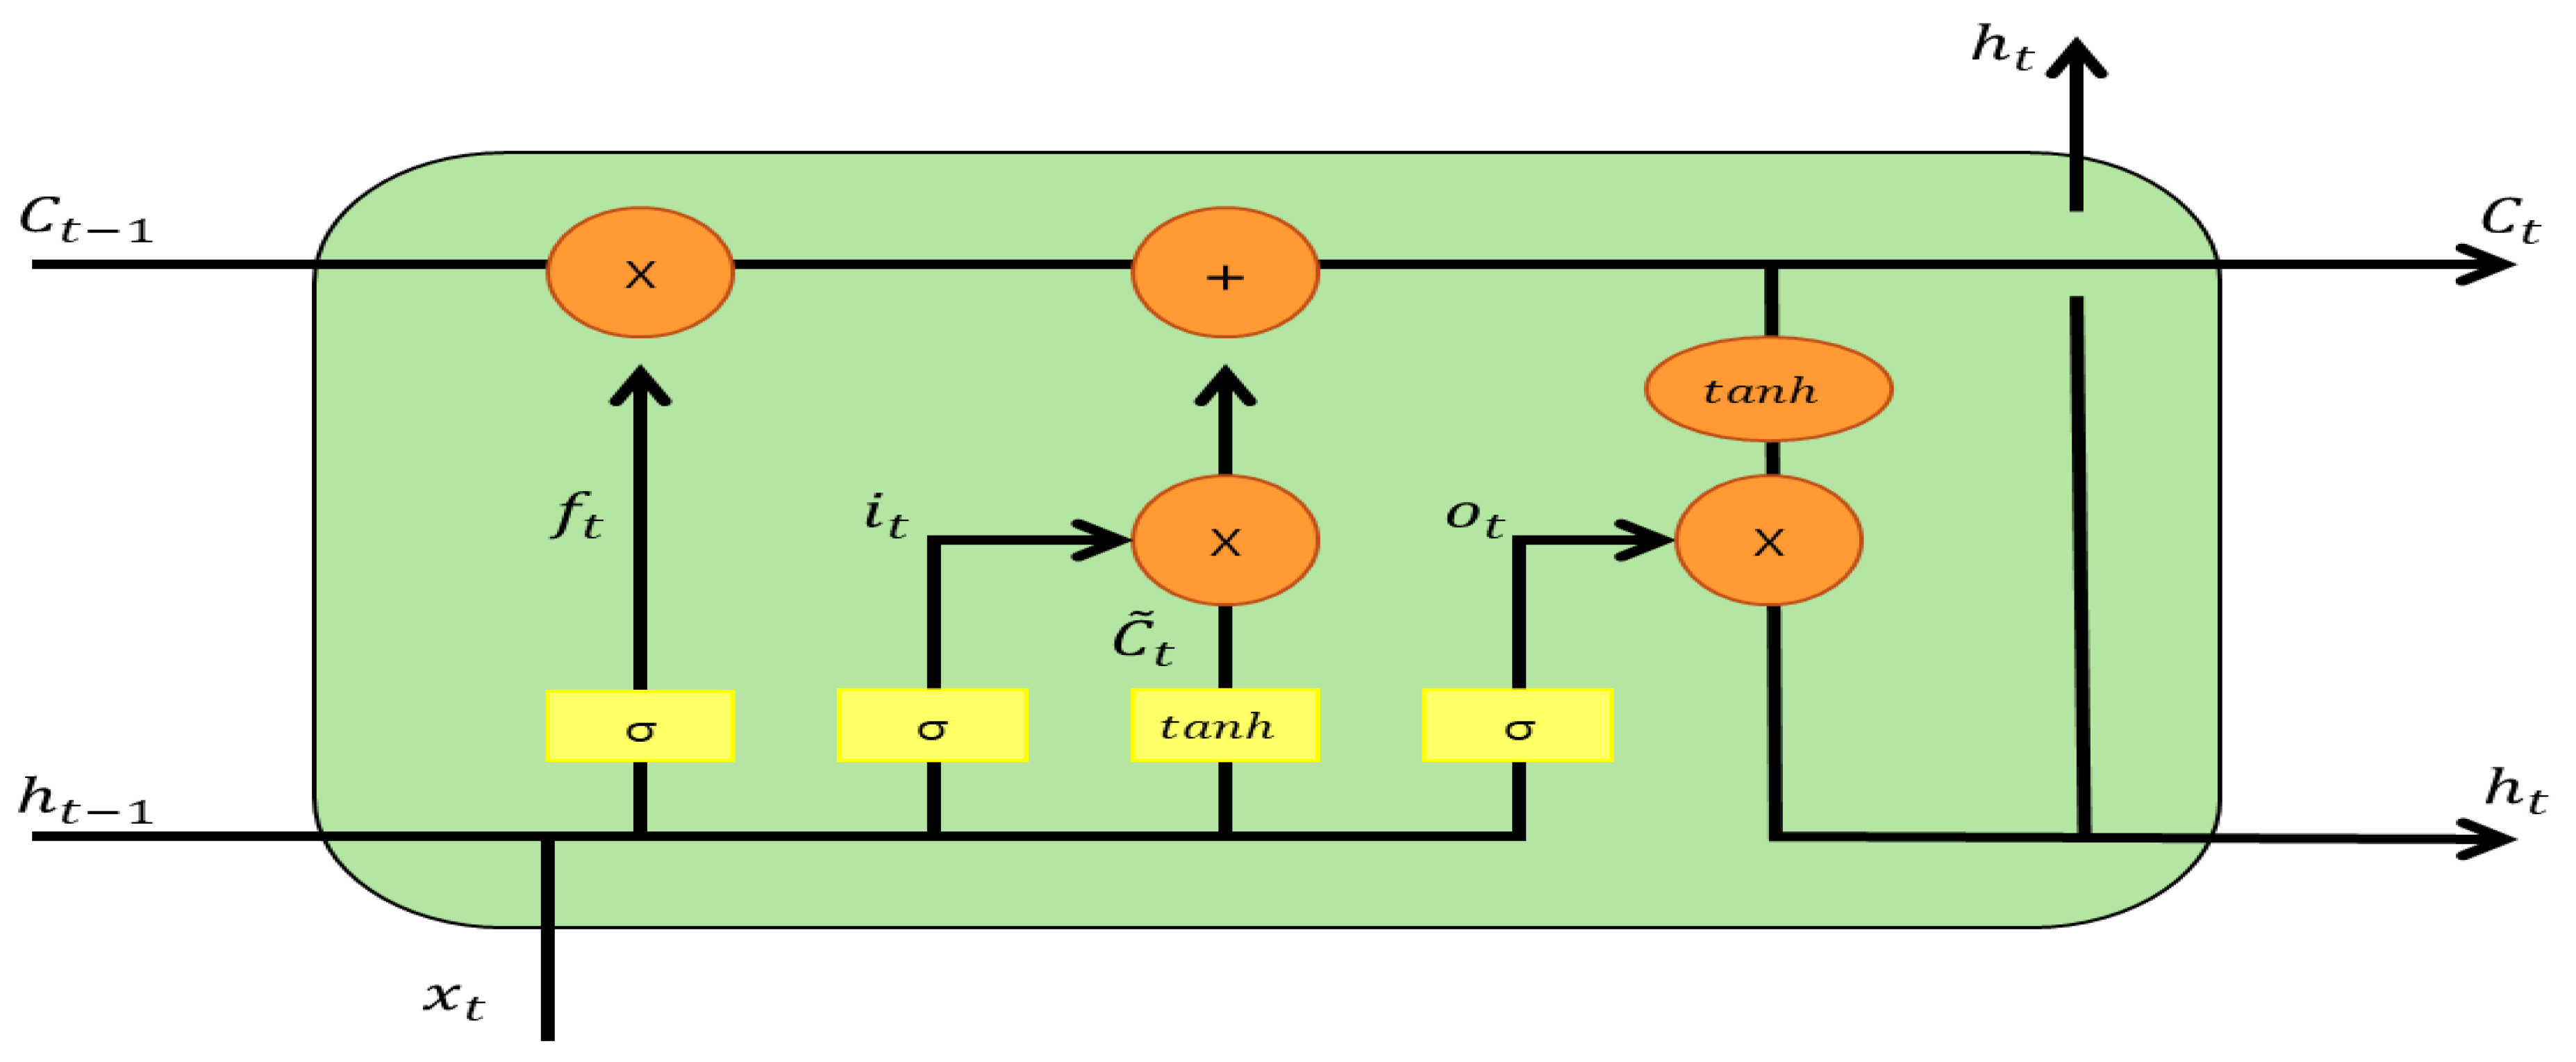
LSTM is a representative model designed to address the ‘Gradient Vanishing’ problem that arises in RNNs. Traditional RNNs adopt a simple structure where, at each time step, input information and the previous hidden state are combined to produce a new hidden state. However, as the sequence lengthens, gradients can vanish or explode during the backpropagation process, leading to the inability to properly learn important past information. In contrast, LSTM is designed with a separate pathway called the cell state, which allows the preservation of long-term information. To achieve this, it introduces several gates that serve as key mechanisms. These gates, primarily the input gate, forget gate, and output gate, finely regulate the incoming information, the information to be retained, and the information to be output, thereby ensuring that significant information is maintained even in long sequences.
In an LSTM cell, at time step
t, let the input vector be
, the previous hidden state be
, and the cell state maintained up to the previous time step be
. First, the forget gate is calculated as follows. The forget gate determines which parts of the cell state from the previous time step
should be erased. Next, the input gate decides how much new information from the current input should be added to the cell state, during which the potential candidate information
is created through the hyperbolic tangent (tanh) function. Subsequently, the updated cell state
is determined by combining the values calculated by the forget gate and the input gate. Finally, the output gate selects which information from the updated cell state should be exposed to the hidden state, thereby producing the final hidden state
. In summary, at each time step, the gates and the cell and hidden states follow the flow illustrated below (where
denotes the sigmoid function and tanh represents the hyperbolic tangent function):
Figure 2 illustrates the role of each gate in the above equations. Here, the forget gate
determines the proportion of the previous cell state
that should be erased, removing unnecessary or outdated information. The input gate
decides how much new information to incorporate into the cell state, and
represents the candidate information to be added. The cell state
is obtained by combining the retained part from the previous state (
) and the new incoming part (
). The output gate
determines the extent to which the updated cell state is reflected in the hidden state
. By dividing the roles across different gates and finely controlling the information flow, LSTM can effectively preserve and utilize essential past information even in very long sequences.
When modeling an actual LSTM, various hyperparameters such as the dimensionality of the hidden state, the initialization methods for each gate’s parameters, and the learning rate must be set. It is necessary to find appropriate values tailored to the characteristics of the data. Additionally, since the gate structures themselves use many parameters, overfitting can occur if there are insufficient data or if the model size becomes excessively large. Therefore, regularization techniques are often employed in conjunction.
3.2.3. Cascade LSTM
Cascade LSTM is an extended version of the basic LSTM structure, consisting of multiple stacked layers of LSTM cells. It combines the expressive power of deep neural networks with the inherent sequence processing capabilities of LSTM. While traditional single-layer LSTMs utilize cell states and gates to maintain important past information in long sequences, they are limited by a simple path where inputs and outputs are connected only once. In contrast, Cascade LSTM connects multiple layers of LSTM in series, allowing higher layers to further process and interpret the time-series patterns extracted by lower layers. This enables the model to learn more complex and abstract sequential structures.
Each layer in a Cascade LSTM performs the same computational processes as a basic LSTM cell. At time step
t, let the input to layer
l be
, and the previous hidden state and cell state be
and
, respectively. First, the forget gate (forget gate) is calculated as follows:
The forget gate determines which parts of the previously accumulated cell state should be erased to prevent excessive accumulation of information. Next, the input gate decides how much new input to accept, and the potential cell state candidate
is generated through the hyperbolic tangent function:
Combining these, the new cell state
is determined by summing the retained part of the previous cell state (
) and the newly incoming part (
):
Finally, the output gate (output gate) selects which information from the updated cell state should be exposed to the hidden state:
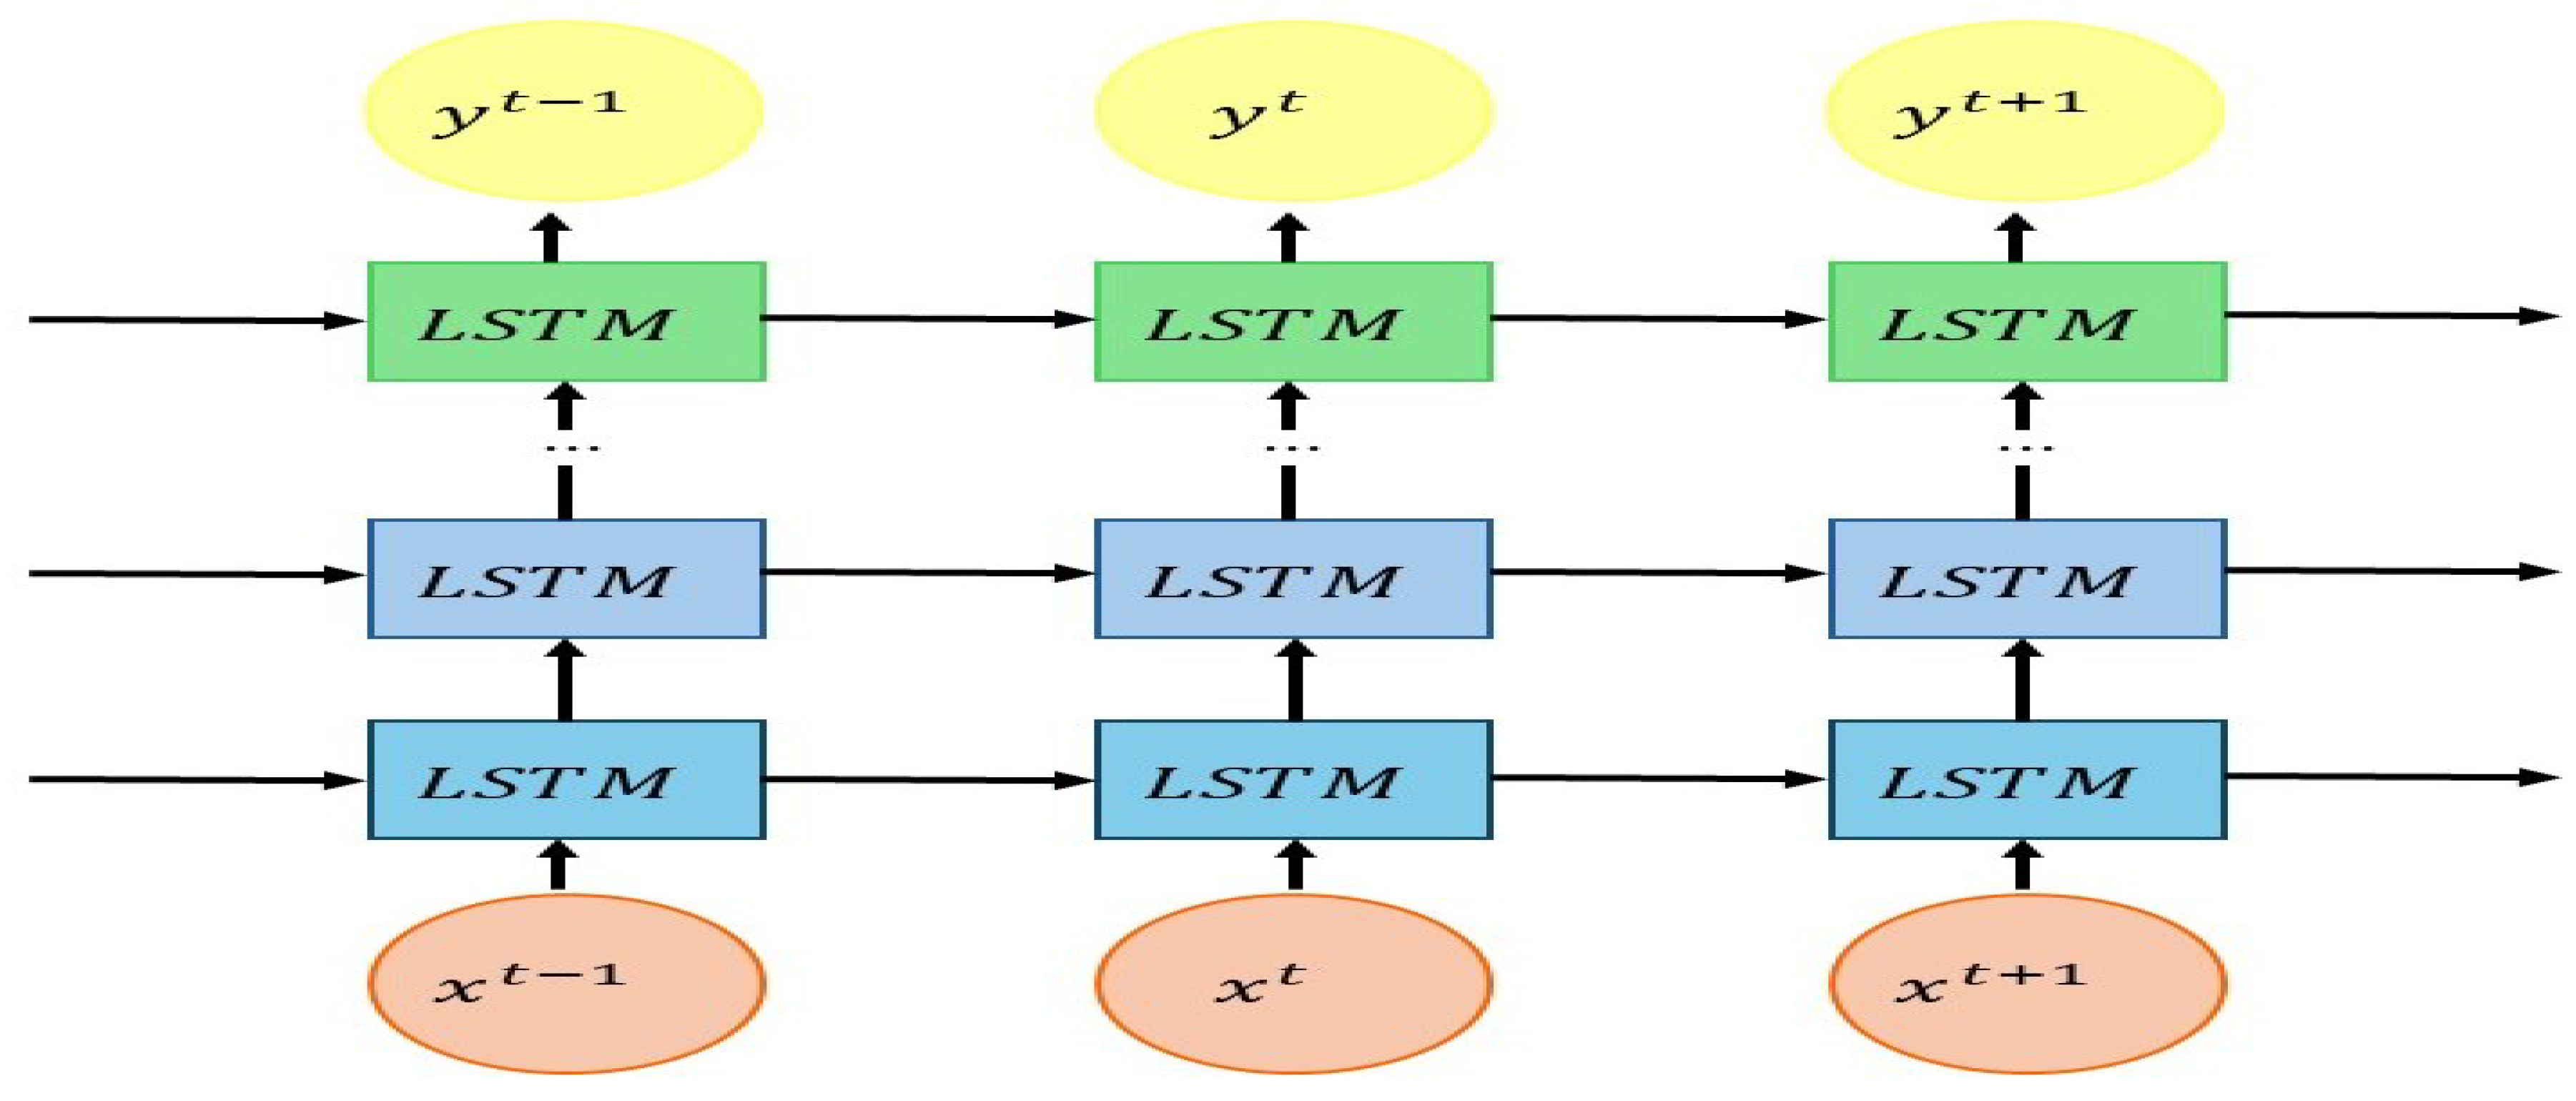
The resulting hidden state is immediately passed to the next time step within the same layer and, if the current layer is the l-th layer, it serves as the input for the upper layer. Therefore, in Cascade LSTM, as the layers deepen, they produce richer time-series representations and contextual information, which demonstrates excellent performance on data with high complexity.
Figure 3 visualizes the overall structure of the Cascade LSTM. The input
at time step
t passes through multiple layers of LSTM cells in sequence to produce the final output
. The greatest advantage of the Cascade LSTM is that it provides a much more flexible and powerful representational capacity compared to a simple LSTM. This offers a significant benefit in tasks where understanding long-term context is crucial. By stacking layers in depth so that each layer further processes features extracted from the previous layer, the Cascade LSTM can learn richer and more complex patterns than a simple LSTM. However, as the number of layers increases, the number of model parameters can grow exponentially. Moreover, the final performance can vary greatly depending on hyperparameters such as the model architecture, learning rate, and batch size. Therefore, careful tuning is required to match the given problem and data characteristics.
In summary, Cascade LSTM effectively handles complex sequential problems by maximizing the benefits of mitigating gradient vanishing and managing long-term dependencies inherent in single LSTMs, combined with the advantages of hierarchical abstraction provided by multiple layers. It is a powerful model capable of effectively dealing with intricate sequence issues.
3.2.4. Attention
The Attention mechanism is a technique designed to allow models, particularly in various deep learning fields such as Natural Language Processing (NLP), to ‘focus’ on specific parts of the input sequence that are especially important for the current output. Originally developed to address the issue in RNN-based machine translation models (Sequence-to-Sequence structures) where treating all words in a long sentence with equal importance could lead to missing crucial information, the Attention mechanism calculates the interrelationships among all positions in a sequence through relatively simple computations. By assigning higher weights to important positions, it enables the model to accurately grasp the context. This process primarily involves three components: ‘Query’, ‘Key’, and ‘Value’ vectors. The Query represents what information needs to be found, the Key represents what information is held, and the Value represents the actual information to be referenced.
Specifically, when calculating Attention at time step
t, the Query
, Key
, and Value
are derived for each element in the input sequence. The similarity between the Query and each Key is measured by taking their dot product, followed by normalization into a probability distribution using the softmax function. This distribution indicates where the model should focus, with higher probabilities indicating greater importance. Finally, this probability distribution is used to compute a weighted sum of the Value vectors, resulting in a ’Context’ vector that the model can reference. The following equation outlines how Attention values are computed at each time step:
Here, is the square root of the dimension of the Query and Key vectors, used to prevent scaling issues that can arise when the dot product becomes large. If multiple heads are used to compute Attention from different perspectives and their results are then combined, this approach is referred to as ‘Multi-Head Attention’.
By incorporating the Attention mechanism, models can focus on specific parts of the sequence, allowing them to effectively maintain contextual clues even in long sentences or large-scale time-series data. This significantly mitigates the issues of gradient vanishing and the need to compress all information into a single hidden state that were prevalent in previous RNN-based structures.
3.3. Proposed Model
Despite substantial advances engendered by the deployment of LSTM architectures augmented with attention mechanisms in financial forecasting, extant studies continue to exhibit several critical shortcomings. Predominantly, existing approaches emphasize short-term trend extrapolation [
32], while under-representing the modeling of long-range sequential dependencies that are pivotal for capturing macro-scale market dynamics [
11,
12]. Although Attention layers mitigate this to an extent by adaptively weighting temporal features, they remain insufficient for discerning multi-scale temporal structures and attenuating high-frequency, noise-induced artifacts inherent in raw financial time series. Moreover, a sizable portion of attention-based frameworks operate on raw, untransformed sequences laden with nonstationary components and stochastic volatilities leading to pronounced overfitting and performance instability under volatile market conditions [
33,
34]. Finally, most prior investigations are constrained to univariate or sparsely multivariate models, thereby failing to capture synergistic interactions between critical market indicators such as the S&P 500 and the VIX index [
35,
36]. To address these limitations, we advocate for the integration of signal decomposition techniques such as VMD that deconstruct financial series into denoised, frequency-specific modes prior to the application of attention, thereby furnishing models with stable, information-rich feature representations [
37,
38].
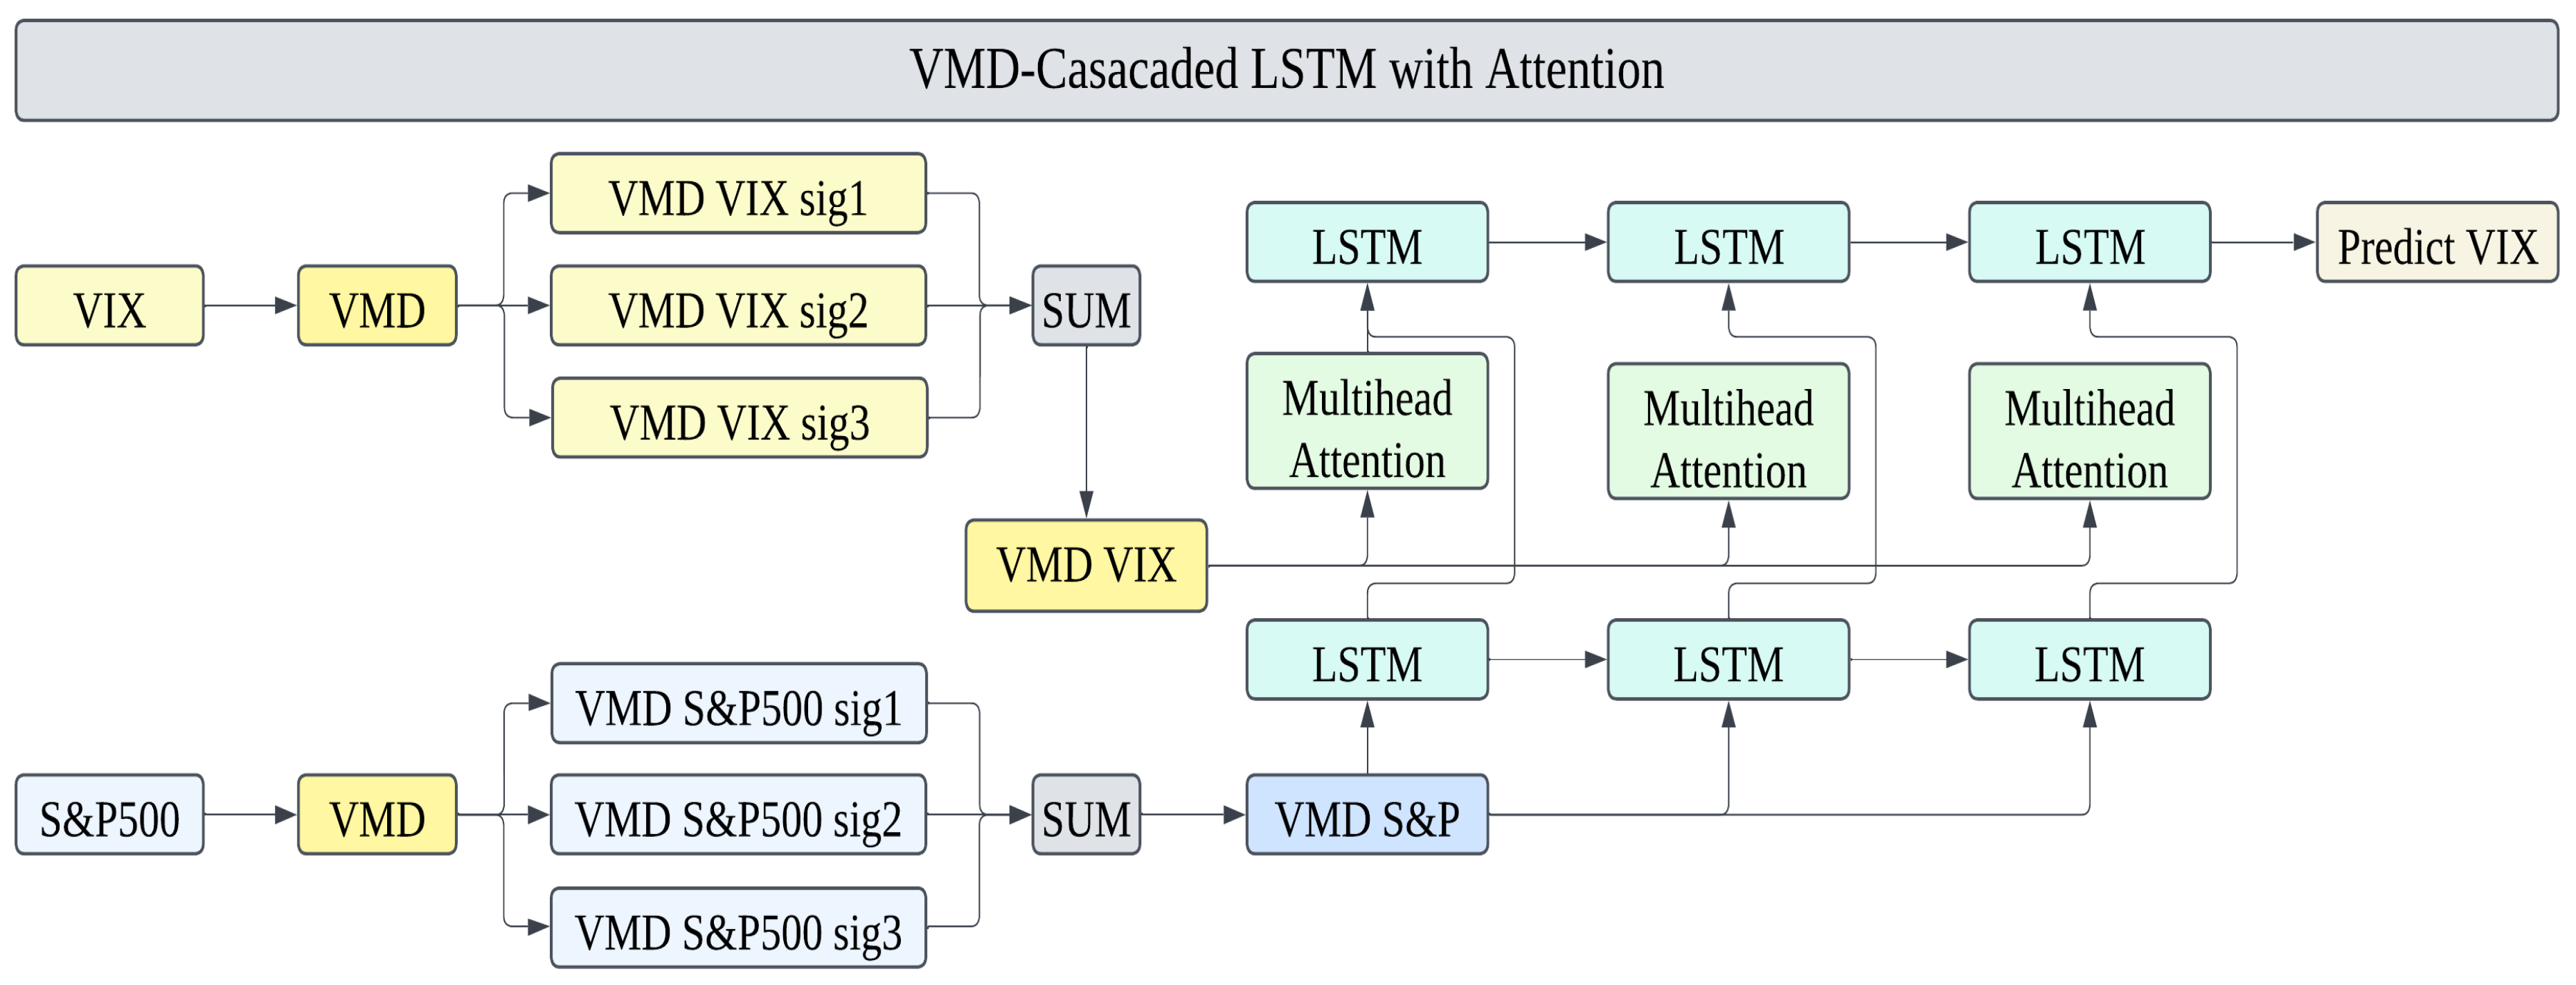
In this study, we propose the VMD-Cascaded LSTM with Attention model to improve the stability and accuracy of VIX volatility predictions. The overall structure of the model is shown in
Figure 4.
The proposed model consists of two main stages. In the first stage, the S&P 500 close data are decomposed using VMD, generating multi-scale features represented as VMD-extracted S&P 500 features. These features are then fed into the first LSTM layer, which captures the initial temporal patterns of the market. This design leverages the S&P 500 data as a representation of market trends and ensures that key temporal dependencies are learned effectively.
In the second stage, the VIX close data are also processed through VMD, producing VMD-extracted VIX features. These data are then passed through a Multi-Head Attention mechanism, which dynamically emphasize critical features within the VMD-extracted VIX features. The enhanced features are subsequently used as inputs to the second LSTM layer, which refines the patterns learned from the first stage and integrates them with the newly emphasized VIX features. This hierarchical structure stabilizes the learning process and ensures more precise predictions of VIX volatility. The detailed architecture of the proposed model is already illustrated in
Figure 4, which captures both stages of the VMD-Cascaded LSTM with Attention structure. As shown in the figure, the first stage begins with the decomposition of the S&P 500 data into its VMD modes (sig1, sig2, sig3), which are then summed to form VMD S&P 500 data. These data are input to the first LSTM layer, where primary temporal patterns are captured. Simultaneously, the VIX data are decomposed into its VMD modes and summed to produce VMD VIX data, which serves as the input to the Multi-Head Attention mechanism. The Attention mechanism dynamically highlights the most critical features within the VMD VIX data, which are passed to the second LSTM layer as features for further learning.
The dimension transformations in the proposed model play a crucial role in ensuring seamless data flow between different layers. After the first LSTM layer processes the VMD S&P 500 data, it outputs a 2D tensor in the form . To prepare this output for subsequent integration, it is flattened into a 2D structure. Simultaneously, the VIX data, initially represented as a 3D tensor , are reshaped into a 2D tensor .
These two datasets are horizontally concatenated (hstack), resulting in a unified 2D tensor of the form . This integration merges the temporal patterns learned from the S&P 500 data and the inherent characteristics of the VIX data into a single feature representation. The concatenated input enables the second LSTM layer to effectively model interactions between market trends and volatility patterns, enhancing the overall prediction capability of the model.
By combining the temporal patterns learned from the S&P 500 data and the emphasized features from the VIX data, the second LSTM layer generates a refined output that predicts VIX volatility with greater stability and precision. This cascaded approach ensures that the model effectively captures both market-wide trends and volatility-specific patterns.
The proposed model integrates the strengths of VMD for multi-scale feature decomposition, the hierarchical learning of Cascaded LSTM, and the feature enhancement capabilities of Multi-Head Attention. Together, these components form a robust framework designed to provide reliable and accurate predictions of VIX volatility.
4. Empirical Results
4.1. Experimental Design
This study uses VIX close data and S&P 500 close data obtained from Yahoo Finance, covering the period from 1 January 2020 to 31 December 2024. The dataset contains daily closing prices, which were divided into a training set (80%, 2020–2023) and a test set (20%, 2024). All data were normalized to ensure consistent feature scaling.
The raw closing prices of VIX and S&P 500 were first normalized using Z-score standardization (mean 0, standard deviation 1). Missing values were handled by simple row deletion, as they were sparse and did not significantly affect the time-series continuity. The dataset was split chronologically to prevent future information leakage. The last year (2024) was used exclusively as the out-of-sample test set to ensure realistic evaluation.
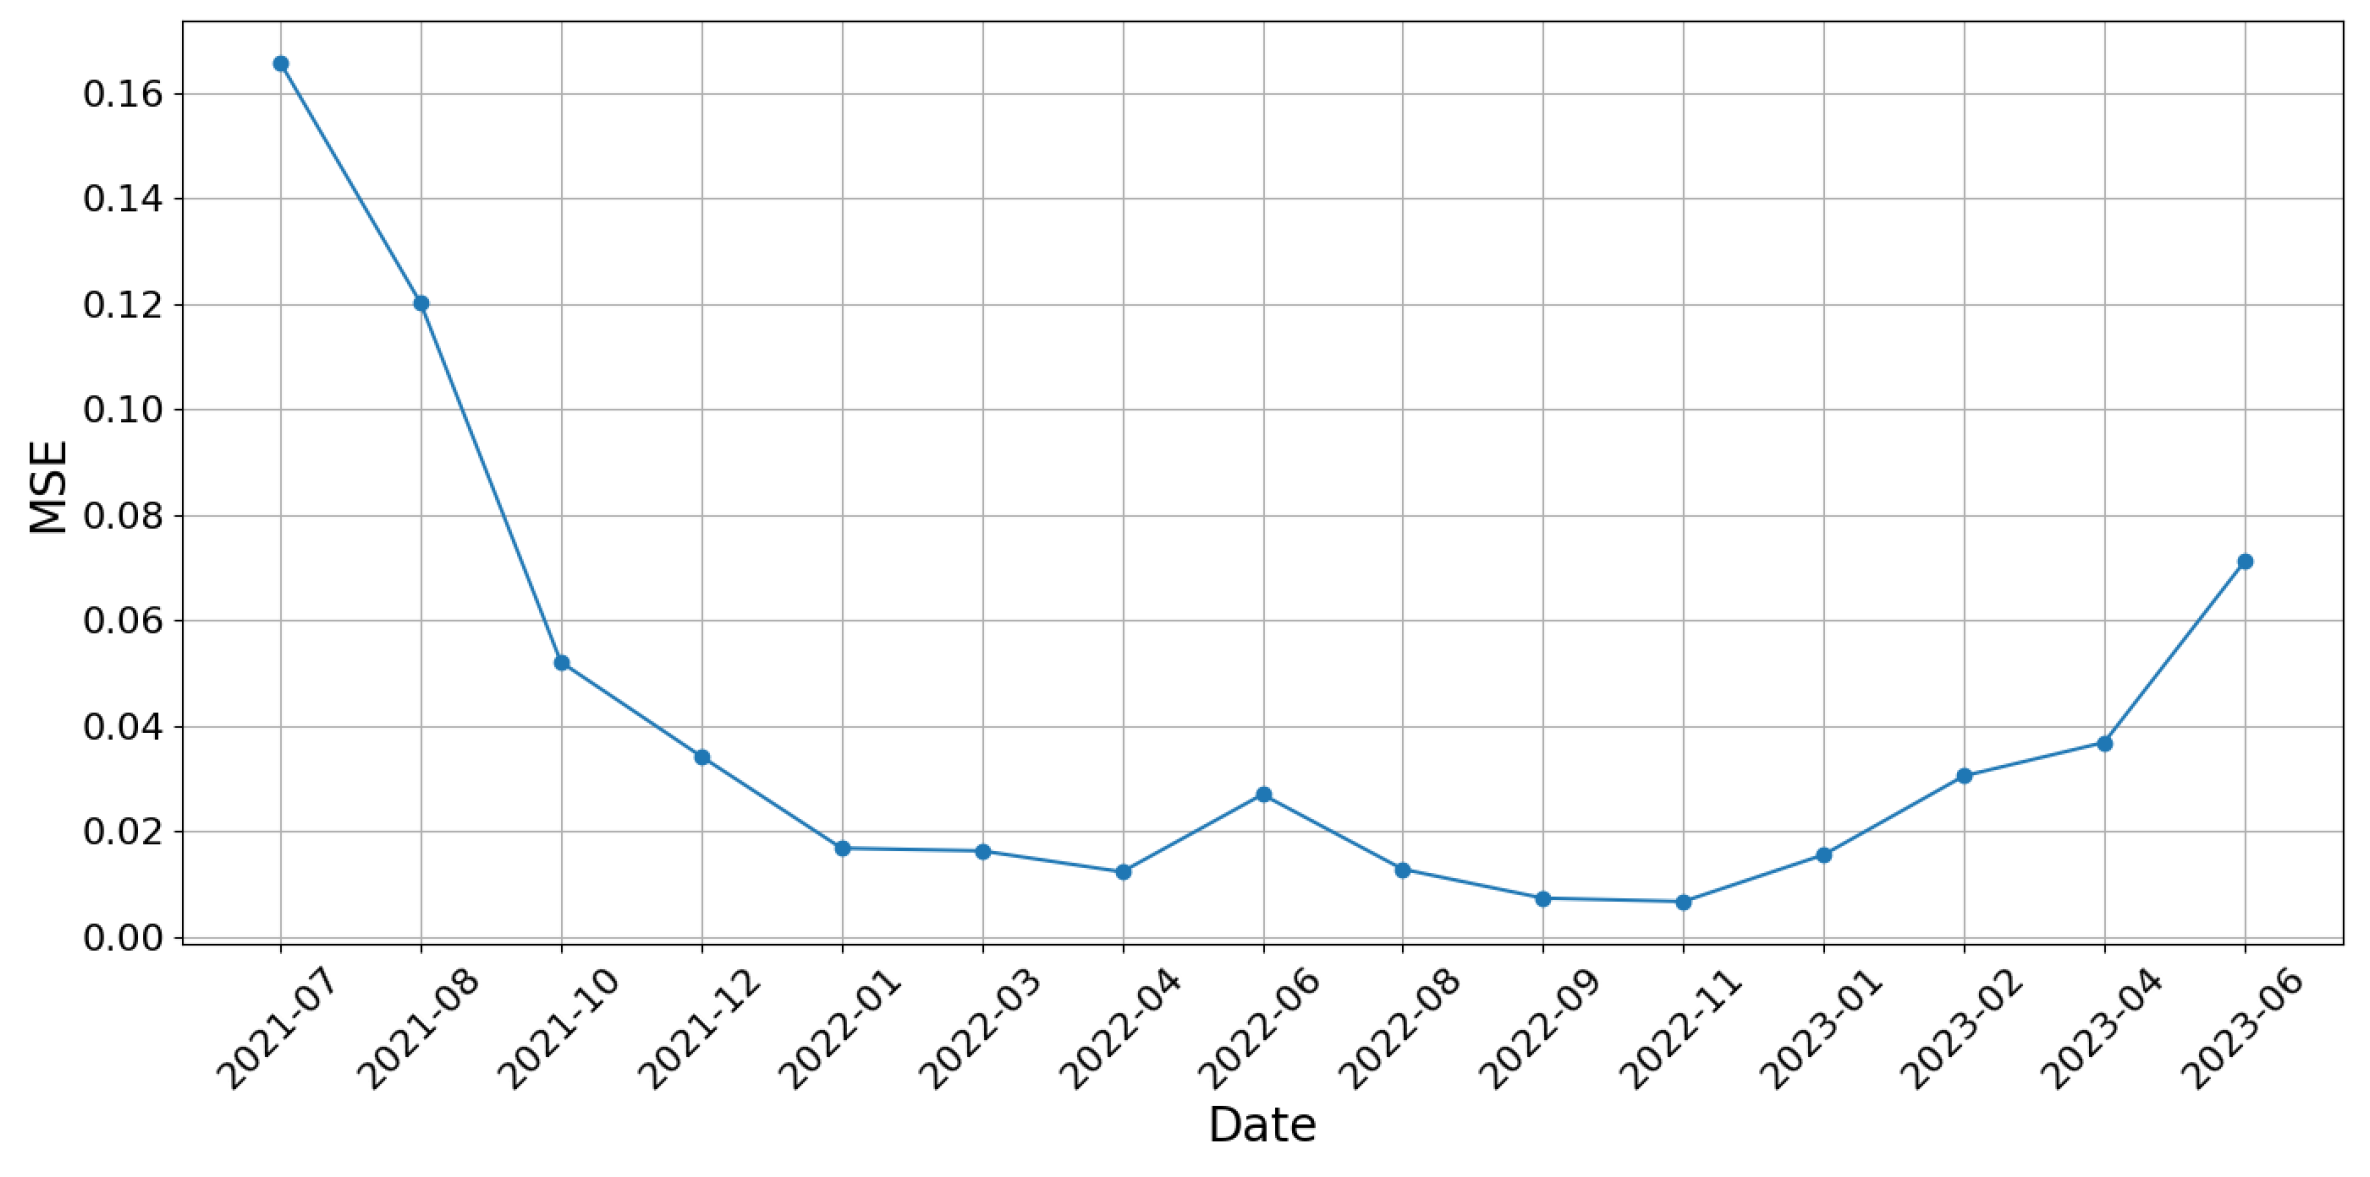
To evaluate the model’s robustness across different time periods, a rolling-window backtest was additionally conducted. This test design allows the model to be exposed to various market conditions, including periods of high volatility. The relatively consistent MSE trends suggest strong generalization capabilities. In this approach, the training and testing windows were shifted across the time series using a fixed-size scheme (500-day training, 50-day testing). At each step, the model was retrained and evaluated on new out-of-sample data. This method enables a more comprehensive understanding of temporal generalization performance.
Figure 5 presents the MSE values for each step of the rolling-window evaluation. The model maintains stable predictive accuracy across most periods, though slight performance degradation is observed during highly volatile intervals (e.g., mid-2021 and mid-2023), consistent with expectations in financial time-series forecasting.
The proposed model consists of two primary stages. First, the S&P 500 and VIX data are decomposed using VMD, generating multiple IMFs that capture different frequency components of the original signals. These IMFs provide multi-scale features that enhance the model’s ability to learn temporal dependencies effectively.
To generate these IMFs, appropriate configuration of the VMD parameters is crucial. In this study, the number of modes
K and the penalty parameter
for VMD were set to 3 and 2000, respectively. The value of
was determined empirically through preliminary experiments, as it offered a favorable trade-off between decomposition granularity and predictive performance in our dataset. Meanwhile,
was selected based on prior literature; notably, Zuo et al. [
39] employed the same value in a two-stage VMD framework for streamflow forecasting, where it proved effective in achieving stable mode separation without introducing excessive smoothing. Maintaining these fixed parameter values across all experiments ensured consistency when comparing different model configurations. A more detailed sensitivity analysis on
K and
will be considered in future work to further examine the robustness of these choices.
Figure 6 illustrates the decomposed IMFs of the VIX and S&P 500 data. The left column represents the IMFs of VIX, while the right column shows those of the S&P 500. The first IMF captures high-frequency fluctuations, while the subsequent IMFs reveal lower-frequency trends and long-term patterns. By leveraging these multi-resolution representations, the model ensures that both short-term volatility and long-term market trends are incorporated into the forecasting process.
In the first processing stage, the aggregated VMD components of the S&P 500 (VMD S&P 500) are passed through an LSTM layer, which captures sequential dependencies and extracts essential trend information. Meanwhile, the aggregated VMD components of the VIX (VMD VIX) are processed separately using a Multi-Head Attention mechanism, enhancing the model’s ability to focus on critical patterns in market volatility. In the second stage, the outputs from these two processes—the LSTM-extracted features from VMD S&P 500 and the Attention-enhanced features from VMD VIX—are combined and fed into another LSTM layer. This final LSTM layer integrates information from both market trends and volatility fluctuations, further refining the VIX prediction.
Furthermore, we applied Random Grid Search to explore the hyperparameter space of the Cascaded LSTM model. This process was conducted separately for the first and second layers of the model, as well as for the Multi-Head Attention mechanism embedded in the second layer. For the first layer, which processes S&P 500 data, we tuned key parameters such as the number of LSTM units, dense units, batch size, and epochs. Likewise, for the second layer—which integrates VIX data along with the output from the first layer—additional parameters, including the number of attention heads and input dimensions, were optimized.
The number of Attention heads was determined via hyperparameter tuning using a Random Search strategy, exploring values between 2 and 8 heads. While an explicit ablation study isolating the number of heads was not separately conducted, the tuning process inherently evaluated different configurations and selected the optimal setting based on validation loss.
The search space for each hyperparameter was predefined based on prior knowledge and computational constraints. The random grid search method allowed efficient exploration of the parameter space without the exhaustive computational cost of a full grid search. The tuned parameters ensured that both the hierarchical and Attention-based features of the model were leveraged effectively.
Table 2 outlines the search space and the optimal configurations for both LSTM layers and the Attention mechanism.
To ensure optimal performance of the proposed model, a random search strategy was employed to explore the hyperparameter space, using an 80/20 train-validation split within the training data (2020–2023).
Table 2 summarizes the search space and the optimal values selected for both the first and second layers of the model. The first layer, which processes VMD-transformed S&P 500 data, was configured with 32 LSTM units and 48 dense units, using a batch size of 64 and 5 training epochs. The second layer, which integrates both VMD VIX features and outputs from the first layer, was tuned with 80 LSTM units, 6 attention heads, and a smaller batch size of 32 to facilitate convergence. Beyond architectural hyperparameters,
Table 3 details the full configuration used during training and evaluation. The model employed the Adam optimizer with a learning rate of 0.001, and dropout (rate = 0.2) was applied in the first LSTM layer to mitigate overfitting. L2 regularization was also applied in the dense layers to enhance generalization. Early stopping with a patience of 5 was used to halt training when validation loss stopped improving. These settings reflect a balance between model complexity and stability, ensuring that the model remains both expressive and robust under real-world market volatility. To prevent overfitting, we adopted multiple regularization techniques including dropout (rate = 0.2), L2 weight decay in dense layers, early stopping (patience = 5), and an 80/20 train-validation split during hyperparameter tuning.
In response to concerns about implementation transparency, we provide the complete model configuration details in
Table 3, including optimizer settings, learning rates, dropout usage, and early stopping criteria.
To evaluate the effectiveness of the proposed model, we compare it against seven benchmark models. Transformer-based architectures have gained considerable attention in recent time-series forecasting research due to their strong ability to model long-term dependencies. The self-attention mechanism enables dynamic learning of relationships across all time steps in a sequence. However, its computational complexity grows quadratically with the sequence length (), making it computationally expensive for long time series. Moreover, in domains like financial time series where data are often limited, such complex models are prone to overfitting, and their theoretical advantages may not translate into practical performance gains.
Likewise, hybrid CNN-LSTM models can capture both local patterns and temporal dynamics. Nevertheless, their structural complexity and the extensive hyperparameter tuning they require make fair and reproducible comparisons difficult, especially under constrained computational resources.
Given these limitations, we adopt a VMD-Cascaded LSTM architecture with integrated Multi-Head Attention, instead of employing full Transformer or CNN-LSTM models. In our framework, the original time series is first decomposed using VMD, which separates the signal into multiple IMFs that represent different frequency components. These IMFs are then modeled using a Cascaded LSTM structure to hierarchically learn temporal dependencies. Multi-Head Attention is incorporated to allow the model to focus dynamically on informative time steps during prediction. This architecture captures the core benefits of attention mechanisms while maintaining suitability for nonstationary, data-constrained time-series environments. As such, the proposed model achieves a balanced trade-off between computational efficiency and forecasting performance.
These models are chosen to systematically analyze the impact of three key components:
The effect of VMD on predictive performance;
The influence of hyperparameter tuning across layers;
The contribution of the Attention mechanism in improving volatility forecasting.
The baseline models, LSTM1 and LSTM2, tests the performance of standard LSTM architectures without VMD. VMD LSTM models evaluate how feature decomposition affects prediction accuracy, differentiating between configurations that use only VMD S&P 500 data and those incorporating VMD VIX components. Finally, the VMD-Cascaded LSTM models assess the performance gains from cascading multiple LSTM layers and applying the Attention mechanism.
The details of these models are as follows:
LSTM1: Predicts VIX using S&P 500 data with first-layer hyperparameter tuning. This model serves as a baseline LSTM model without VMD, helping to assess the effectiveness of feature extraction from raw S&P 500 data.
LSTM2: Predicts VIX using S&P 500 data with second-layer hyperparameter tuning. Similar to LSTM1 but with different hyperparameter tuning in the second layer, this model helps analyze the influence of hyperparameter optimization across layers.
VMD LSTM 1 (1,1): Predicts VMD-decomposed VIX using VMD-decomposed S&P 500 data with first-layer hyperparameter tuning. This model introduces VMD to both input sources (S&P 500 and VIX) and allows evaluation of whether decomposing financial time-series data enhances prediction accuracy.
VMD LSTM 1 (2,1): Predicts VMD-decomposed VIX using VMD-decomposed S&P 500 data and VMD VIX features with first-layer hyperparameter tuning. This model additionally incorporates decomposed VIX features, enabling an assessment of how including VIX-specific components improves volatility prediction.
VMD LSTM 2 (1,1): Predicts VMD-decomposed VIX using VMD-decomposed S&P 500 data with second-layer hyperparameter tuning. By adjusting hyperparameters in the second layer, this model tests the sensitivity of deep learning parameter configurations in VMD-enhanced architectures.
VMD LSTM 2 (2,1): Predicts VMD-decomposed VIX using VMD-decomposed S&P 500 data and VMD VIX features with second-layer hyperparameter tuning. This model represents a more refined approach by incorporating decomposed VIX features while fine-tuning deeper network layers, assessing the synergy between feature engineering and model optimization.
VMD-Cascaded LSTM: Implements the proposed architecture without the Attention mechanism. This model serves as a key benchmark to measure the contribution of the Attention mechanism in capturing critical market dependencies and improving VIX prediction.
All models were evaluated using three metrics: MSE, RMSE, and MAE. These metrics assess the prediction accuracy by quantifying the difference between predicted and actual values.
Mean Squared Error (MSE): Measures the average squared difference between predicted and actual values. It penalizes larger errors more heavily, making it sensitive to outliers.
Root Mean Squared Error (RMSE): The square root of MSE, providing an error measure in the same unit as the target variable. It retains the sensitivity to large errors while improving interpretability.
Mean Absolute Error (MAE): Measures the average absolute difference between predicted and actual values. Unlike MSE, it treats all errors linearly, making it more robust to outliers.
4.2. Key Results
In this section, we conduct VIX prediction using the proposed model and benchmark models, presenting the results accordingly. First,
Figure 7 visualizes the prediction results of the proposed model, further demonstrating its ability to capture market volatility patterns effectively. The figure highlights that the VMD-Cascaded LSTM with Attention model closely follows actual VIX movements, indicating its robustness in capturing complex financial time-series dynamics. The combination of VMD, cascaded LSTM, and Attention allows the model to extract relevant features while mitigating noise, leading to improved predictive accuracy.
Furthermore,
Figure 8 illustrates the results of hyperparameter tuning for each benchmark model, providing a visual comparison of their predictive performance. The results show that different architectures respond differently to hyperparameter optimization. While some models exhibit noticeable improvements after tuning, others show limited gains. For example, VMD LSTM 1 (2,1) and VMD LSTM 2 (2,1), which utilize additional input features, demonstrate enhanced performance compared to basic LSTM models. However, even after tuning, their prediction errors remain higher than those of the proposed model, reaffirming the effectiveness of combining VMD with Attention in reducing prediction errors.
Finally,
Table 4 compares the proposed model with seven benchmark models across three evaluation metrics. The proposed model achieves the best performance, demonstrating the effectiveness of combining VMD with Cascaded LSTM and Attention mechanisms. Specifically, the VMD-Cascaded LSTM with Attention model achieves the lowest MSE (0.0018), RMSE (0.0427), and MAE (0.0316) among all models, significantly outperforming the VMD-Cascaded LSTM model, which recorded MSE (0.0532), RMSE (0.2306), and MAE (0.1305). These results emphasize that the integration of Attention further refines the predictive capability of VMD-based LSTM models by allowing the model to focus on key temporal dependencies, which is particularly beneficial in financial time-series forecasting. Moreover, compared to the best-performing benchmark model (VMD-Cascaded LSTM), the proposed model reduces MSE by approximately 96.6%, RMSE by 81.5%, and MAE by 75.8%, demonstrating the substantial improvement achieved by incorporating Attention. This reduction in prediction error highlights the significance of combining VMD with an advanced sequence-learning mechanism.
This reduction in prediction error highlights the significance of combining VMD with an advanced sequence-learning mechanism.
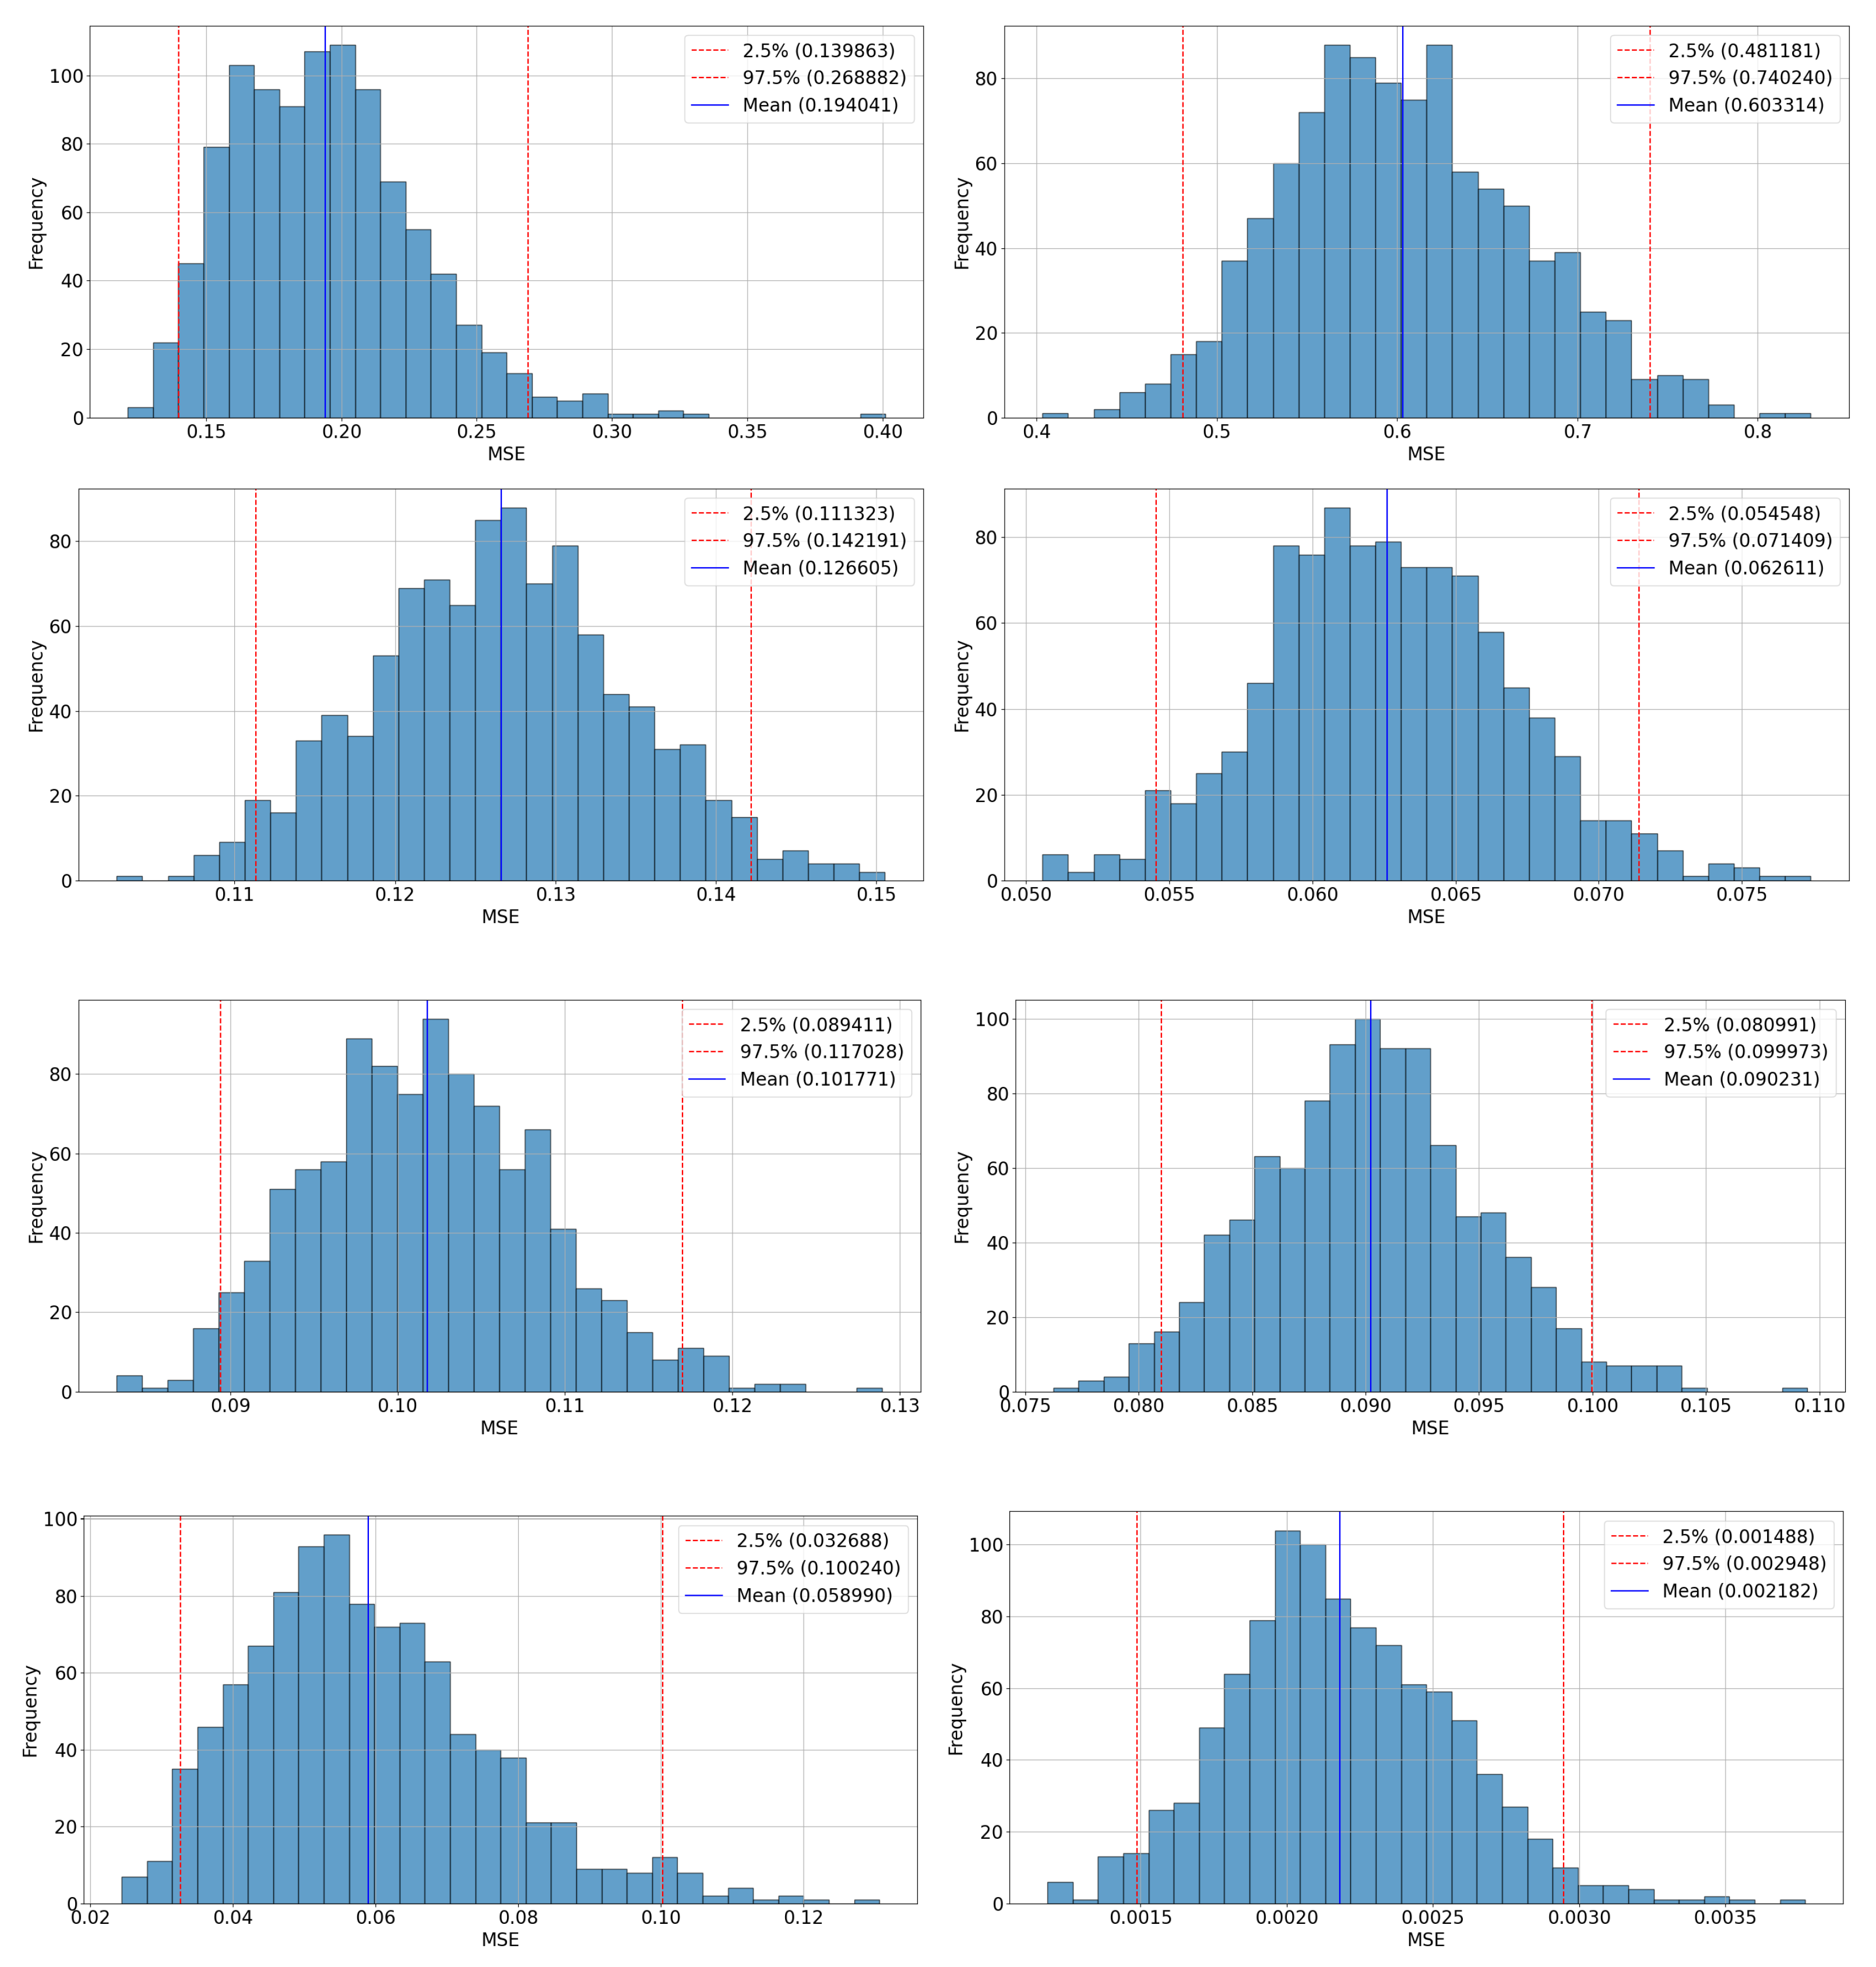
To evaluate the robustness of this substantial improvement, we conducted three complementary analyses. First, we constructed a bootstrap-based confidence interval for MSE, confirming that the low error value was not a result of statistical outliers. For example, the VMD-Cascaded LSTM with Attention model achieved a 95% confidence interval of [0.0015, 0.0030] for MSE (mean = 0.0023), significantly outperforming the next-best model (VMD-Cascaded LSTM), which recorded [0.0327, 0.1002] (mean = 0.0590). In contrast, basic LSTM baselines such as LSTM1 and LSTM2 yielded much higher intervals—[0.1399, 0.2689] and [0.4812, 0.7402], respectively—demonstrating the superior predictive stability of the proposed model.
Second, a rolling-window out-of-sample test was conducted to verify temporal generalization across different market conditions. The model maintained consistent performance across periods, with only slight degradation during highly volatile intervals.
Finally, prediction residuals were visualized both over time and as a distribution. The absence of systematic drift or extreme skew in the residuals indicates that the model does not overfit noise, further validating the robustness of the results.
These robustness checks collectively confirm that the significant performance improvements are not due to random chance or data leakage, but instead arise from the architectural advantages of combining VMD with Multi-Head Attention and a Cascaded LSTM framework.
The proposed model outperforms all benchmark models due to two key factors. First, VMD effectively decomposes the original signals into distinct IMFs, allowing the model to extract meaningful patterns while reducing noise. Previous studies have demonstrated that VMD improves predictive accuracy across various domains, including water quality forecasting [
15] and wind speed prediction [
16], by enhancing pattern recognition and filtering out noise. In the financial domain, decomposition-based approaches, such as VMD, have been shown to significantly enhance forecasting performance by isolating meaningful components from volatile market data [
17]. These findings further validate the effectiveness of VMD in financial time-series modeling, where capturing complex volatility patterns is essential.
Furthermore, VMD is particularly beneficial in financial markets, where price movements often exhibit nonstationary and highly volatile characteristics. By decomposing raw VIX data into multiple IMFs, the model can distinguish fundamental trends from short-term fluctuations, allowing for more stable and interpretable forecasting results. The effectiveness of this approach aligns with prior studies, demonstrating that decomposition-based forecasting methods significantly improve accuracy in volatile financial environments.
Multi-input structures such as VMD LSTM 1 (2,1) and VMD LSTM 2 (2,1) leverage both S&P 500 and VIX features, further enhancing predictive performance. However, despite these improvements, the absence of Attention in these models limits their ability to selectively focus on critical time steps, leading to suboptimal performance compared to the proposed approach.
Second, the Attention mechanism enables the model to prioritize critical parts of the data, capturing key patterns and temporal dependencies more effectively. Studies have shown that incorporating Attention into LSTM improves stock price prediction by allowing the model to focus on the most informative time steps [
12]. Attention networks have been found to enhance long-term trend forecasting by selectively emphasizing key sequential dependencies [
11]. Additionally, Attention mechanisms have been demonstrated to help capture complex financial patterns, mitigating short-term noise while preserving essential information [
21]. Similarly, an Attention-based LSTM model has been shown to dynamically adjust its focus, leading to more accurate and stable predictions [
5]. This selective attention leads to a significant reduction in prediction errors compared to models without it. By dynamically adjusting its focus on relevant time steps, the model mitigates the impact of short-term noise and better captures long-term volatility trends.
By leveraging both VMD and Attention, the proposed model achieves a more accurate and robust performance in forecasting financial time series. These results provide strong empirical evidence that combining VMD with an Attention-based LSTM framework significantly enhances VIX prediction accuracy, especially in volatile market conditions.
4.2.1. Answer to RQ1 and H1
Table 4 shows that the proposed VMD-Cascaded LSTM with Attention outperforms all benchmark models across all evaluation metrics. These include various configurations of LSTM with and without VMD, confirming the superior predictive power of the proposed hybrid architecture. Although classical models such as GARCH have historically been applied to volatility forecasting, this study focuses on deep learning-based approaches to ensure a consistent comparison framework. These results support H1 and affirm that the integration of VMD and Attention mechanisms significantly improves forecasting accuracy over standard LSTM-based models.
4.2.2. Answer to RQ2 and H2
To assess robustness across varying market regimes, a rolling-window out-of-sample evaluation was conducted. The results, visualized in
Figure 5, demonstrate that the proposed model maintains stable predictive performance across different temporal segments, including both high- and low-volatility periods. In addition, residual analysis (
Figure 9 and
Figure 10) confirms the absence of systematic drift or overfitting to noise. These findings support H2, indicating that the proposed VMD-Cascaded LSTM with Attention model generalizes well across changing market conditions.
5. Concluding Remarks
In this study, we proposed an innovative approach to financial time-series forecasting by integrating VMD-Cascaded LSTM with Attention model. The primary objective was to enhance the predictive accuracy of the VIX, a critical indicator of market uncertainty, using advanced signal processing and deep learning techniques.
The proposed model incorporates VMD as a preprocessing step to decompose financial time-series data into multiple IMFs, which effectively separate short-term fluctuations from long-term trends. By leveraging these decomposed features, the model captures essential patterns in the data. Furthermore, the Cascaded LSTM with Attention architecture enables the model to focus on key temporal dependencies, significantly improving predictive accuracy.
The experimental results, using VIX and S&P 500 data from January 2020 to December 2024, demonstrated the model’s superiority over seven benchmark models. The proposed model achieved highly competitive error metrics, establishing it as a state-of-the-art approach for financial time-series forecasting. These results highlight the potential of combining signal decomposition techniques and attention mechanisms for addressing the complexities of market volatility.
This research contributes to the field of financial time-series forecasting in three key aspects. First, it introduces a novel combination of VMD and Attention-based LSTM to effectively address the complexities of market volatility modeling. Second, the model’s performance outperforms benchmark models, achieving a mean squared error (MSE) of 0.0018, which represents a 96.6% improvement compared to the best benchmark model, VMD LSTM 2 (2,1). Additionally, the inclusion of the Attention mechanism significantly enhances the model’s performance, as evidenced by a 99.7% reduction in MSE, an 81.5% reduction in RMSE, and a 75.8% reduction in MAE compared to VMD-Cascaded LSTM (without Attention). These findings underscore the importance of integrating Attention to capture critical temporal dependencies and improve prediction accuracy.
The proposed VMD-Cascaded LSTM with Attention model enhances financial time-series forecasting by integrating advanced signal decomposition and deep learning techniques. VMD decomposes financial data into IMFs, reducing noise and isolating meaningful patterns. This enables the model to extract essential features while minimizing the impact of irrelevant fluctuations. Cascaded LSTM refines temporal dependencies, improving long-term forecasting accuracy by capturing hierarchical representations of sequential data. Additionally, the incorporation of Multi-Head Attention highlights critical time steps, allowing the model to focus on key market movements more effectively than traditional LSTM models.
Compared to benchmark models, our approach demonstrates superior performance in multiple aspects. VMD enhances noise handling, providing cleaner input signals for predictive modeling. The cascaded structure of LSTM layers ensures stronger pattern recognition by sequentially refining extracted features. Furthermore, the Attention mechanism improves interpretability by dynamically emphasizing influential time points, leading to better predictive accuracy and more explainable results.
Overall, this study highlights the advantages of combining VMD, LSTM, and Attention mechanisms for financial volatility forecasting. The proposed approach improves accuracy, enhances model robustness, and increases interpretability, making it a valuable tool for financial modeling and risk management applications.
This study proposes a VMD-Cascaded LSTM with Attention model aimed at improving the accuracy of market volatility forecasts. By doing so, it is anticipated to aid financial institutions, asset management firms, and individual investors in developing more sophisticated and stable risk management and investment strategies. In particular, proactively preparing for periods when a sharp increase in VIX is anticipated can help minimize potential losses stemming from market shocks, while maximizing portfolio returns. Moreover, the integration of the Attention mechanism enables the model to more effectively capture “critical time points” and “key features” within the market—signals that conventional LSTM models or simple signal decomposition approaches might miss—thereby enhancing predictive precision. As a result, this framework holds promise for broad applicability and heightened practical value across various real-world scenarios, such as trading and risk monitoring systems.
Furthermore, the model proposed in this study can be applied to various fields beyond finance. For instance, in the healthcare sector, machine learning (ML) models facilitate more effective and timely interventions by predicting disease outbreaks, patient outcomes, and treatment responses [
40,
41]. Additionally, the proposed model can be utilized in predicting farmland flooding by integrating ML models with weather forecasts [
42].
Despite its strong predictive capabilities, the proposed model has several limitations. The high computational cost associated with VMD and hyperparameter tuning makes it less suitable for real-time applications or large-scale datasets. Moreover, the model’s performance heavily depends on the quality of input data and may remain sensitive to noise and abrupt market fluctuations. Although VMD contributes to noise reduction, additional measures are required to further enhance robustness.
The inclusion of both VMD and the Attention mechanism also increases architectural complexity, which reduces interpretability and makes it challenging to analyze feature importance or fully understand the model’s internal decision-making process. To address these limitations, future work may explore alternative signal decomposition methods with lower computational overhead and consider simplifying the architecture to improve interpretability and deployment potential.
In terms of efficiency, the basic training and testing of the proposed model were completed within approximately 19 s on an NVIDIA RTX 2060 Super GPU, highlighting its practicality despite the use of Cascaded LSTM and Attention modules. When extended evaluation procedures—such as bootstrap-based confidence interval estimation, rolling-window backtesting, and residual diagnostics—were included, the total runtime increased to approximately 127 s. Nonetheless, this level of computational demand remains manageable and suggests that the model is feasible for deployment in time-sensitive applications, including real-time risk monitoring or automated trading systems. These results collectively demonstrate that the proposed architecture strikes a favorable balance between predictive performance and computational efficiency.
Although the proposed model demonstrated superior forecasting performance compared to all benchmark models, several practical and methodological considerations should be addressed.
First, while rolling-window evaluations were employed to assess temporal generalization, the analysis did not explicitly segment performance under distinct market regimes (e.g., high vs. low volatility). Future research could incorporate scenario-specific testing to identify performance boundaries more precisely.
Second, the hybrid architecture—combining VMD, Cascaded LSTM layers, and Multi-Head Attention—yields considerable gains in accuracy but at the cost of increased model complexity. This complexity may challenge interpretability and require careful tuning, particularly for practitioners with limited computational resources. In such cases, simplified architectures or modular variants of the model may offer more practical alternatives with acceptable performance trade-offs.
For practitioners, the model shows promise for near real-time applications, such as automated trading or dynamic risk monitoring, particularly when GPU acceleration is available. However, robust deployment would require ongoing retraining, anomaly detection, and model validation to adapt to changing market conditions and mitigate the risk of model drift.
These insights underscore that while the model is computationally feasible and highly accurate, its application in operational settings demands strategic consideration of resource availability, interpretability, and lifecycle maintenance.
In conclusion, this study represents a significant step forward in financial time-series forecasting by demonstrating the effectiveness of integrating VMD with an Attention-based LSTM model. The findings not only advance the understanding of market volatility but also lay the groundwork for future innovations in financial modeling. The proposed approach, with its demonstrated accuracy and robustness, holds the potential for broader applications across domains requiring precise time-series forecasting.
While this study focuses on the VIX as a representative volatility index, future research may consider extending the proposed methodology to other indices such as NASDAQ or sector-specific volatility indicators. However, such extensions are not pursued in this work, as the current architecture—designed with dual-inputs from S&P 500 and VIX—is specialized for VIX prediction. Applying this model to external indices would likely require modifications to input structure or model design and is thus reserved as a dedicated topic for follow-up studies.


