
Experimental Study on the Influence of Low Temperature on the Gas Permeability of Granite


Abstract
1. Introduction
2. Materials and Methods
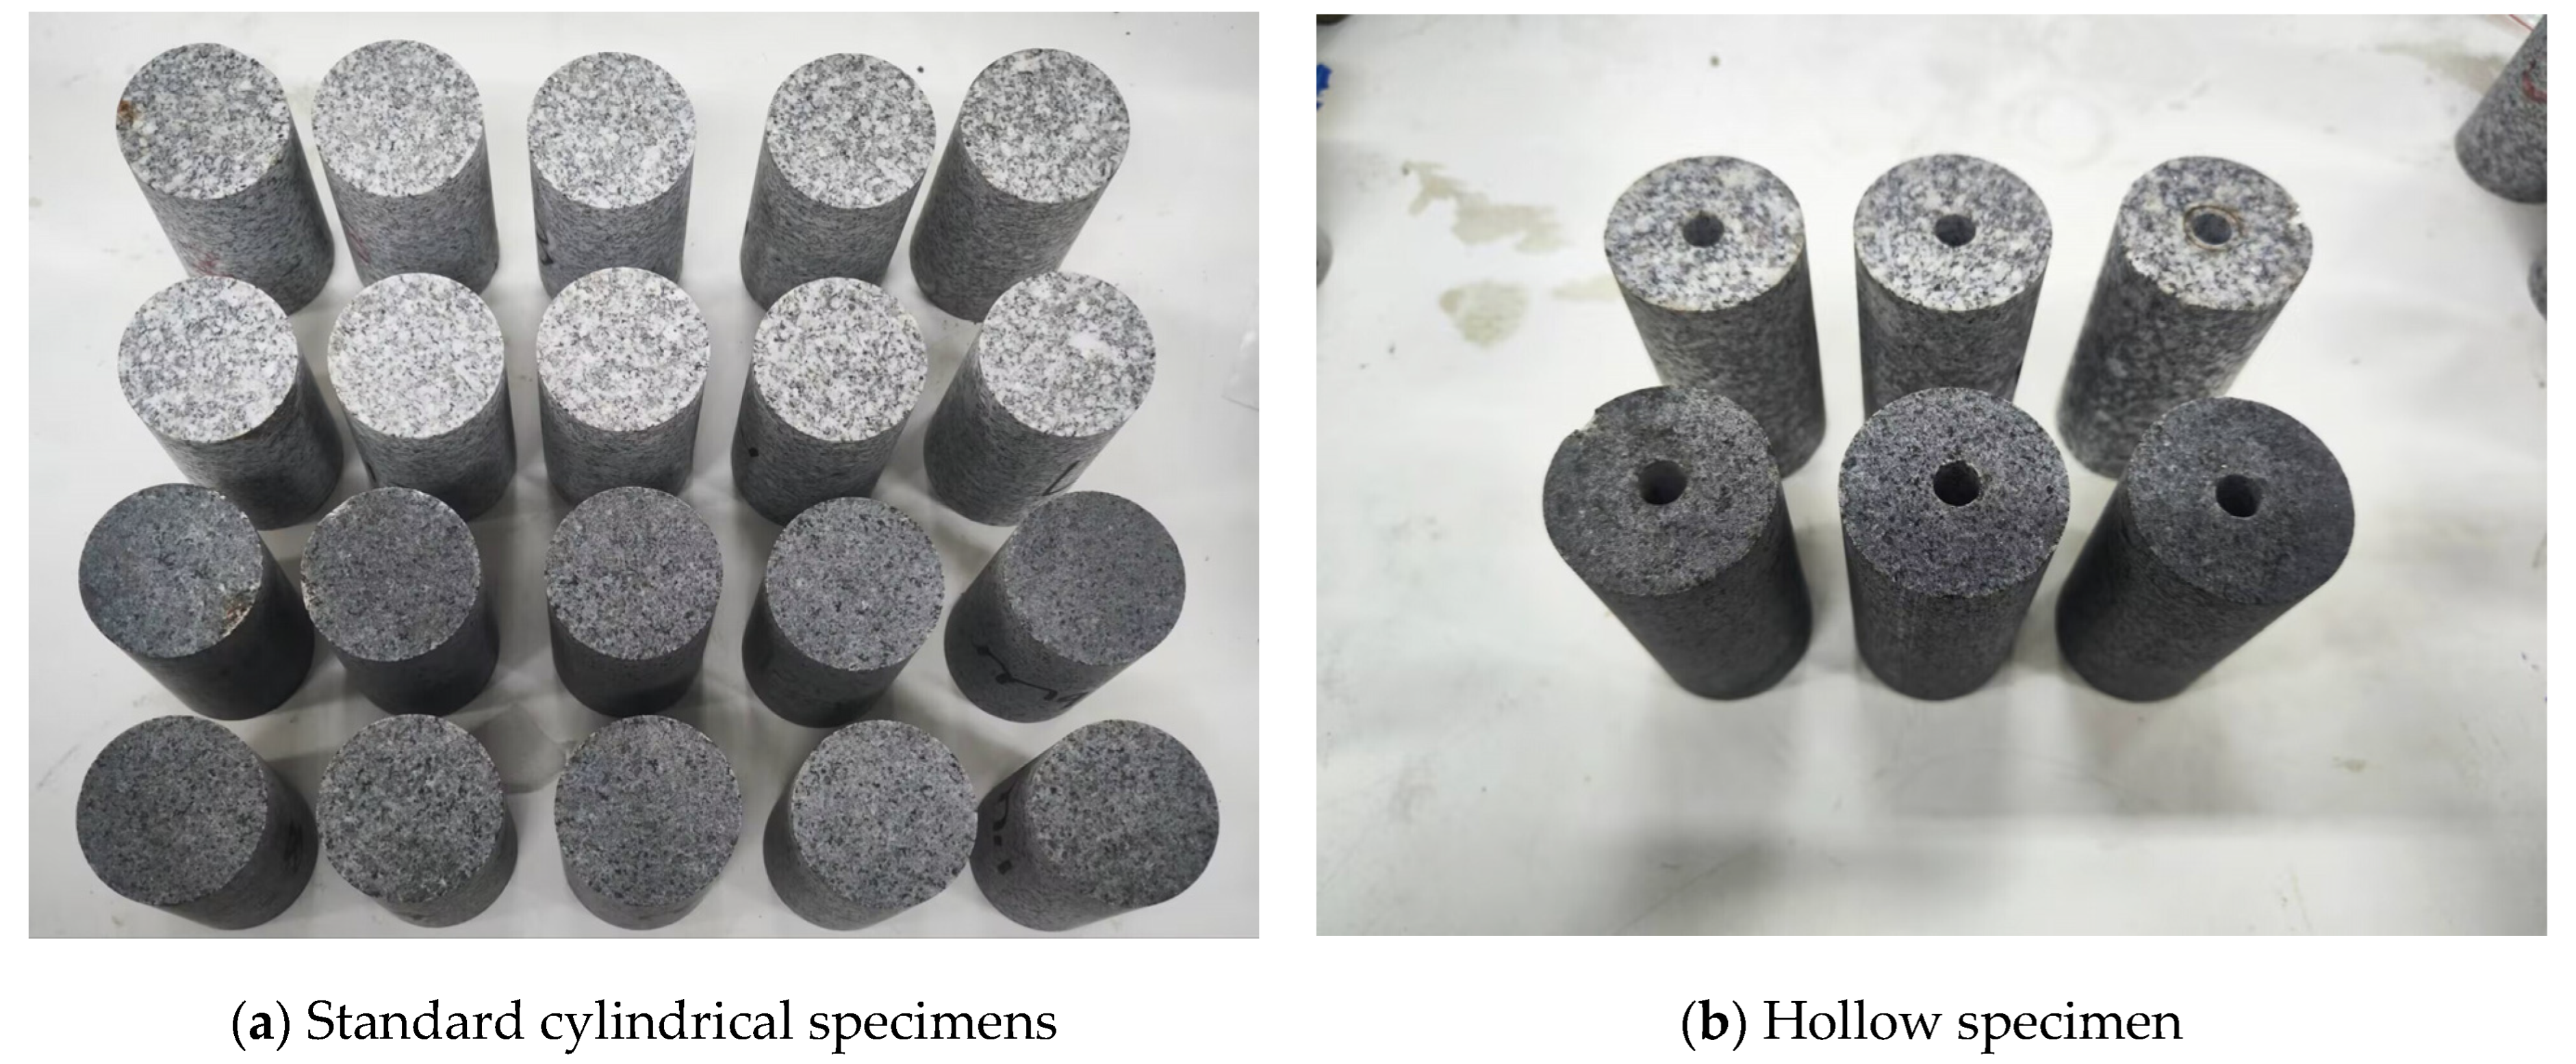
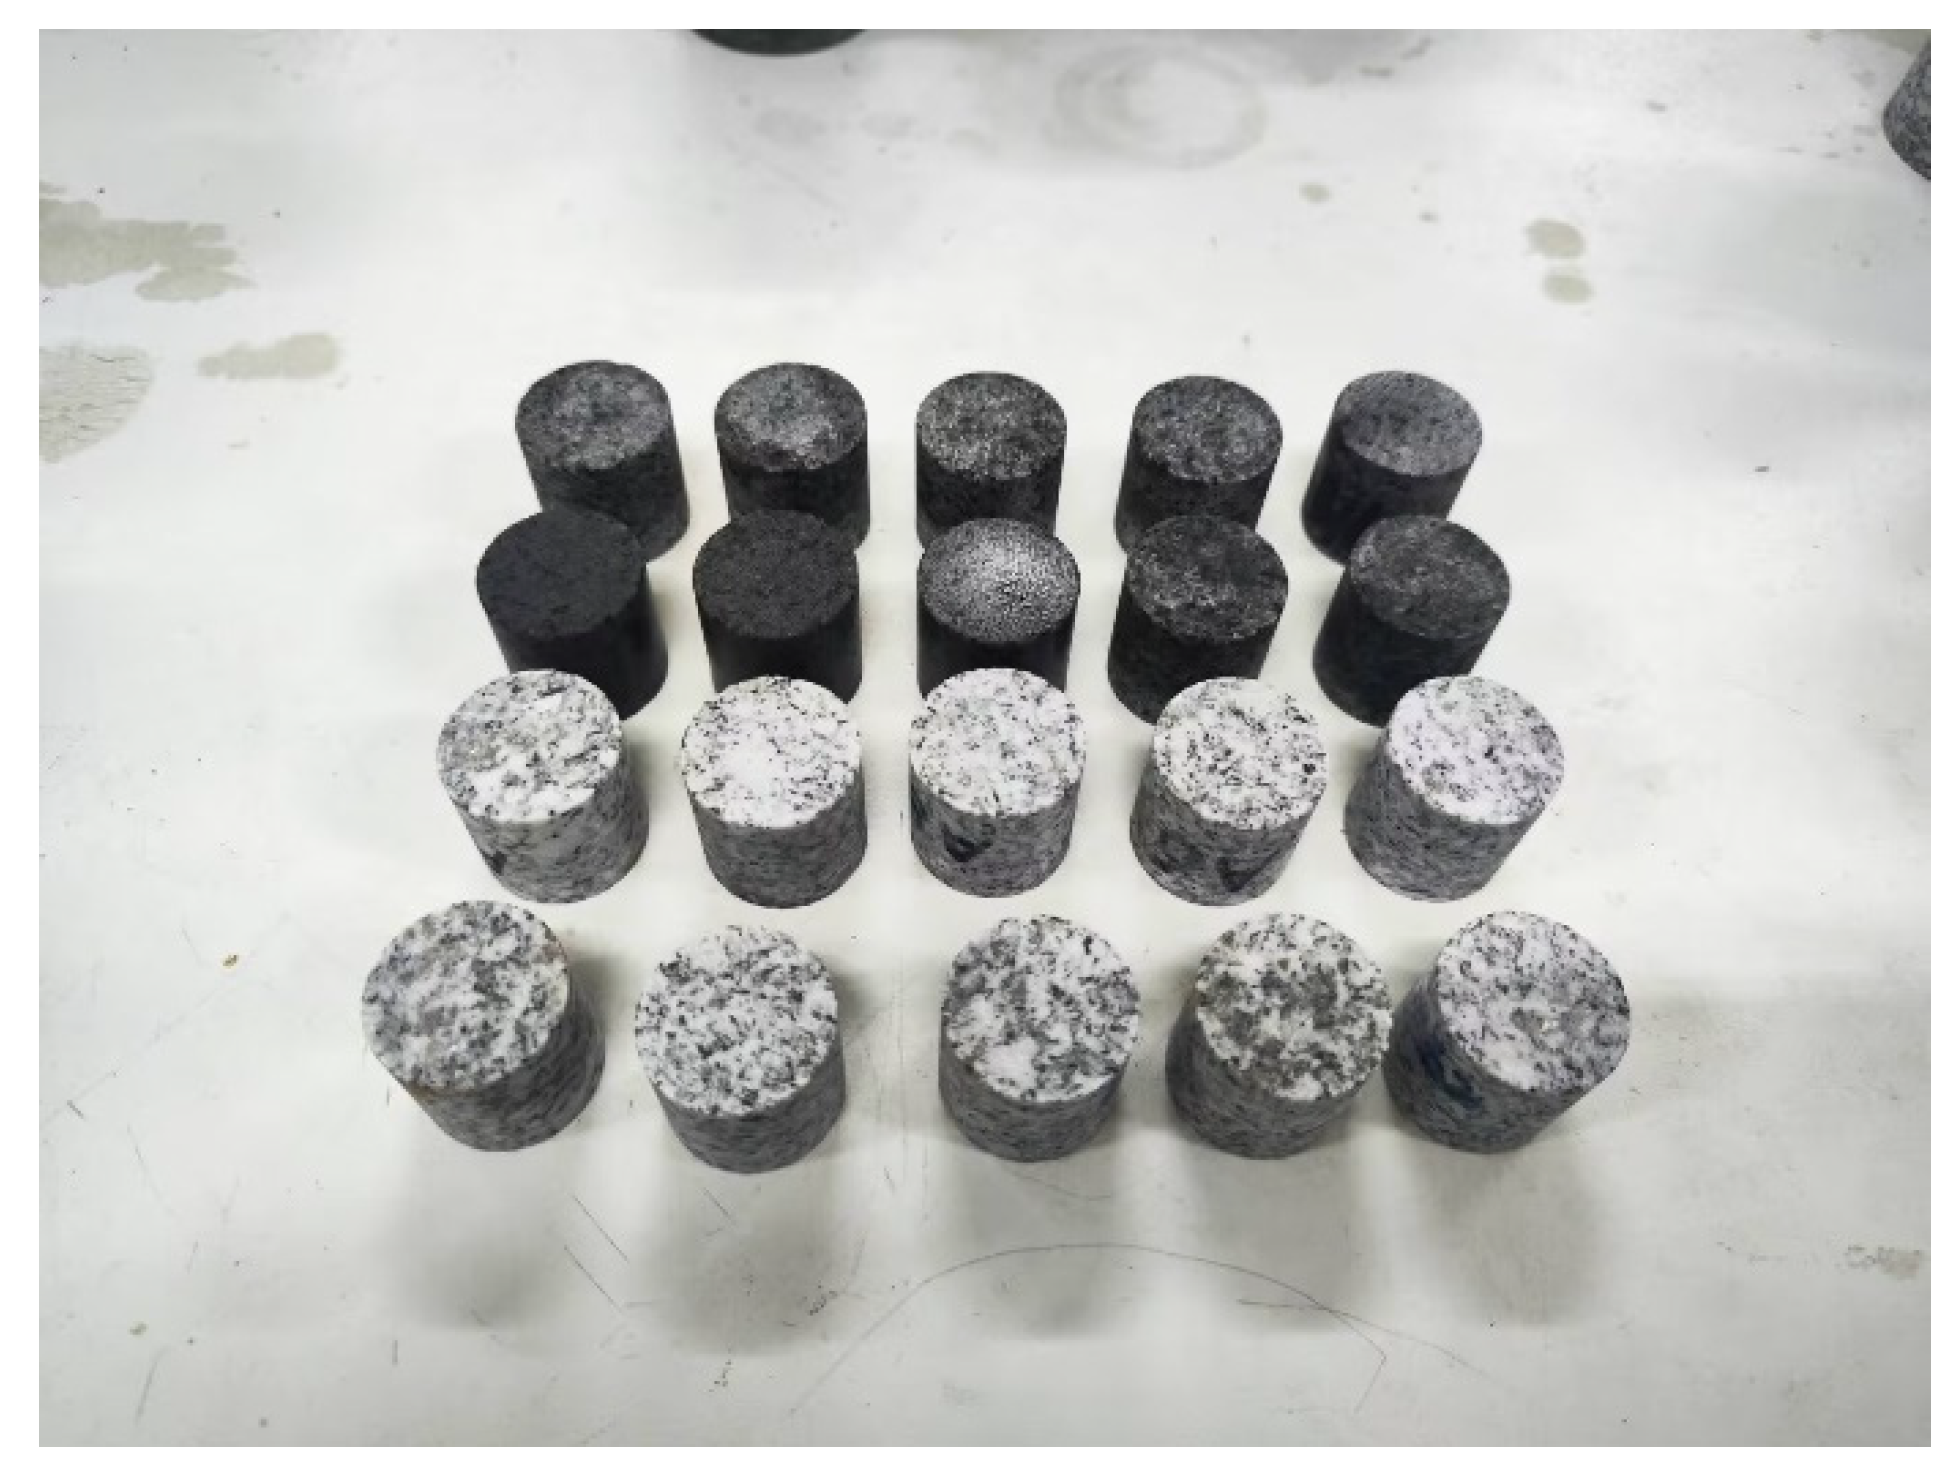
2.1. Specimen Preparation
2.2. Freeze–Thaw Cycle Test
- (1)
- Specimens were saturated in an ultra-high-pressure vacuum saturation apparatus for 72 h to ensure full water saturation.
- (2)
- Freezing was performed at target temperatures of −20 °C, −40 °C, −60 °C, −90 °C, and −120 °C, with a controlled cooling rate of 0.5 °C/min. Once the desired temperature was reached, specimens were maintained at the set temperature for 4 h using a cryogenic freezer.
- (3)
- Thawing was conducted under natural ambient conditions.
- (4)
- Steps (1) through (3) were repeated for a total of 20 freeze–thaw cycles.
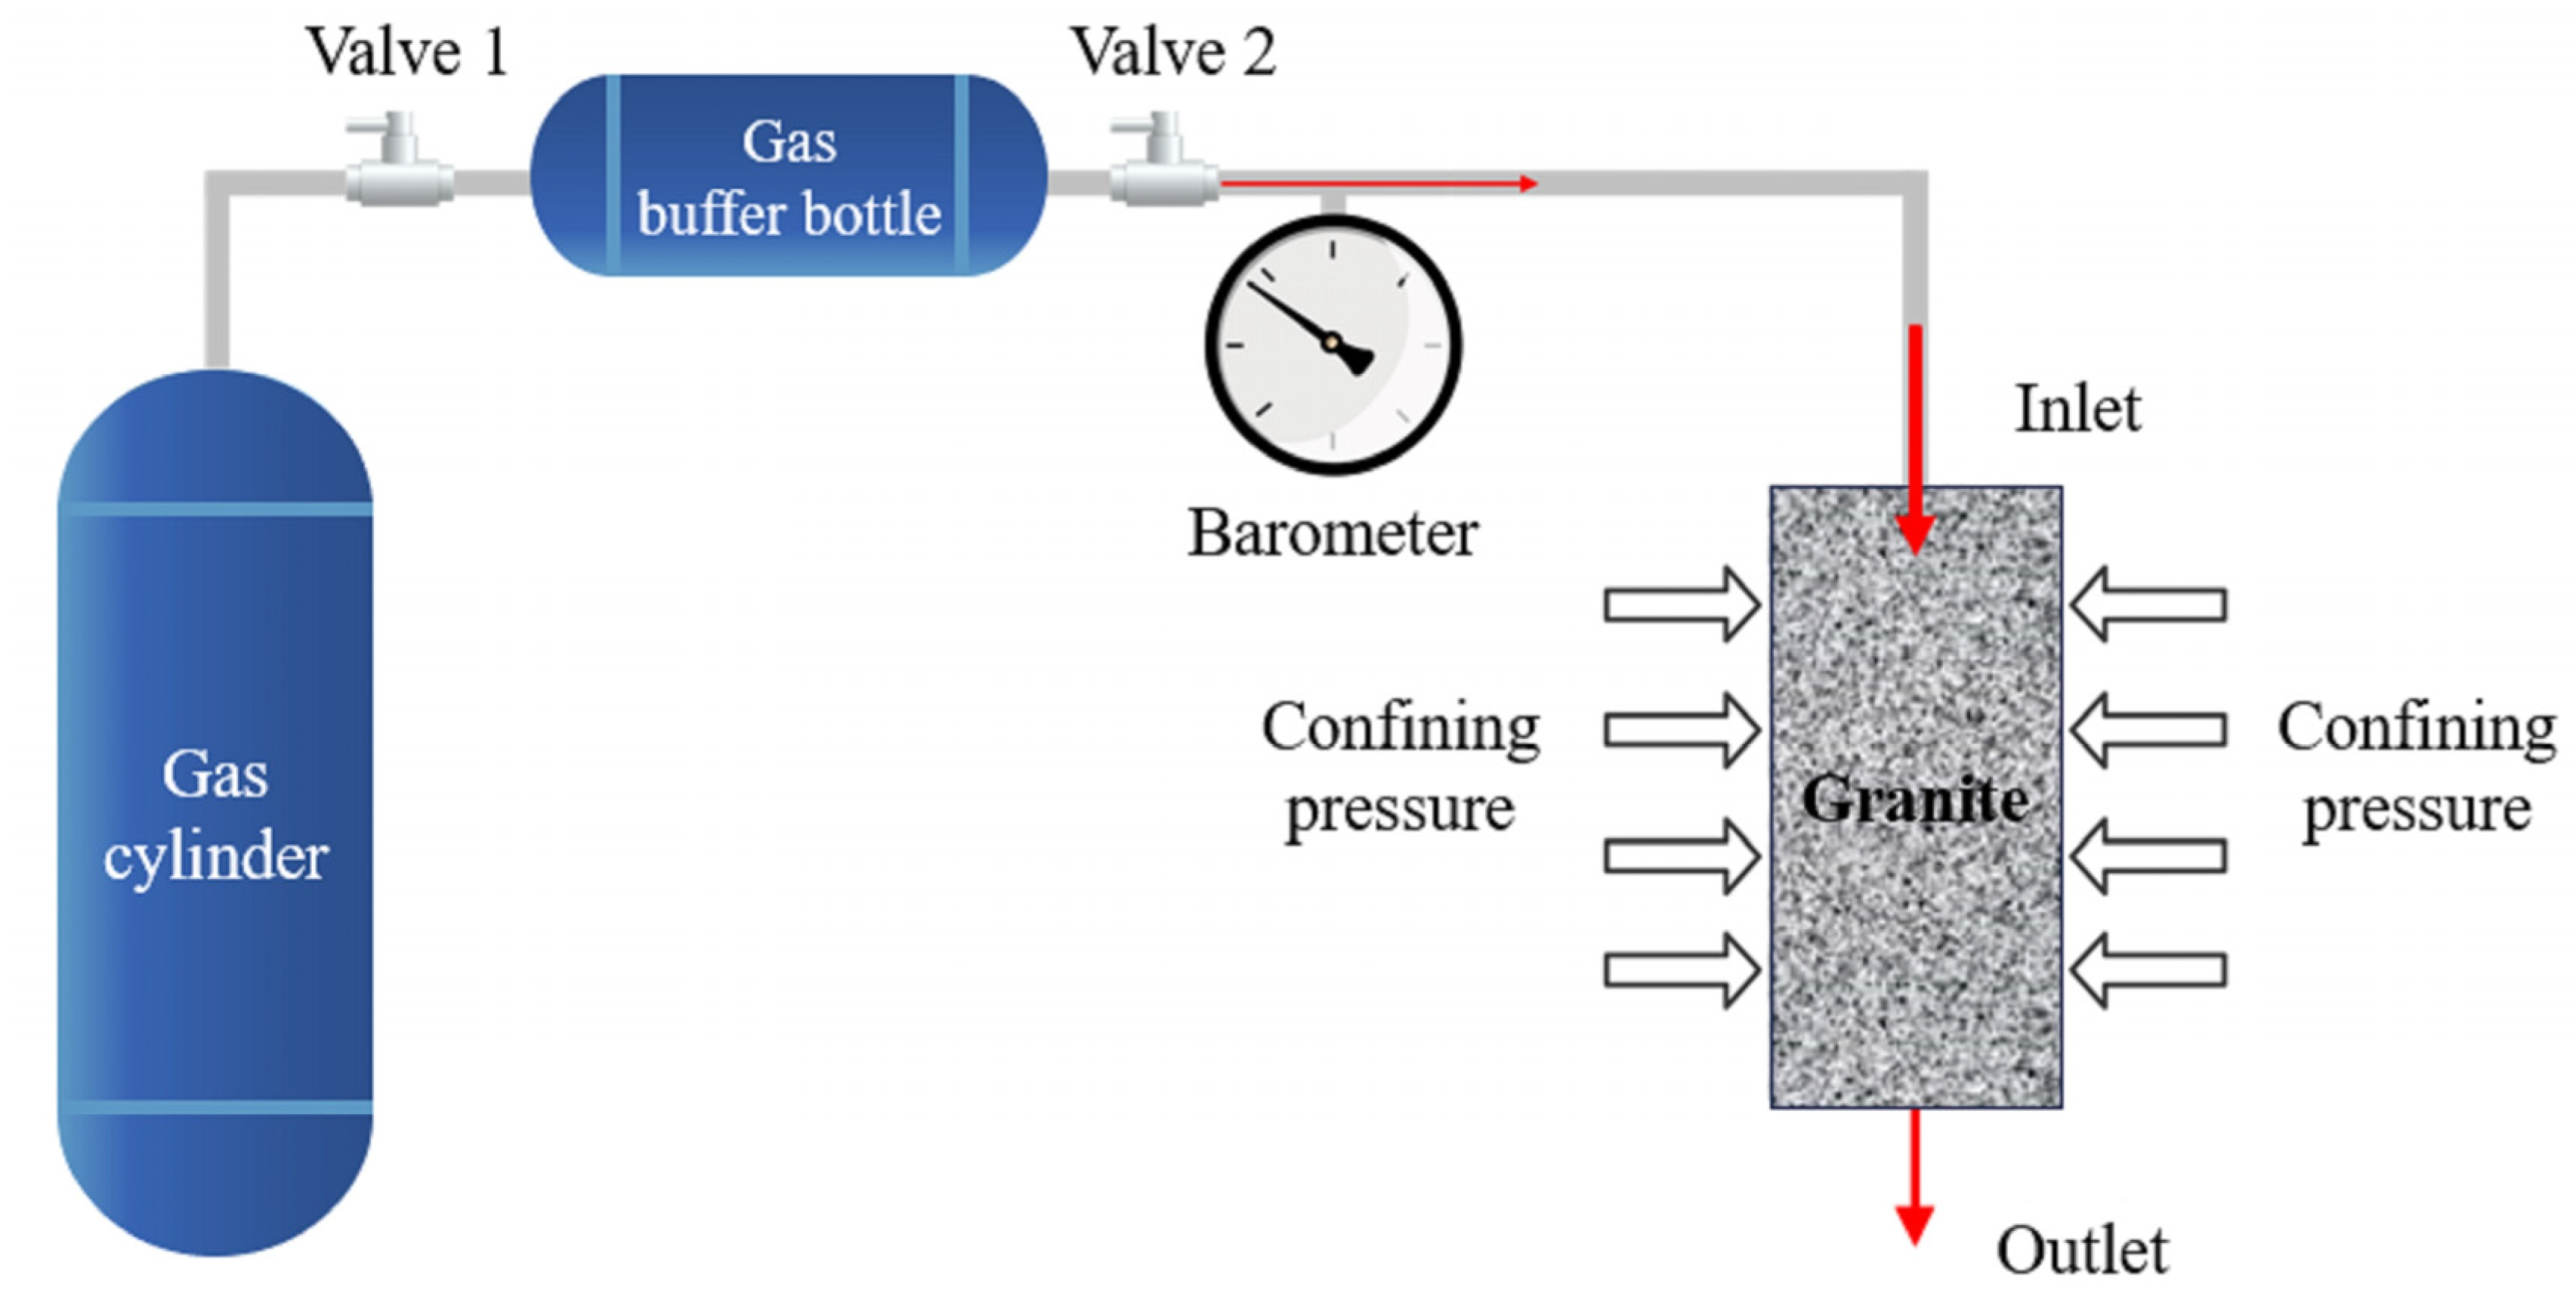
2.3. One-Dimensional Gas Permeability Test
2.4. Two-Dimensional Gas Permeability Test
2.5. Nuclear Magnetic Resonance Test
3. Results and Discussion
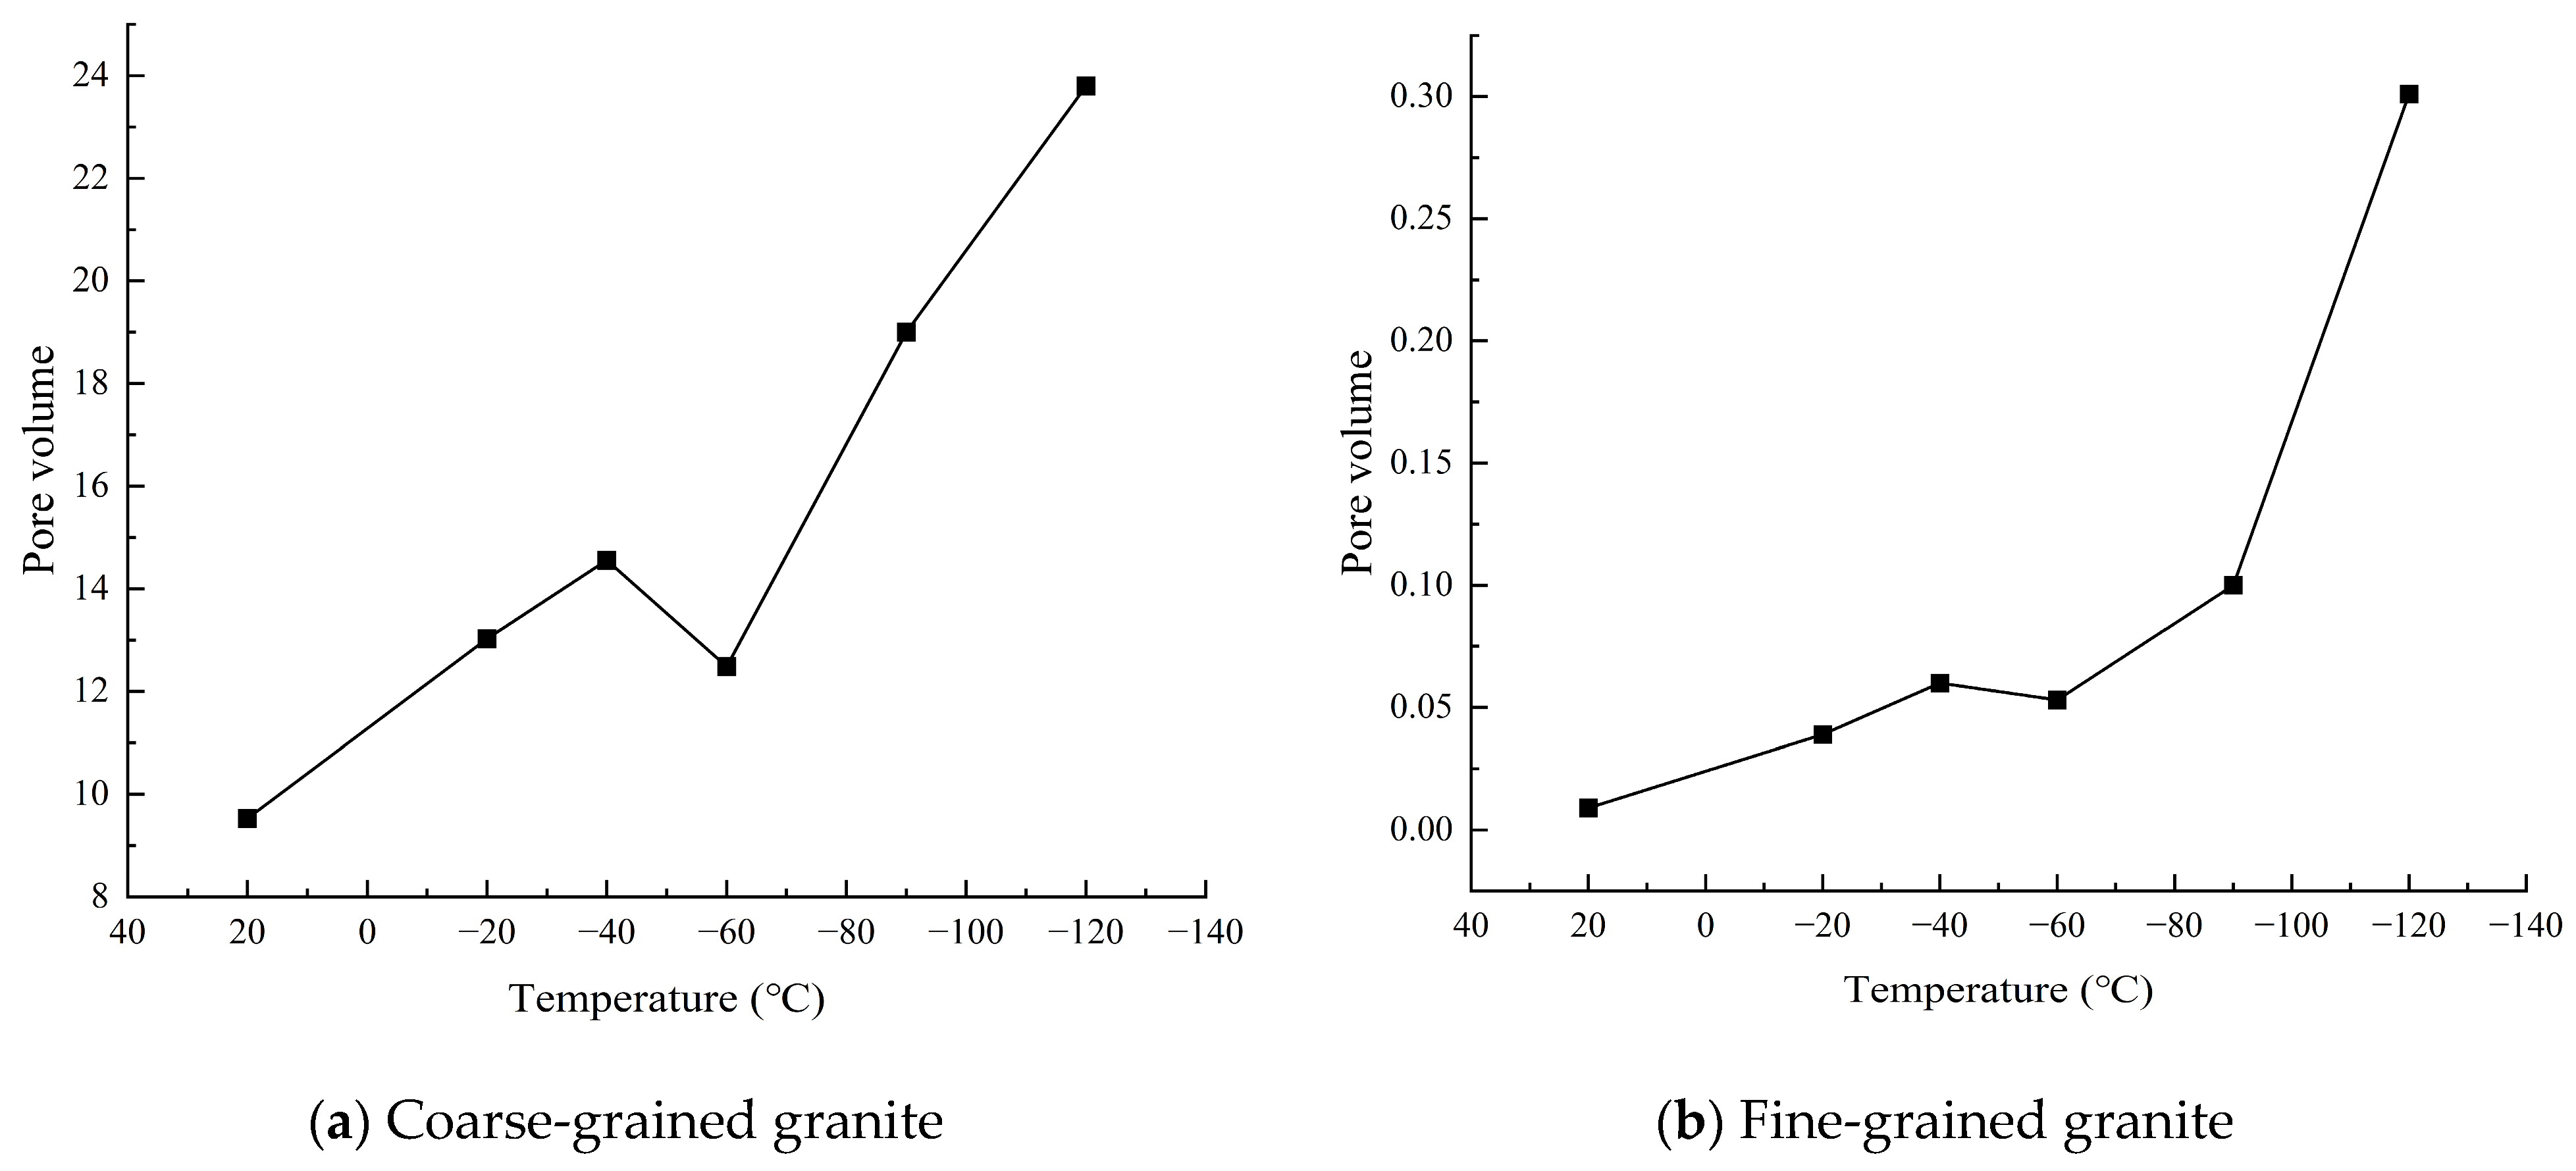
3.1. Change in Porosity
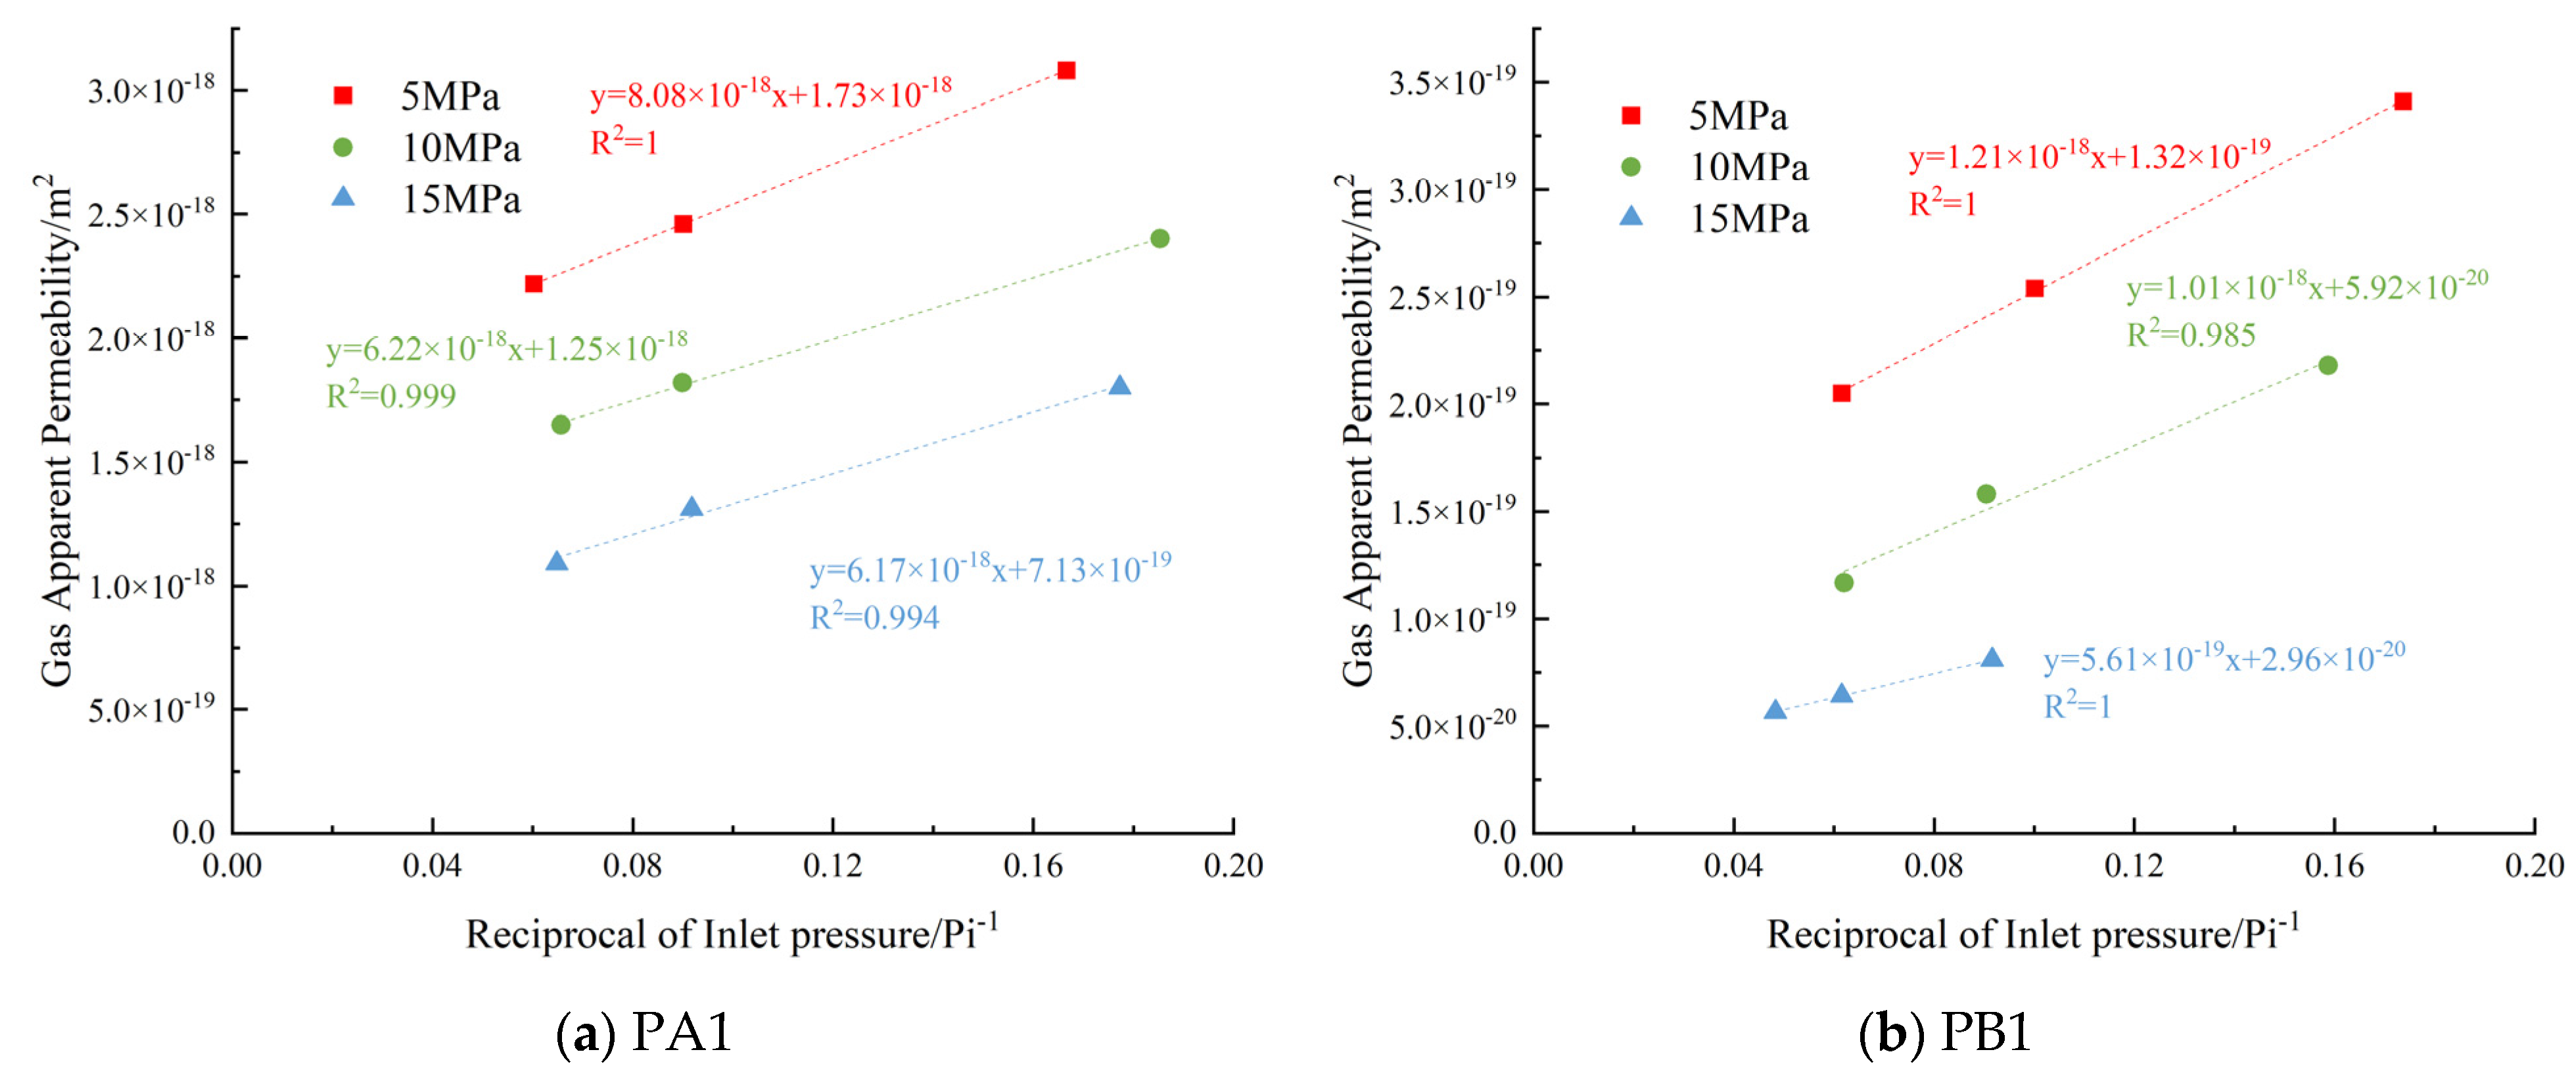
3.2. One-Dimensional Gas Permeability
3.2.1. One-Dimensional Intrinsic Gas Permeability
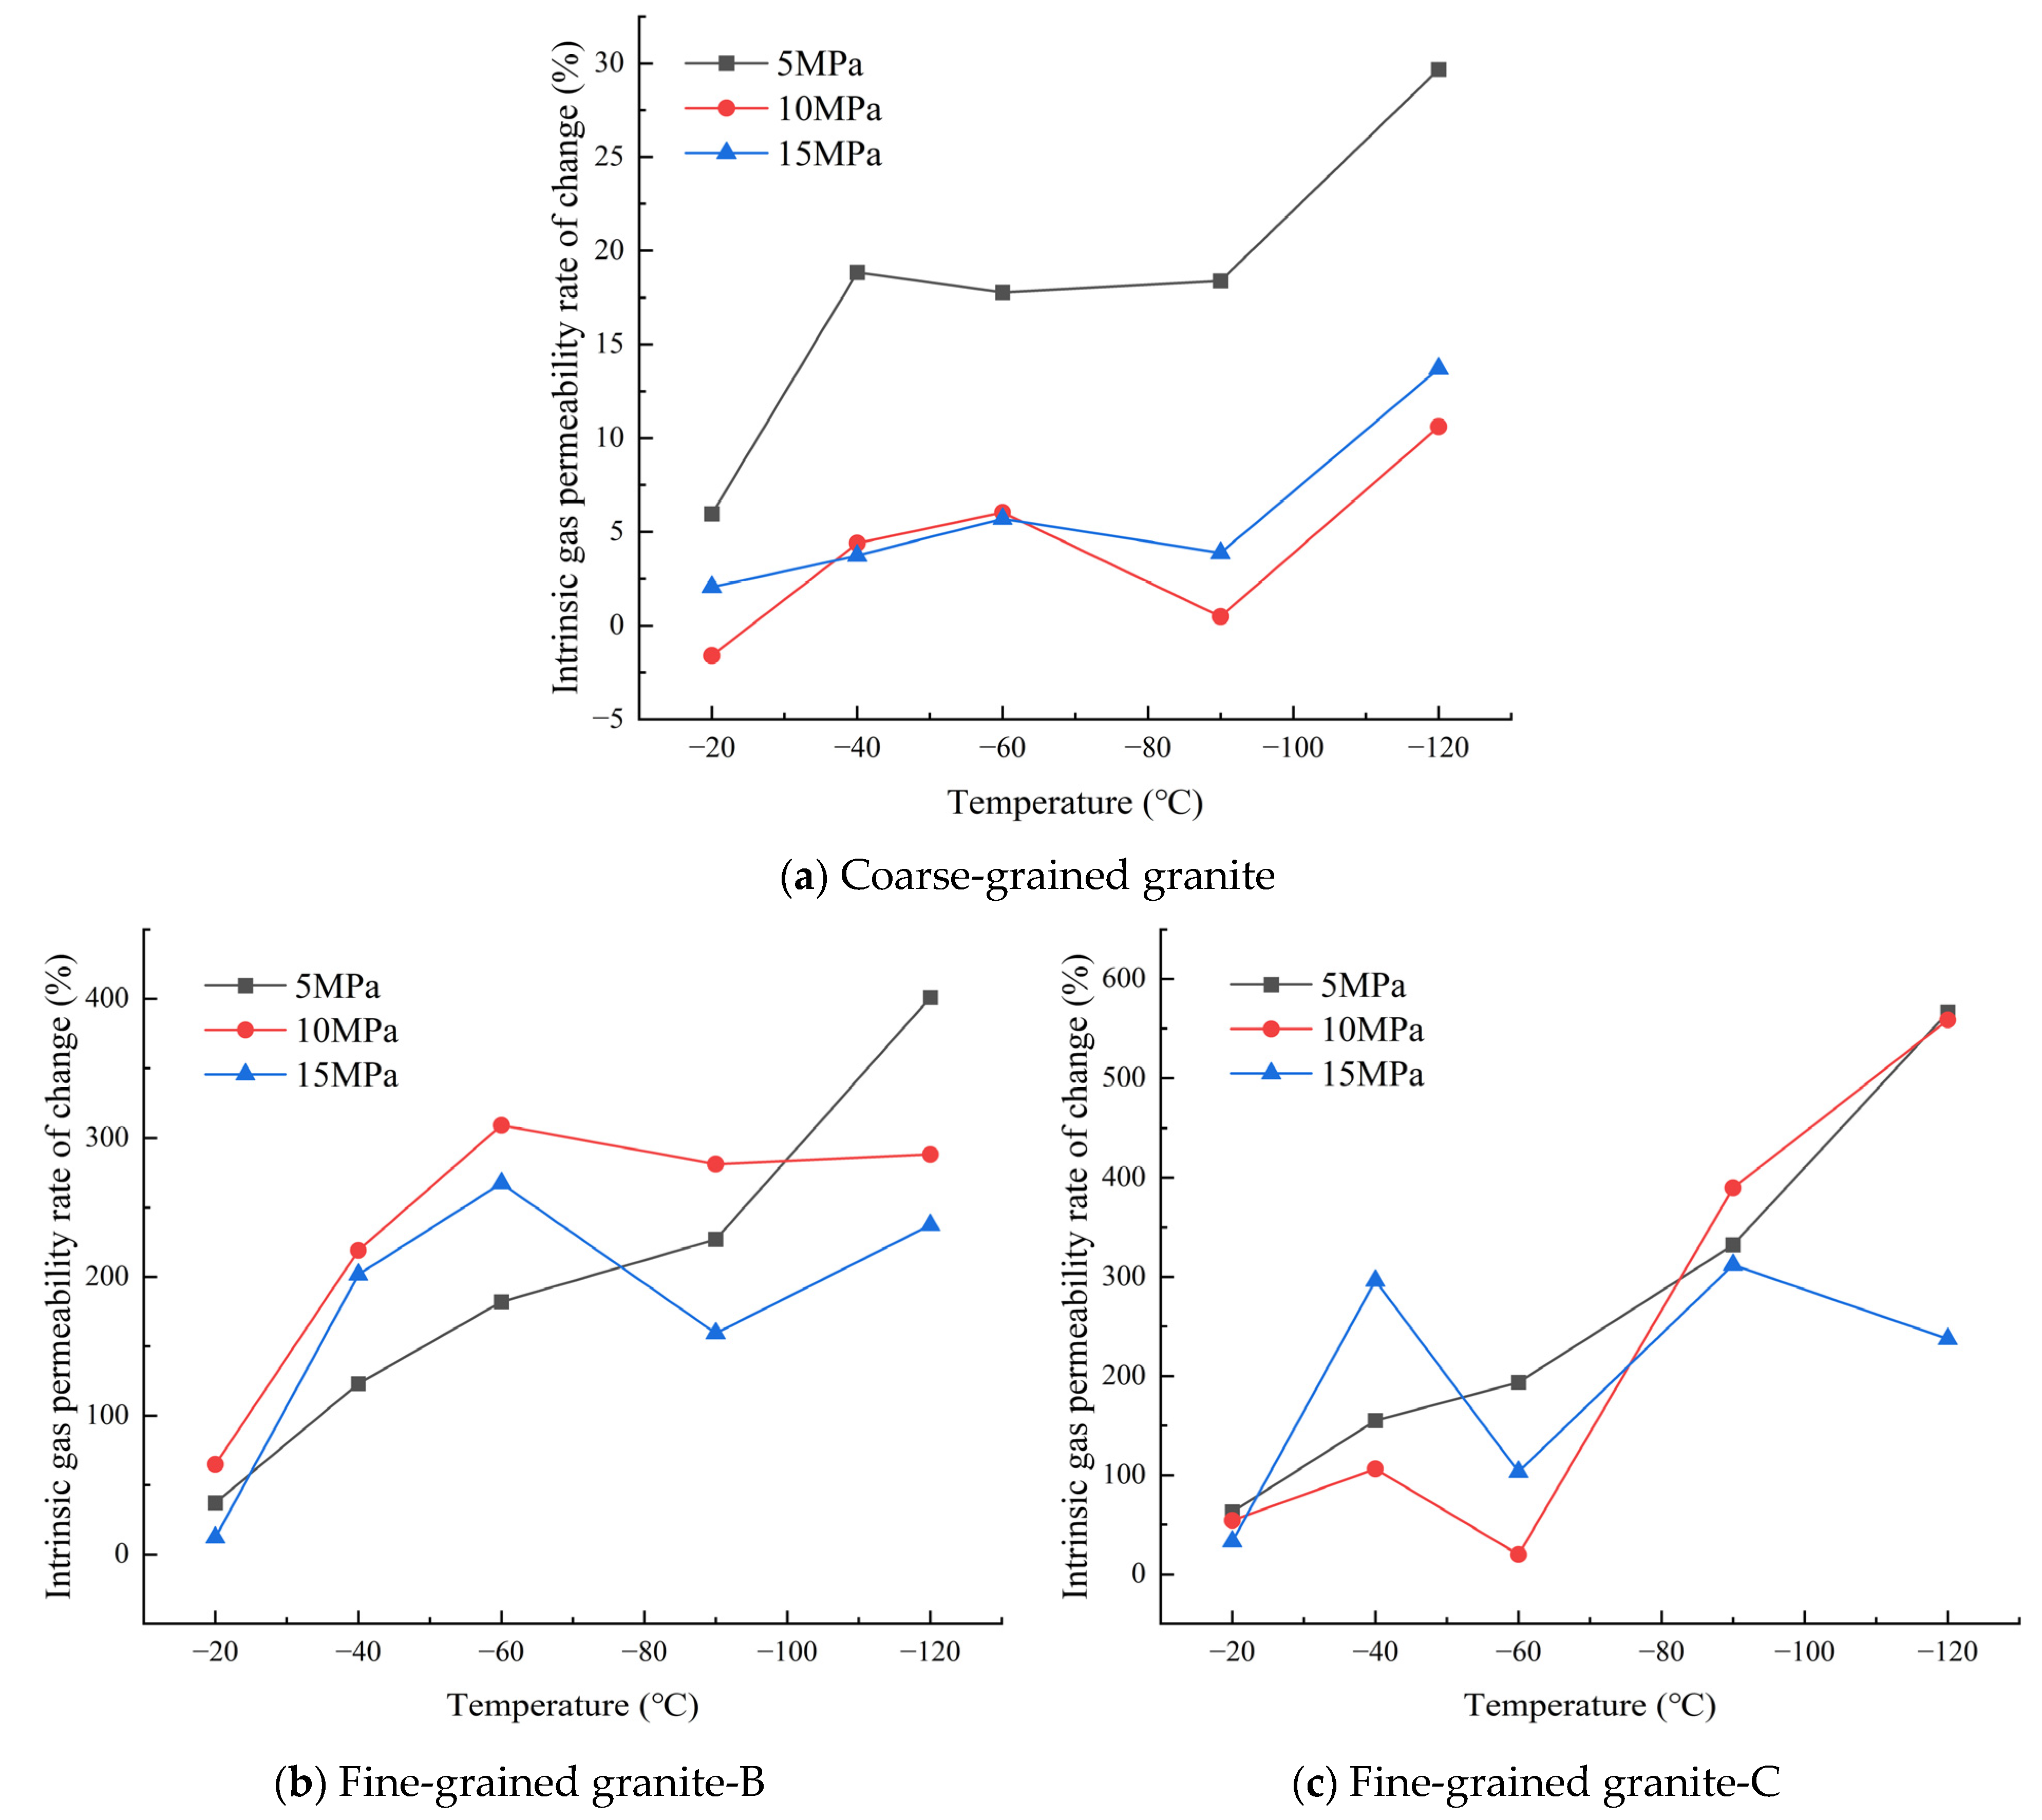
3.2.2. Effect of Freezing Temperature on Intrinsic Gas Permeability
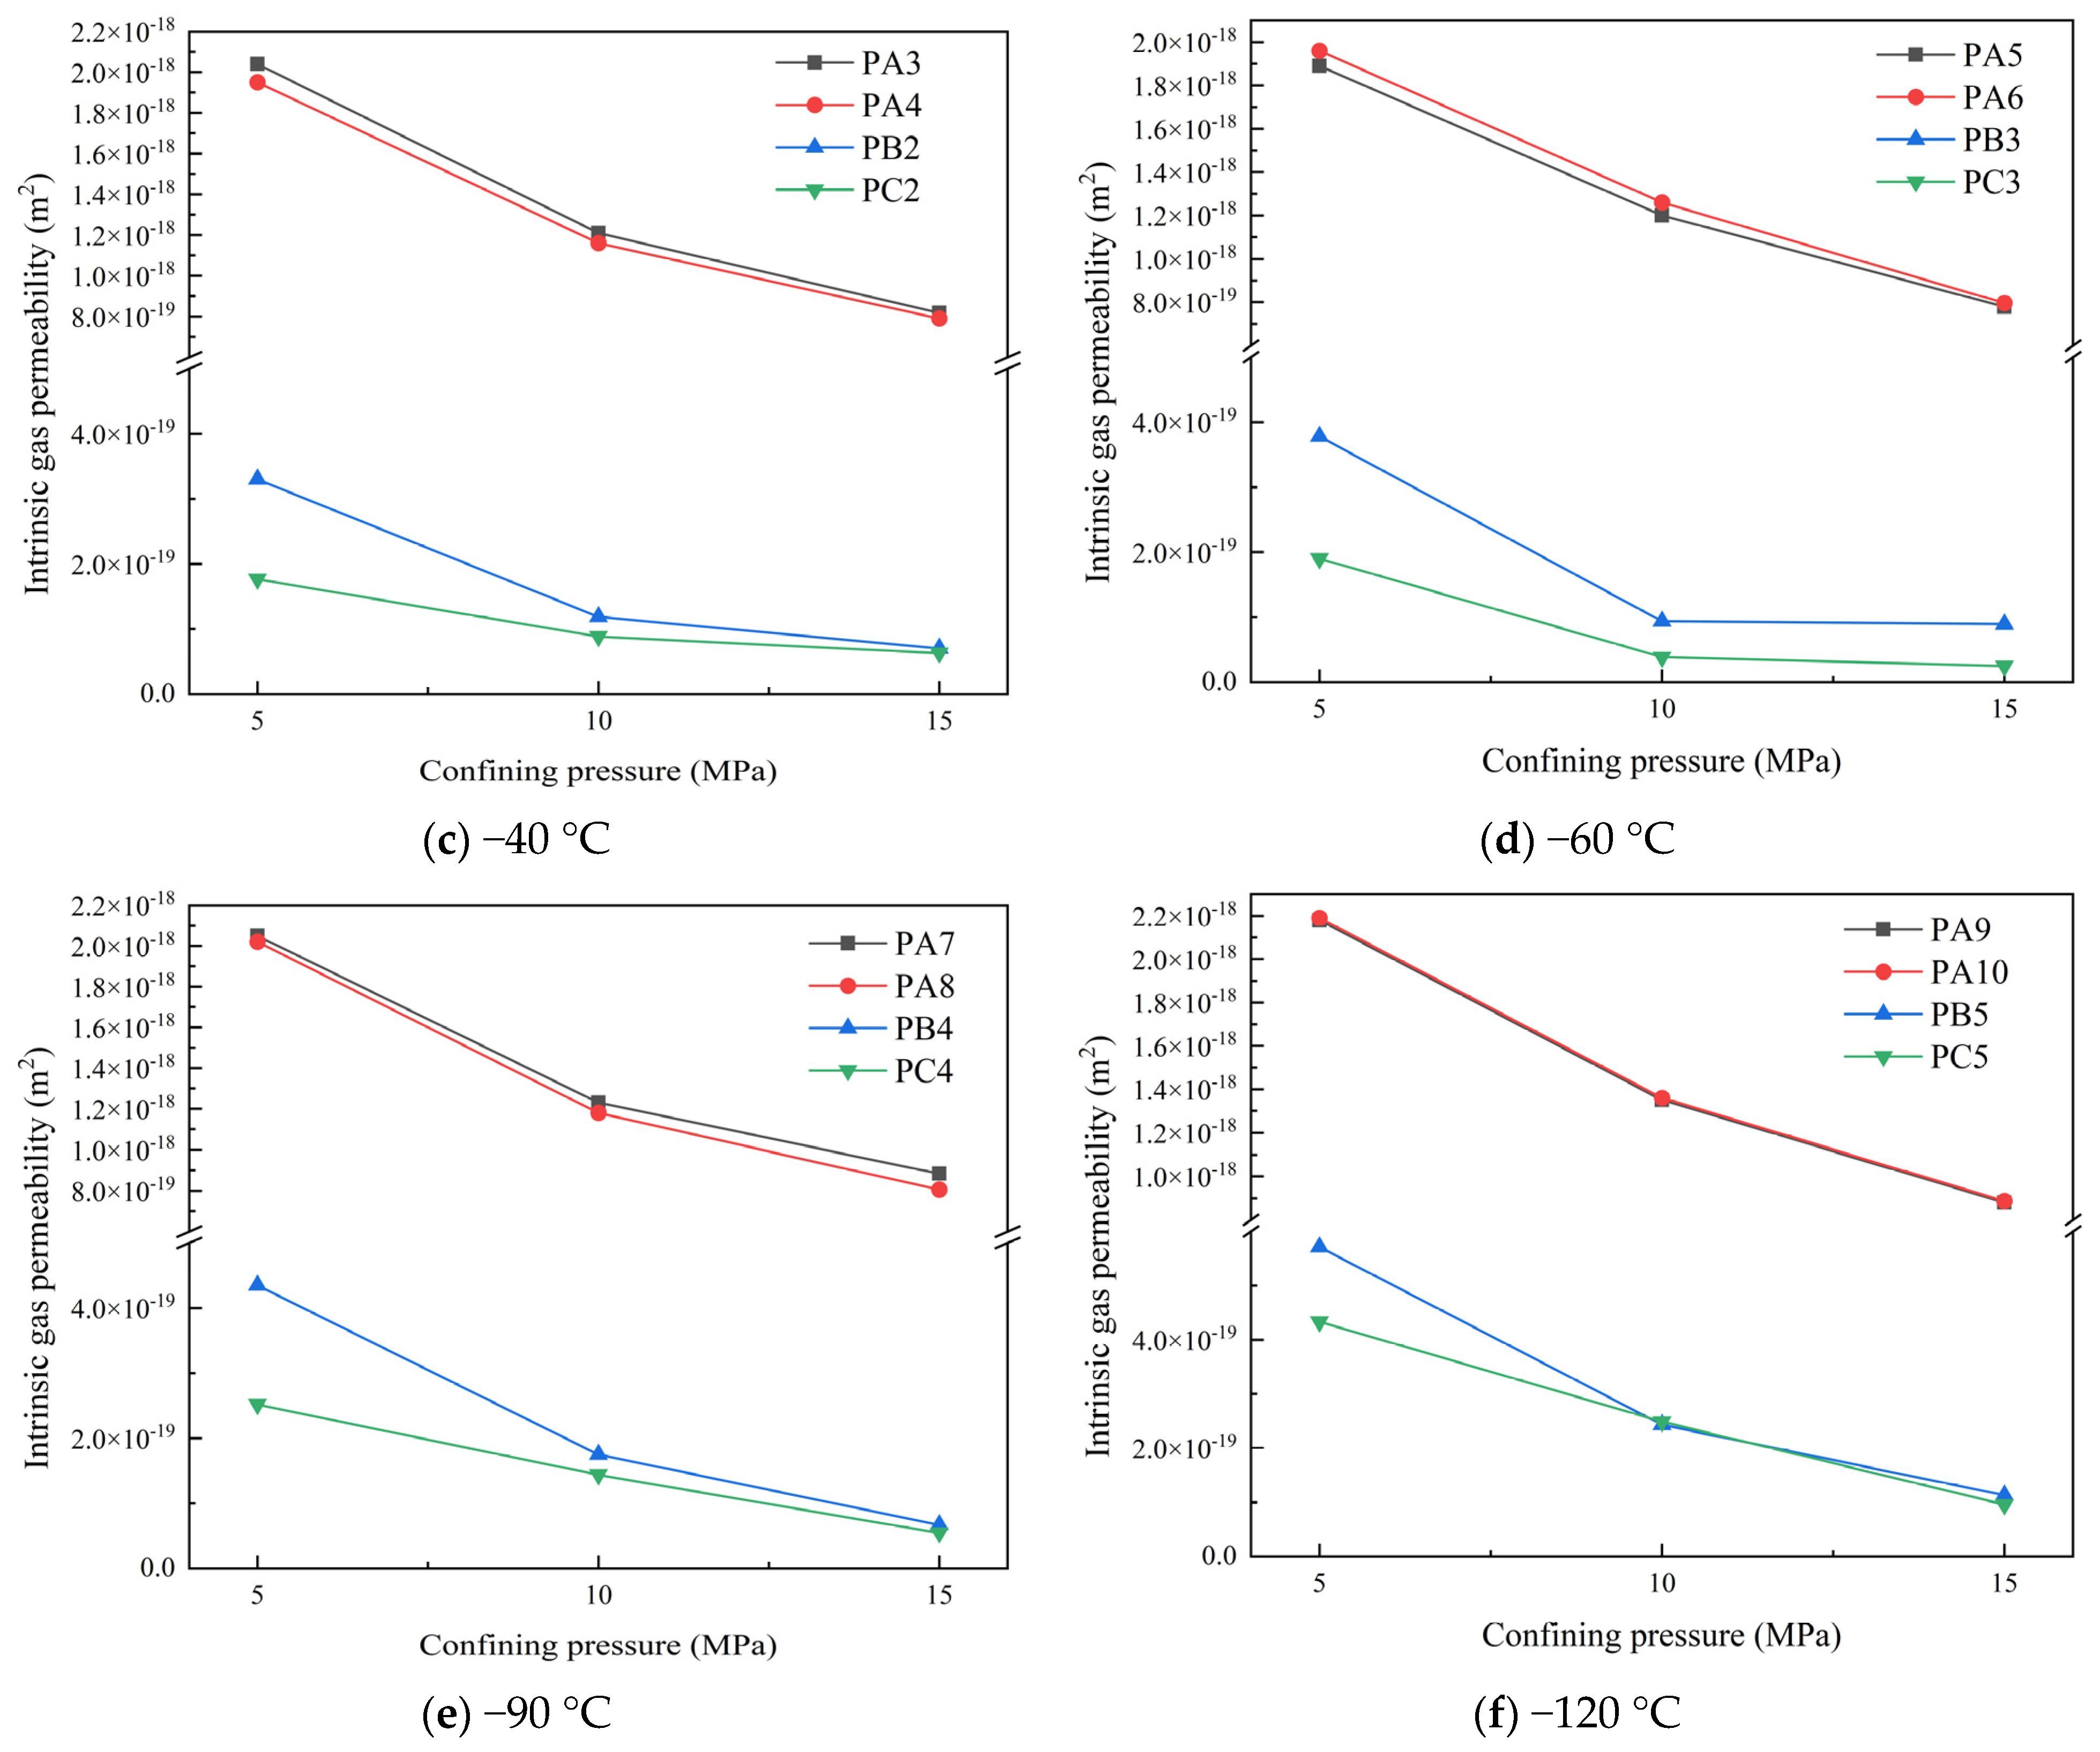
3.2.3. Effect of Confining Pressure on Intrinsic Gas Permeability
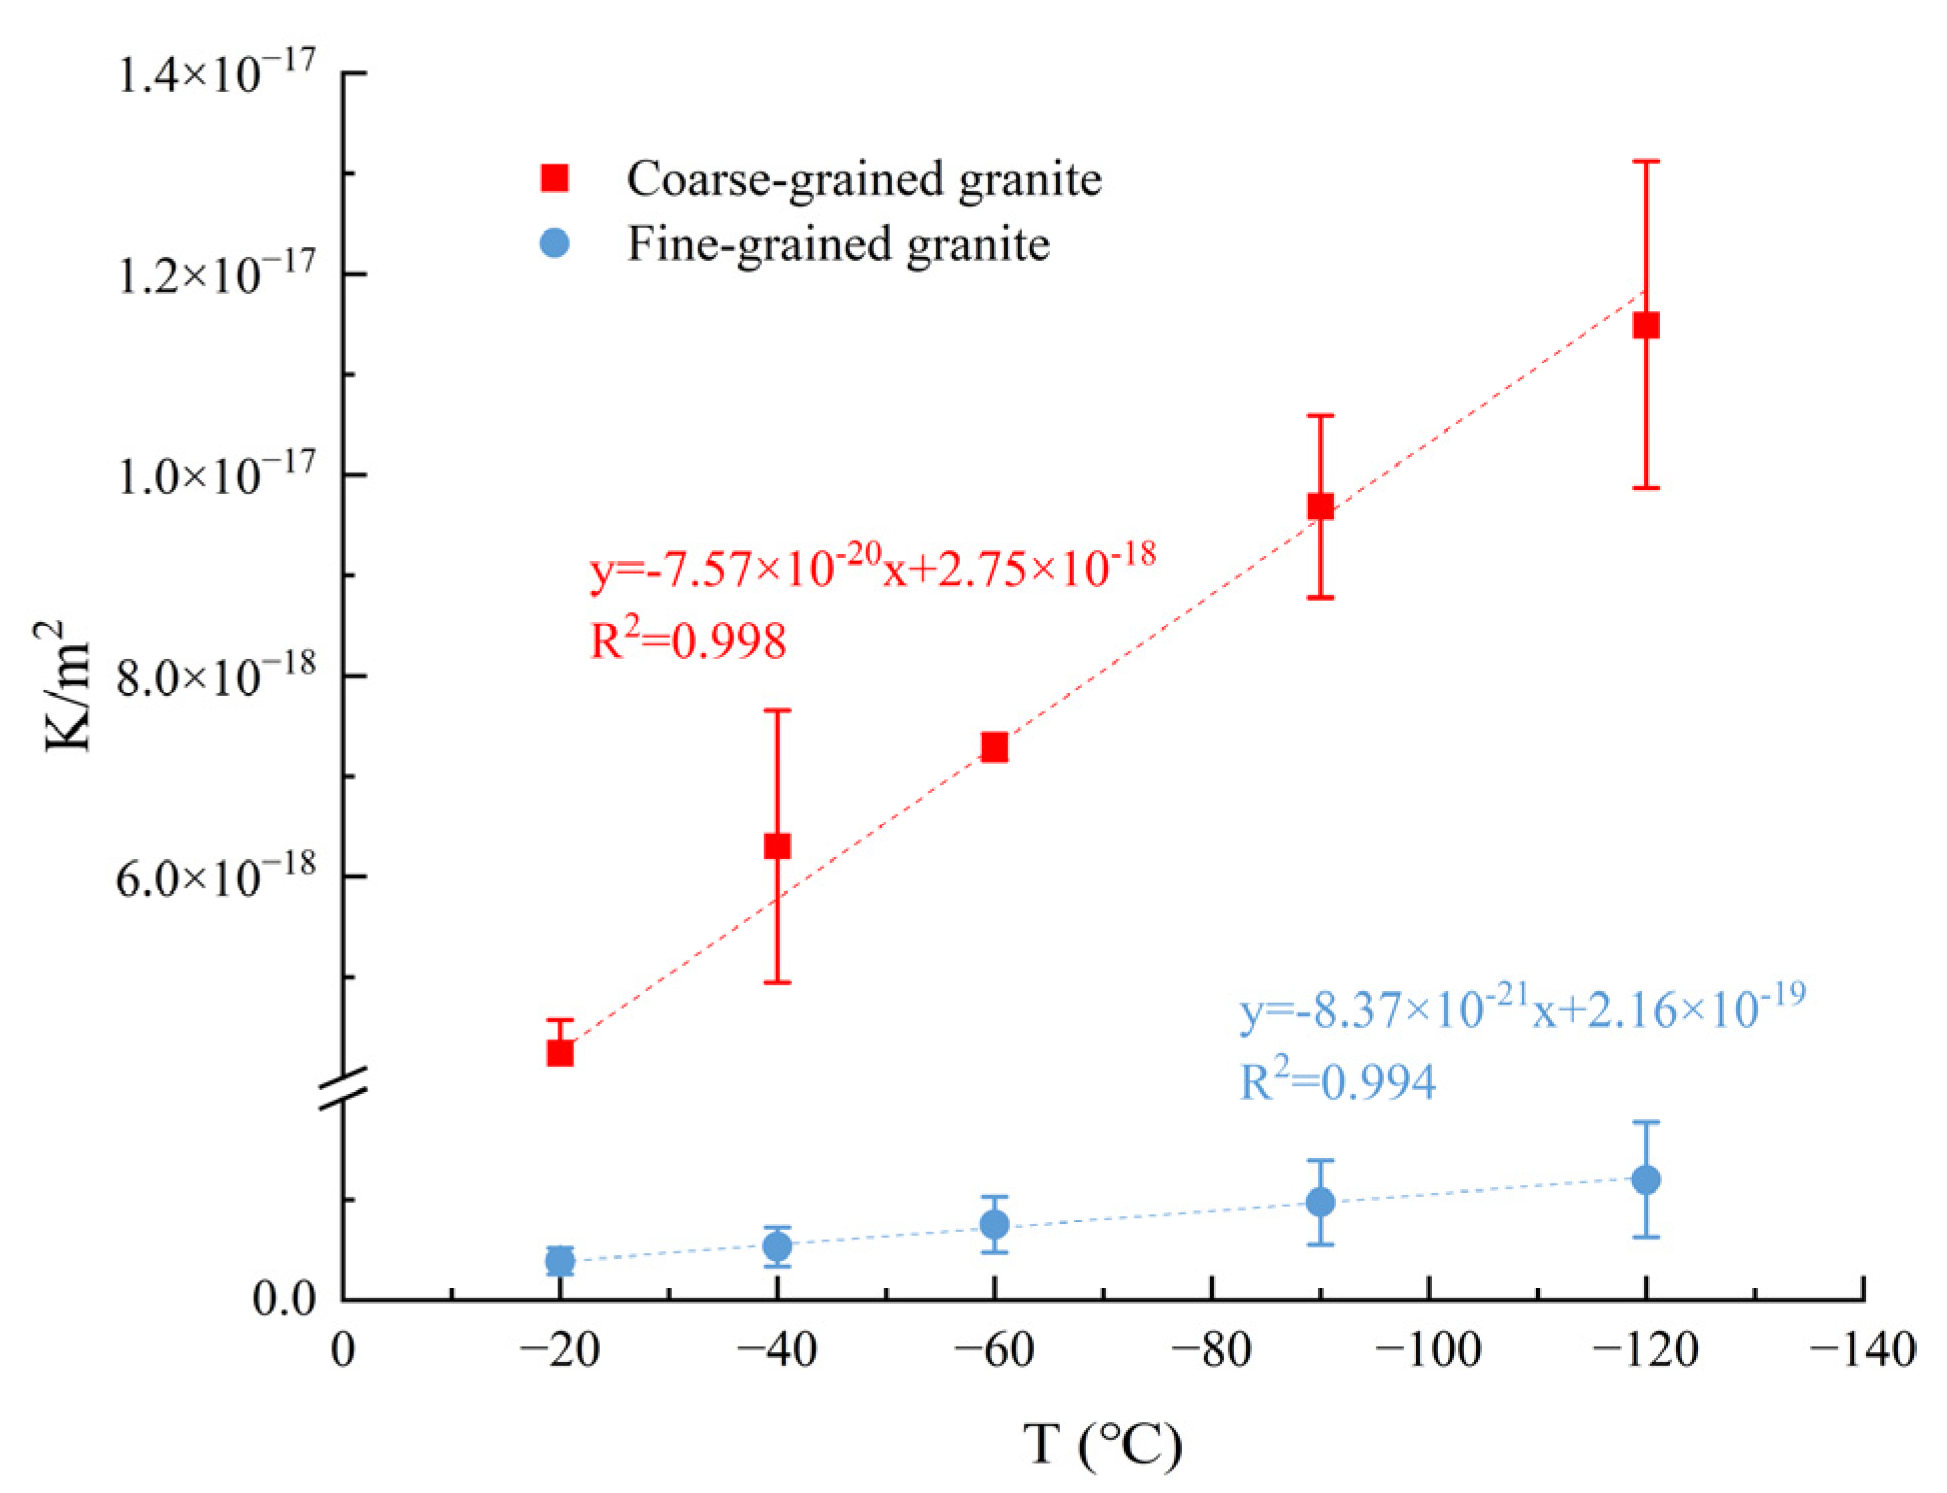
3.3. Two-Dimensional Gas Permeability
3.3.1. Two-Dimensional Intrinsic Gas Permeability
3.3.2. Changes in 2D Intrinsic Gas Permeability
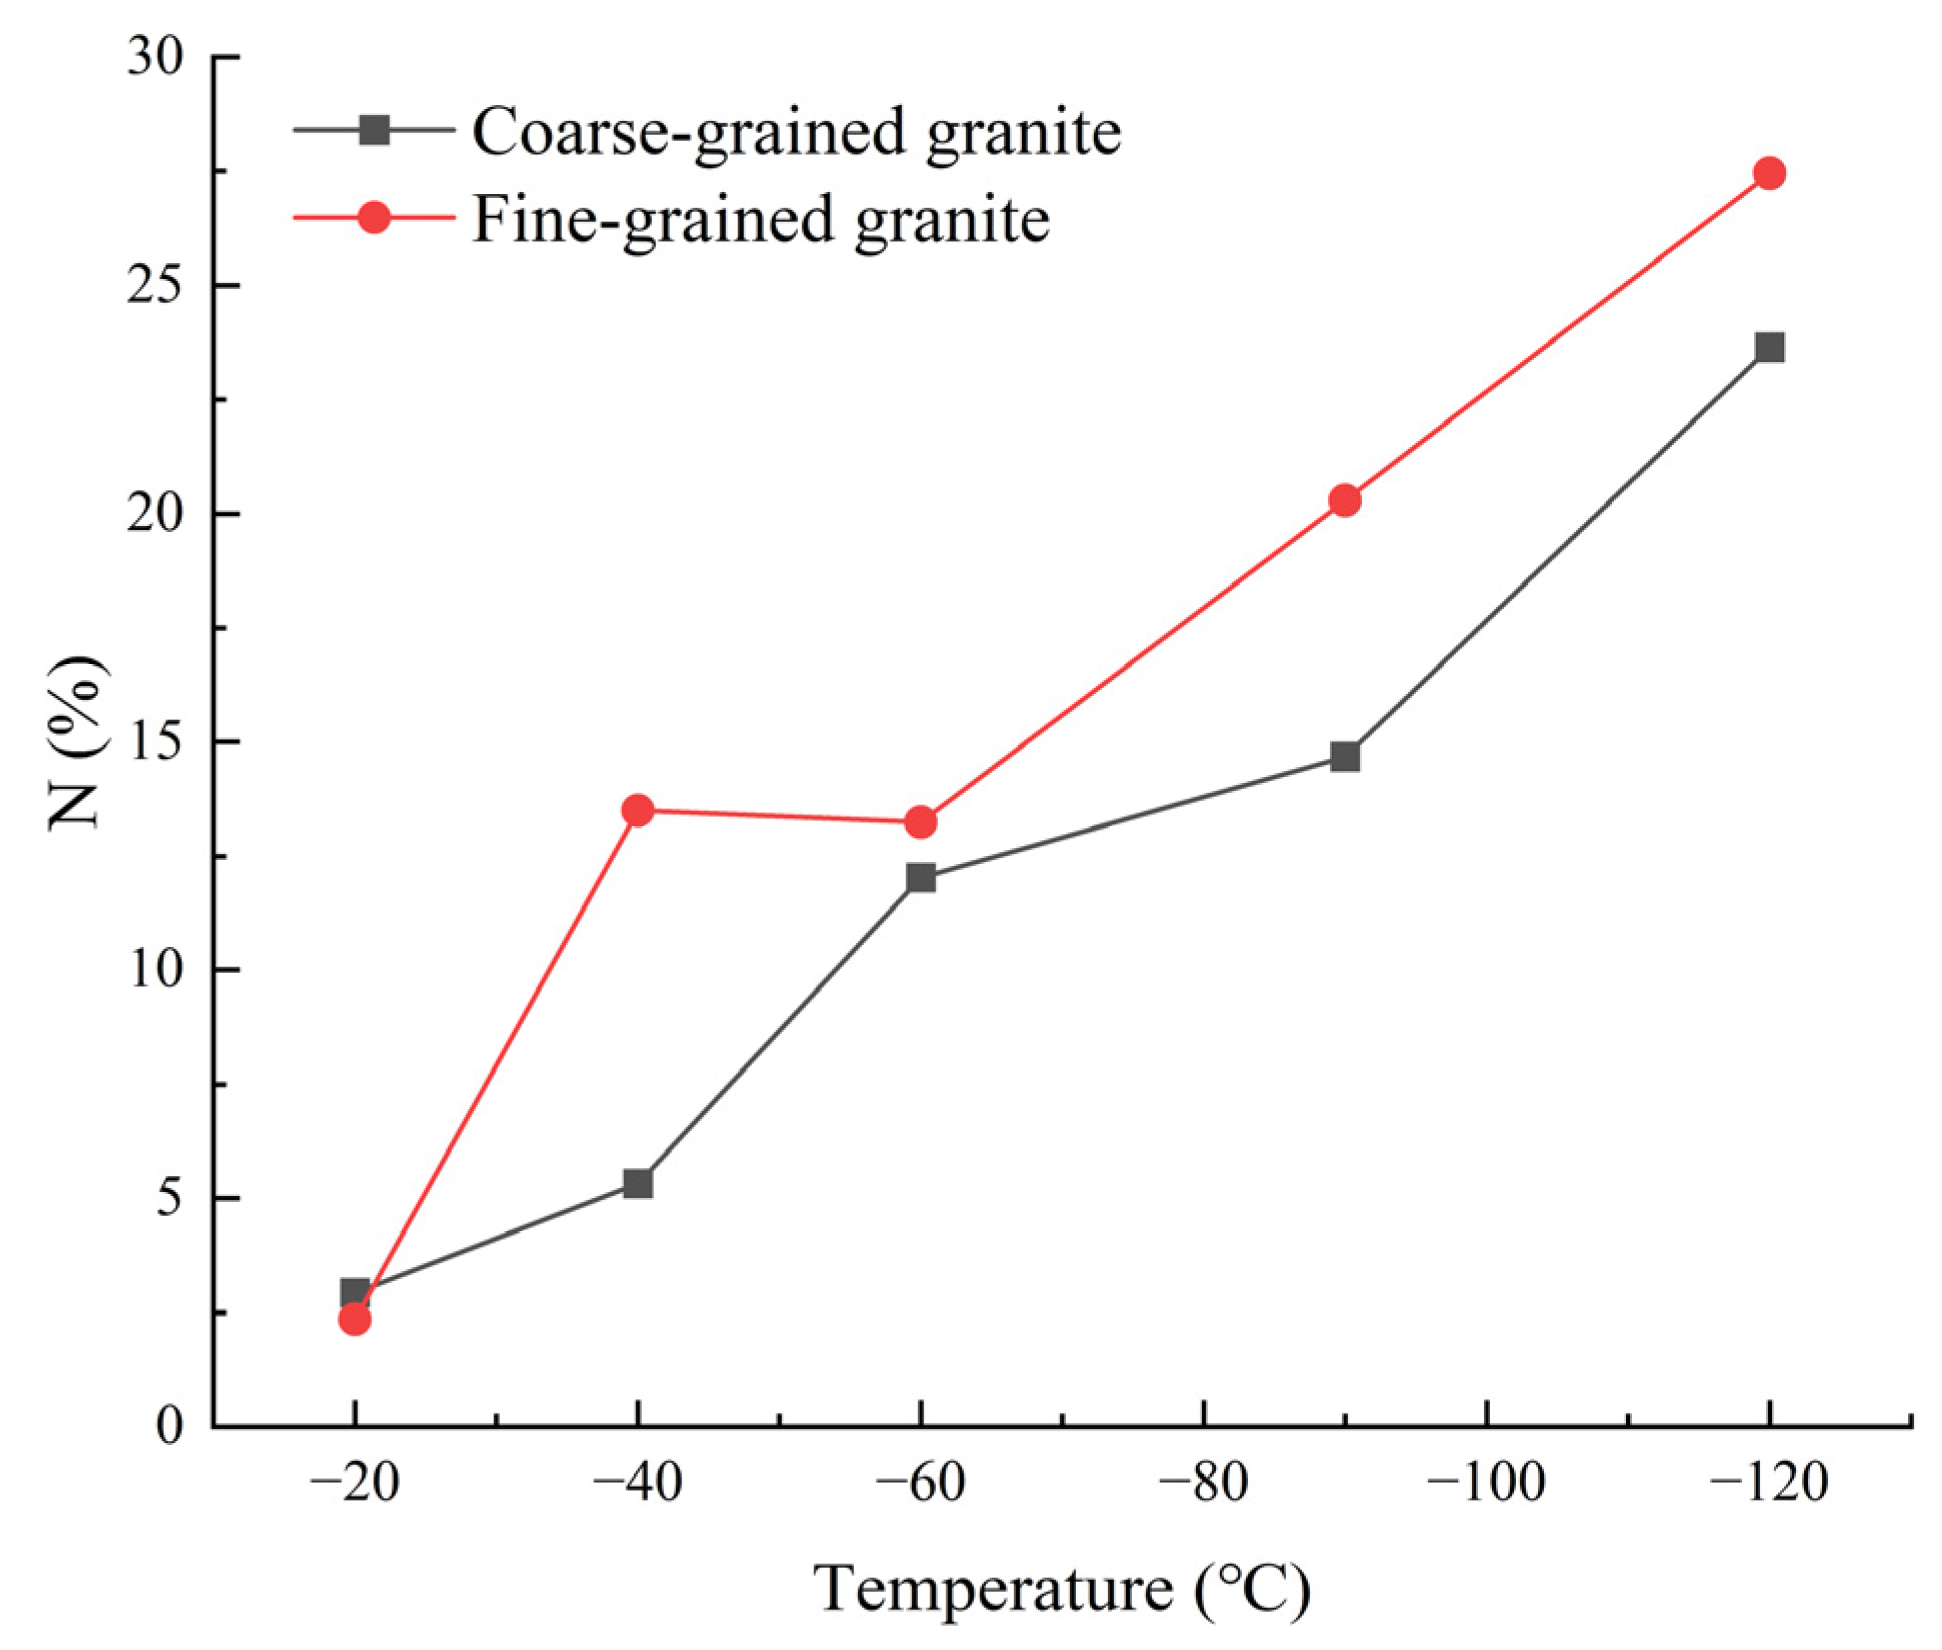
3.4. NMR Test Results
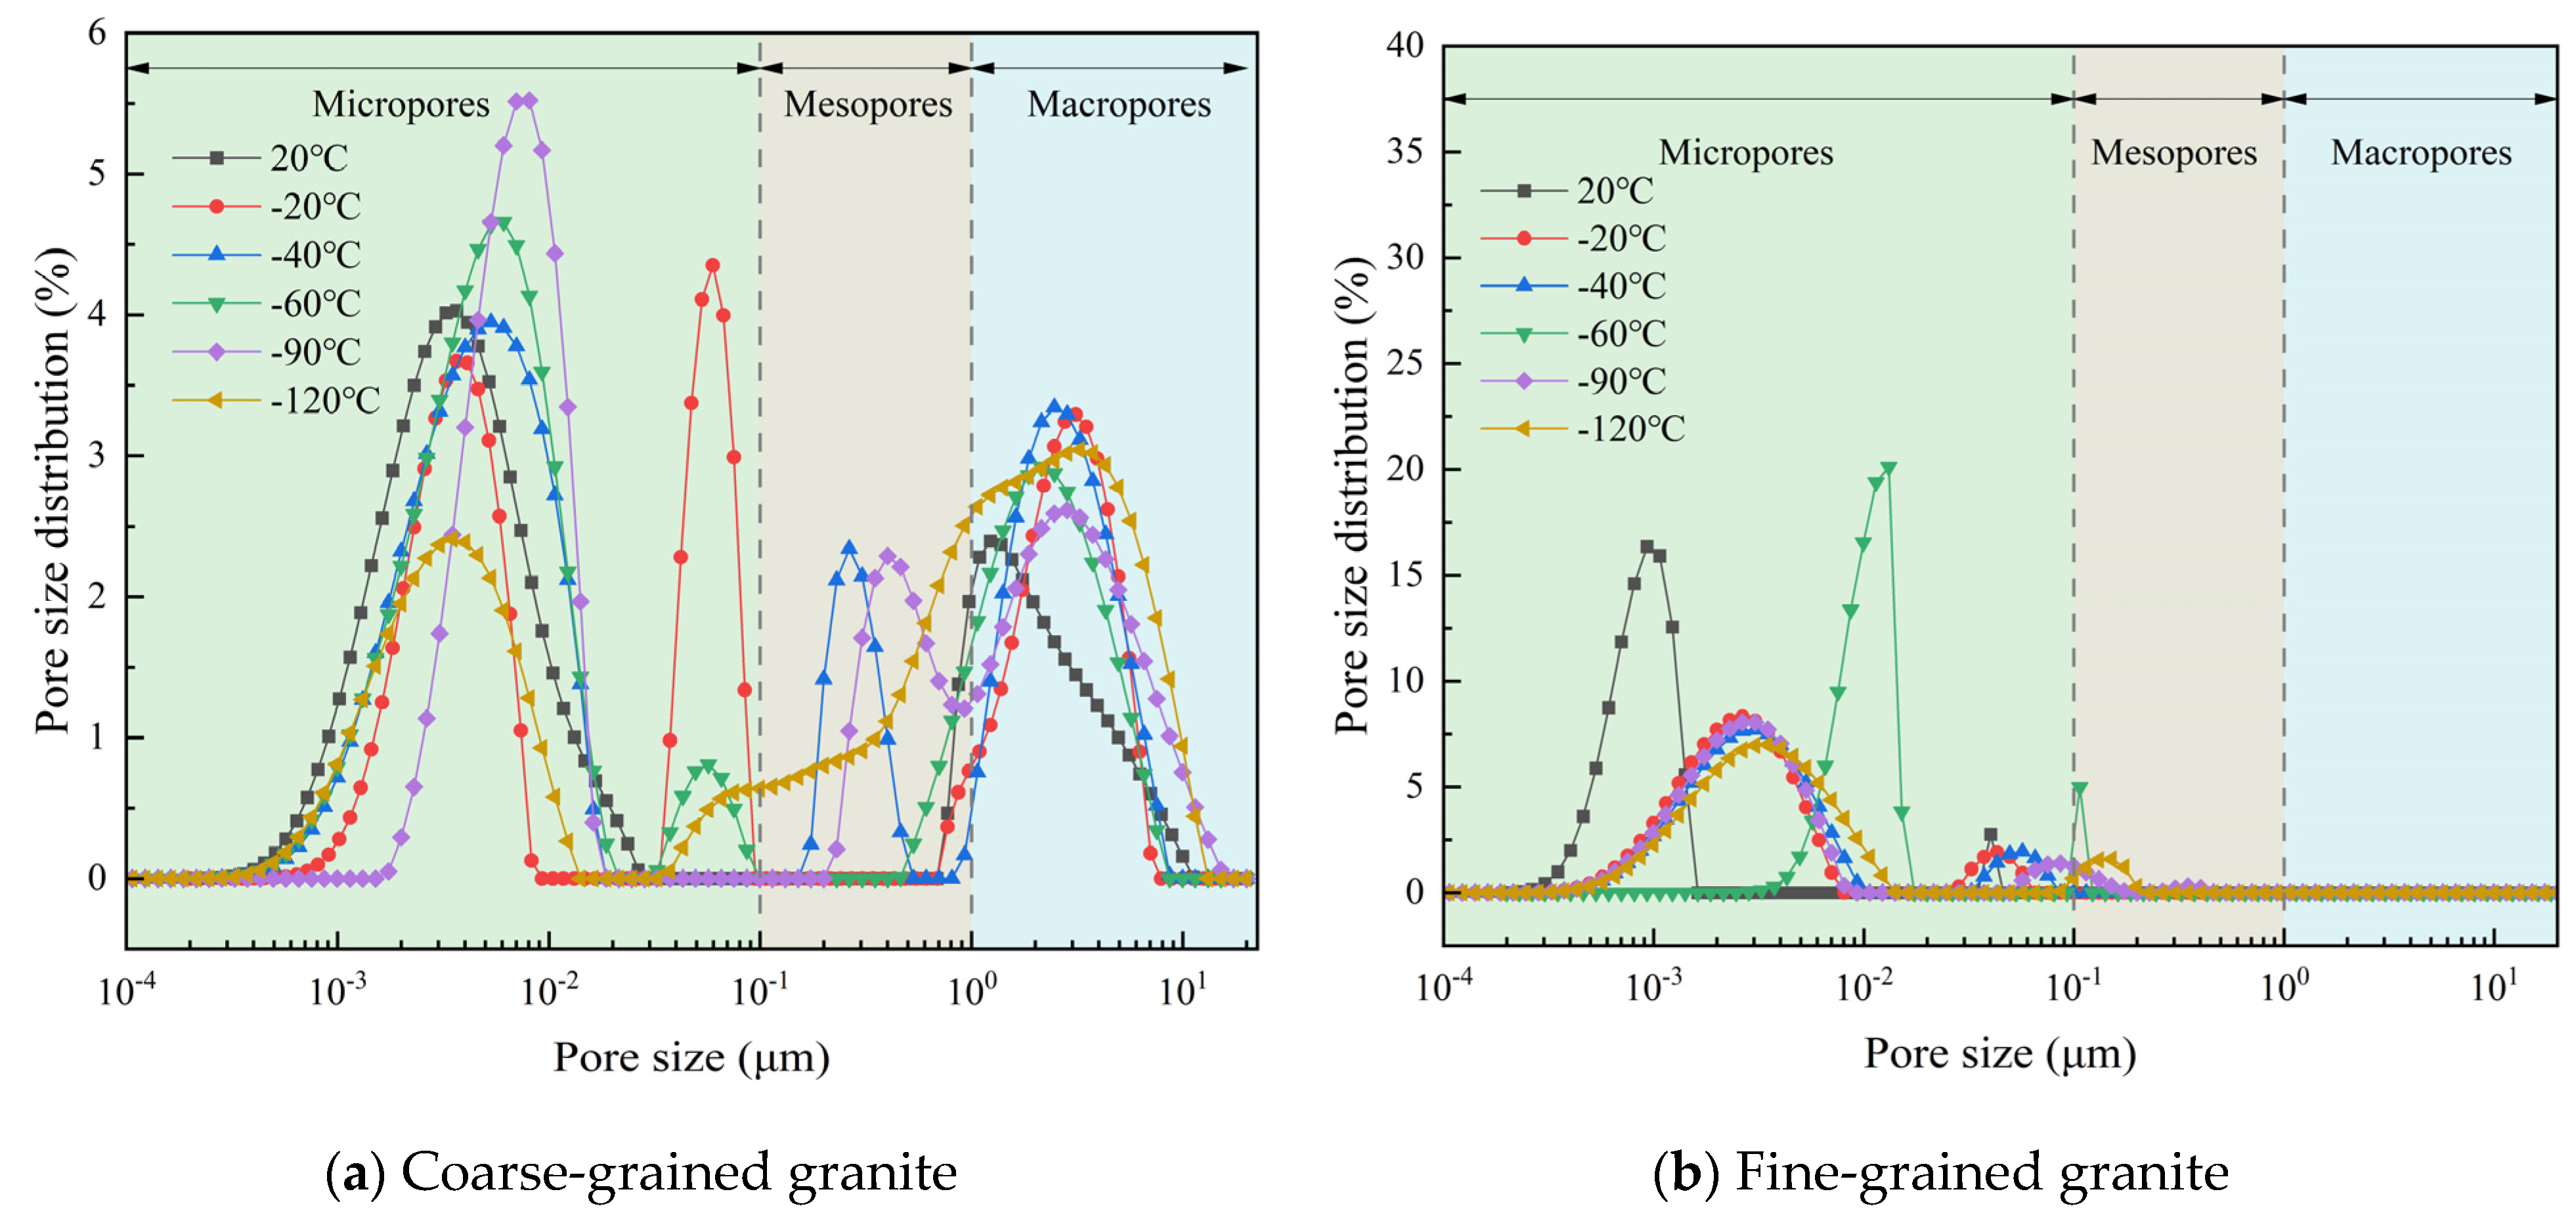
3.4.1. Analysis of T2 Distribution Curve
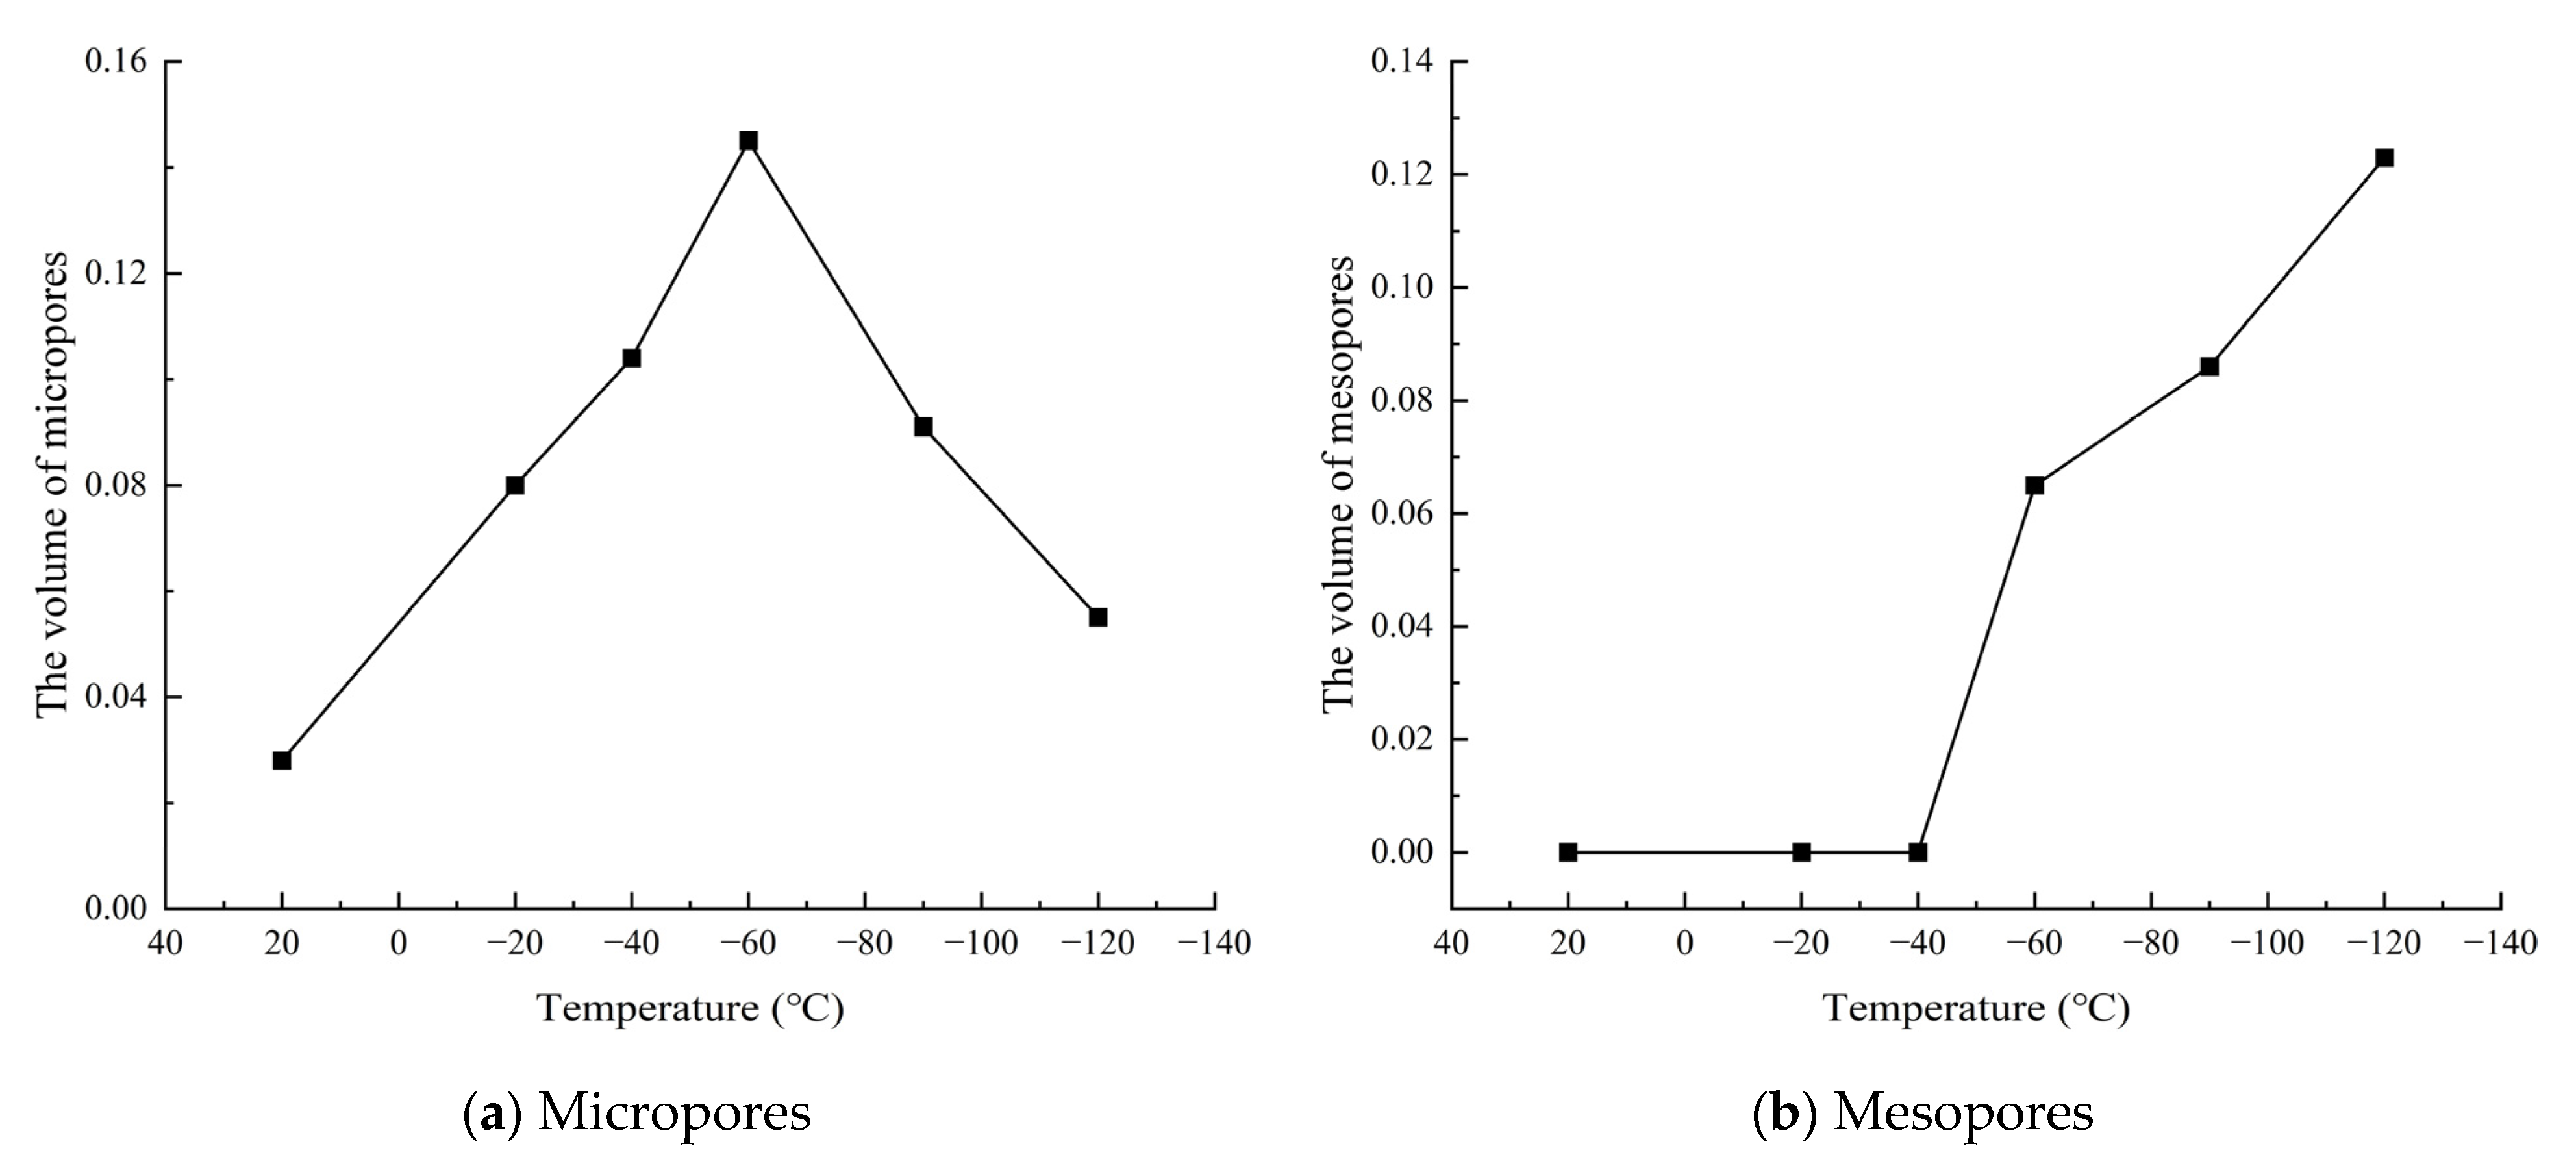
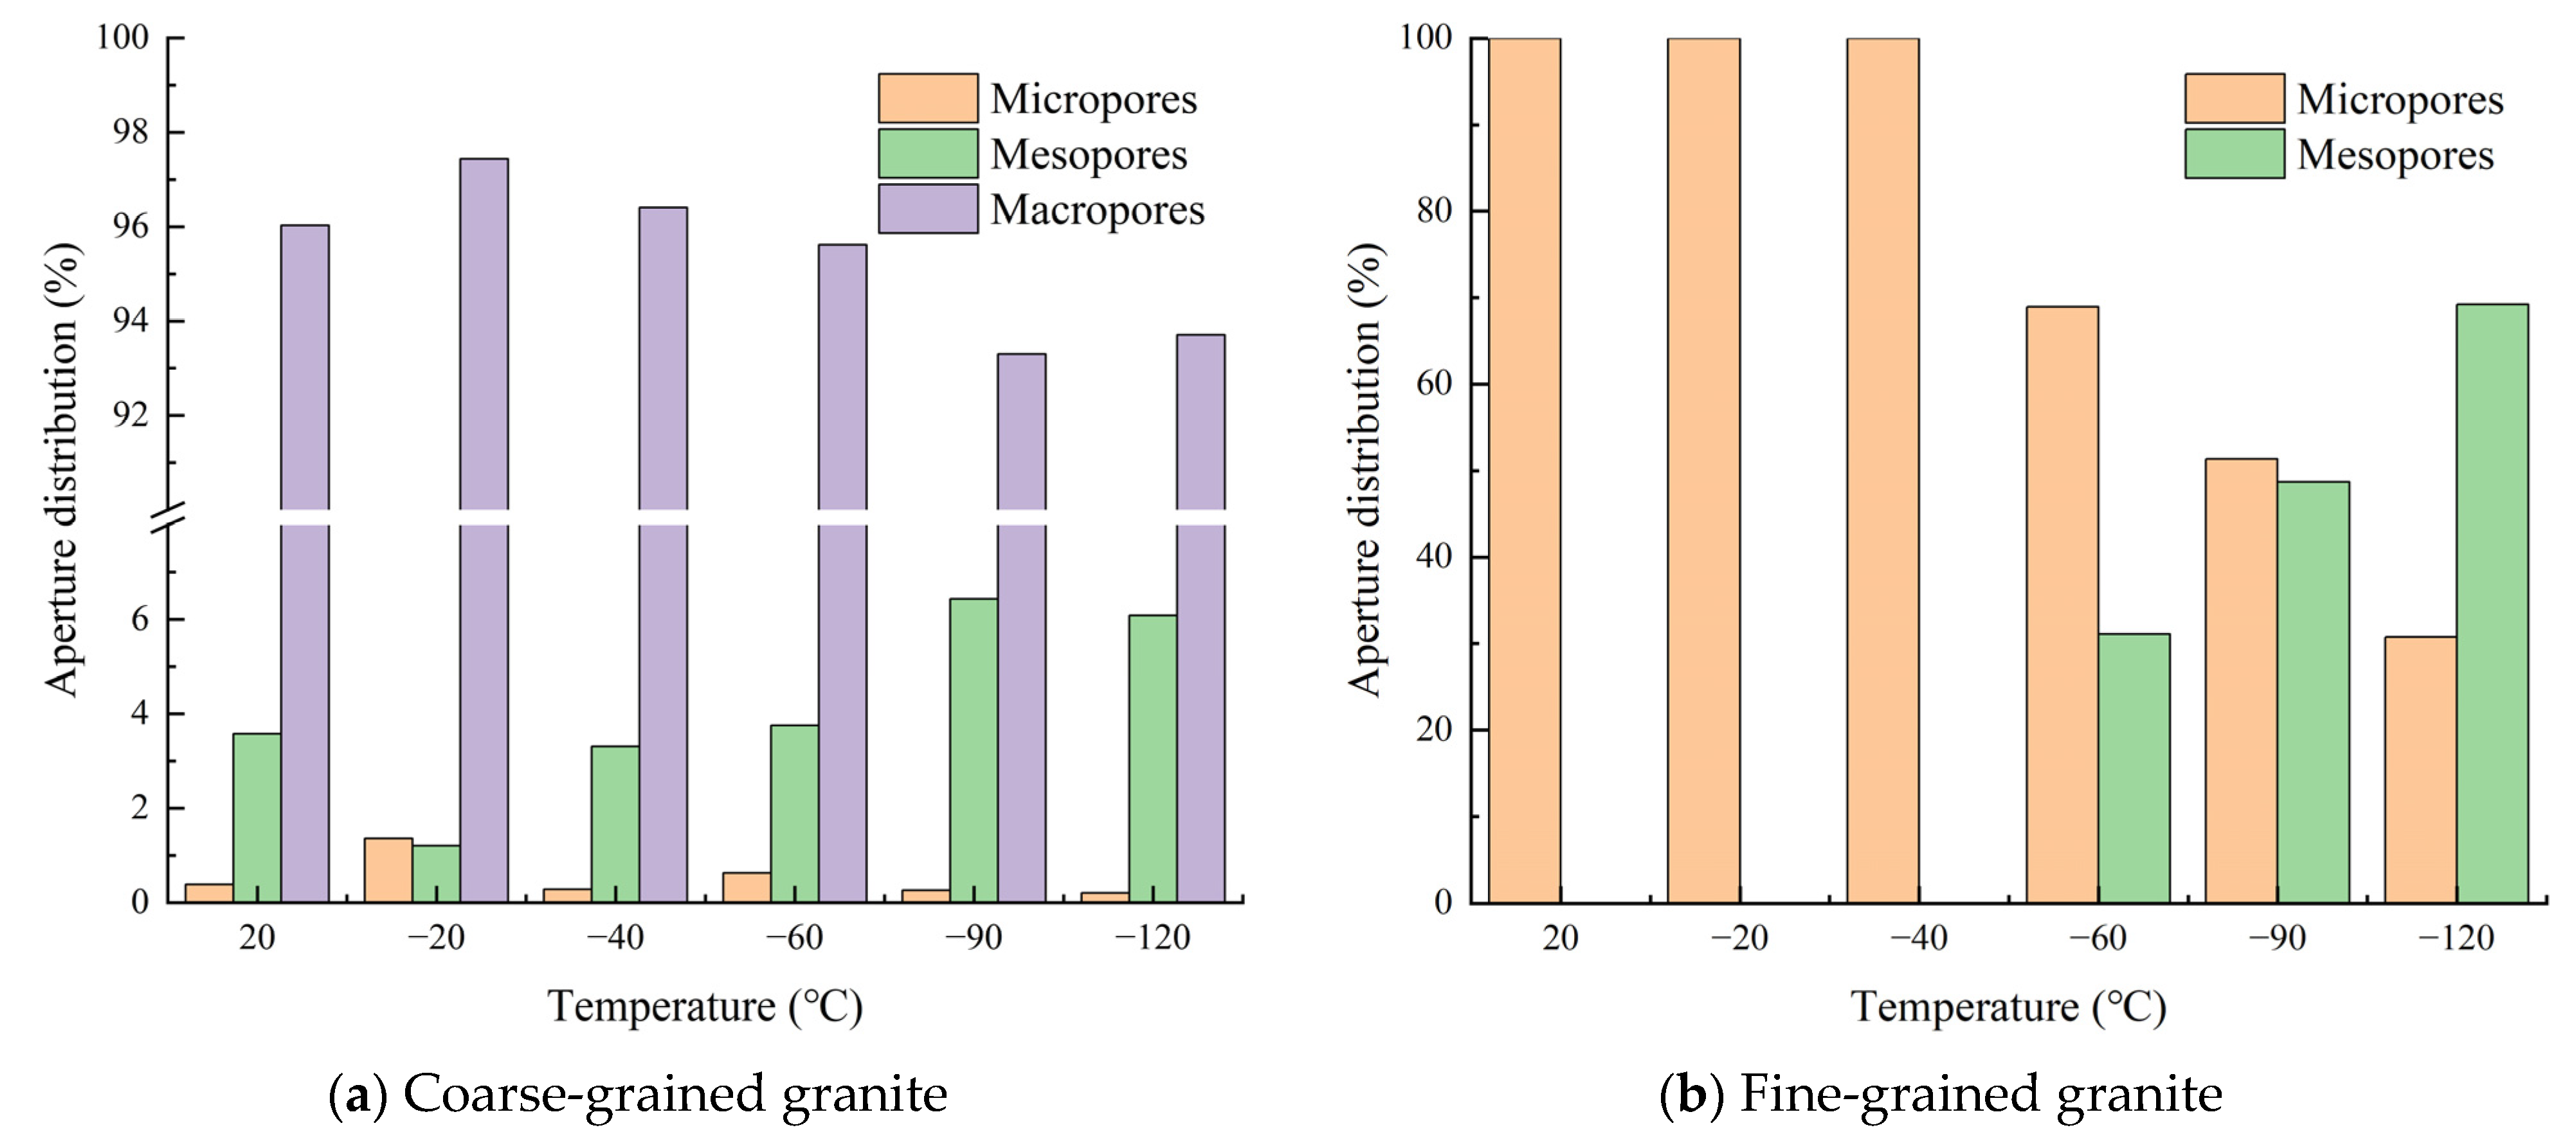
3.4.2. Changes in Pore Size Distribution
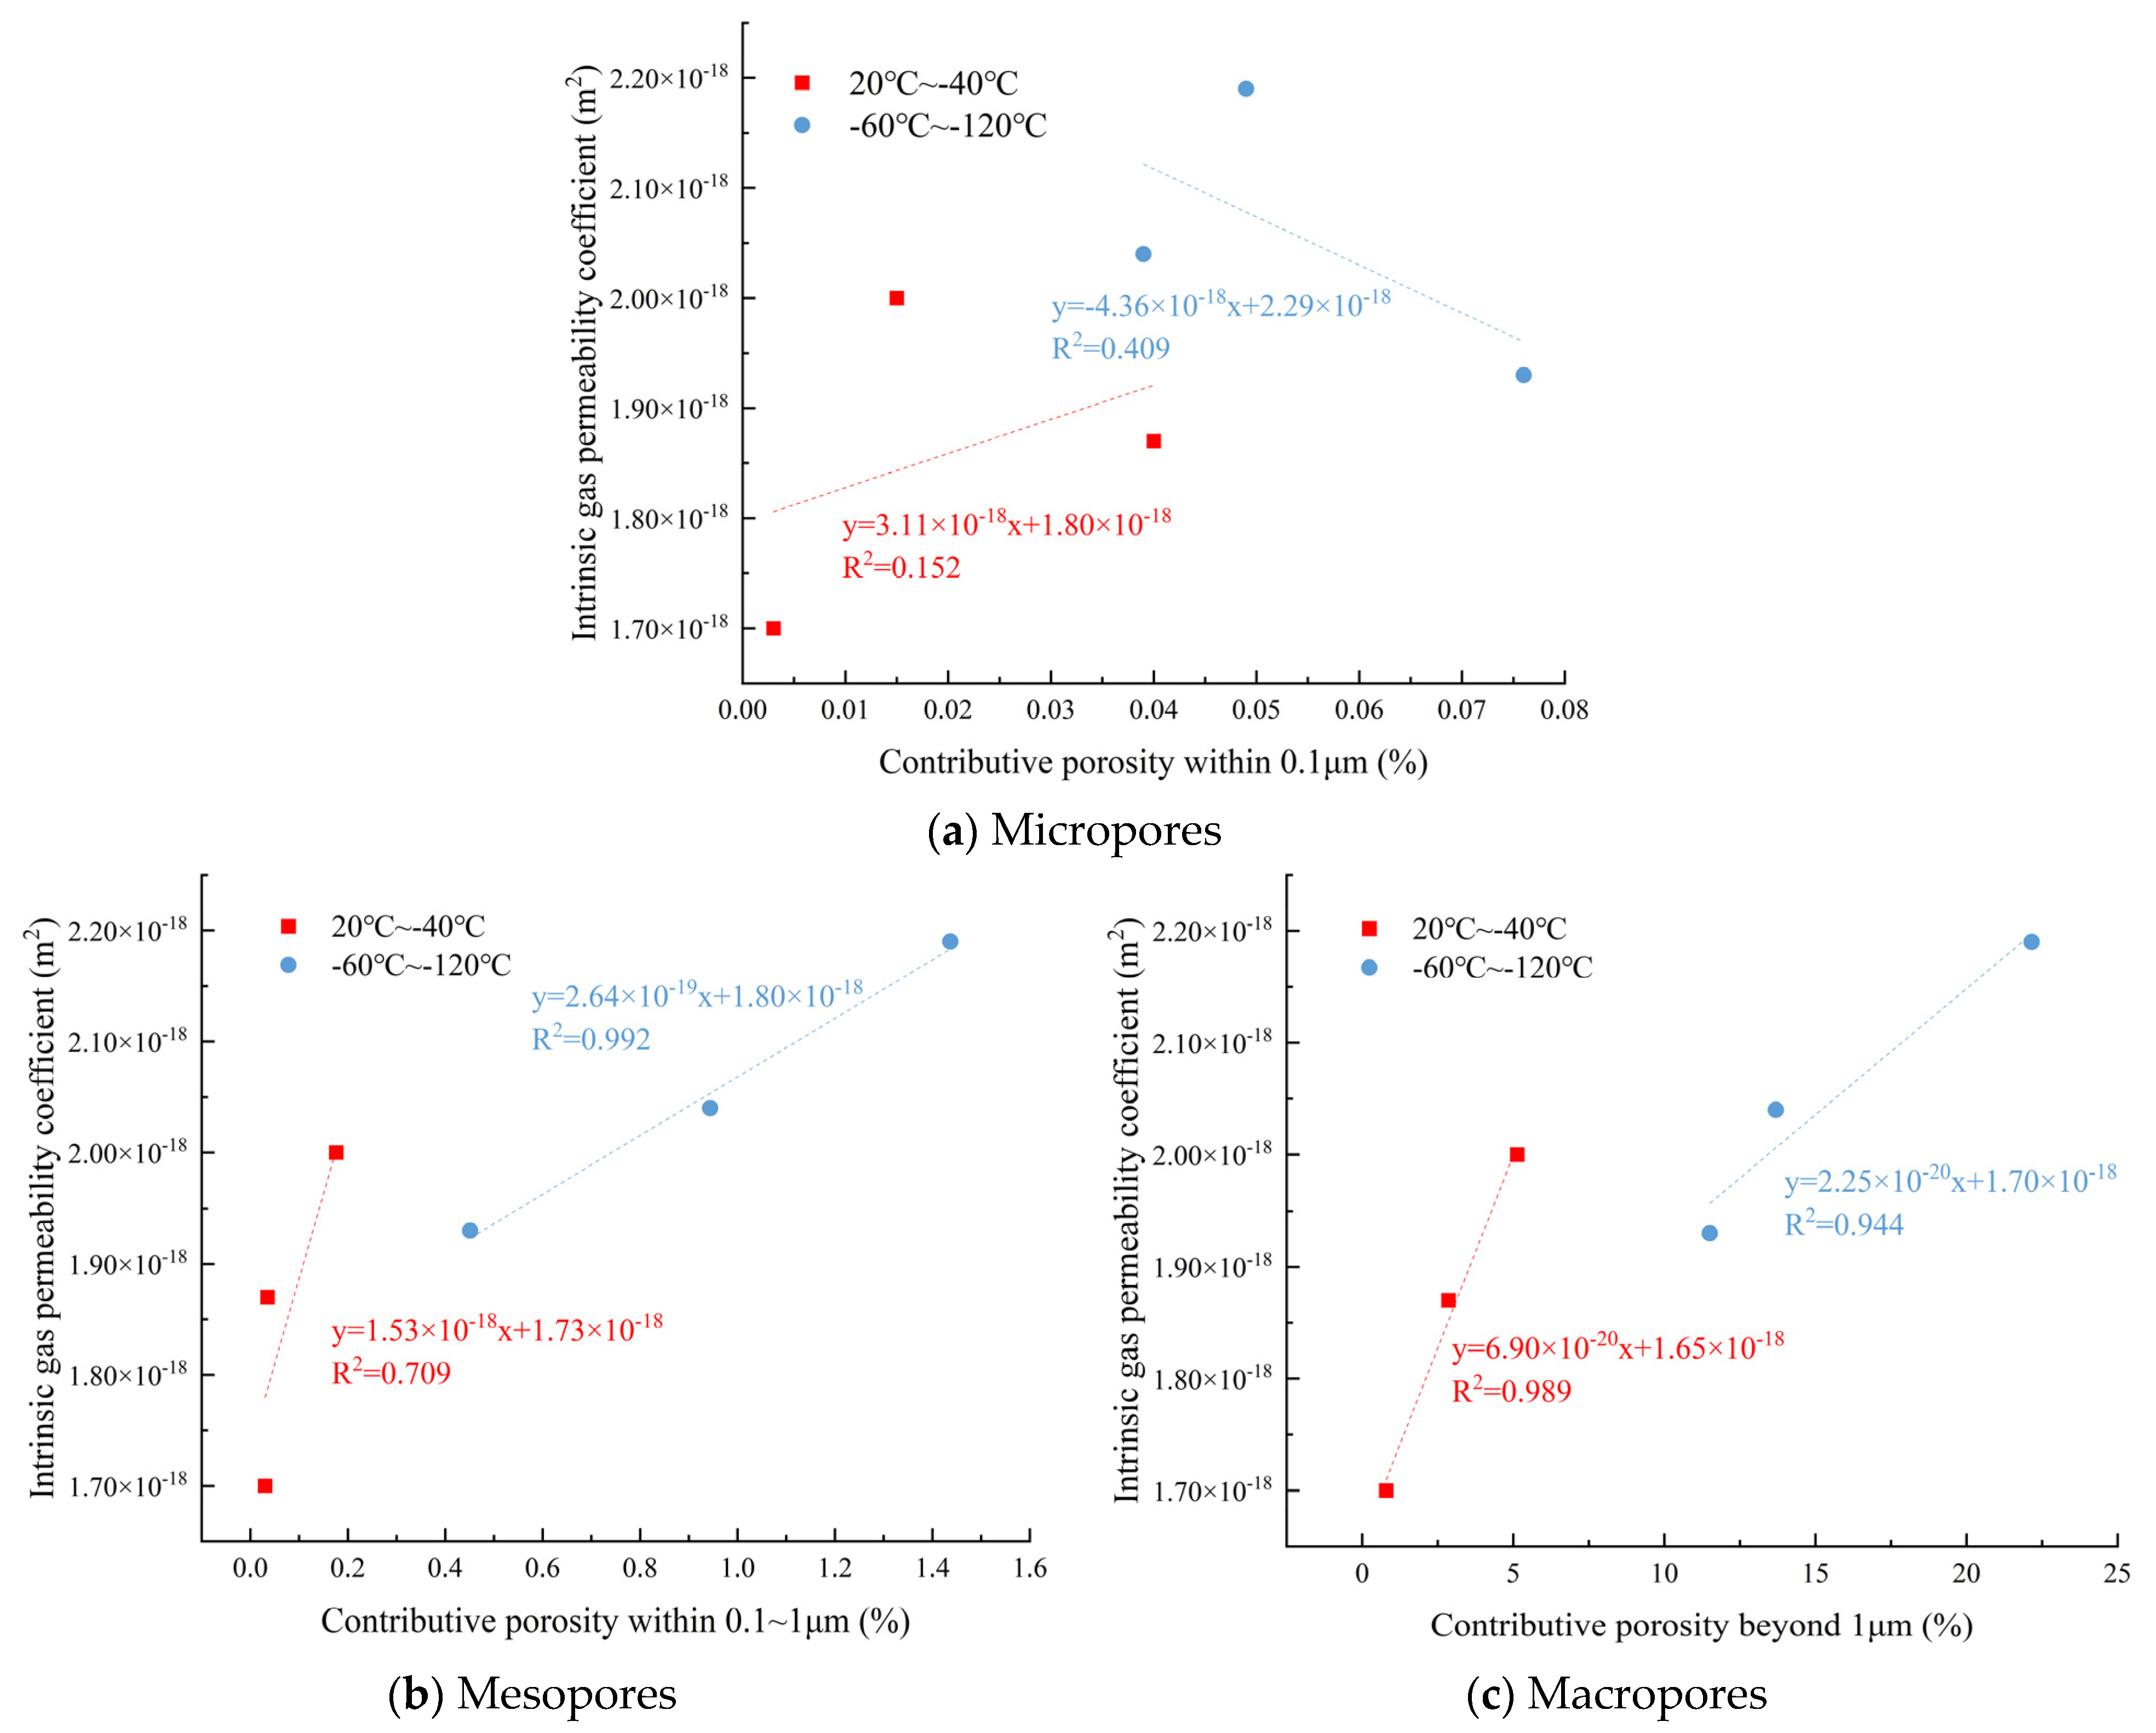
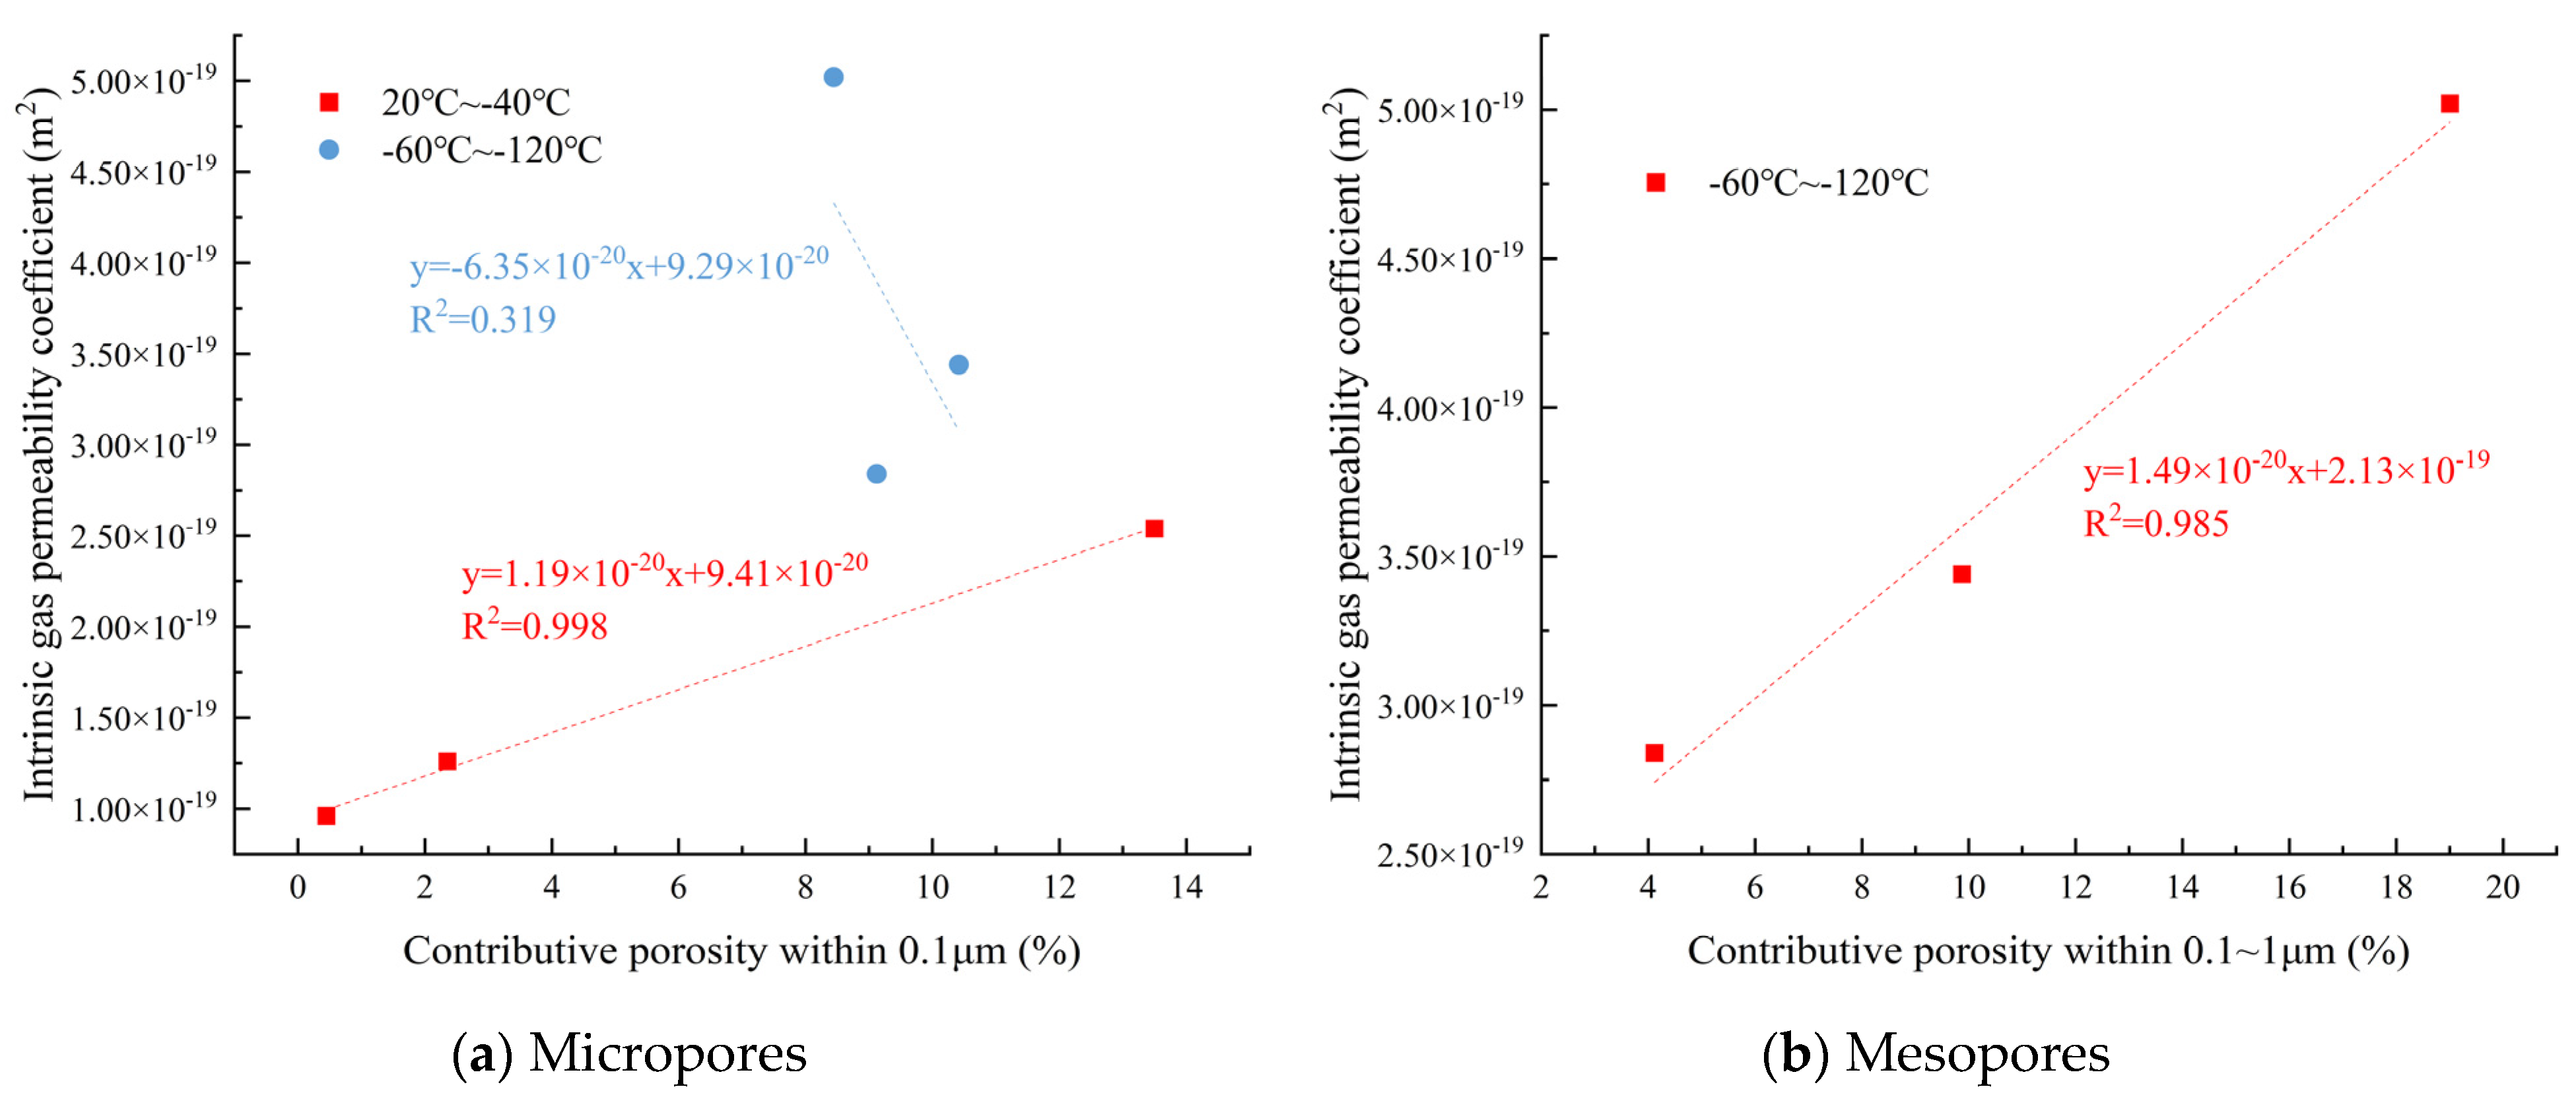
3.5. Relationship Between Pore Structure and Permeability
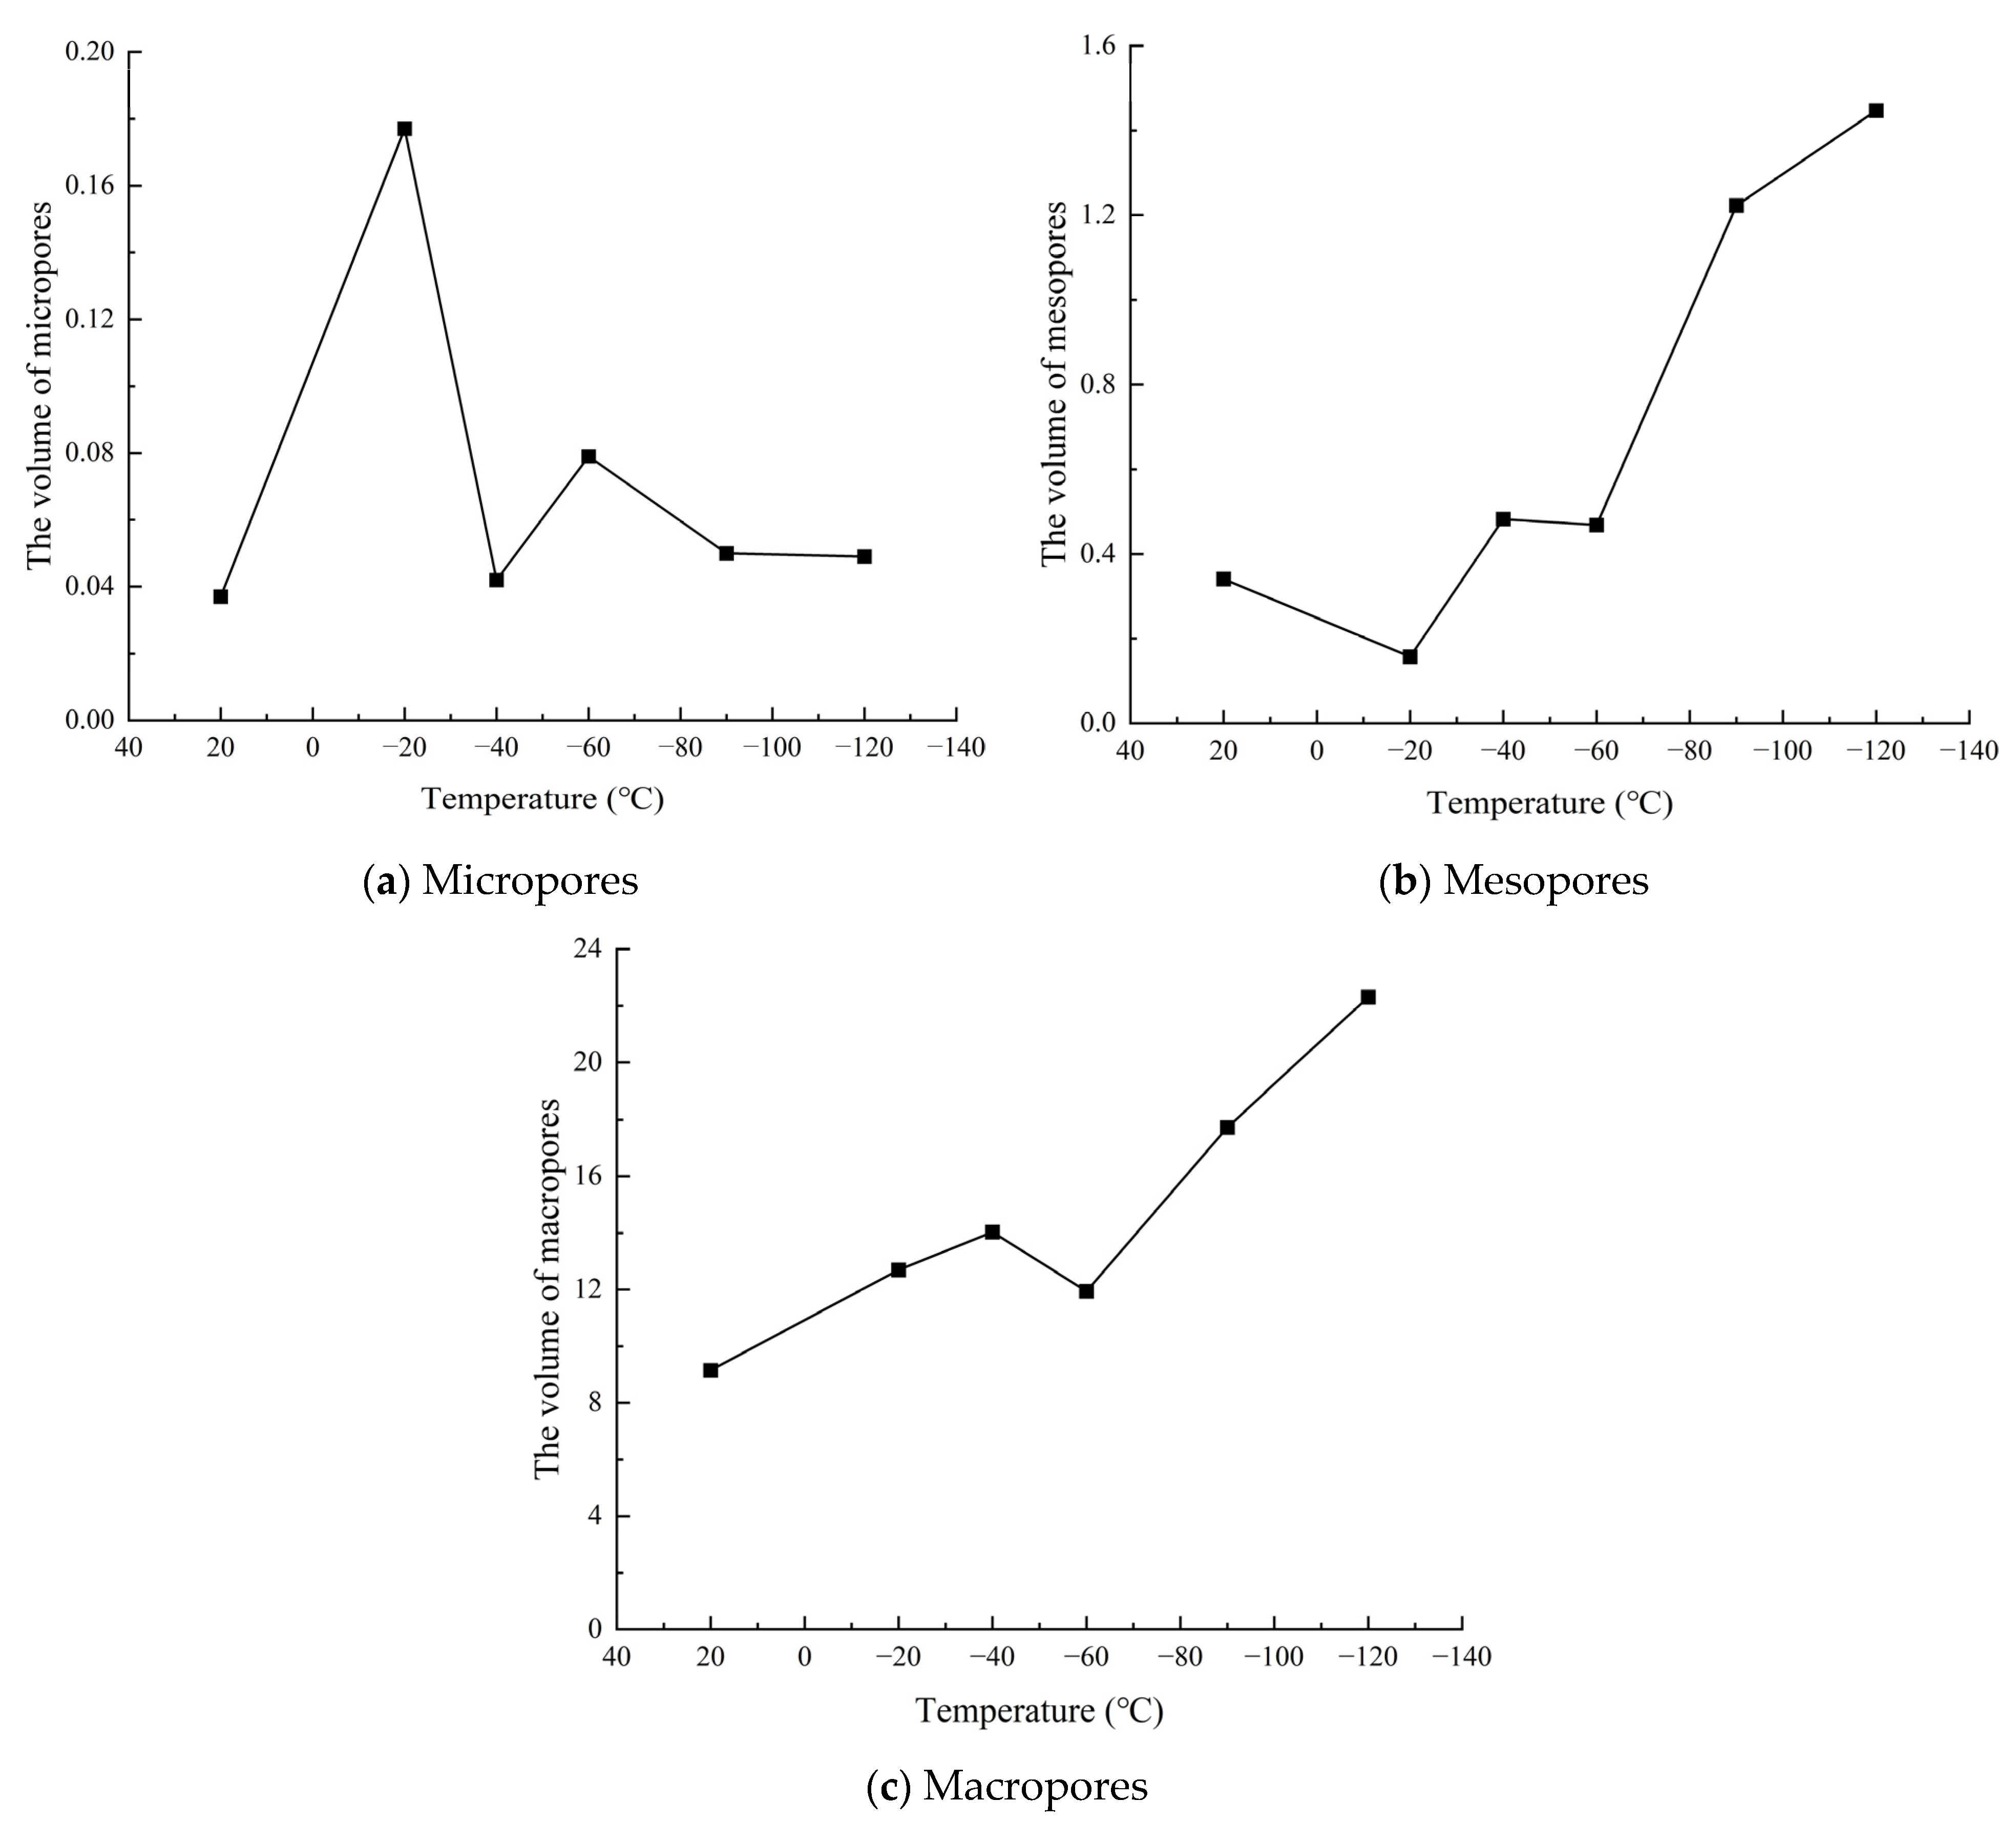
3.5.1. Contributing Porosity of Granite
3.5.2. Relationship Between Pore Size Distribution and Gas Permeability
4. Conclusions
- (1)
- The low dispersion of the 1D and 2D gas permeability test results of coarse-grained granite in the initial state indicates that the pore structure between different specimens of coarse-grained granite is more stable than that of fine-grained granite. As the freezing temperature decreases, the 1D intrinsic gas permeability of granite increases. Due to differences in the freezing point of pore water corresponding to pores of different sizes, the change trend in intrinsic gas permeability in different freezing temperature intervals varies significantly. At the same freezing temperature, the change in intrinsic gas permeability of fine-grained granite is significantly higher than that of coarse-grained granite, indicating that fine-grained granite is more sensitive to freeze–thaw damage.
- (2)
- In real-time cryogenic environments, both granites exhibit a linear increase in 2D gas permeability with a gradual decrease in freezing temperature. Additionally, the greater the 2D gas permeability of the granite at room temperature, the faster the rate of increase in permeability with decreasing temperature.
- (3)
- In real-time cryogenic environments, the two granites exhibited a linear increase in 2D gas permeability with a gradual decrease in freezing temperature. In addition, the greater the 2D gas permeability of the granite at room temperature, the faster the rate of increase in permeability with decreasing temperature.
- (4)
- Coarse-grained granite contains micropores (r < 0.1 μm), mesopores (0.1 μm ≤ r ≤ 1 μm), and macropores (r > 1 μm), with macropores being the dominant pore structure. In contrast, fine-grained granite consists of micropores and mesopores, with mesopores occupying a dominant position. As the freezing temperature decreases, the volume proportion of micropores and macropores in coarse-grained granite decreases, while mesopores increase. In fine-grained granite, the volume proportion of micropores decreases, and mesopores increase.
- (5)
- Among the factors influencing freeze–thaw damage in rocks, lithology plays a dominant role. When the freezing temperature is relatively low, the two types of granite exhibit distinct patterns of freeze–thaw damage evolution. In coarse-grained granite, the damage is primarily manifested in the initiation and expansion of newly formed pores, with new micropores continuously forming and developing into mesopores. In contrast, the freeze–thaw damage in fine-grained granite is more prominently reflected in the intensified expansion of pre-existing pores, with original micropores continuously developing and eventually transforming into mesopores.
- (6)
- In the temperature range of 20 °C to −20 °C, the intrinsic gas permeability of coarse-grained granite is primarily controlled by macropores, while fine-grained granite is dominated by micropores. When the temperature decreases further to the −60 °C to −120 °C interval, the intrinsic gas permeability of coarse-grained granite is influenced by a combination of mesopores and macropores, whereas fine-grained granite is primarily controlled by mesopores.
5. Engineering Implications
- (1)
- The significant increase in gas permeability with decreasing freezing temperature, particularly for fine-grained granite, indicates that temperature fluctuations in cryogenic environments must be carefully considered when designing underground LNG storage facilities. Fine-grained granite’s higher sensitivity to freeze–thaw damage could lead to higher permeability and potential leakage risks over time. Thus, temperature control and monitoring strategies are critical to mitigate such risks.
- (2)
- The distinct patterns of freeze–thaw damage between coarse-grained and fine-grained granite emphasize the need for tailored materials in LNG storage construction. Coarse-grained granite, with its focus on macropores, may be more resilient to freeze–thaw cycles, while fine-grained granite, with its pre-existing micropores, may undergo more significant damage. This should influence the selection of materials for long-term underground storage, particularly in regions where temperature cycling is a concern.
6. Outlook
- (1)
- The operating temperature of underground LNG is approximately −162 °C, while the lowest temperature in this study is −120 °C. Future research could explore gas permeability at temperatures as low as −162 °C or even lower.
- (2)
- In future microstructural studies, it may be valuable to incorporate experimental methods such as scanning electron microscopy (SEM) and computed tomography (CT), with a particular emphasis on −60 °C as a critical threshold. Robust and efficient vision-based models, such as DeepLab [47] and EfficientNet [48], could be utilized to carefully examine the damage effects of low temperatures on the microstructure of rocks.
Author Contributions
Funding
Institutional Review Board Statement
Informed Consent Statement
Data Availability Statement
Acknowledgments
Conflicts of Interest
References
- Wang, Y.; Li, S.; Gu, X.; Sun, Q.; Zhang, R.; Chen, F. Spatio-temporal evolution and multi-subject influencing factors of urban green development efficiency in China: Under the carbon neutral vision constraint. Ecol. Indic. 2024, 167, 112580. [Google Scholar] [CrossRef]
- Yang, C.; Wang, T.; Chen, H. Theoretical and Technological Challenges of Deep Underground Energy Storage in China. Engineering 2023, 25, 168–181. [Google Scholar] [CrossRef]
- Chen, J.; Zeng, Q. A multi-level perspective on technological advancement in China’s natural gas industry. Energy Res. Soc. Sci. 2025, 120, 103877. [Google Scholar] [CrossRef]
- Zhang, J.; Tan, Y.; Zhang, T.; Yu, K.; Wang, X.; Zhao, Q. Natural gas market and underground gas storage development in China. J. Energy Storage 2020, 29, 101338. [Google Scholar] [CrossRef]
- Ivankina, T.I.; Zel, I.Y.; Petruzalek, M.; Rodkin, M.V.; Matveev, M.A.; Lokajicek, T. Elastic anisotropy, permeability, and freeze-thaw cycling of rapakivi granite. Int. J. Rock Mech. Min. Sci. 2020, 136, 104541. [Google Scholar] [CrossRef]
- Song, J.; Gong, Y.; Wu, S.; Zhang, Y. Damage deterioration behavior of granite subjected to freeze-thaw cycles: Experiments and theories. Constr. Build. Mater. 2024, 450, 138540. [Google Scholar] [CrossRef]
- Li, Y.; Hao, Z.; Jia, X. Experimental study of fracture behaviors of granite at ultra-low temperatures. Constr. Build. Mater. 2024, 419, 135510. [Google Scholar] [CrossRef]
- Wang, Y.; Zhang, B.; Gao, S.H.; Li, C.H. Investigation on the effect of freeze-thaw on fracture mode classification in marble subjected to multi-level cyclic loads. Theor. Appl. Fract. Mech. 2021, 111, 102847. [Google Scholar] [CrossRef]
- Song, Z.; Wang, Y.; Konietzky, H.; Cai, X. Mechanical behavior of marble exposed to freeze-thaw-fatigue loading. Int. J. Rock Mech. Min. Sci. 2021, 138, 104648. [Google Scholar] [CrossRef]
- Xuan, Z.-Q.; Sun, Z.-M.; Wang, J.-G.; Sun, W.-J.; Liang, B.; Ma, Z. Pore structure evolution and damage creep model of shale subjected to freeze-thaw treatment. J. Mater. Res. Technol. 2022, 19, 821–836. [Google Scholar] [CrossRef]
- Gao, F.; Li, C.; Xiong, X.; Zhang, Y.; Zhou, K. Dynamic behaviors of water-saturated and frozen sandstone subjected to freeze-thaw cycles. J. Rock Mech. Geotech. Eng. 2023, 15, 1476–1490. [Google Scholar] [CrossRef]
- Wang, J.; Cui, D.; Chen, Q.; Chen, J.; Dai, M. Morphological damage and strength deterioration of red sandstone under freeze–thaw cycles. J. Rock Mech. Geotech. Eng. 2023, 17, 671–687. [Google Scholar] [CrossRef]
- Yang, C.; Zhou, K.; Xiong, X.; Deng, H.; Pan, Z. Experimental investigation on rock mechanical properties and infrared radiation characteristics with freeze-thaw cycle treatment. Cold Reg. Sci. Technol. 2021, 183, 103232. [Google Scholar] [CrossRef]
- Zhang, D.; Lu, G.; Wu, J.; Nie, W.; Ranjith, P.G. Effects of ultralow temperature and water saturation on the mechanical properties of sandstone. Rock Mech. Rock Eng. 2023, 56, 3377–3397. [Google Scholar] [CrossRef]
- Mardoukhi, A.; Mardoukhi, Y.; Hokka, M.; Kuokkala, V.-T. Effects of test temperature and low temperature thermal cycling on the dynamic tensile strength of granitic rocks. Rock Mech. Rock Eng. 2021, 54, 443–454. [Google Scholar] [CrossRef]
- Xu, Y.; Liu, J.; You, Z.; Xia, K.; Peng, J. Dynamic mode I fracture properties of saturated white sandstone under ambient sub-zero temperatures. Eng. Fract. Mech. 2023, 277, 108987. [Google Scholar] [CrossRef]
- Zhang, D.; Lu, G.; Song, Y.; Nie, W.; Ranjith, P.G. Experimental study of the effect of ultralow temperature on the fracture toughness of sandstone. Eng. Fract. Mech. 2024, 296, 109830. [Google Scholar] [CrossRef]
- Abdolghanizadeh, K.; Hosseini, M.; Saghafiyazdi, M. Effect of freezing temperature and number of freeze–thaw cycles on mode I and mode II fracture toughness of sandstone. Theor. Appl. Fract. Mech. 2020, 105, 102428. [Google Scholar] [CrossRef]
- Liu, C.; Deng, H.; Chen, X.; Xiao, D.; Li, B. Impact of rock samples size on the microstructural changes induced by freeze–thaw cycles. Rock Mech. Rock Eng. 2020, 53, 5293–5300. [Google Scholar] [CrossRef]
- Gong, Y.; Song, J.; Wu, S.; Zhang, Y. Evolution of pore structure and analysis of freeze damage in granite during cyclic freeze-thaw using NMR technique. Eng. Geol. 2024, 335, 107545. [Google Scholar] [CrossRef]
- Zheng, P.; Tan, X.; Du, Z.; Liu, X.; Zhou, Y.; Shen, K.; Guan, B.; Chen, W. Microscopic damage and deterioration of carbonaceous slate in cold region subjected to freeze-thaw cycles. J. Rock Mech. Geotech. Eng. 2025, in press. [Google Scholar] [CrossRef]
- Wang, Y.; Song, Z.; Mao, T.; Zhu, C. Macro–meso fracture and instability behaviors of hollow-cylinder granite containing fissures subjected to freeze–thaw–fatigue loads. Rock Mech. Rock Eng. 2022, 55, 4051–4071. [Google Scholar] [CrossRef]
- Park, J.; Hyun, C.-U.; Park, H.-D. Changes in microstructure and physical properties of rocks caused by artificial freeze–thaw action. Bull. Eng. Geol. Environ. 2015, 74, 555–565. [Google Scholar] [CrossRef]
- Liu, T.; Zhang, C.; Li, J.; Zhou, K.; Ping, C. Detecting freeze–thaw damage degradation of sandstone with initial damage using NMR technology. Bull. Eng. Geol. Environ. 2021, 80, 4529–4545. [Google Scholar] [CrossRef]
- Sun, Y.; Zhai, C.; Xu, J.; Cong, Y.; Qin, L.; Zhao, C. Characterisation and evolution of the full size range of pores and fractures in rocks under freeze-thaw conditions using nuclear magnetic resonance and three-dimensional X-ray microscopy. Eng. Geol. 2020, 271, 105616. [Google Scholar] [CrossRef]
- Inada, Y.; Yokota, K. Some studies of low temperature rock strength. Int. J. Rock Mech. Min. Sci. Geomech. Abstr. 1984, 21, 145–153. [Google Scholar] [CrossRef]
- Sakhno, I.; Sakhno, S.; Vovna, O. Surface subsidence response to safety pillar width between reactor cavities in the underground gasification of thin coal seams. Sustainability 2025, 17, 2533. [Google Scholar] [CrossRef]
- Kim, J.-H.; Park, S.-G.; Yi, M.-J.; Son, J.-S.; Cho, S.-J. Borehole radar investigations for locating ice ring formed by cryogenic condition in an underground cavern. J. Appl. Geophys. 2007, 62, 204–214. [Google Scholar] [CrossRef]
- Yu, H.; Yi, Y.; Romagnoli, A.; Tan, W.L. Effect of ultralow temperature on expansion, strength, and modulus of cement-stabilized soil: Case study for LNG underground storage in Singapore. J. Cold Reg. Eng. 2023, 37, 5022003. [Google Scholar] [CrossRef]
- Zhang, Y.-F.; Zhang, F.; Lv, D.-B.; Ding, X. Experimental study on uniaxial compression of granite under real-time loading at designated low-temperature conditions. Environ. Geotech. 2024, 11, 701–713. [Google Scholar] [CrossRef]
- Hou, C.; Jin, X.; He, J.; Li, H. Experimental studies on the pore structure and mechanical properties of anhydrite rock under freeze-thaw cycles. J. Rock Mech. Geotech. Eng. 2022, 14, 781–797. [Google Scholar] [CrossRef]
- Dana, E.; Skoczylas, F. Gas relative permeability and pore structure of sandstones. Int. J. Rock Mech. Min. Sci. 1999, 36, 613–625. [Google Scholar] [CrossRef]
- Chen, W.; Li, K.; Wu, M.; Liu, D.; Wang, P.; Liang, Y. Influence of pore structure characteristics on the gas permeability of concrete. J. Build. Eng. 2023, 79, 107852. [Google Scholar] [CrossRef]
- Shell Development Co.; Klinkenberg, L.J. The permeability of porous media to liquids and gases. SOCAR Proceedings 57–73. 2012. [CrossRef]
- Qian, R.; Shi, J.; Liu, G.; Pang, B.; Liu, Z.; She, W.; Zhang, Y. Radial gas-permeability measurement in cement-based materials under steady-state flow. Flow Meas. Instrum. 2021, 79, 101896. [Google Scholar] [CrossRef]
- Panerai, F.; White, J.D.; Cochell, T.J.; Schroeder, O.M.; Mansour, N.N.; Wright, M.J.; Martin, A. Experimental measurements of the permeability of fibrous carbon at high-temperature. Int. J. Heat Mass Transf. 2016, 101, 267–273. [Google Scholar] [CrossRef]
- Chen, Y.; Jiang, C.; Leung, J.Y.; Wojtanowicz, A.K.; Zhang, D.; Zhong, C. Second-order correction of klinkenberg equation and its experimental verification on gas shale with respect to anisotropic stress. J. Nat. Gas Sci. Eng. 2021, 89, 103880. [Google Scholar] [CrossRef]
- Winkler, E.M. Frost damage to stone and concrete: Geological considerations. Eng. Geol. 1968, 2, 315–323. [Google Scholar] [CrossRef]
- Bridgman, P.W. Water, in the liquid and five solid forms, under pressure. Proc. Am. Acad. Arts Sci. 1912, 47, 441. [Google Scholar] [CrossRef]
- Davidson, G.P.; Nye, J.F. A photoelastic study of ice pressure in rock cracks. Cold Reg. Sci. Technol. 1985, 11, 141–153. [Google Scholar] [CrossRef]
- Sousa, L.M.O.; Suárez del Río, L.M.; Calleja, L.; Ruiz de Argandoña, V.G.; Rey, A.R. Influence of microfractures and porosity on the physico-mechanical properties and weathering of ornamental granites. Eng. Geol. 2005, 77, 153–168. [Google Scholar] [CrossRef]
- Liu, Z.; Wang, L.; Zhao, B.; Leng, J.; Zhang, G.; Yang, D. Heat transfer in sandstones at low temperature. Rock Mech. Rock Eng. 2019, 52, 35–45. [Google Scholar] [CrossRef]
- Liu, L.; Qin, G.; Zhou, Y.; Chen, H.; Wang, X. Freezing behavior of unsaturated porous materials. Constr. Build. Mater. 2021, 274, 122112. [Google Scholar] [CrossRef]
- Nicholson, D.T.; Nicholson, F.H. Physical deterioration of sedimentary rocks subjected to experimental freeze–thaw weathering. Earth Surf. Process. Landf. 2000, 25, 1295–1307. [Google Scholar] [CrossRef]
- Jin, P.; Hu, Y.; Shao, J.; Liu, Z.; Feng, G.; Song, S. Influence of temperature on the structure of pore–fracture of sandstone. Rock Mech. Rock Eng. 2020, 53, 1–12. [Google Scholar] [CrossRef]
- Zhang, J.; Guo, J.; Li, D.; Zhang, Y.; Bian, F.; Fang, Z. The influence of admixture on chloride time-varying diffusivity and microstructure of concrete by low-field NMR. Ocean Eng. 2017, 142, 94–101. [Google Scholar] [CrossRef]
- Song, Z.; Zou, S.; Zhou, W.; Huang, Y.; Shao, L.; Yuan, J.; Gou, X.; Jin, W.; Wang, Z.; Chen, X.; et al. Clinically applicable histopathological diagnosis system for gastric cancer detection using deep learning. Nat. Commun. 2020, 11, 4294. [Google Scholar] [CrossRef]
- Kabir, H.; Wu, J.; Dahal, S.; Joo, T.; Garg, N. Automated estimation of cementitious sorptivity via computer vision. Nat. Commun. 2024, 15, 9935. [Google Scholar] [CrossRef]


| Particle | Natural Density | Dry Density | Saturation Density | Porosity |
|---|---|---|---|---|
| (g/cm3) | (g/cm3) | (g/cm3) | (%) | |
| Coarse-grained granite | 2.638 | 2.637 | 2.645 | 0.83 |
| Fine-grained granite | 2.808 | 2.806 | 2.811 | 0.45 |
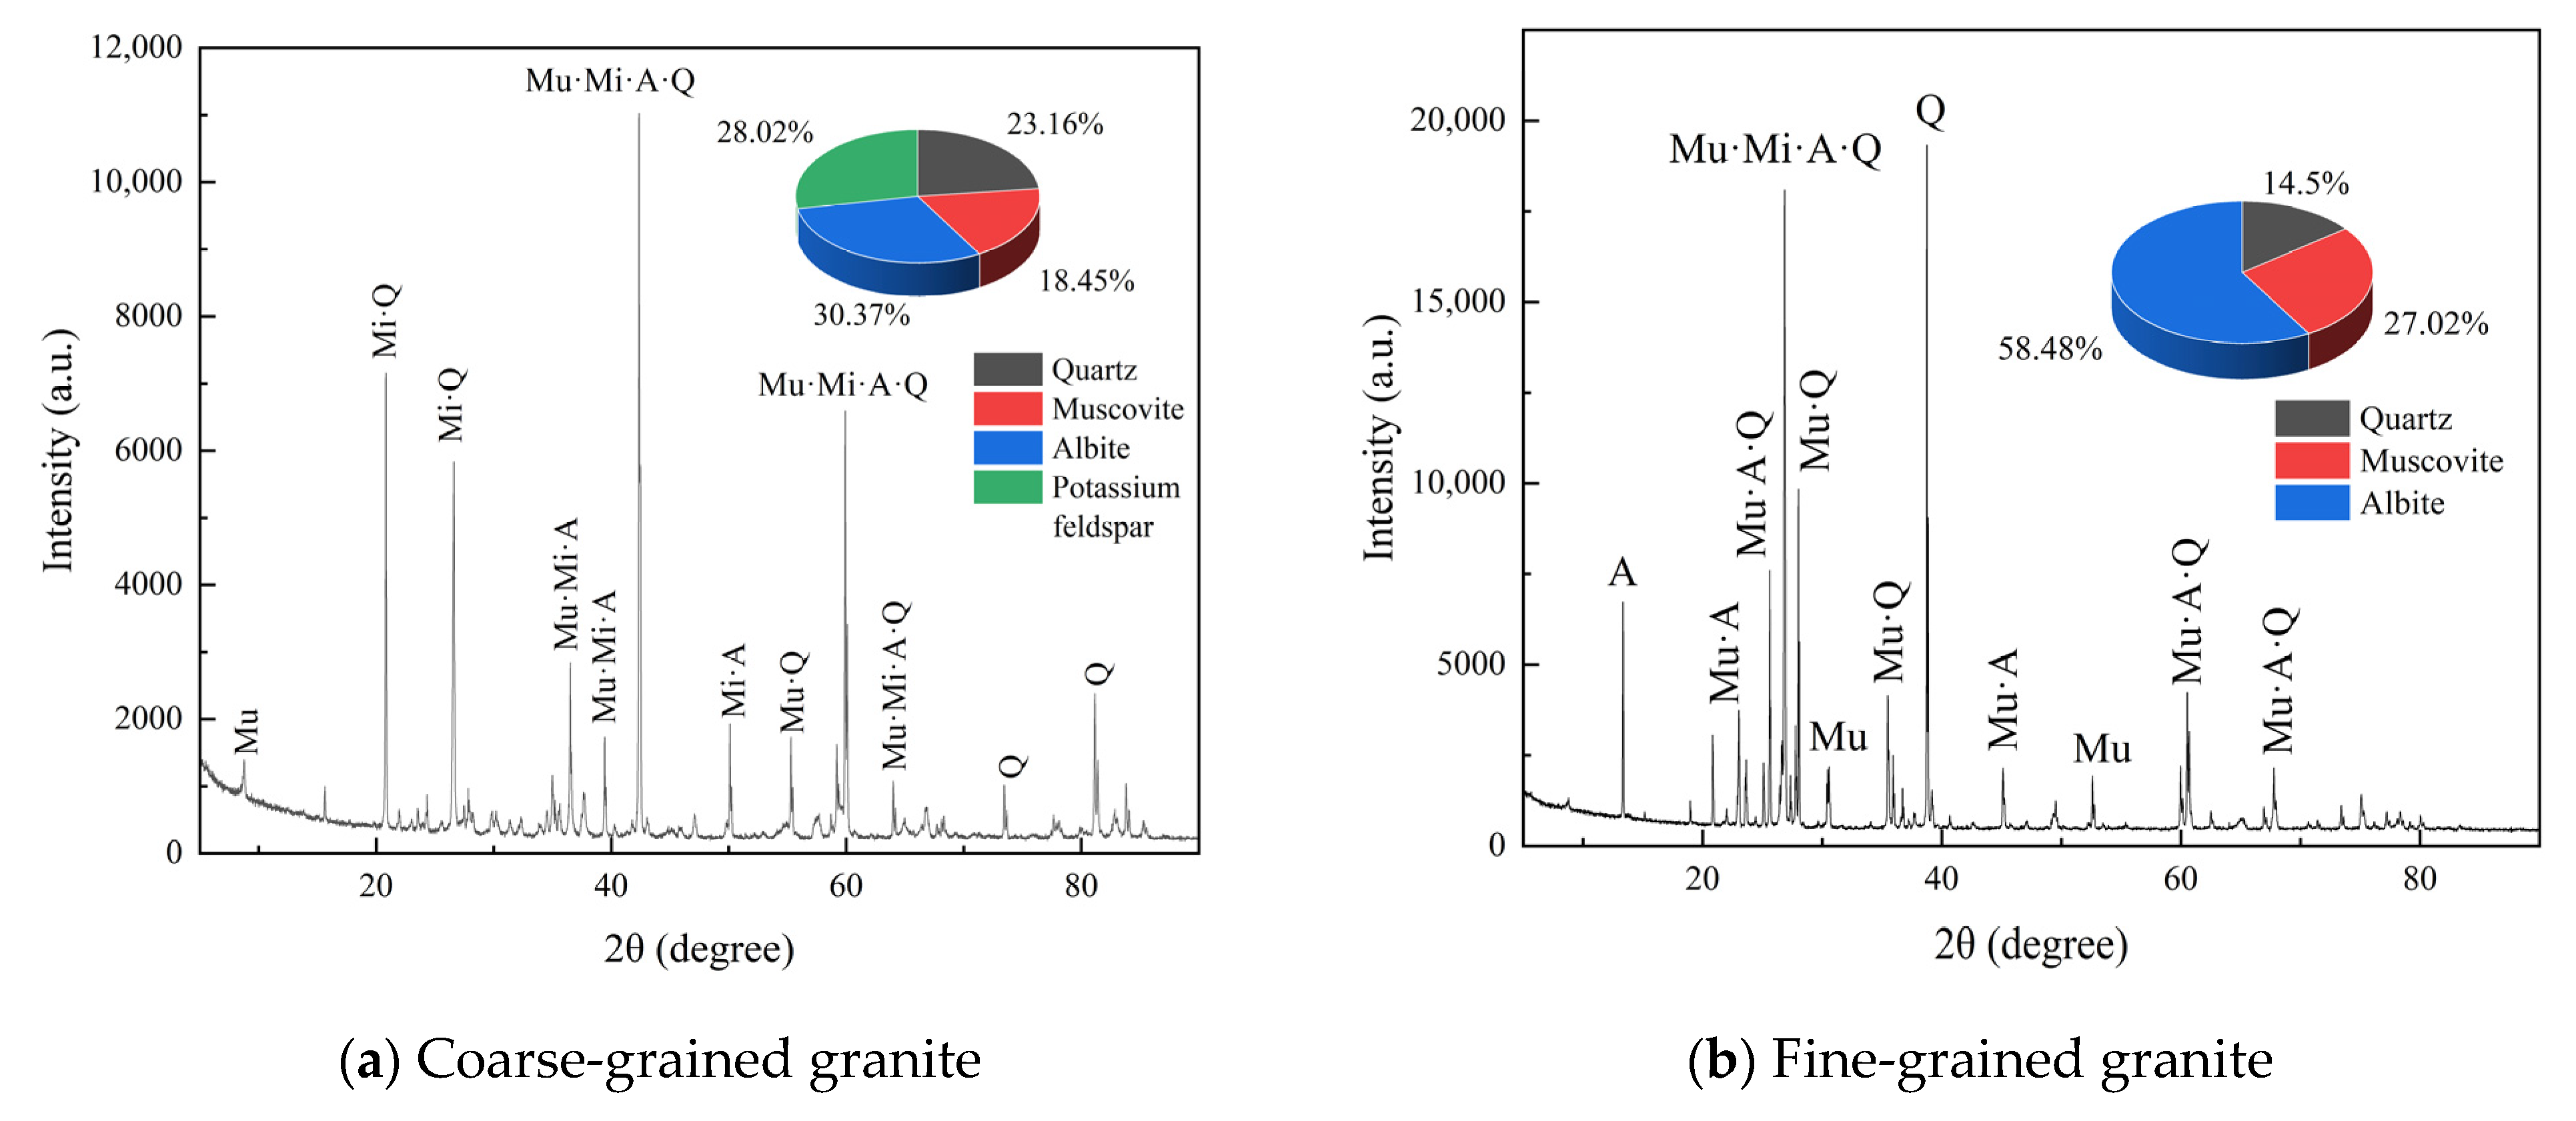
| Particle | Quartz | Muscovite | Albite | Potassium Feldspar |
|---|---|---|---|---|
| Coarse-grained granite | 23.16% | 18.45% | 30.37% | 28.02% |
| Fine-grained granite | 14.5% | 27.02% | 58.47% |
| Specimen No. | Apparent Permeability | Intrinsic Permeability | ||
|---|---|---|---|---|
| 5 Bar | 10 Bar | 15 Bar | ||
| TA1 | 3.25 × 10⁻¹⁸ | 2.75 × 10⁻¹⁸ | 2.49 × 10⁻¹⁸ | 2.16 × 10⁻¹⁸ |
| TA2 | 3.83 × 10⁻¹⁸ | 3.32 × 10⁻¹⁸ | 2.97 × 10⁻¹⁸ | 2.59 × 10⁻¹⁸ |
| TA3 | 2.94 × 10⁻¹⁸ | 2.86 × 10⁻¹⁸ | 2.58 × 10⁻¹⁸ | 2.45 × 10⁻¹⁸ |
| Specimen No. | Apparent Permeability | Intrinsic Permeability | ||
|---|---|---|---|---|
| 5 Bar | 10 Bar | 15 Bar | ||
| TB1 | 2.52 × 10⁻¹⁹ | 1.89 × 10⁻¹⁹ | 1.74 × 10⁻¹⁹ | 1.27 × 10⁻¹⁹ |
| TB2 | 4.92 × 10⁻¹⁹ | 3.52 × 10⁻¹⁹ | 2.93 × 10⁻¹⁹ | 1.88 × 10⁻¹⁹ |
| TB3 | 1.58 × 10⁻¹⁹ | 1.26 × 10⁻¹⁹ | 1.07 × 10⁻¹⁹ | 8.59 × 10⁻²⁰ |
| Particle | Coarse-Grained Granite | Fine-Grained Granite | |||
|---|---|---|---|---|---|
| Temperature | Pore Size Distribution Range | ||||
| <0.1 μm | 0.1~1 μm | >1 μm | <0.1 μm | 0.1~1 μm | |
| 20 °C | 0.003 | 0.030 | 0.793 | 0.449 | 0.000 |
| −20 °C | 0.040 | 0.035 | 2.857 | 2.353 | 0.000 |
| −40 °C | 0.015 | 0.176 | 5.129 | 13.498 | 0.000 |
| −60 °C | 0.076 | 0.451 | 11.503 | 9.125 | 4.116 |
| −90 °C | 0.039 | 0.944 | 13.693 | 10.416 | 9.874 |
| −120 °C | 0.049 | 1.437 | 22.154 | 8.446 | 19.003 |
Disclaimer/Publisher’s Note: The statements, opinions and data contained in all publications are solely those of the individual author(s) and contributor(s) and not of MDPI and/or the editor(s). MDPI and/or the editor(s) disclaim responsibility for any injury to people or property resulting from any ideas, methods, instructions or products referred to in the content. |
© 2025 by the authors. Licensee MDPI, Basel, Switzerland. This article is an open access article distributed under the terms and conditions of the Creative Commons Attribution (CC BY) license (https://creativecommons.org/licenses/by/4.0/).
Share and Cite
Chen, W.; Wang, P.; Liang, Y. Experimental Study on the Influence of Low Temperature on the Gas Permeability of Granite. Appl. Sci. 2025, 15, 5447. https://doi.org/10.3390/app15105447
Chen W, Wang P, Liang Y. Experimental Study on the Influence of Low Temperature on the Gas Permeability of Granite. Applied Sciences. 2025; 15(10):5447. https://doi.org/10.3390/app15105447
Chicago/Turabian StyleChen, Wei, Peng Wang, and Yue Liang. 2025. "Experimental Study on the Influence of Low Temperature on the Gas Permeability of Granite" Applied Sciences 15, no. 10: 5447. https://doi.org/10.3390/app15105447
APA StyleChen, W., Wang, P., & Liang, Y. (2025). Experimental Study on the Influence of Low Temperature on the Gas Permeability of Granite. Applied Sciences, 15(10), 5447. https://doi.org/10.3390/app15105447