Abstract
The time-dependent deformation control of weakly cemented soft rock in deep underground engineering is a critical scientific issue that directly affects the long-term stability of roadways. Traditional Nishihsara models encounter limitations in accurately capturing the weakening effects of material parameters during rock creep failure and in describing the accelerated creep stage, making them insufficient for analyzing the creep failure mechanisms of weakly cemented surrounding rock. To address these limitations, this study integrates SEM and X-ray scanning results to reveal the microscopic degradation process during creep: under external forces, clay minerals, primarily bonded face-to-face or through cementation, gradually fracture, leading to continuous microcrack propagation and progressive parameter degradation. Based on damage theory, an enhanced Nishihara creep model is proposed, incorporating a time-dependent damage factor to characterize the attenuation of the elastic modulus and a nonlinear winding element connected in series to represent the accelerated creep stage. The corresponding three-dimensional constitutive equations are derived. Using the Levenberg–Marquardt (L-M) algorithm for parameter inversion, the model achieves over 98% fitting accuracy across the full creep stages of weakly cemented soft rock, validating its applicability to other rock types such as salt rock and anthracite. The damage creep model is numerically implemented through secondary development in FLAC3D 6.0, with simulation results showing less than 5% deviation from experimental data and the failure mode is similar. These findings provide a solid theoretical foundation for further understanding the creep behavior of weakly cemented soft rocks.
1. Introduction
Weakly cemented soft rock exhibits significant rheological behavior under mining-induced stress due to its unique characteristics, including weak cementation, a highly porous structure, and the presence of hydrolysable minerals [1,2]. This rheological evolution not only results in nonlinear increases in the deformation of surrounding rock in roadways but also leads to major engineering challenges, such as the instability of support structures and coal–rock–gas outbursts [3,4,5,6,7]. Given its crucial role in controlling the long-term stability of underground openings, the rheological constitutive characterization of weakly cemented soft rock has become a central focus in rock mechanics research. Developing a rational creep model is essential for understanding rheological failure mechanisms and for guiding the design of effective roadway support systems [8,9,10].
To summarize recent research progress, Frenelus et al. [11] and Tarifard et al. [12] conducted comprehensive reviews of existing creep models, offering important theoretical insights for the development of new constitutive formulations. Among the various models, the Nishihara model has been widely adopted for its ability to describe the full creep process in soft rock [13,14,15,16]. To improve its applicability under diverse conditions, researchers have introduced several enhancements. For example, Sun et al. [17] proposed a modified Nishihara model incorporating a novel dashpot element to characterize accelerated creep behavior and to effectively capture the mechanical response of sandstone under varying moisture conditions. Zhao et al. [18], based on creep tests on rock salt under different confining pressures and axial stresses, proposed a viscoplastic damage model incorporating long-term strength and time-dependent behavior, resulting in a six-element nonlinear creep model capable of accurately reproducing creep curves. Jiang et al. [19] introduced a strain-triggered inertial element into the model to represent secondary accelerated creep, enabling a mathematical description of the full creep process from primary decay to steady-state and accelerated creep.
Zhou et al. [20] replaced the Newtonian dashpot in the traditional Nishihara model with a fractional-order Abel dashpot and proposed a time-fractional derivative-based creep model, including an analytical solution. Liu et al. [21] developed a four-element fractional creep model for weakly cemented soft rock by integrating creep test results with fractional calculus theory and Abel dashpots, effectively describing its three-stage creep behavior. Numerical simulation software has also become an essential tool due to its efficiency and capability to replicate complex experimental conditions. Among these, FLAC3D has emerged as a leading platform, offering built-in constitutive models and powerful secondary development interfaces that enable model customization [22,23]. For example, Deng et al. [15] developed an improved Nishihara model for carbonaceous phyllite and implemented it in FLAC3D, verifying its accuracy and reliability. Wang et al. [24] used energy conservation principles to derive finite difference formulations for rock elastic and dissipative energy, establishing an energy-based model to evaluate surrounding rock failure. Xiao et al. [25] proposed a Unified Hardening–Softening (UHS) elastoplastic model integrated with the nonlinear Hoek–Brown criterion and residual strength concepts, which was implemented via FLAC3D to simulate the nonlinear mechanical behavior of deep rock masses. Additionally, advances in the Discrete Element Method (DEM) have enhanced creep simulation capabilities. For instance, Gutiérrez-Ch et al. [26] combined Rate Process Theory (RPT) with the DEM to simulate the full creep deformation process of rock masses. Furthermore, beyond finite volume-based models such as FLAC3D, the Lattice Element Method (LEM) and Finite Element Method (FEM) offer powerful alternatives for simulating microcrack evolution and time-dependent damage [27]. The LEM is particularly effective for modeling fracture processes at the mesoscale, while the FEM has been widely applied to simulate nonlinear creep and viscoelastic behavior in geomaterials [28,29]. These methods complement damage-based continuum models by incorporating microstructural failure mechanisms.
Recent studies (e.g., [12,30,31,32]) have advanced creep modeling by integrating fractional calculus, energy-based damage theory, and advanced numerical simulations, offering valuable insights into deformation. In creep experiments, the mechanical properties of rock exhibit progressive degradation, with strength reduction resulting from damage, which manifests as parameter weakening in creep models [33,34,35,36]. To characterize this degradation, researchers have introduced damage theory and quantified rock mass deterioration using multiple damage factors [37,38]. Song et al. [39] incorporated time-dependent damage variables reflecting the degradation of mechanical properties during creep and developed a damage-based creep constitutive model capable of capturing the full creep process of hard rock. Zhang et al. [40] introduced an Abel dashpot and damage variables to establish a thermomechanical coupling-damaged Abel dashpot and proposed a three-dimensional fractional creep model for deep coal masses considering the effects of thermomechanical coupling damage. The validity and applicability of these models were successfully verified.
Several researchers have also proposed models integrating nonlinear elements to better represent the accelerated creep phase [41,42,43]. To investigate the microscopic creep degradation mechanism of weakly cemented mudstone, this study first analyzed its microstructural deterioration using SEM and X-ray scanning. Building on previous research and triaxial creep test results under various confining pressures, we incorporated damage theory and nonlinear winding elements, identified damage thresholds, and developed an improved Nishihara creep model with damage considerations. The model was then extended to three-dimensional stress conditions and validated using the Levenberg–Marquardt (L-M) algorithm. Additionally, secondary development in FLAC3D was carried out to enhance its practical applicability. These efforts contribute to a deeper understanding of the creep behavior and degradation mechanisms of weakly cemented soft rock. The novelty of this study lies in proposing an improved Nishihara creep model that integrates a nonlinear winding element and a time-dependent damage function to characterize accelerated creep. Unlike existing models, the proposed model is fully extended to three dimensions and verified through secondary development and simulation in FLAC3D with multiple rock types, ensuring both theoretical rigor and practical applicability.
2. Experimental Study on Weakly Cemented Soft Rock
2.1. Microstructure of Weakly Cemented Soft Rock
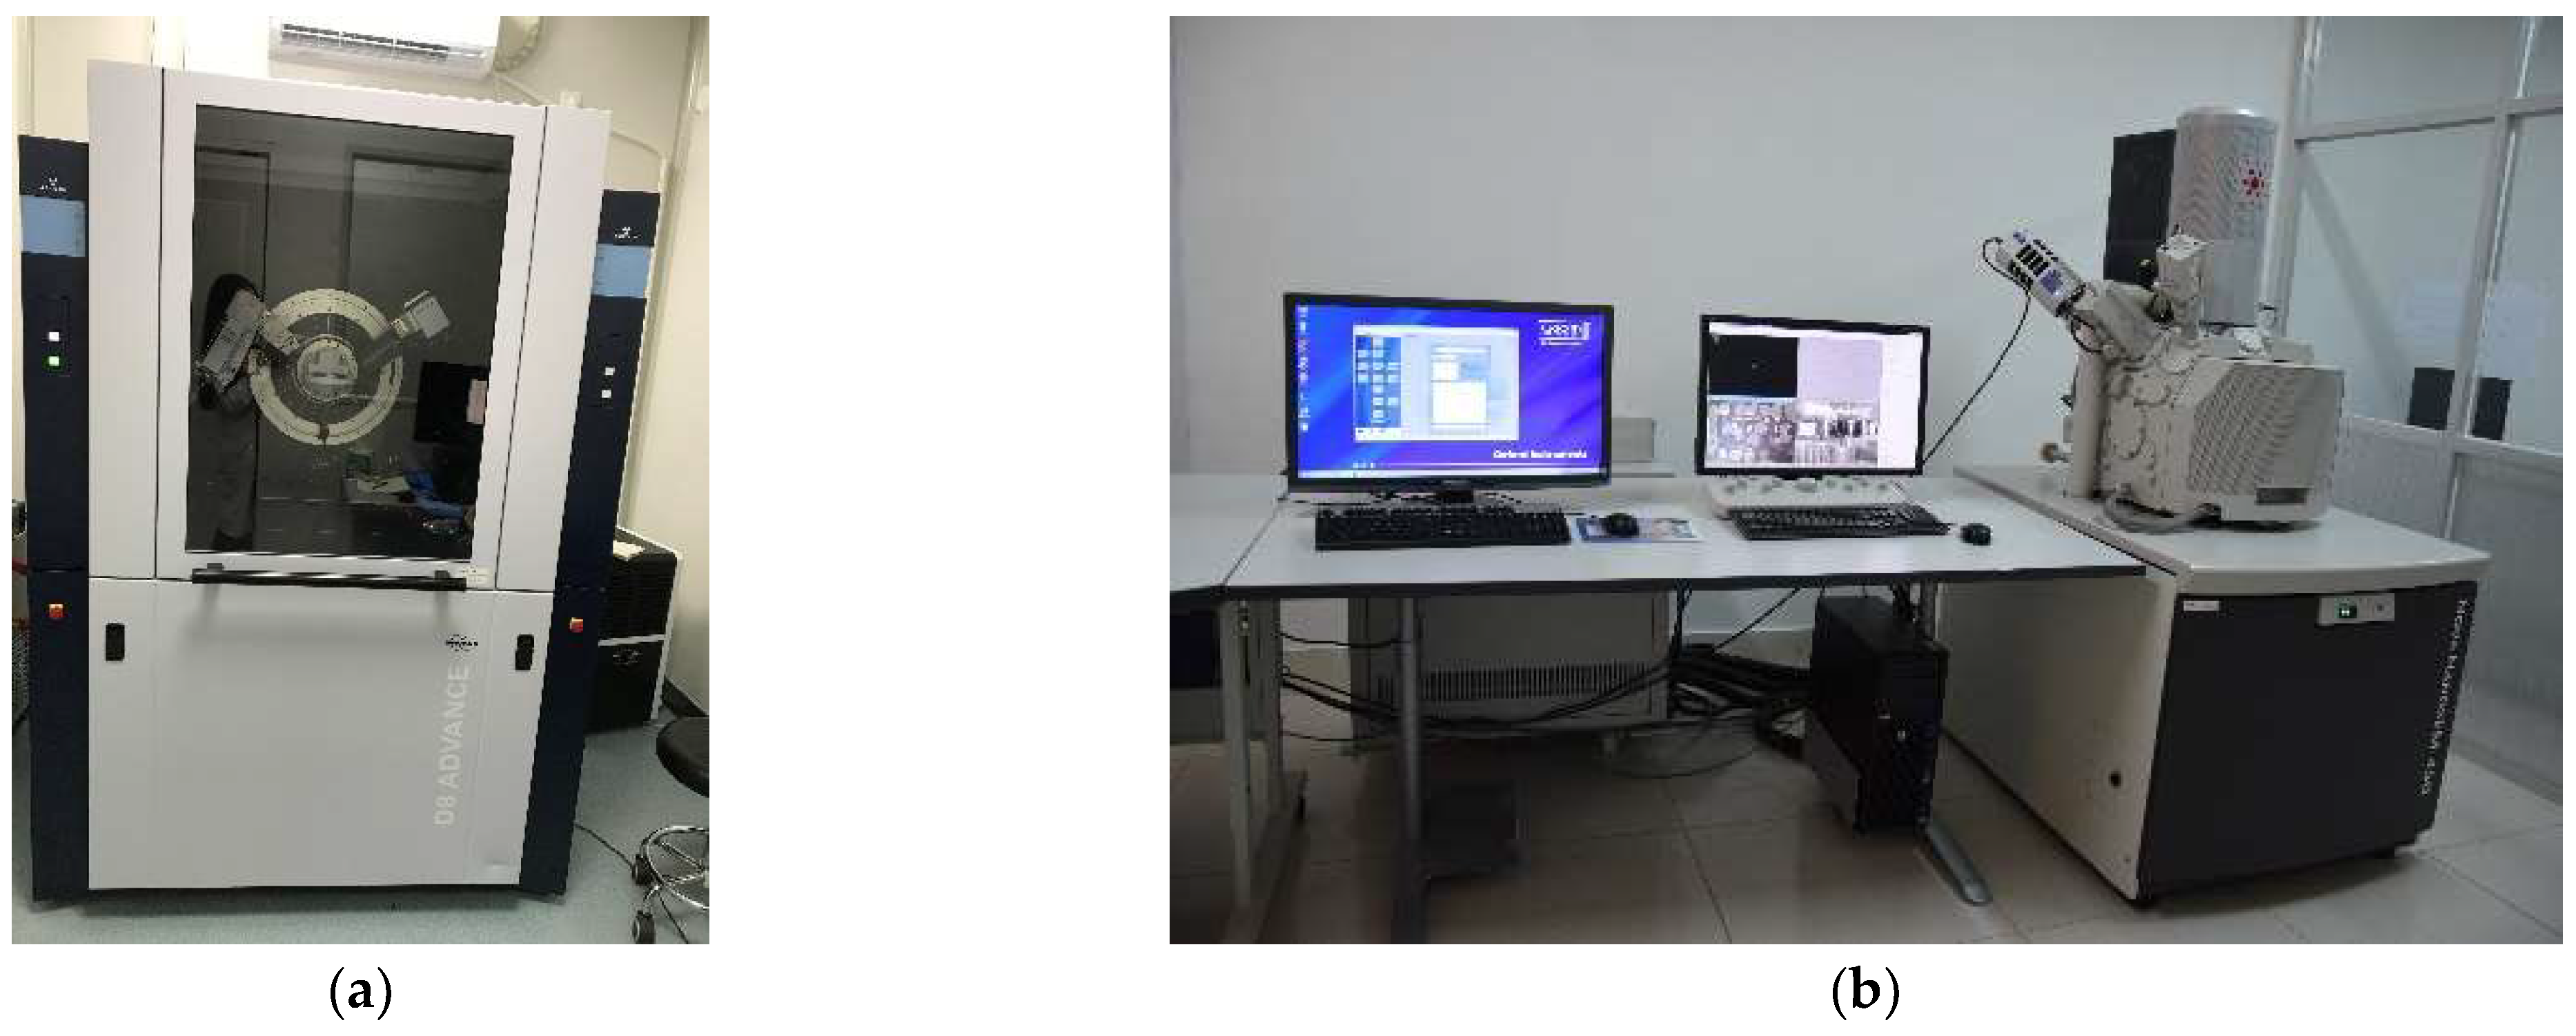
To identify the mesostructural characteristics and creep mechanisms of weakly cemented soft rock at the microscale, roof rock samples were collected from a roadway at a mining site in western China for X-Ray Diffraction (XRD) analysis and Scanning Electron Microscopy (SEM). The experimental setup is shown in Figure 1. A D8 Advance X-ray powder diffractometer (Produced in Qingdao, China) and a Nova NanoSEM450 ultra-high-resolution field-emission scanning electron microscope (Produced in Qingdao, China) were used for the XRD and SEM analyses, respectively. The purpose of these analyses was to determine the mineral composition and microstructural features of the weakly cemented soft rock and to understand their implications for its mechanical behavior. The scanning results are presented in Figure 2 and Figure 3.

Figure 1.
Test equipment. (a) D8 Advance X-ray powder diffractometer. (b) Nova NanoSEM450 ultra-high resolution field-emission scanning electron microscope.
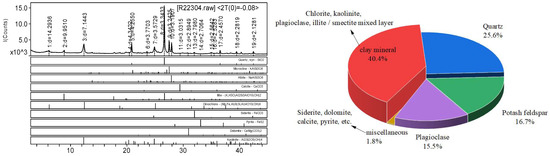
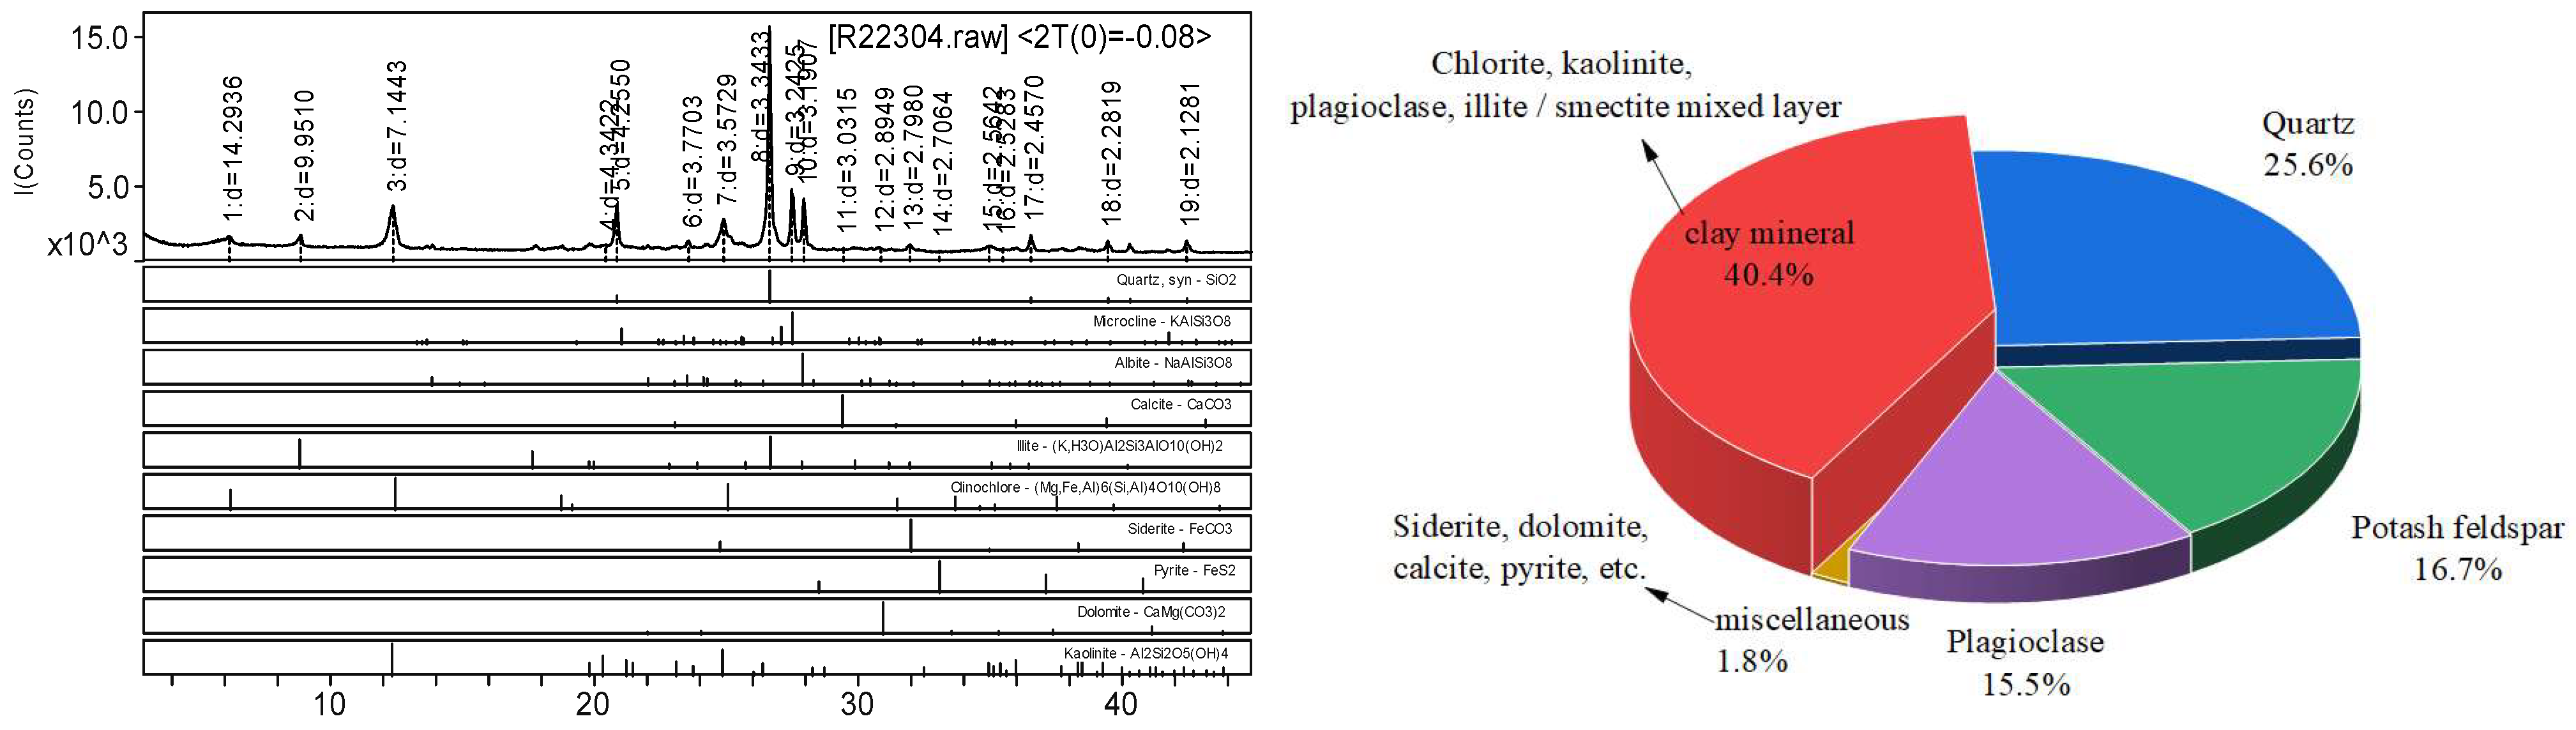
Figure 2.
XRD composition analysis diagram.

Figure 3.
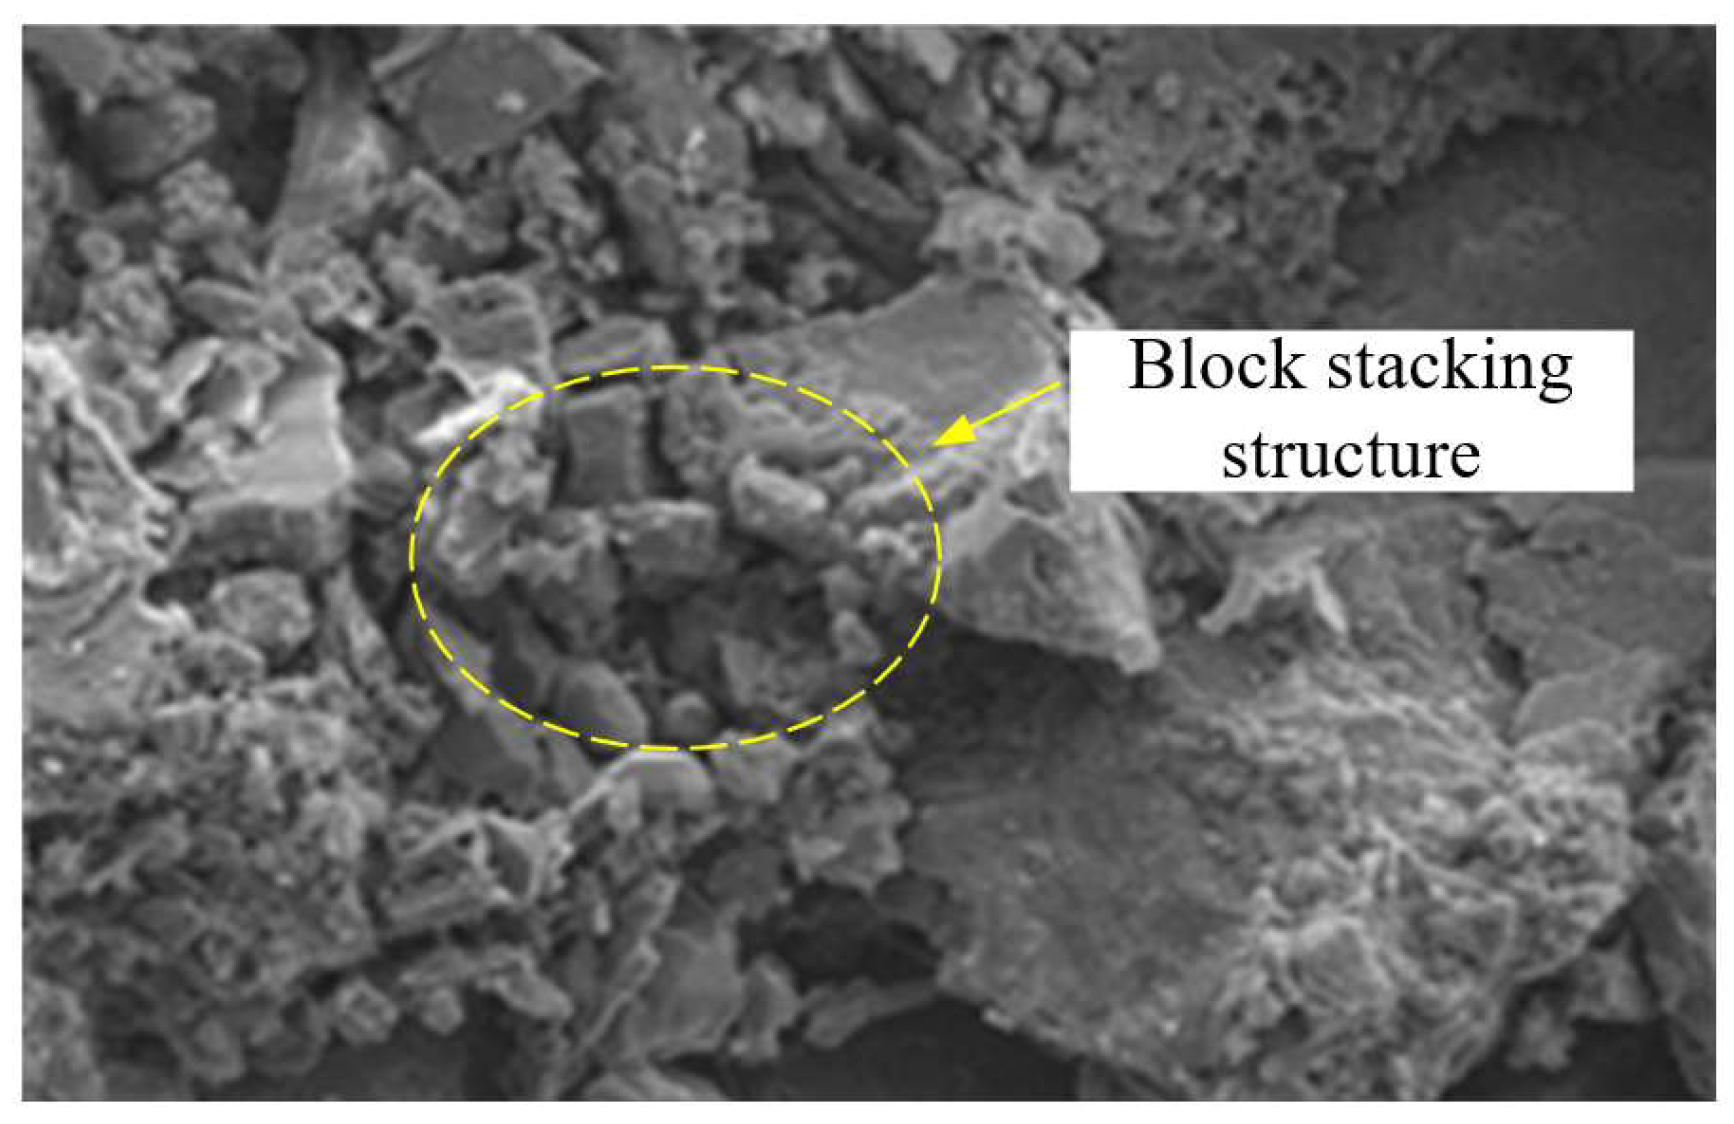
Microstructure characteristics of weakly cemented mudstone.
As shown in Figure 2, X-Ray Diffraction (XRD) analysis indicates that clay minerals constitute the highest proportion (40.4%) of the sample, followed by secondary minerals such as quartz, potassium feldspar, plagioclase, and siderite. The clay minerals are primarily composed of chlorite, kaolinite, illite, and illite/smectite mixed-layer minerals.
The SEM imaging results, presented in Figure 3, show that the sample has a loose, porous microstructure with poor cementation and sporadic primary fractures, indicative of weak overall structural integrity. These images further confirm the abundance of clay minerals, consistent with the XRD findings. The clay minerals—mainly kaolinite, illite, and illite/smectite mixed layers—are predominantly interconnected through face-to-face contacts and cementation bonds. Some clay particles fill the interstitial spaces between quartz and feldspar grains, forming blocky aggregates and detrital textures, which together contribute to the highly porous and weakly bonded nature of the rock.
2.2. Basic Mechanical Properties of Weakly Cemented Soft Rock
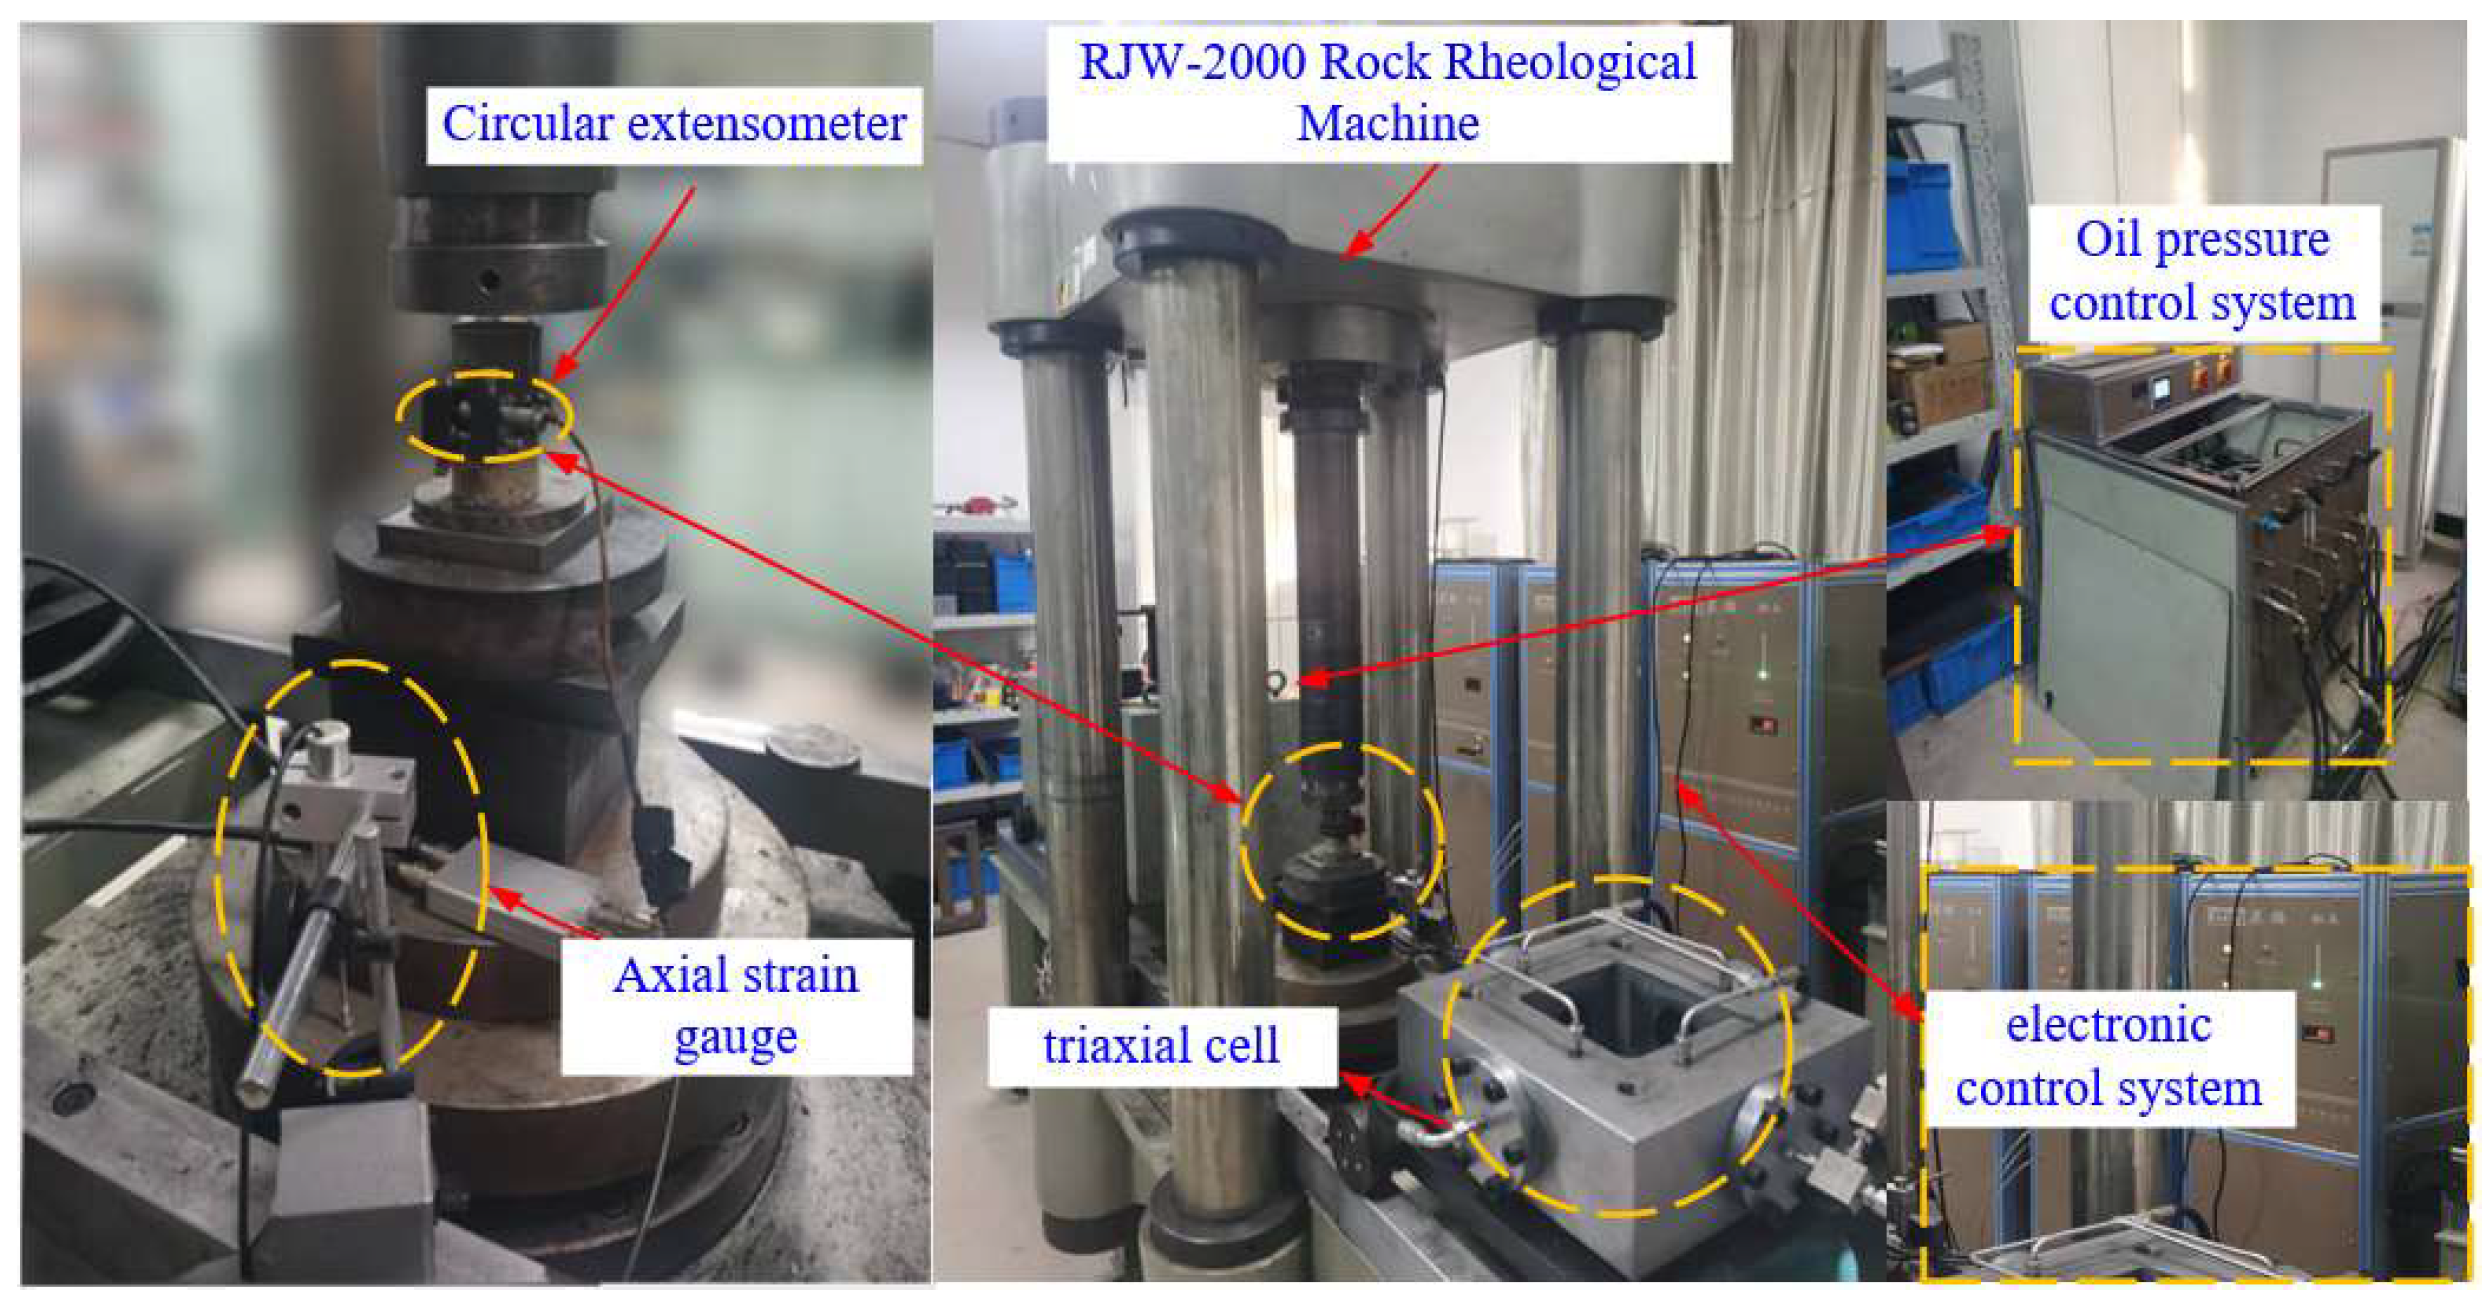
To determine appropriate stress levels for creep testing, uniaxial and triaxial compression tests were conducted on rock specimens using the RLJW-2000 rock rheometer (Produced by Qingdao, China) (Figure 4). This apparatus supports multi-directional loading modes (axial and confining pressure), making it suitable for a wide range of complex testing conditions. During the experiments, axial and circumferential sensors provided real-time monitoring of specimen behavior, with data collected and processed through an integrated computer system. The peak strengths of the weakly cemented mudstone were measured as 10.31 MPa under uniaxial loading and 21.19 MPa under a confining pressure of 2 MPa. The basic mechanical parameters of the weakly cemented mudstone under different conditions are summarized in Table 1.
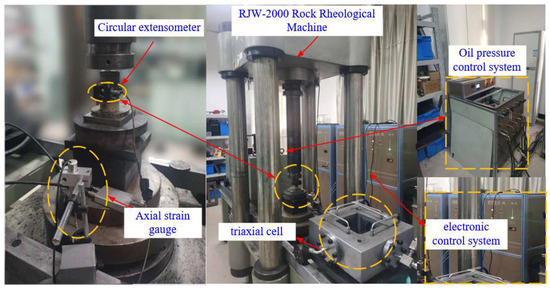
Figure 4.
RLJW-2000 rock rheometer.

Table 1.
Mechanical parameters of weakly cemented mudstone samples.
2.3. Creep Test Protocol
Creep tests on weakly cemented mudstone were conducted using the RLJW-2000 rock rheometer, following a step-loading method. Stress levels were designed based on uniaxial and triaxial test data, corresponding to 55%, 63%, 71%, 87%, and 95% of the peak strength, resulting in six stress levels (specific values are detailed in Table 2). Both confining and axial pressures were applied uniformly at a rate of 0.005 MPa/s. Once each target stress level was reached, the axial load was maintained for 6 h or until axial deformation stabilized, after which the next stress level was applied. This iterative process continued until the specimen experienced creep failure.
Table 2.
Creep test stress level.
2.4. Creep Test Result
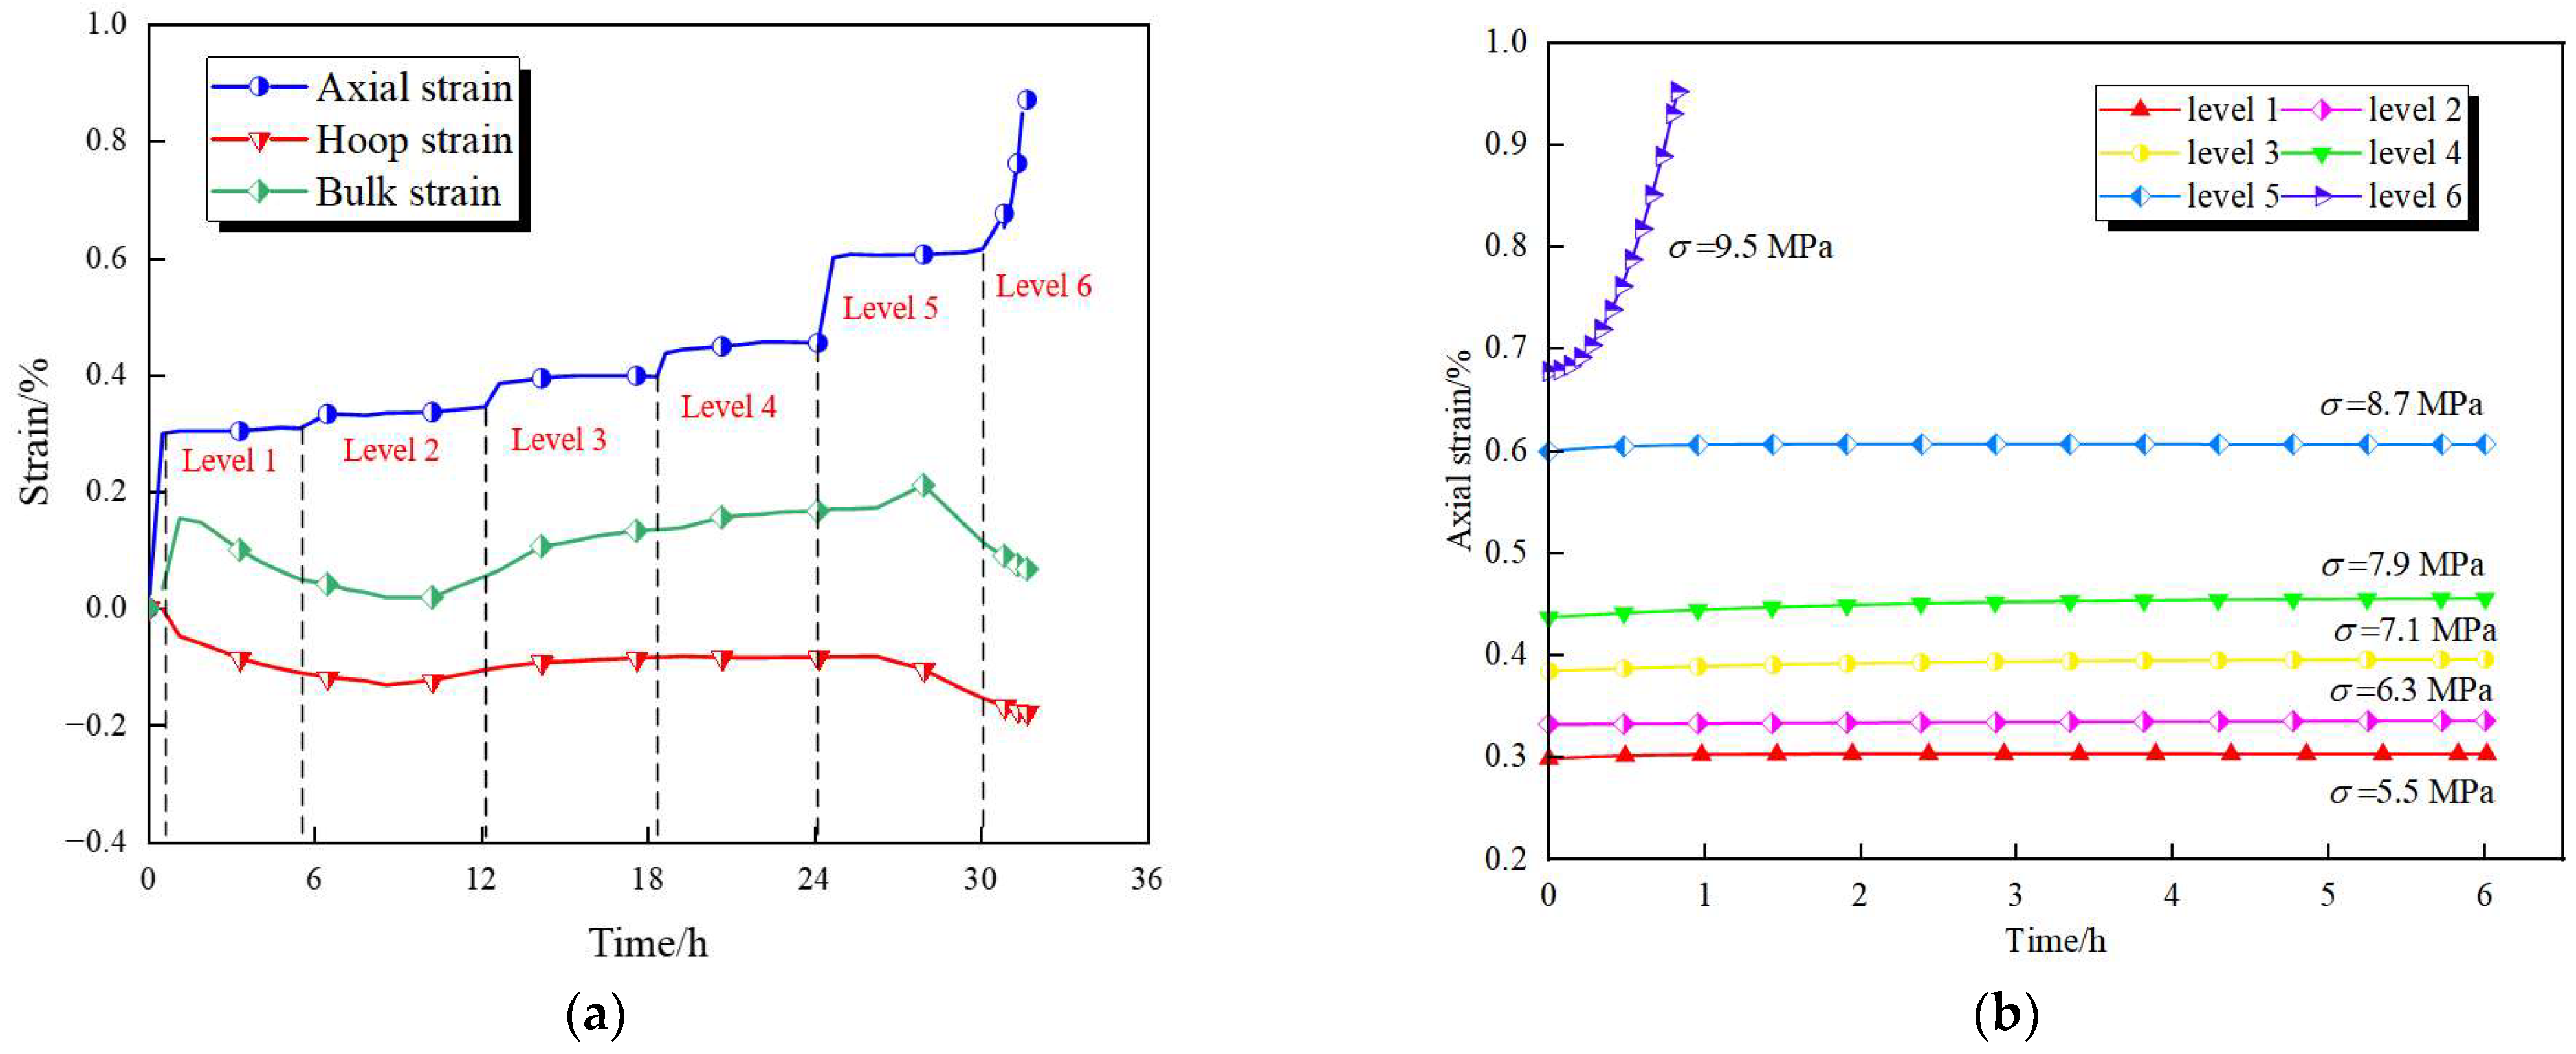
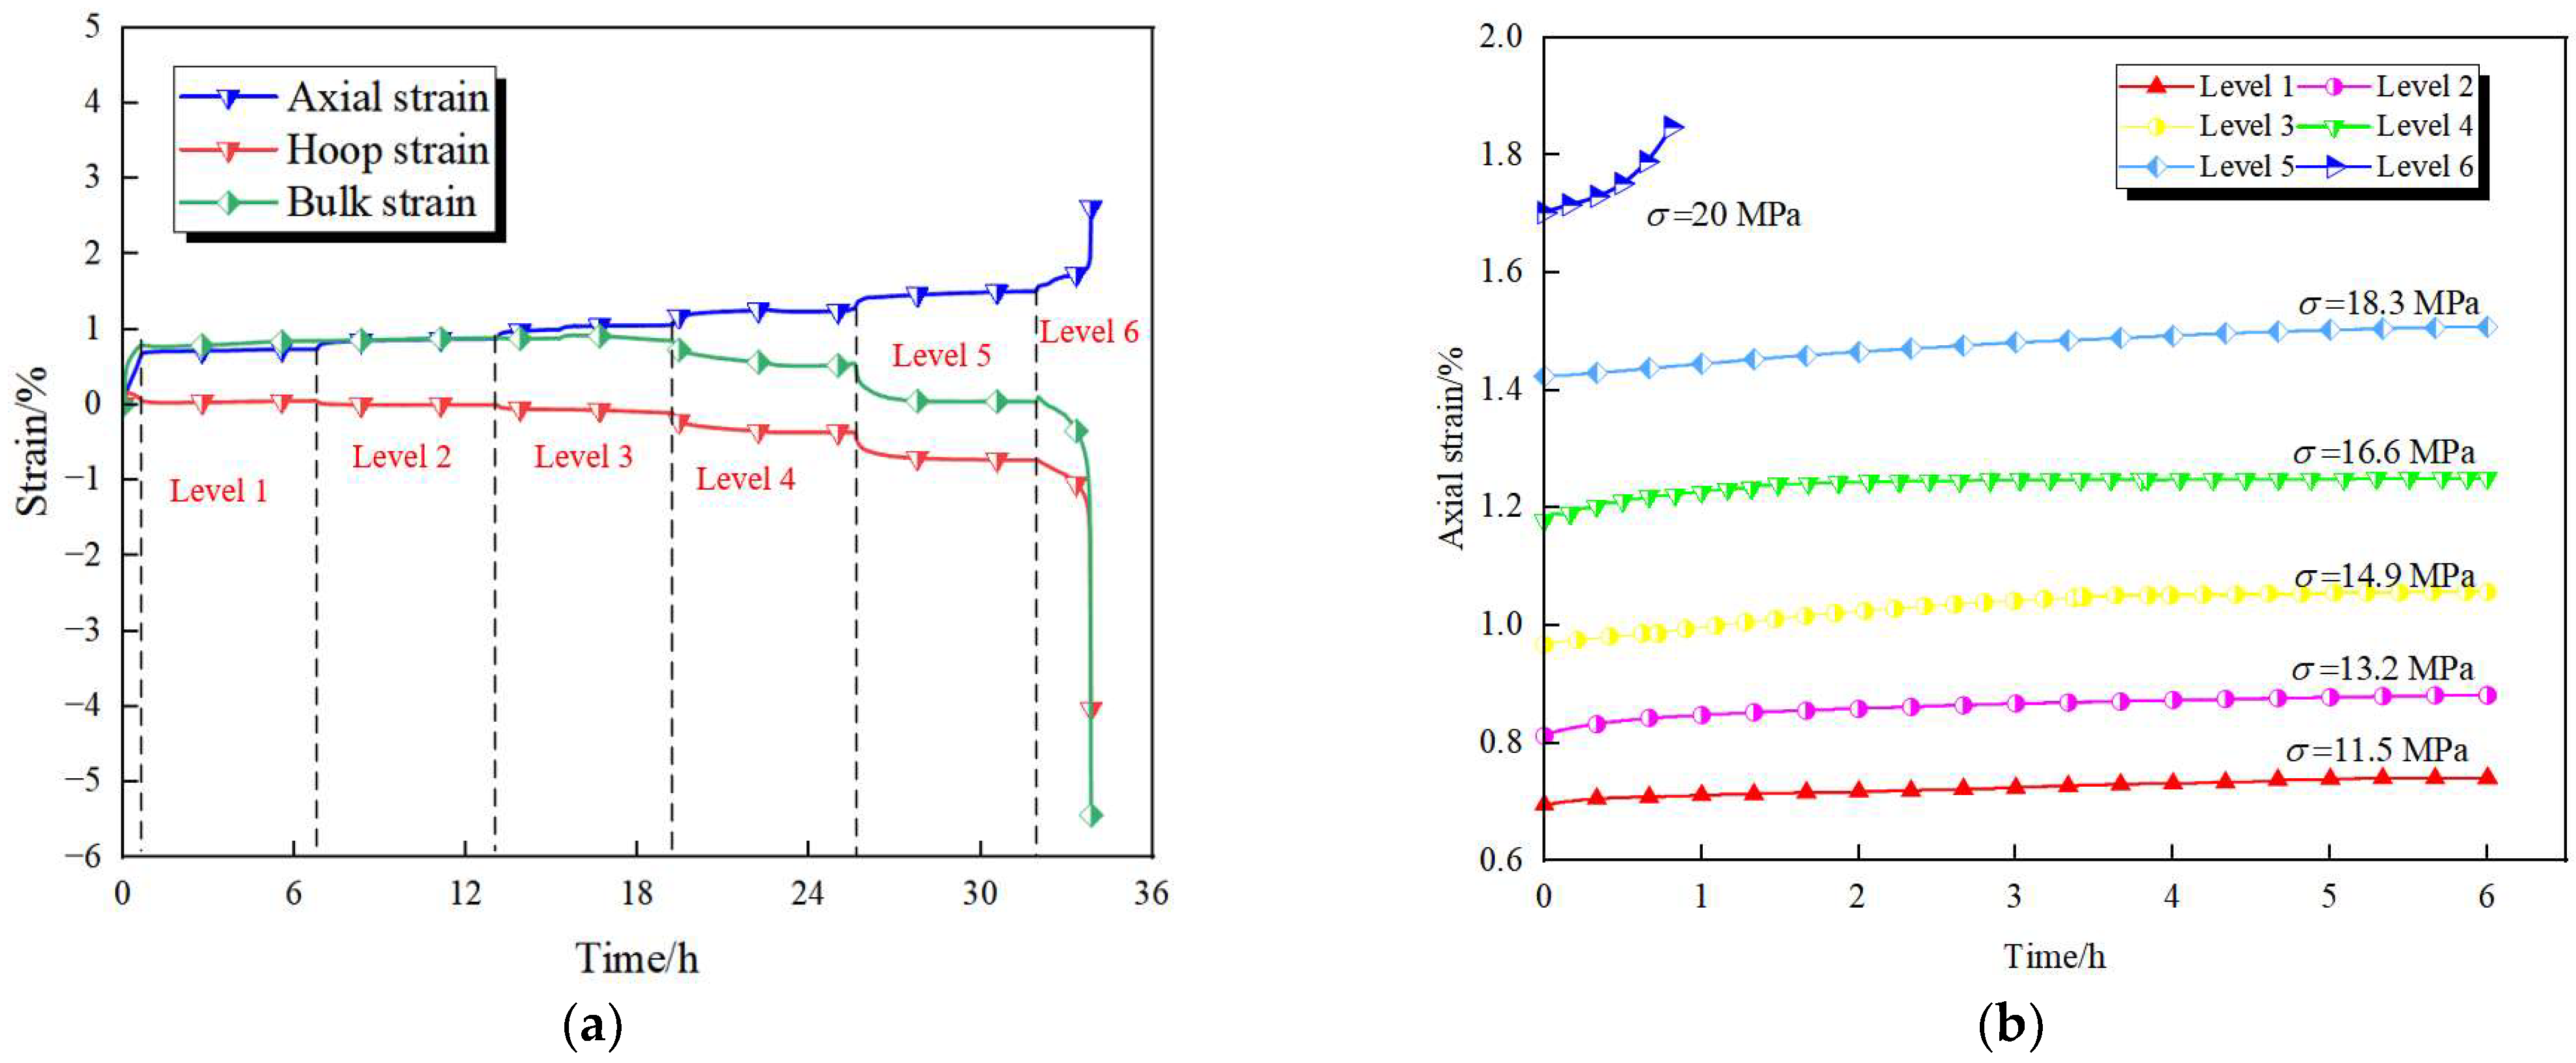
Referencing the aforementioned experimental protocol, creep tests on weakly cemented mudstone under different confining pressures were conducted, yielding full-stage creep curves under varying confining pressures, as shown in Figure 5a and Figure 6a. Chen’s loading method was used to process graded creep curves for different stress levels under distinct confining pressures, as presented in Figure 5b and Figure 6b. The results indicate that, from the first to the fifth stress levels, the specimens exhibited only decaying and steady-state creep behaviors. Upon reaching the steady-state creep phase, the creep rate remained essentially constant, with axial, circumferential, and volumetric strains progressively increasing over time. At the sixth stress level (i.e., axial stress of 9.5 MPa under uniaxial conditions and 20 MPa under 2 MPa confining pressure), the axial stress exceeded the long-term strength of the rock. The specimen initially displayed decaying creep upon loading; however, once the axial strain reached a critical threshold, a rapid increase in the axial strain rate was observed, transitioning to accelerated creep and ultimately leading to rapid failure over time.
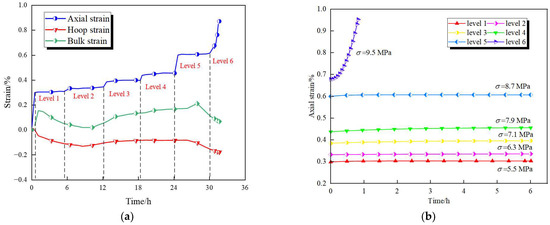
Figure 5.
Strain creep characteristics at σ3 = 0 MPa. (a) Total strain–time history curve. (b) Axial strain graded creep curve.
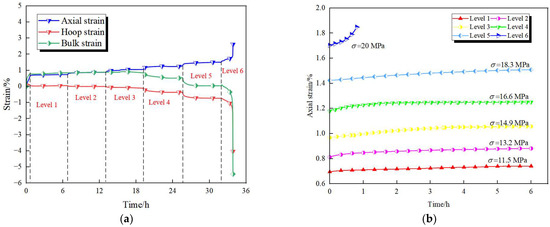
Figure 6.
Strain creep characteristics at σ3 = 2 MPa. (a) Total strain–time history curve. (b) Axial strain graded creep curve.
Under uniaxial conditions (Figure 5a), volumetric strain exhibited a four-stage evolution. During the initial loading phase, there was a rapid increase in volumetric strain. At low stress levels (σ1 = 5.5–6.3 MPa), the volume was compressed by 0.15% to 0.009%, indicating internal crack closure. In the intermediate stress stage (σ1 = 7.1–8.7 MPa), volumetric strain reversed and peaked at 0.21%, signifying that microcrack propagation surpassed pore compaction. As the stress level reached the late fifth stage (σ1 = 8.7 MPa) to pre-failure (σ1 = 9.5 MPa), volumetric compression began, with strain decreasing from 0.21% due to fracture network coalescence, leading to volume contraction and specimen failure. Under 2 MPa confining pressure (Figure 6a), the volumetric strain evolution differed markedly. In the low-stress stage (σ1 = 6.3–14.9 MPa), there was continuous volumetric expansion up to 0.85%, reflecting the confining pressure-induced suppression of lateral deformation and internal crack-dominated damage. When the stress reached σ1 ≥ 16.6 MPa, volumetric strain decreased, while circumferential strain increased (Figure 6a), indicating the breakdown of confining constraints and axial plastic flow-dominated deformation prior to failure.
3. Creep Damage Constitutive Model Considering Damage for Weakly Cemented Soft Rock
3.1. Determination of Damage Variable and Damage Threshold
Sun et al. [44] highlighted that creep under low stress is predominantly attributable to the closure of internal cracks and the compaction of the rock matrix, while creep under high stress results in the generation of numerous microcracks and even macroscopic fractures. The formation of internal microcracks compromises the rock’s internal structure, thereby inducing alterations in various rheological parameters. To evaluate these changes, a damage variable can be introduced to quantify the impairment of rheological parameters. Building on this premise, Xu Hongfa established the evolution equation of damage over time as follows [13]:
where D(t)—damage function; E∞—final elastic modulus of the rock mass; E0—initial elastic modulus of the undisturbed rock mass; α—elastic modulus decay parameter; and t—time.
Zhang et al. [45] proposed, based on their research, that the evolution of model parameters follows the same pattern as the elastic modulus, with parameters changing over time. The evolution equations for the model parameters are outlined as follows:
where Z(t) represents the parameter damage function. Total strain–time curves of weakly cemented mudstone specimens under step-loading conditions, as shown in Figure 5a and Figure 6a, indicate that at the fifth stress level, the volumetric strain trend transitions from compression to expansion. According to Table 3, under uniaxial conditions, the instantaneous elastic modulus of weakly cemented soft rock demonstrates no notable attenuation at the first to fourth stress levels. However, at the fifth stress level (σ = 8.7 MPa), the instantaneous elastic modulus exhibits a noticeable attenuation. Under 2 MPa confining pressure, the instantaneous elastic modulus presents significant attenuation at the third stress level (σ = 14.9 MPa), with attenuation rates reaching 26.3% and 4.93%, respectively.
Table 3.
Instantaneous elastic modulus at different stress levels.
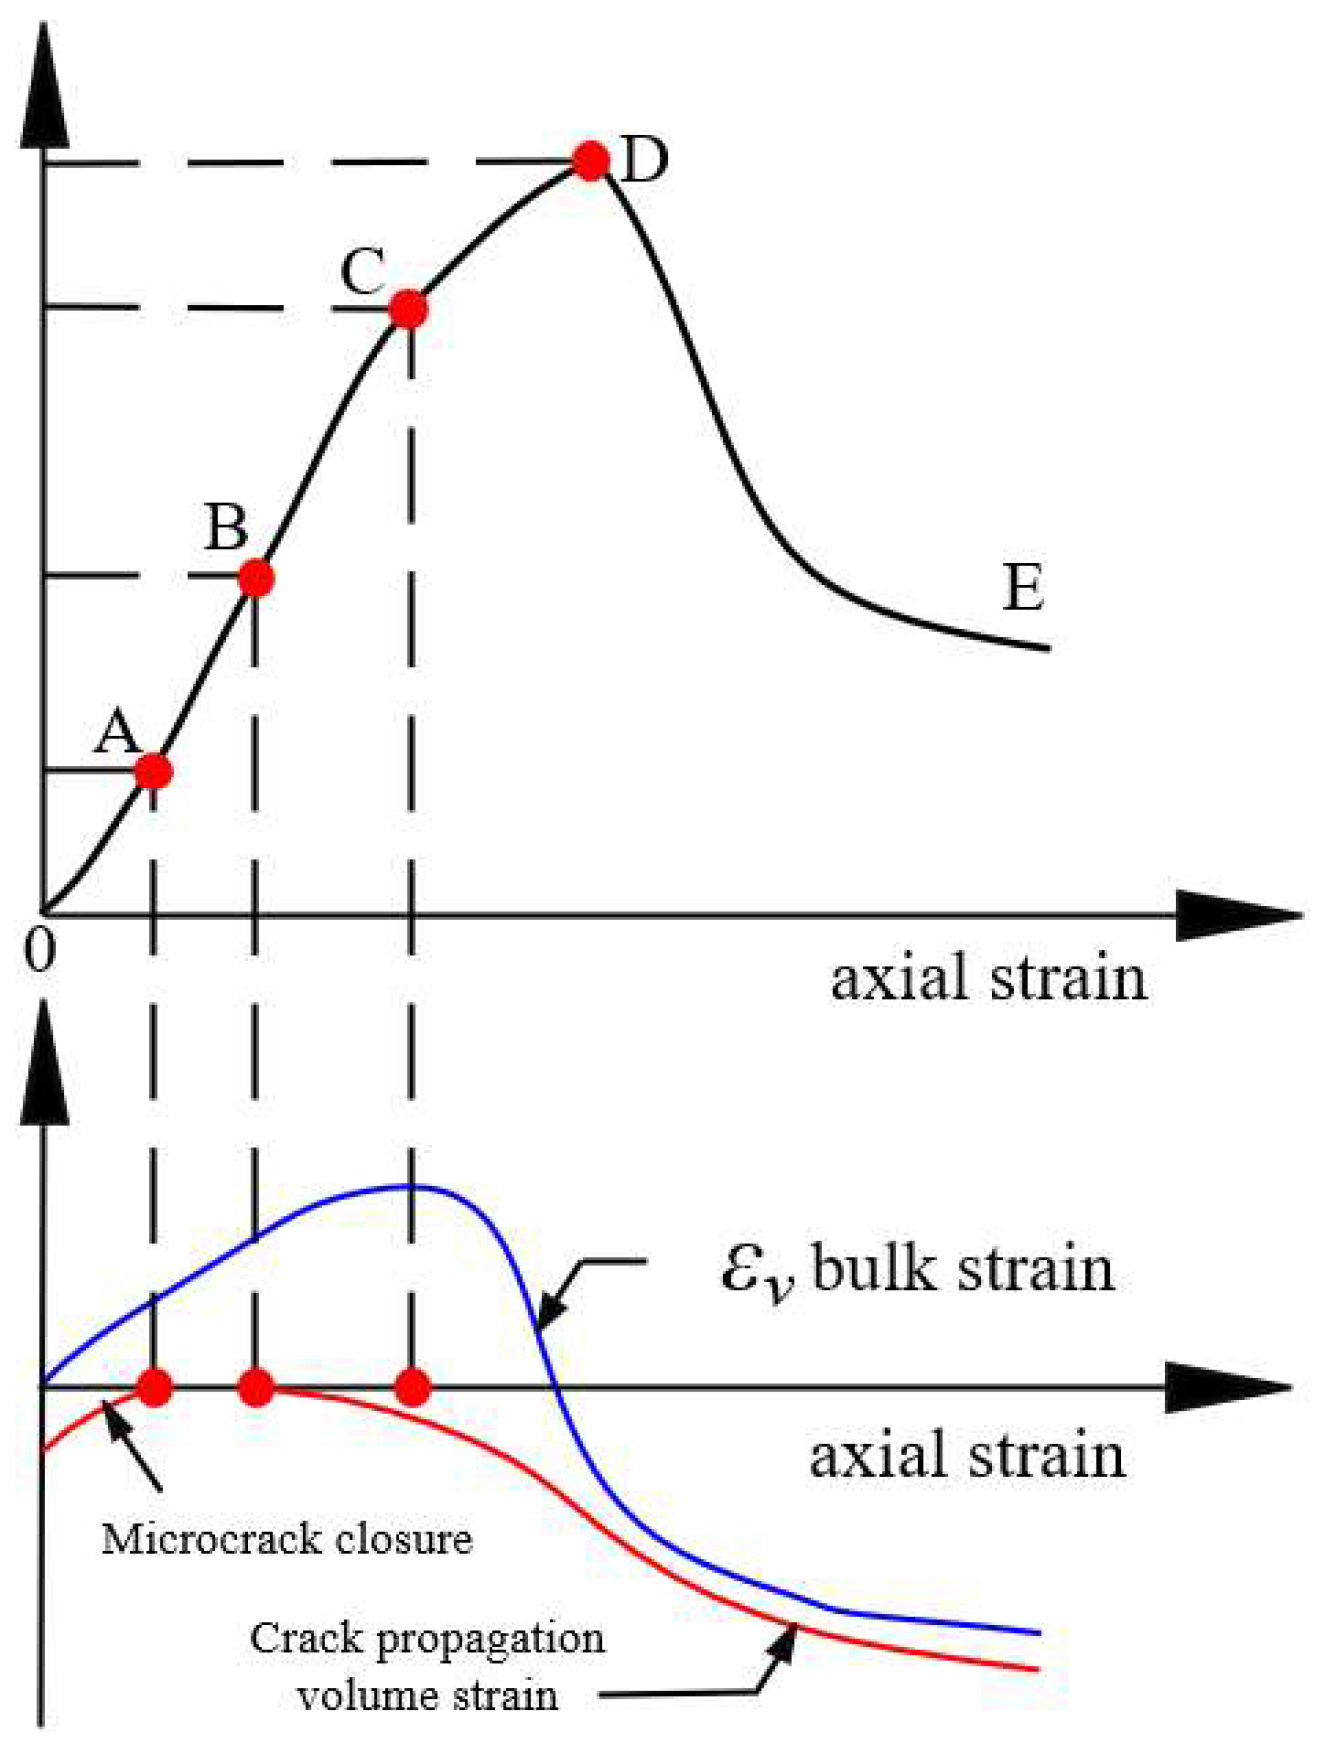
According to Figure 7 (Zhang et al. [46]), the rock test curve can be divided into the following stages: OA is the crack closure stage, AB is the elastic stage, BC is the stable crack propagation stage, CD is the accelerated crack propagation stage, and DE is the post-peak failure stage. Referring to the research of Zhang et al. [46], during the accelerated crack propagation stage, the elastic modulus of rock specimens undergoes substantial changes. It can be concluded that weakly cemented mudstone enters the accelerated crack propagation stage at this point. The rapid development of internal cracks leads to the swift attenuation of the instantaneous elastic modulus, thus inducing the volumetric strain to transition from compression to dilation. Therefore, this study considers the significant attenuation of the instantaneous elastic modulus as the damage threshold, marking the onset of rock damage.
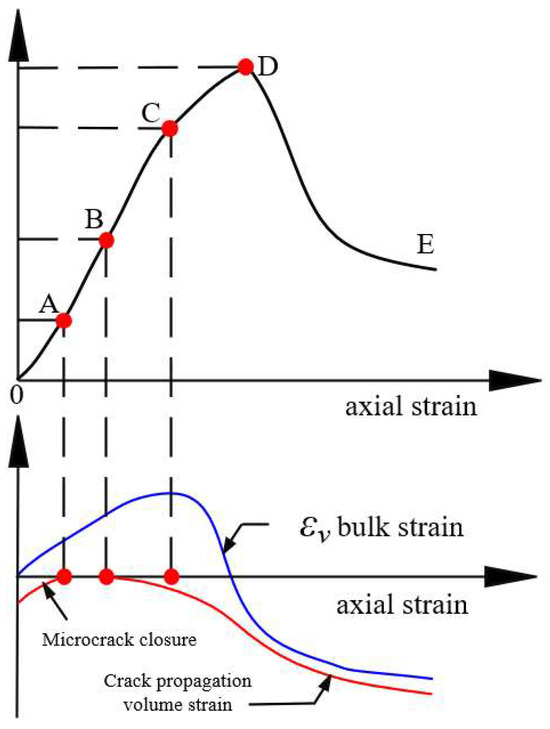
Figure 7.
Stress–strain curve of triaxial compression test [46].
3.2. Improved Nishihara Model Considering Damage
Zhang et al. [42] analyzed the Nishihara model based on the principle of energy conservation, drawing a conclusion of its absence in explaining the conversion of external work into kinetic energy during the accelerated creep stage. To address this limitation, they introduced a winding element in series with the Nishihara model, hence establishing an improved Nishihara model capable of describing the accelerated creep stage of rock. The creep formula for the winding element is outlined as follows:
It can be observed that the strain of this element is proportional to the cube of time (t3), enabling its correlation with the accelerated creep stage. In the equation, σ—stress at time t; λ—correction coefficient, controlling the intensity of accelerated creep, dimensionless; ρ—density of the specimen; and h—height of the specimen.
Based on Equations (1) and (2), the creep formula for the winding element considering damage can be derived as follows:
Connected with the Nishihara model, this model is intended to represent a creep damage constitutive model considering damage, as illustrated in Figure 8. The combined effect of the Nishihara model and this element during the accelerated creep phase is expressed as .
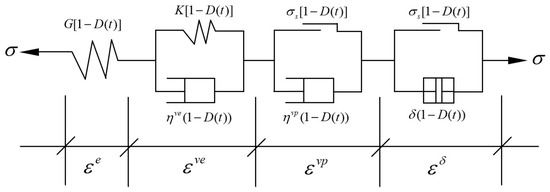
Figure 8.
Improved Nishihara creep model considering damage.
The constitutive equation is as follows: when σ < σs, the constitutive equation is identical to that of the Nishihara model; when σ ≥ σs, an additional winding element is incorporated into the model.
Creep equations are as follows:
3.3. Three-Dimensional Extension of Improved Nishihara Model
As surrounding rock consistently experiences three-dimensional stress conditions, the model above derived under two-dimensional conditions may fail to accurately simulate the long-term strength characteristics. A three-dimensional extension of the model is required to enhance the model’s practicality and facilitate the subsequent derivation of the finite difference schemes of the constitutive model [47,48,49,50].
For the three-dimensional stress state model, the expressions for stress and strain are as follows:
where and represent the deviatoric and spherical stresses, respectively; and denote the deviatoric and spherical strains, respectively; and is the Christoffel symbol.
According to the generalized Hooke’s law, the Hook three-dimensional constitutive relationship is as follows:
G and K0 are the bulk modulus and shear modulus of the Hook body, respectively. The three-dimensional stress criterion stipulates that spherical stress only induces instantaneous deformation, while rock creep is derived from deviatoric stress. By introducing a damage factor, Equation (8) is modified to a Hookean three-dimensional constitutive relationship considering damage:
According to research by Qi et al. [51], when volume change is assumed elastic and rheological properties mainly manifest in shear deformations, the Kelvin–Voigt three-dimensional constitutive relationship considering damage is formulated as follows:
Both the Bingham model and the winding element are activated upon reaching plastic failure; thus, the Bingham three-dimensional constitutive relationship considering damage is expressed as follows:
The three-dimensional constitutive relationship for the winding element considering damage is delineated as follows:
where <F> is the switching function, and . F is the yield function, and g is the plastic potential function. Based on the above equations, the total strain of the model is computed as the aggregate of the strains from its components, and the three-dimensional form of the creep damage model considering damage for weakly cemented soft rock is as follows:
In laboratory experiments, confining pressure is generally applied under equal confining conditions (), and the three-dimensional creep equation of the model is expressed by the following:
3.4. Model Validation
3.4.1. Parameter Identification
To validate the rationality of the proposed creep model that accounts for damage in weakly cemented soft rock, the Levenberg–Marquardt (L-M) algorithm was employed for model fitting. The L-M algorithm combines the strengths of the Gauss–Newton method and gradient descent, rendering it highly effective for handling problems with multiple parameters and complex linearization. Additionally, it promotes optimal solutions during both early and late iterations, thereby circumventing the pitfalls of converging into local optima. Based on the method described, parameter inversion was performed for the creep model, yielding rheological parameters, as shown in Table 4. The fitting results are presented in Figure 9. (Low stress levels correspond to levels 1 to 5, while high stress levels refer to level 6, at which the rock enters an accelerated creep state.) When extending the model from a one-dimensional to a three-dimensional configuration, the bulk modulus and shear modulus must adhere to the following relationship:
Table 4.
Creep parameters of weakly cemented soft rock in different models.
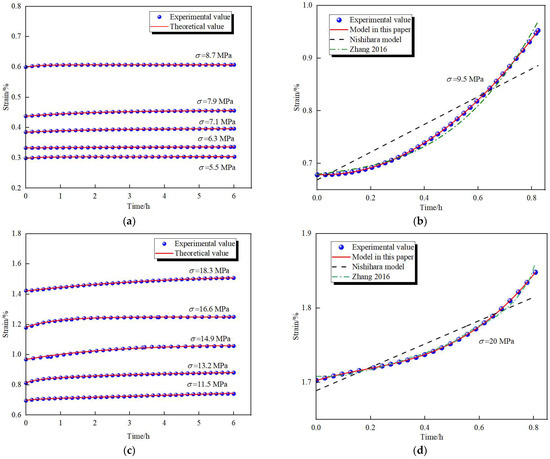
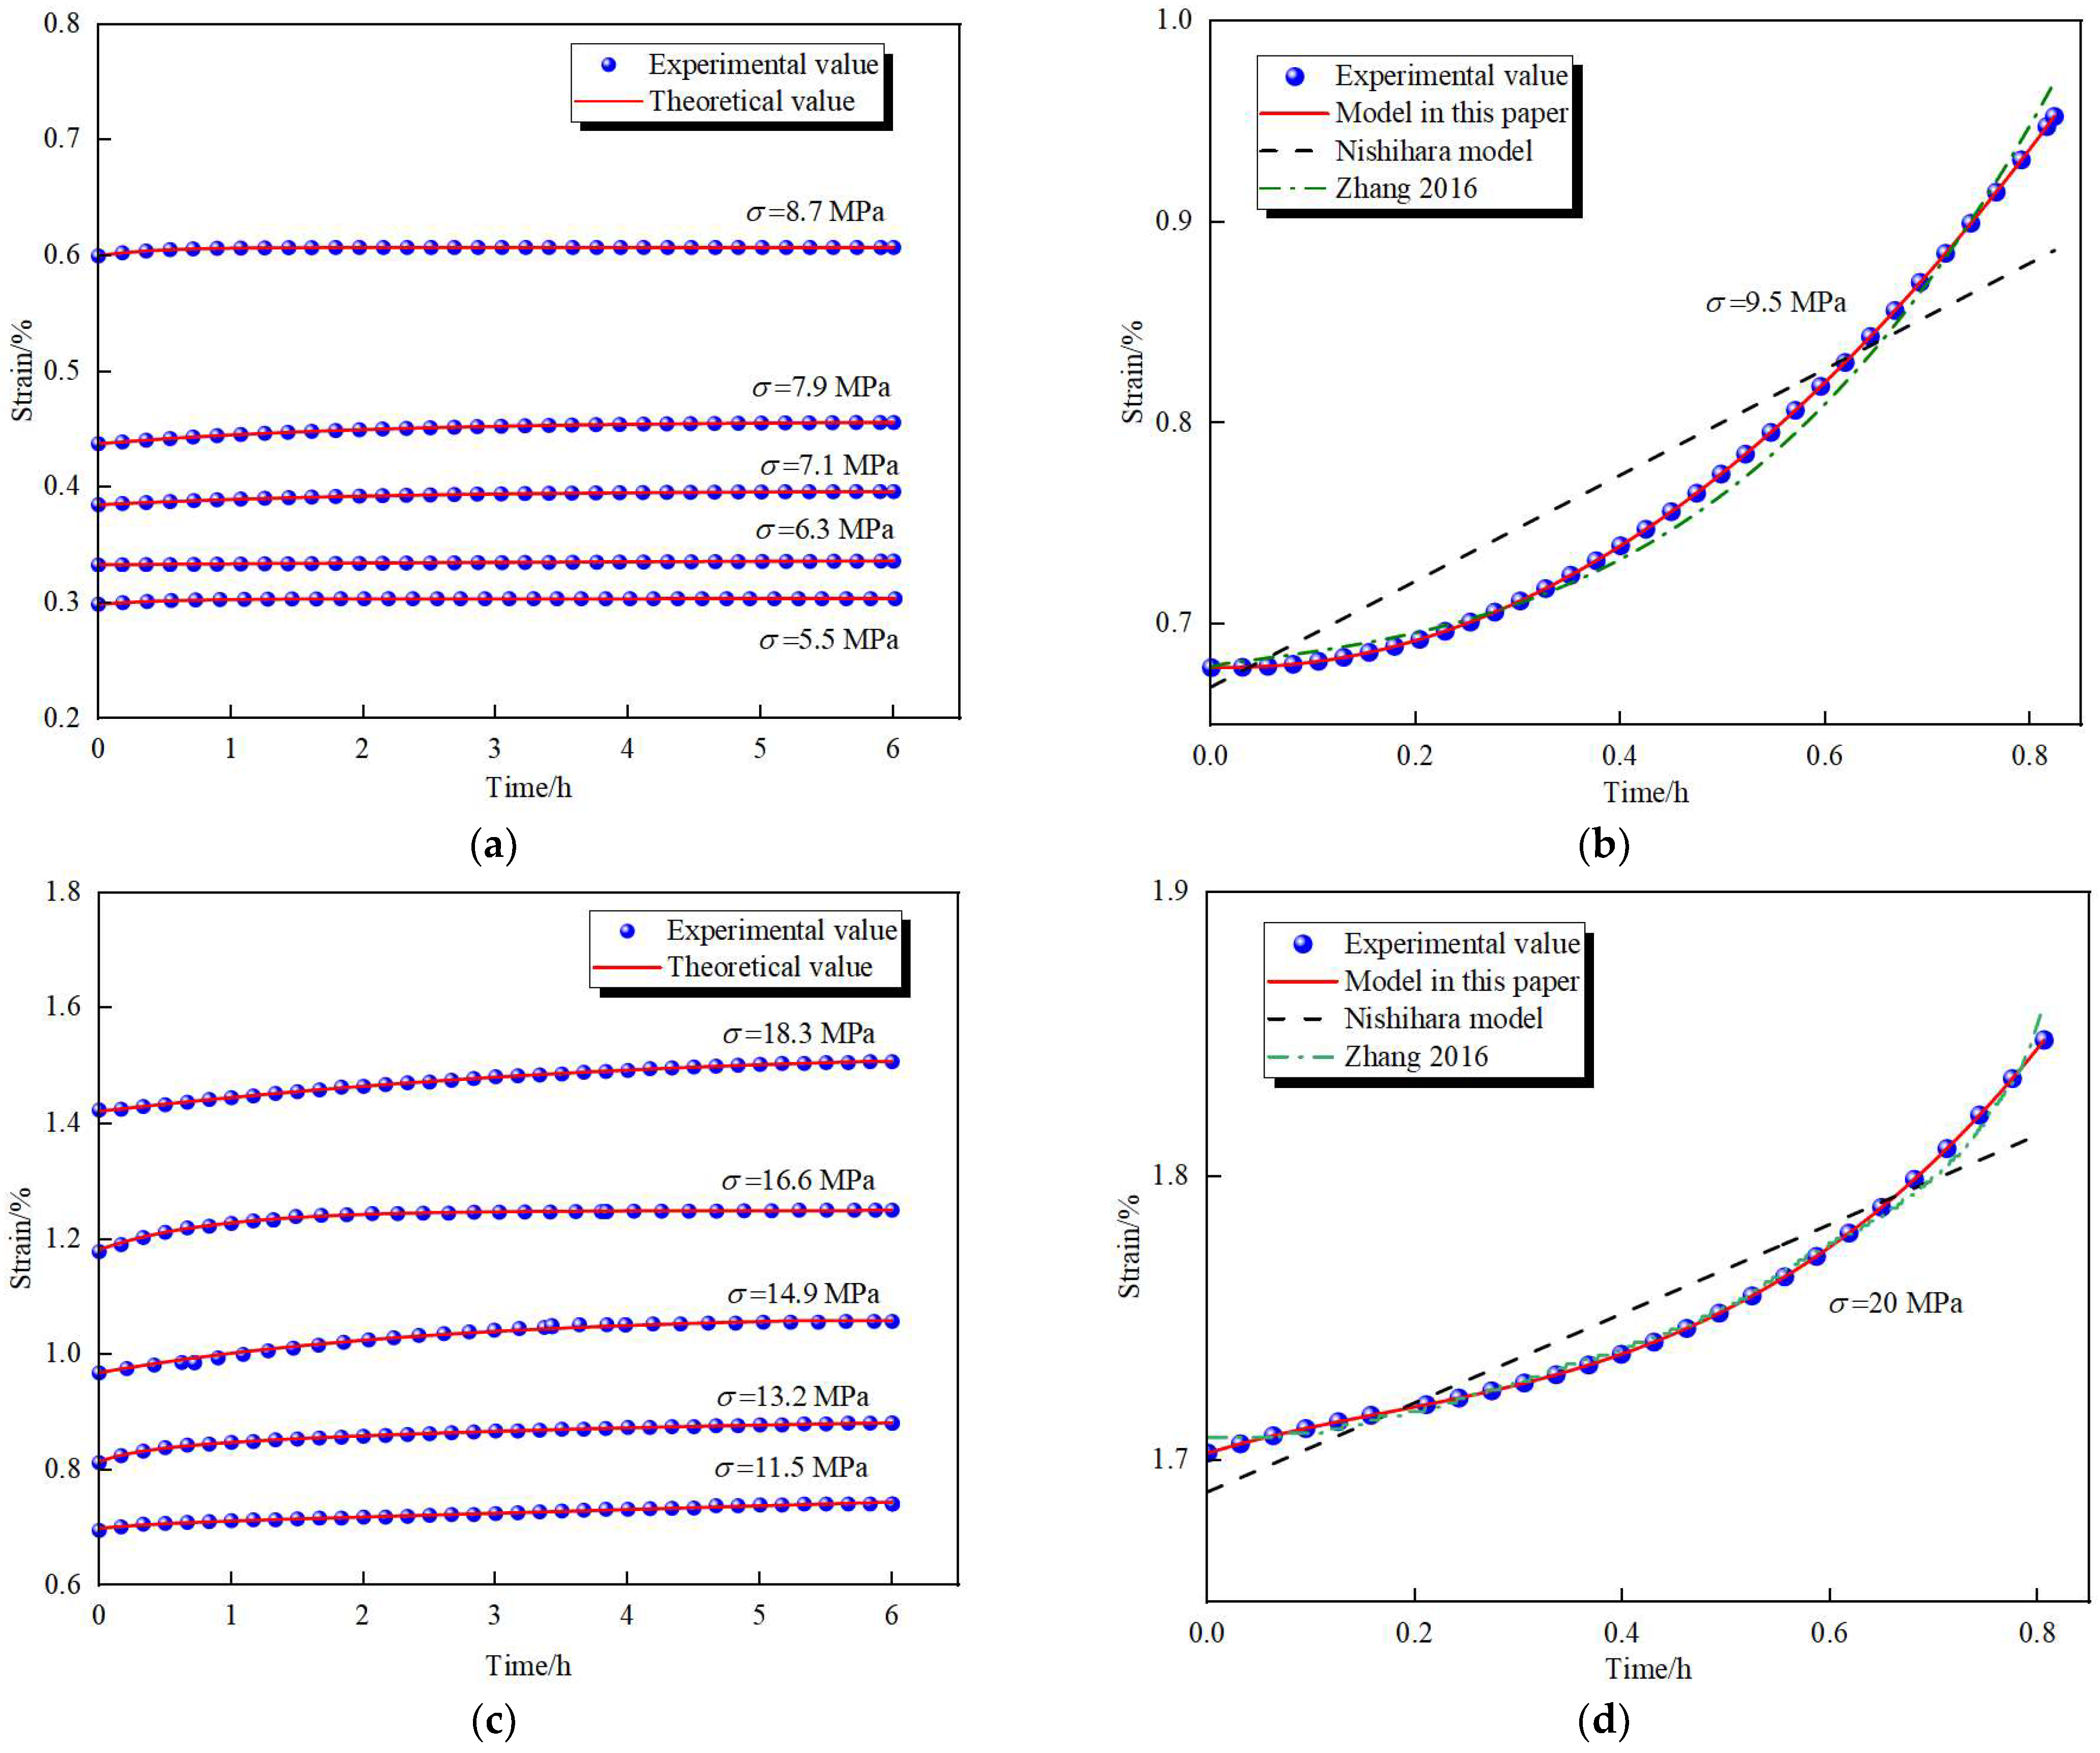
Figure 9.
Creep test and model fitting curve of weakly cemented soft rock under different conditions. (a) σ3 = 0 MPa (low stress). (b) σ3 = 0 MPa (high stress) [42]. (c) σ3 = 2 MPa (low stress). (d) σ3 = 2 MPa (high stress) [42].
In the equation, μ represents Poisson’s ratio. For analytical convenience, the shear modulus K0 and bulk modulus G are unified into the elastic modulus E0. As shown in Table 4 and Figure 8, the proposed model precisely delineates the three stages of creep failure in weakly cemented soft rock, with a fitting accuracy exceeding 99%. Compared to the traditional Nishihara model, it adeptly captures the phenomenon of a sharp increase in creep rate and nonlinear strain–time growth during testing. Furthermore, compared to the enhanced Nishihara model without considering damage [42], it exhibits superior capability in reflecting the mechanical characteristics of the creep process during the accelerated creep stage. This results in a marked improvement in fitting accuracy, which in turn effectively mitigates the limitations of the Nishihara model in accelerated creep failure description. Consequently, the improved Nishihara model considering damage proposed in this study can accurately depict the full-stage creep characteristics of weakly cemented soft rock.
3.4.2. Model Sensitivity Analysis
Taking the creep test results obtained under 2 MPa confining pressure as an example, Figure 10 illustrates the impact of parameters and λ on the creep damage curves. As shown in Figure 10, there exists a significant variation regarding the creep curves featured by increasing a and λ. Specifically, Figure 10a demonstrates that when a > 0.01, the trend of accelerated creep becomes increasingly pronounced, and the shape of the creep curve changes noticeably. Similarly, Figure 10b shows that when λ > 0.001, the creep curve’s shape undergoes notable alterations, with the characteristics of accelerated creep becoming more prominent as λ increases. This indicates that the occurrence of accelerated creep is strongly correlated with λ. It is evident that both parameters a and λ significantly affect the creep test curves under accelerated creep conditions.
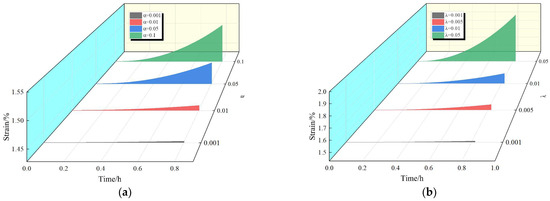
Figure 10.
Effect of parameters α and λ on creep curve. (a) α. (b) λ.
3.4.3. Applicability Validation
To further substantiate the model’s applicability, the proposed creep constitutive model considering damage was employed to verify the creep test results of salt rock [52], anthracite [53], and mica–quartz schist [54], as depicted in Figure 11.
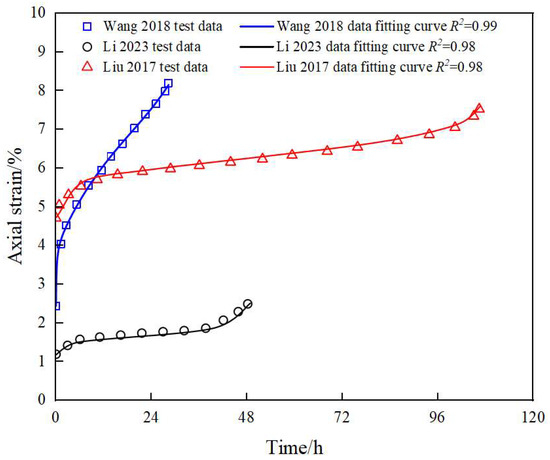
Figure 11.
Model validation [52,53,54].
Figure 11 demonstrates that the calculated results utilizing the proposed creep constitutive model that accounts for damage align well with the experimental data from references [52,53,54], with a correlation coefficient of R2 ≥ 0.98. This indicates that the proposed model possesses strong availability in describing the full-stage creep behavior of geotechnical materials.
4. Secondary Development of Creep Damage Constitutive Model
4.1. Differential Form of Constitutive Model
Based on the principle of series connection, the modified Nishihara model reveals that the stress experienced by each component is equivalent while the strains are cumulative, as shown in Figure 8.
The total rock strain is the aggregate of the strains in the Hook component, Kelvin–Voigt component, Bingham component, and winding element, which can be expressed as:
The deviatoric stress increment is as follows:
where , , , , and represent the strain increments at each time step for the whole model, Hook component, Kelvin–Voigt component, Bingham component, and winding element, respectively.
For the Hook component:
For the Kelvin-Voigt component:
The Bingham deviatoric strain rate is as follows:
For the Bingham component, the total strain increment within a time step is as follows:
For the winding element:
For the winding element, the total strain increment within a time step is as follows:
where is the total deviatoric stress; is the elastic modulus of the Hook component; is the viscosity coefficient of the damping element in the viscoelastic body; K is the elastic modulus of the spring element in the viscoelastic body; and represent the deviatoric strain and deviatoric strain rate of the deviatoric strain, respectively; denotes the plastic strain rate of the viscoplastic body; represents the deviatoric strain rate of the viscoplastic body; and is the volumetric strain rate deviation for the viscoplastic body.
In the present study, the stress and strain of the proposed model at the initial loading phase are consistent with those of the conventional Nishihara model, where only the Hook and Kelvin components are involved. Therefore, the new deviatoric stress, strain, and spherical stress of the model can be expressed as follows:
where N and O represent the values before and after the model time step.
Upon entering the yield state, the Bingham component and winding element begin to function, at which time the deviatoric and spherical stresses should be corrected as follows:
where and are the initial deviatoric and spherical stress, respectively, archived through the trial stress. The program flow chart is illustrated in Figure 12.
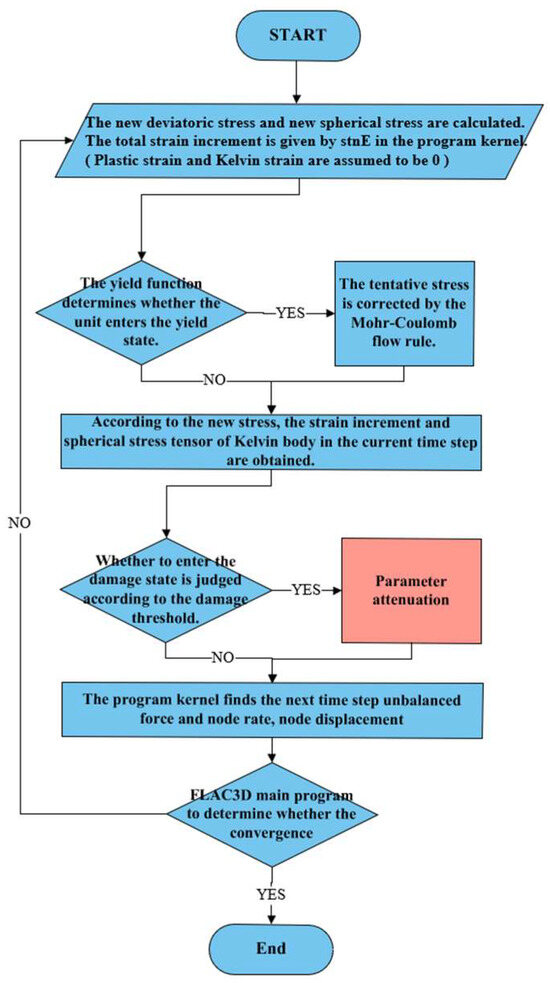
Figure 12.
Program flow chart.
4.2. Verification of Axial Stress–Strain
To validate the correctness of the programming in the yield phase of this model, the experimental results from stepwise loading in uniaxial and triaxial conditions on weakly cemented mudstone specimens were selected for comparison with the simulated uniaxial and triaxial tests based on the model proposed in this paper.
4.2.1. Numerical Modeling Setup
The simulated tests used international standard specimens of 50 × 100 mm, with the bottom end fixed, no circumferential constraints, and loading applied at the top. The numerical model was constructed using a mesh comprising 3200 elements and 3421 nodes to ensure sufficient accuracy while maintaining computational efficiency. Boundary conditions were applied by fixing the bottom of the model in the Z-direction to prevent vertical displacement, while the top surface was subjected to axial loading. The lateral boundaries were treated according to the loading conditions: unconstrained in the uniaxial case and constrained in the triaxial case. For the uniaxial simulations, the axial stress was increased stepwise from 5.5 MPa to 9.5 MPa, whereas in the triaxial condition, the loading ranged from 11.5 MPa to 20 MPa. Each loading step was maintained for a duration of 6 h to replicate the conditions of the laboratory creep tests. Table 5 and Table 6 provide parameters used for numerical analysis.
Table 5.
Verification model parameter for uniaxial simulations.
Table 6.
Verification model parameter for triaxial simulations.
FLAC3D was used in this study to obtain numerical results. FLAC3D was chosen due to its robust built-in support for time-dependent constitutive models and flexibility in secondary development via user-defined FISH functions. Unlike ABAQUS or ANSYS, which are more suited for solid mechanics problems with complex geometry but limited time-dependent rock creep features, FLAC3D is tailored for geotechnical problems involving large deformations, making it more practical for simulating underground excavation scenarios. UDEC, while useful for jointed rock, lacks the 3D continuum capabilities required for this study.
4.2.2. Numerical Modeling Results
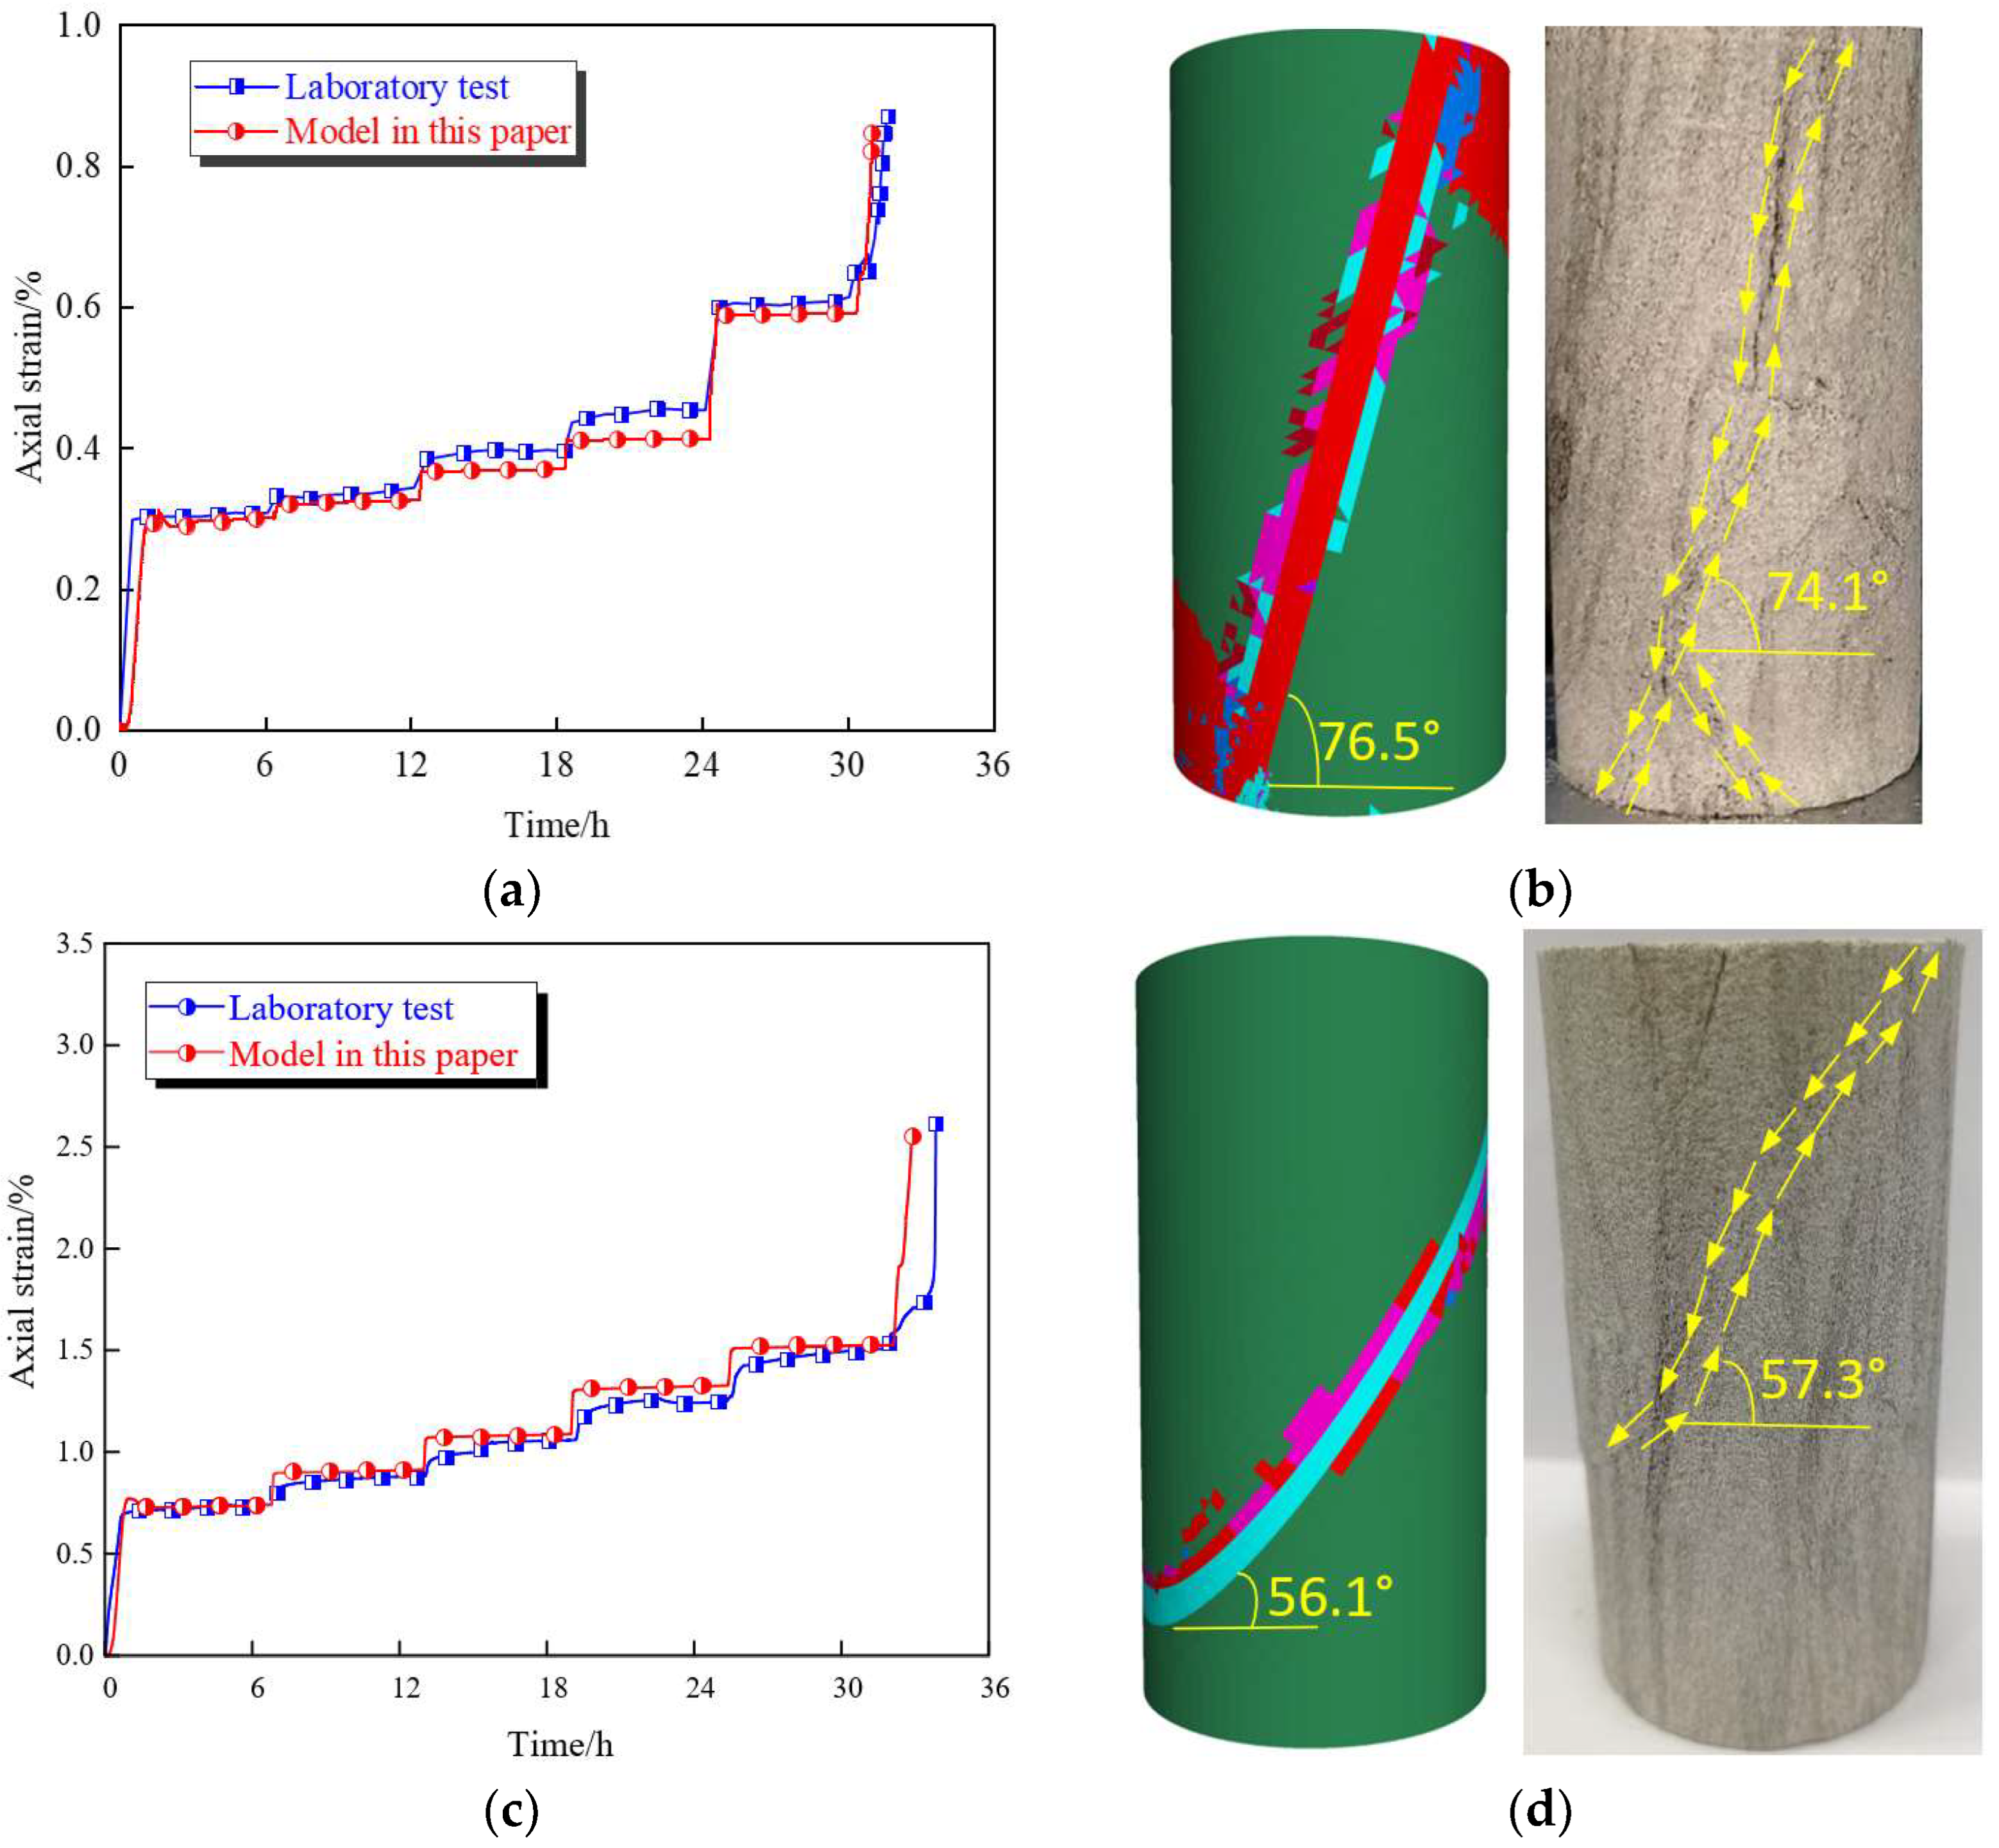
Figure 13 illustrates the comparison between the laboratory tests and the simulated tests. In Figure 13a, it can be observed that the axial strain calculated by the model in this paper generally aligns with the axial strain curve from the uniaxial laboratory tests documented in the literature: at an axial load of 5.5 MPa, the axial strain is approximately 0.3%; at 6.3 MPa, the axial strain is about 0.33%; at 7.1 MPa, the axial strain is about 0.38%; at 7.9 MPa, the axial strain is about 0.44%; and at 8.7 MPa, the axial strain is about 0.6%. The average deviation remains within 5%, exhibiting high consistency with experimental values. According to Figure 13b, the simulated fracture angle is 76.5°, while the experimental fracture angle is 74.1°, with a discrepancy of 2.4°. This indicates that the failure modes are consistent, demonstrating that the weakly cemented soft rock creep model considering damage, developed based on FLAC3D in this paper, can essentially represent the actual creep curve of the rock under uniaxial conditions.

Figure 13.
Comparison diagram of axial strain between the simulation and test. (a) Creep curve (uniaxial condition). (b) Mode of failure (uniaxial condition). (c) Creep curve (triaxial condition). (d) Mode of failure (triaxial condition).
To further validate the model’s applicability, simulations were also conducted under triaxial conditions. Figure 13c presents a comparison between laboratory-measured and numerically simulated axial strain over time under triaxial creep conditions. Both curves exhibit remarkably similar trends, demonstrating the model’s ability to accurately replicate experimental creep behavior. Throughout the entire duration, the maximum deviation between experimental and modeled results remains within 5%, indicating excellent agreement. Moreover, the simulated fracture angle is 56.1°, while the experimental fracture angle is 57.3°, with a discrepancy of 1.2°.
5. Conclusions
Based on the microstructure and creep tests of weakly cemented mudstone from a mine in western China, this study investigated the creep damage degradation mechanism of the material. By incorporating a damage factor derived from an improved Nishihara model, a novel damage-based rheological model was proposed. The model was implemented through secondary development, and simulation results demonstrated strong fitting performance. The key conclusions drawn from this study are as follows:
- Microstructural analysis revealed that the high clay mineral content (40.4%) and the loose structure characterized by face-to-face and cemented connections are the primary factors contributing to creep in weakly cemented mudstone. Under external forces, the fracture of clay minerals leads to the continuous propagation of microcracks, ultimately resulting in accelerated creep.
- The proposed damage creep model dynamically captures parameter weakening through a time-dependent damage factor and accurately represents the three stages of creep by incorporating nonlinear winding elements. Its three-dimensional extension enhances its applicability to real-world engineering problems. Parameter inversion using the Levenberg–Marquardt (L-M) algorithm confirmed a fitting accuracy exceeding 98%. Sensitivity analysis indicated that the acceleration stage was significantly affected by the damage coefficients α and λ.
- The numerical feasibility of the model was validated through secondary development in FLAC3D. The deviation between simulation and experimental results was within 5%, and the model successfully replicated the creep behavior of salt rock, anthracite, and mica–quartz schist, demonstrating strong universality. These findings provide a theoretical foundation for predicting time-dependent deformation and supporting disaster prevention and control in deep underground engineering.
This study mainly focuses on uniaxial and conventional triaxial stress states, without consideration of true triaxial or dynamic creep behavior. Additionally, the damage factor applied here uniformly affects both elastic and viscoelastic components, which may oversimplify material responses. Future work should explore creep under true triaxial or dynamic loading conditions and investigate the differential effects of damage on various moduli. Although the model was developed and implemented within FLAC3D in the current study, the governing constitutive equations are general and suitable for integration into other numerical platforms such as ABAQUS or ANSYS. Adaptation to discrete frameworks like LEM remains an open research direction, as the current model structure assumes continuum mechanics.
Author Contributions
Conceptualization, J.H.; Software, J.H.; Writing—original draft, J.H.; Supervision, X.L.; Funding acquisition, S.H. and X.L.; Writing—review and editing, X.L., S.H., and C.Z.; data curation, S.G., Z.G., and J.D.; formal analysis, D.Y. and Y.C. All authors have read and agreed to the published version of the manuscript.
Funding
The research described in this paper was financially supported by the National Natural Science Foundation of China (No. 52274087), the Taishan Scholars Project (tsqnz20221140), and the Natural Science Foundation of Shandong Province (ZR2024ME097).
Data Availability Statement
The raw data supporting the conclusions of this article will be made available by the authors on request.
Conflicts of Interest
The authors declare that there are no conflicts of interest regarding the publication of this paper.
References
- Ru, W.K. Creep Damage and Engineering Application of Weakly Cemented Soft Rock Based on Energy Analysis. Ph.D. Thesis, Shandong University of Science and Technology, Qingdao, China, 2021. [Google Scholar]
- Hu, S.; Zhang, C.; Ru, W.; Han, J.; Guo, S.; Zhou, X.; Yang, L. Creep properties and energy evolution characteristics of weakly cemented rock under step loading. Int. J. Rock Mech. Min. Sci. 2023, 170, 105428. [Google Scholar] [CrossRef]
- Li, X.; Chen, D.; Li, Z.; Liu, S.; Zhai, M.; Li, Y.; Gong, B.; Sun, Z.; Wang, Y.; Wang, D. Roadway Portal and Self-Moving Hydraulic Support for Rockburst Prevention in Coal Mine and Its Application. Phys. Fluids 2024, 36, 124136. [Google Scholar] [CrossRef]
- Yang, X.; Yu, F.; Ma, C.; Zhang, T.; Wang, B.; Zhao, X. Study on Floor Heave Characteristics and the Control Method of Gob-Side Entry Driving in Weakly Cemented Soft Rock. Sustainability 2023, 15, 3969. [Google Scholar] [CrossRef]
- Boukharov, G.N.; Chanda, M.W.; Boukharov, N.G. The three processes of brittle crystalline rock creep. Int. J. Rock Mech. Min. Sci. Geomech. Abstr. 1995, 32, 325–335. [Google Scholar] [CrossRef]
- Maranini, E.; Brignoli, M. Creep behaviour of a weak rock: Experimental characterization. Int. J. Rock Mech. Min. Sci. 1999, 36, 127–138. [Google Scholar] [CrossRef]
- Li, X.; Cao, Z.; Xu, Y. Characteristics and Trends of Coal Mine Safety Development. Energy Sources Part A Recovery Util. Environ. Eff. 2025, 47, 2316–2334. [Google Scholar] [CrossRef]
- Huang, P.; Zhang, J.; Zhang, Q.; Damascene, N.J.; Guo, Y. Nonlinear Creep Model of Deep Gangue Backfilling Material and Time-Dependent Characteristics of Roof Deformation in Backfilling Mining. Geofluids 2020, 2020, 8816871. [Google Scholar] [CrossRef]
- Huang, P.; Zhang, J.; Damascene, N.J.; Dong, C.; Wang, Z. A fractional order viscoelastic-plastic creep model for coal sample considering initial damage accumulation. Alex. Eng. J. 2021, 60, 3921–3930. [Google Scholar] [CrossRef]
- Li, M.; Pu, H.; Cao, L.; Sha, Z.; Yu, H.; Zhang, J.; Zhang, L. Damage Creep Model of Viscoelastic Rock Based on the Distributed Order Calculus. Appl. Sci. 2023, 13, 4404. [Google Scholar] [CrossRef]
- Frenelus, W.; Peng, H.; Zhang, J. Creep Behavior of Rocks and Its Application to the Long-Term Stability of Deep Rock Tunnels. Appl. Sci. 2022, 12, 8451. [Google Scholar] [CrossRef]
- Tarifard, A.; Török, Á.; Görög, P. Review of the creep constitutive models for rocks and the application of creep analysis in geomechanics. Rock Mech Rock Eng. 2024, 57, 7727–7757. [Google Scholar] [CrossRef]
- Xu, H.F. Study on time effect of strength and elastic modulus of soft rock. Chin. J. Rock Mech. Eng. 1997, 3, 47–52. [Google Scholar]
- Gao, X.; Hu, T.; Su, Z. Nonlinear Nishihara model of soft rock based on damage mechanics and its parameter identification. Mater. Today Commun. 2024, 39, 108715. [Google Scholar] [CrossRef]
- Deng, X.; Shi, J.; Li, X.; Wang, R.; Zhang, J.; Yang, X. The secondary development and application of the improved Nishihara creep model in soft rock tunnels. Buildings 2023, 13, 2082. [Google Scholar] [CrossRef]
- Liu, W.; Zhang, S. An improved unsteady creep model based on the time-dependent mechanical parameters. Mech. Adv. Mater. Struct. 2020, 28, 1838–1848. [Google Scholar] [CrossRef]
- Sun, X.M.; Miao, C.Y.; Jiang, M.; Zhang, Y.; Yang, L.; Guo, B. Experimental and theoretical study on creep behaviors of sandstone with different moisture contents based on modified Nishihara model. Chin. J. Rock Mech. Eng. 2021, 40, 2411–2420. [Google Scholar] [CrossRef]
- Zhao, X.; Chen, H.; Lv, J.; He, X.; Qin, Y.; Sun, K. Triaxial Creep Damage Model for Salt Rock Based on Fractional Derivative. Sustainability 2023, 15, 10369. [Google Scholar] [CrossRef]
- Jiang, Q.; Qi, Y.; Wang, Z.; Zhou, C. An extended Nishihara model for the description of three stages of sandstone creep. Geophys. J. Int. 2013, 193, 841–854. [Google Scholar] [CrossRef]
- He, Z.; Dai, B. Secondary development of a nonlinear creep model based on fractional derivative in FLAC3D. In Proceedings of the 2018 11th International Conference on Intelligent Computation Technology and Automation (ICICTA), Changsha, China, 22–23 September 2018; IEEE: Piscataway, NJ, USA, 2018; pp. 67–71. [Google Scholar]
- Liu, X.; Yang, X.; Wang, J. A nonlinear creep model of rock salt and its numerical implement in FLAC3D. Adv. Mater. Sci. Eng. 2015, 2015, 285158. [Google Scholar] [CrossRef]
- Yu, M.; Liu, Y.; Liu, B.; Liu, K.; Deng, T. Numerical implementation of a hydraulic interaction creep model and its application to the support reinforcement of water-rich cracked tunnel. Tunn. Undergr. Space Technol. 2024, 154, 106098. [Google Scholar] [CrossRef]
- Zhou, J.; Yang, X.; Ding, Z. A secondary development based on the Hoek-Brown criterion for rapid numerical simulation prediction of mountainous tunnels in China. Geomech. Eng. 2023, 34, 69–86. [Google Scholar] [CrossRef]
- Wang, M.; Song, Z.F.; Zheng, D.J.; Shen, W.L.; Gou, P.F.; Wei, S.J. Development and application of rock energy dissipation model in FLAC3D. J. China Coal Soc. 2021, 46, 2565–2573. [Google Scholar] [CrossRef]
- Xiao, Y.; Qiao, Y.; He, M.; Li, H.; Cheng, T.; Tang, J. A unified strain-hardening and strain-softening elastoplastic constitutive model for intact rocks. Comput. Geotech. 2022, 148, 104789. [Google Scholar] [CrossRef]
- Gutiérrez-Ch, J.G.; Senent, S.; Zeng, P.; Jimenez, R. DEM simulation of rock creep in tunnels using rate process theory. Comput. Geotech. 2022, 142, 104559. [Google Scholar] [CrossRef]
- Nikolić, M.; Karavelić, E.; Ibrahimbegovic, A.; Miščević, P. Lattice element models and their peculiarities. Arch. Comput. Methods Eng. 2018, 25, 753–784. [Google Scholar] [CrossRef]
- Wang, X.S.; Fan, T.T.; Kitmeng, L. Finite element analysis on the creep constitutive equation of high modulus asphalt concrete. Adv. Mater. Sci. Eng. 2015, 1, 860454. [Google Scholar] [CrossRef]
- Park, J.M.; Lee, G.Y.; Kim, D.H.; Jung, H.M. Creep simulation and validation for a finite element analysis of expanded polystyrene-based cushioning systems. Appl. Sci. 2022, 12, 12663. [Google Scholar] [CrossRef]
- Bidadi, J.; Googarchin, H.S. Experimental study on mode I fracture response of adhesive joints subjected to systematic creep damage. Theor. Appl. Fract. Mech. 2025, 136, 104868. [Google Scholar] [CrossRef]
- Su, T.; Liu, Z.; Zhou, H.; Wang, H.; Hu, X.; Zhang, F. A Three-Dimensional Fractional Calculus-Based Creep Model for Granite Considering Thermal Effects. Int. J. Appl. Mech. 2025, 58, 95. [Google Scholar] [CrossRef]
- Wang, X.; Xiang, J.; Xie, W.; Xia, C.; Yang, J.; Wei, W. Experimental investigation of the long-term creep behavior of extremely soft coal rocks and novel nonlinear creep mathematical model with a nonstationary viscous coefficient. Bull. Eng. Geol. Environ. 2025, 84, 11. [Google Scholar] [CrossRef]
- Ma, L.; Lei, M.; Wang, L.; Hu, B.; Zhao, Y.; Zhang, J. An Improved Nishihara Model Considering the Influence of Moisture Content on the Whole Shear Creep Process of Shale. Processes 2025, 13, 783. [Google Scholar] [CrossRef]
- Liu, C.; Dong, T.; Qi, Y.; Guo, X. Variable-Order Time-Fractional Kelvin Peridynamics for Rock Steady Creep. Fractal Fract. 2025, 9, 197. [Google Scholar] [CrossRef]
- Shi, X.; Jing, H.W.; Chen, W.Q.; Gao, Y.; Zhao, Z.L. Investigation on the creep failure mechanism of sandy mudstone based on micromesoscopic mechanics. Geofluids 2021, 1, 5550733. [Google Scholar] [CrossRef]
- Kang, J.; Zhou, F.B.; Liu, C.; Liu, Y.K. A fractional non-linear creep model for coal considering damage effect and experimental validation. Int. J. Non-Linear Mech. 2015, 76, 20–28. [Google Scholar] [CrossRef]
- Sun, S.; Zhang, X.; Zhou, Y. Features and Constitutive Model of Hydrate-Bearing Sandy Sediment’s Triaxial Creep Failure. Water 2024, 16, 2947. [Google Scholar] [CrossRef]
- Li, J.; Hu, B.; Sheng, J.; Huang, L. A Fractional-Order Creep-Damage Model for Carbonaceous Shale Describing Coupled Damage Caused by Rainfall and Blasting. Fractal Fract. 2024, 8, 459. [Google Scholar] [CrossRef]
- Song, Z.P.; Wang, B.W.; Fan, S.Y.; Zhang, Y.T.; Wang, J.B. Nonlinear creep intrinsic modeling of hard rock considering aging damage. Chin. J. Rock Mech. Eng. 2024, 43, 2368–2380. [Google Scholar] [CrossRef]
- Zhang, L.; Zhang, C.; Hu, K.; Xie, S.; Jia, W.; Song, L. A Fractional Creep Model for Deep Coal Based on Conformable Derivative Considering Thermo-Mechanical Damage. Processes 2024, 12, 1121. [Google Scholar] [CrossRef]
- Wu, J.; Wang, W.; Cao, Y.J.; Liu, S.F.; Zhang, Q.; Chu, W.J. A novel nonlinear fractional viscoelastic–viscoplastic damage creep model for rock-like geomaterials. Comput. Geotech. 2023, 163, 105691. [Google Scholar] [CrossRef]
- Zhang, Q.G.; Liang, Y.C.; Fan, X.Y.; Li, G.Z.; Li, W.T.; Yang, B.Z.; Tong, M. A modified Nishihara model based on the law of the conservation of energy and experimental verification. J. Chongqing Univ. 2016, 39, 117–124. [Google Scholar]
- Li, G.; Yan, G.; Kong, S.; Bai, X.; Du, C.; Li, J.; Zhang, J. Design of an Anthracite Creep Model Based on Fractional Order Theory: Experiments and Simulations. Appl. Sci. 2023, 13, 6522. [Google Scholar] [CrossRef]
- Sun, J. Rock rheological mechanics and its advance in engineering applications. Chin. J. Rock Mech. Eng. 2007, 6, 1081–1106. [Google Scholar]
- Zhang, Q.Y.; Yang, W.D.; Zhang, J.G.; Yang, C.H. Variable parameters-based creep damage constitutive model and its engineering application. Chin. J. Rock Mech. Eng. 2009, 28, 732–739. [Google Scholar]
- Zhang, J.C.; Xu, W.Y.; Wang, H.L.; Wang, R.B.; Meng, Q.X. Testing and modeling of the mechanical behavior of dolomite in the Wudongde hydropower plant. Geomech. Geoengin. 2016, 11, 270–280. [Google Scholar] [CrossRef]
- Rehman, Z.U.; Zhang, G. Three-dimensional elasto-plastic damage model for gravelly soil-structure interface considering the shear coupling effect. Comput. Geotech. 2021, 129, 103868. [Google Scholar] [CrossRef]
- Wang, X.; Wei, Y.; Jiang, T.; Hao, F.; Xu, H. Elastic–plastic criterion solution of deep roadway surrounding rock based on intermediate principal stress and Drucker—Prager criterion. Energy Sci Eng. 2024, 12, 2472–2492. [Google Scholar] [CrossRef]
- Rehman, Z.U.; Luo, F.; Wang, T.; Zhang, G. Large-scale test study on the three-dimensional behavior of the gravel–concrete interface of a CFR dam. Int. J. Geomech. 2020, 26, 04020046. [Google Scholar] [CrossRef]
- Li, H.; Li, X.; Fu, J.; Zhu, N.; Chen, D.; Wang, Y.; Ding, S. Experimental Study on Compressive Behavior and Failure Characteristics of Imitation Steel Fiber Concrete under Uniaxial Load. Constr. Build. Mater. 2023, 399, 132599. [Google Scholar] [CrossRef]
- Qi, Y.J.; Jiang, Q.H.; Wang, Z.J.; Zhou, C.B. 3D creep constitutive equation of modified Nishihara model and its parameters identification. Chin. J. Rock Mech. Eng. 2012, 31, 347–355. [Google Scholar]
- Wang, J.B.; Liu, X.R.; Song, Z.P.; Zhao, B.Y.; Jiang, B.; Huang, T.Z. A whole process creeping model of salt rock under uniaxial compression based on inverse S function. Chin. J. Rock Mech. Eng. 2018, 37, 2446–2459. [Google Scholar] [CrossRef]
- Li, G.; Yan, G.C.; Xiang, H.T.; Bai, X.Y.; Li, J.J.; Zhang, J.W. Creep model of anthracite and FLAC3D secondary development. Coal Sci. Technol. 2023, 43, 103–110. [Google Scholar] [CrossRef]
- Liu, H.Z.; Xie, H.Q.; He, J.D.; Xiao, M.L.; Zhuo, L. Nonlinear creep damage constitutive model for soft rocks. Mech. Time-Depend. Mater. 2017, 21, 73–96. [Google Scholar] [CrossRef]


Disclaimer/Publisher’s Note: The statements, opinions and data contained in all publications are solely those of the individual author(s) and contributor(s) and not of MDPI and/or the editor(s). MDPI and/or the editor(s) disclaim responsibility for any injury to people or property resulting from any ideas, methods, instructions or products referred to in the content. |
© 2025 by the authors. Licensee MDPI, Basel, Switzerland. This article is an open access article distributed under the terms and conditions of the Creative Commons Attribution (CC BY) license (https://creativecommons.org/licenses/by/4.0/).