Article

Evaluating the Thymoquinone Content and Antioxidant Properties of Black Cumin (Nigella sativa L.) Seed Oil During Storage at Different Thermal Treatments

by
Grażyna Neunert
1,*,
Wiktoria Kamińska
1 and
Joanna Nowak-Karnowska
2
1
Department of Physics and Biophysics, Faculty of Food Science and Nutrition, Poznan University of Life Sciences, Wojska Polskiego 38/42, 60-637 Poznan, Poland
2
Department of Bioanalytical Chemistry, Faculty of Chemistry, Adam Mickiewicz University, Uniwersytetu Poznańskiego 8, 61-614 Poznan, Poland
*
Author to whom correspondence should be addressed.
Appl. Sci. 2025, 15(1), 377; https://doi.org/10.3390/app15010377
Submission received: 19 November 2024 / Revised: 21 December 2024 / Accepted: 2 January 2025 / Published: 3 January 2025

Abstract

:
Black cumin seeds (Nigella sativa) and black cumin seed oil (BCSO) exhibit various pharmacological activities, most of which are attributed to the presence of thymoquinone (TQ). TQ, however, is characterized by low stability at elevated temperatures and instability in aqueous environments. In this study, the spectroscopic properties of TQ were used to monitor changes in TQ content in BCSO subjected to thermal exposure. Simultaneously, the influence of the presence of TQ on the antioxidant properties of this oil was determined. The used spectrofluorimetric and chromatographic method quantified the presence of TQ. The antiradical properties of the oil in different stages of thermal oxidation degradation were determined by the DPPH method. The measured antiradical activity of the oil, depending on the exposure conditions used, revealed the difference correlated with the content of the TQ. However, the presence in BCSO of other bioactive components, like phenols, had a more significant influence on its total antioxidant capacity. Furthermore, our study, for the first time, focused on the rise in TQ content in the oil during thermal storage, indicating a new method to enhance the TQ content in BCSO.

1. Introduction

Black cumin (Nigella sativa) seeds and black cumin seed oil (BCSO) have various pharmacological effects, including analgesic, antiulcer, anti-inflammatory, antibacterial, antimicrobial, and anticancer properties [1]. BCSO has a diverse chemical composition. It contains proteins, carbohydrates, and fixed and volatile oil. In different varieties of black cumin seeds, a lot of bioactive compounds have been isolated, identified, and described, many of which exhibit strong antioxidant properties [2]. Therefore, BSCO was successfully used, blended with some vegetable oils to improve the oxidative stability [3]. However, the antioxidants’ effects are not always visible or it is difficult to clearly attribute the observed effects in the extracts or oil from black cumin seeds to specific compounds. Most of the pharmacological properties of the seeds and BCSO are attributed to the presence of thymoquinone (TQ) (Figure 1), which is the main bioactive component of black cumin seed essential oil. The TQ content in the volatile oil can reach up to almost 50% depending on the origin of the plant and seed storage, and on the method of oil production [2,4,5]. It was noted that BCSO was found to contain higher amounts of TQ compared to seeds [6]. TQ naturally occurs in N. sativa seed but is also reported in other herbs of genera like Juniperus, Cupressus, and Tetraclinis [7].
In plants, the biosynthesis of TQ takes place mainly by the terpene biosynthetic pathway, where thymol or carvacrol received from the hydroxylation of p-cymene are the intermediate products [8,9]. It was reported that these compounds were one of the major compositions of essential oil from black cumin seed, occurring in varying amounts depending on the origin, the genotype of the seeds, or the oil extraction methods [5,10,11]. On the other hand, TQ can be synthesized in gram quantities as a result of the oxidation of thymol or carvacrol in a controlled catalyzed reaction [8,12]. Studies have also been published showing that TQ can be derived from thymol via a biotransformation with Synechococcus sp., although the yield reported for this process was low [13].
TQ is characterized by low stability at elevated temperatures, instability in aqueous environments, and significant sensitivity at light [14,15]. Under light and thermal stress conditions, it was degraded to several products, among others, thymohydroquinone and dithymoqiunone, which were identified by the LC-MS/MS assay [15]. Due to the reasons mentioned above, the medicinal use of clear TQ is limited. Furthermore, since TQ is fat-soluble, BCSO may be an effective therapeutic form derived from N. sativa seeds [4,16]. In oil during heating, TQ, as the volatile compound, decreases under thermal storage but simultaneously remained more stable compared to most of the other terpenes [17]. The loss of TQ that may occur during oil storage can affect the pharmacological properties of BCSO. Thus, determining the TQ content and conditions that limit the decrease in the TQ amount may contribute to the preservation of these properties. Moreover, the oxidation processes occurring during oil storage may impact its overall quality and the observed antioxidant properties [18].
The presence of TQ in BCSO can be confirmed by different techniques, among which chromatographic methods are the most commonly used. Others, like UV spectroscopy, Fourier-transform infrared (FTIR) spectroscopy, or Nuclear Magnetic Resonance (NMR), are less frequently employed [4,19]. The FTIR assay is a fast and non-destructive technique, and sensitive, and requires no special sample preparation; it is widely used in research laboratories and the food industry to characterize oils with specific bands or regions of the spectrum [20]. Wavelengths of absorption peaks can be linked to the types of bonds in a molecule, providing important information about the functional groups it contains. FTIR spectroscopy is an excellent tool for analysis as the intensities of the bands in the spectrum are proportional to the compounds’ concentration. This technique is commonly used to characterize edible oils and fats, because, according to the composition and nature of the sample, the FTIR spectrum differs in the intensity and exact frequency at which the transmittance or absorbance band maximum occurs.
Another fast and simple method in sample preparation is fluorescence spectroscopy, which is quick, non-invasive, and sensitive. To improve the selectivity of this sensitive method, synchronous fluorescence spectra can be detected. The synchronous fluorescence technique allows for an increase in spectral resolution and provides a better discriminant ability in multicomponent samples [21,22]. Furthermore, fluorescence spectroscopy was successfully applied as an alternative method to the Folin–Ciocalteu assay for the estimation of the total phenol content in virgin olive oil extracts, by measuring the fluorescence intensity with the excitation/emission wavelengths set at 280/320 nm [23].
In this study, fast and simple spectroscopic methods, such as FTIR analysis, spectrofluorimetric techniques, and fluorescence emission spectral measurements, were used as alternatives to chemical methods for determining the parameters that characterize the oxidation process of BCSO. These spectroscopic techniques also served as substitutes for the chromatography method to evaluate the TQ content in BCSO during thermally accelerated oxidation tests conducted under different conditions. Moreover, this study aimed to obtain data to help clarify the relationship between the TQ content and the observed free radical scavenging properties of BCSO. Using different thermal conditions, the effect of TQ on the observed antiradical properties of the oil was clearly assessed. Moreover, the conditions used also helped, for the first time, to indicate new possibilities for increasing by the thermal treatment of the TQ content in BCSO.

2. Materials and Methods

2.1. Chemicals and Materials

Analytical-grade solvents—methanol, n-hexane, ethyl acetate, isooctane (2,2,4-trimethylpentane)—were purchased from Merck (Darmstadt, Germany). Thymoquinone (2-isopropyl-5-methylbenzo-1,4-quinone) (TQ), 1,1-diphenyl-2-picrylhydrazyl (DPPH), Trolox, and α-tocopherol were obtained from Sigma-Aldrich (Steinheim, Germany). The cold-pressed black cumin (Nigella sativa) seed oil (BCSO) was donated from (sourced) SemCo (SemCo Sp. Z o.o. Sp.k., Szamotuły, Poland).

2.2. Thermal Treatment

The probe of oil (BCSO) was placed in tightly closed glass vial (200 mL) (namely, “closed” probe) without external air and with no inert gases’ protection and stored in an oven at 60 °C for three weeks (Schaal oven test) [24]. A second series of BCSO probe was kept under the same thermal conditions mentioned above in uncovered glass vial (namely, “open” sample) in air atmosphere. The probes of oil were removed from the oven for analysis after 3, 6, 10, 14, 18, 20, 21, and 24 days of incubation. All the samples were stored in a freezer until analyses.

2.3. K232 and K268 Calculated

The oxidative stability of BCSO was assessed by calculated the specific absorbance coefficient of oil (K232 and K268) following the standard method described by AOCS 2009 [25]. Briefly, samples were diluted with isooctane and in a cell of 1 cm path length, and the absorbances at the wavelength of 232 and 268 nm were measured by Shimadzu UV-1201 spectrophotometer (Kyoto, Japan). The final values were calculated following the Equation (1):
Kλ = [Aλ/(c × s)]
where Kλ is specific absorbance coefficient at λ = 232 or 268 nm, Aλ is the absorbance, c is the concentration of oil in the solvent (g/100 mL), and s is the path length (cm). Analysis was carried out in triplicate for each sample and the average result of every sample was taken as the final result.

2.4. Preparation of Methanolic Extracts of the Oil

One gram of BCSO was extracted with 2 mL of methanol. Weighed oil was shaken with methanol for 10 min and left for one hour in the dark at room temperature. After this time, the methanolic layer was separated from the oil and stored in a freezer until analysis.

2.5. FTIR-ATR Measurements

The spectra of BCSO probes were collected at 22 °C using a Spectrum Two FT-IR spectrophotometer equipped with a Universal ATR (Attenuated Total Reflectance) unit with a diamond crystal (Perkin Elmer, Waltham, MA, USA). A 20 μL drop of each sample was put on the ATR crystal and the FTIR signal acquisition was recorded in the region 450–4000 cm−1 by accumulating 20 scans, with the resolution of 4 cm−1. The ATR-FTIR spectra of the oil film were obtained against the background of air spectrum.

2.6. UV and Fluorescence Spectra

All samples were analyzed by UV spectroscopy (200–340 nm) using a Shimadzu UV-1201 spectrophotometer (Kyoto, Japan). The synchronous fluorescence spectra (SFS) were collected using Shimadzu RF 5001PC fluorimeter (Kyoto, Japan) at room temperature. For fluorescence measurements, 90° (L-shaped) geometry was applied. The excitation and emission slit widths were 5 nm. The total SFS were collected by measuring the excitation spectra in the 200–700 nm range with wavelength interval (Δλ) ranging from 10 to 90 nm at 10 nm intervals. For UV–Vis measurements, 1% n-hexane solution (v/v) of each oil sample was prepared.

2.7. Quantification of Thymoquinone by HPLC

High-performance liquid chromatography (HPLC) was performed according to published method by Salmani et al. [14] with a Waters system with a binary gradient-forming module Waters 1525, and diode-array UV–Vis detector Waters 2998. Methanolic extract of the oil sample was diluted 30 times with methanol, and 20 µL was injected on an Inertsil ODS-3 Column (5 µm, 4.6 × 250 mm) at 25 °C, and eluted with the mixture of 40% H2O and 60% of acetonitrile mobile phase at a flow rate of 1 mL/min. The thymoquinone content in oil samples was determined using a calibration curve of TQ standard.

2.8. DPPH Assay

Antioxidant capacity of BCSO in different stages of oxidation and its extracts were determined using the stable 2,2-diphenyl-1-picryhydrazyl (DPPH) radicals. To determine the scavenging efficiency of DPPH, the traditional method was applied which includes the measurement of absorbance at 517 nm after 30 min of incubation. Then, 2 mL volume of various dilutions of the oil in ethyl acetate or their methanolic extracts (prepared from different amount of oils) were mixed with 0.2 mL of 0.001 M methanolic solution of DPPH. The absorbance at 517 nm was measured against a blank of pure solvent. The free radical scavenging activity of all solutions was then calculated as percentage of inhibition on the basis of the following equation:
% inhibition = (AB)/A × 100
where A = absorbance of control and B = absorbance of the sample.
Antioxidant activities of tested samples were expressed as IC50, whose value represented the concentration of the compounds, that caused 50% inhibition. All experiments were carried out in triplicate. Trolox and α-tocopherol were used as a control samples.

2.9. Data Evaluation and Statistical Analysis

Each measurement was repeated at least three times and calculated average values with standard deviations (SD). The data obtained from three replications were analyzed by one-way analysis of variance (ANOVA) using OriginPro Software for Windows, Version 2023b (OriginLab Corporation, Northampton, MA, USA). Differences among the means were compared using Fisher’s post hoc test at a significance level of 0.05. The Pearson correlation coefficient I was calculated in order to determine the relationship between TQ concentration calculated from different measurements methods and between IC50 and TQ content or amount of total phenols of oil at a significance level of 0.05.

3. Results and Discussion

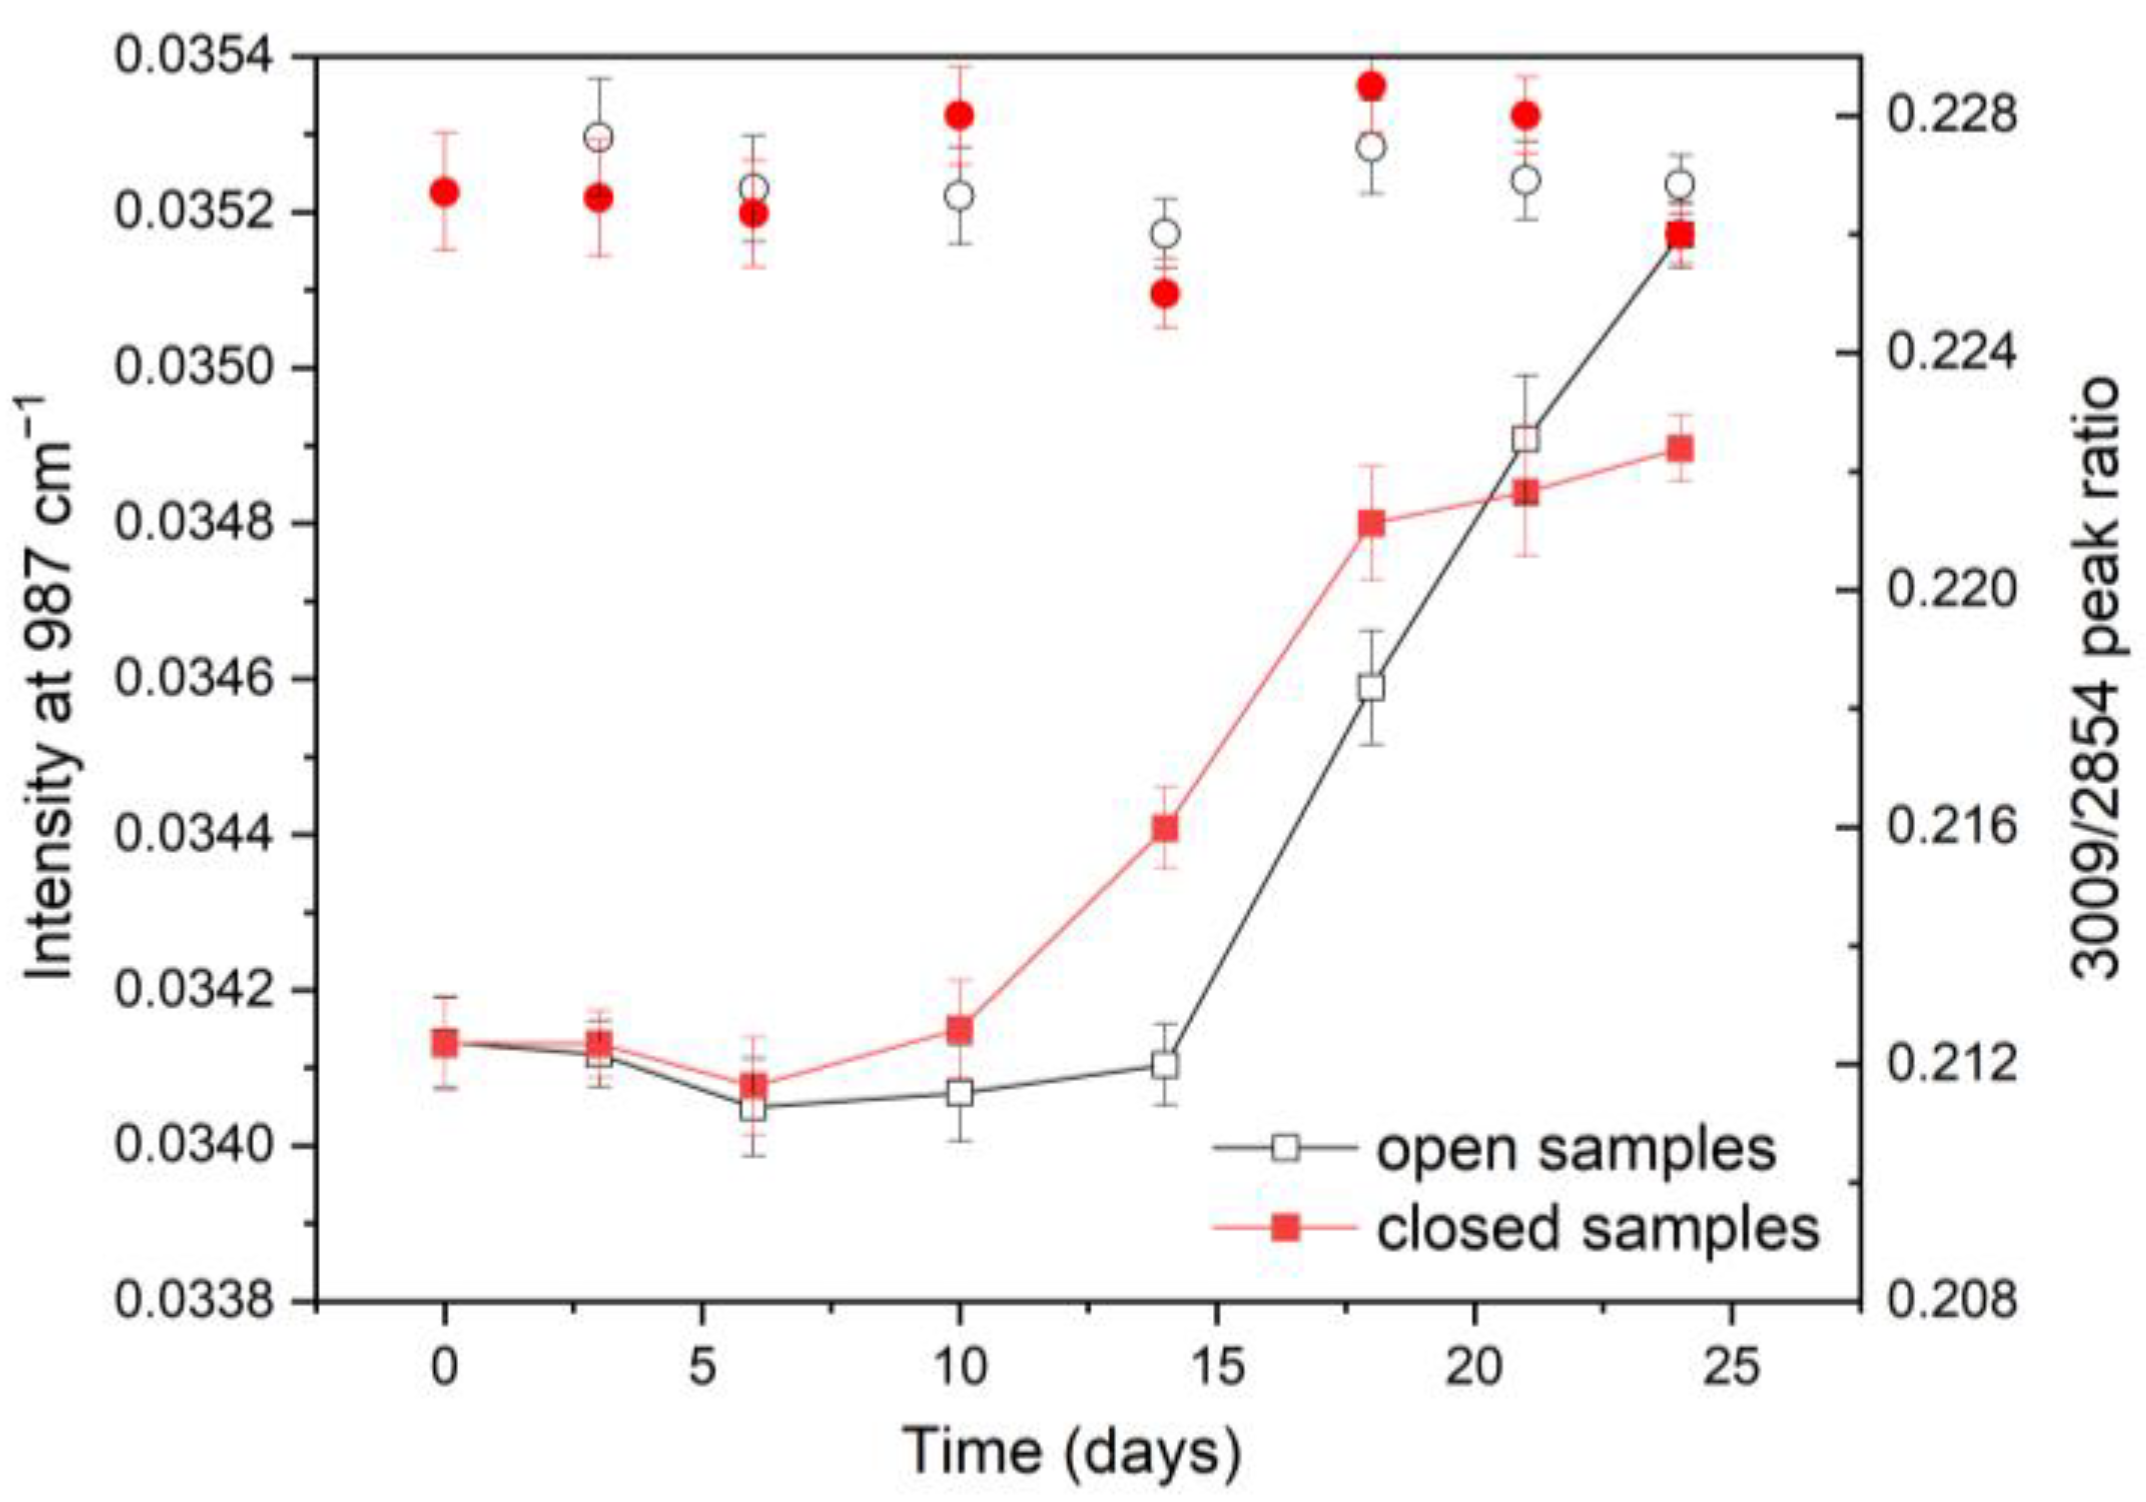
3.1. Oxidative Stability of BCSO

Oil oxidation is a complex process which involving autoxidation and photo-oxidation. Beyond environmental factors such as light and oxygen, an increase in temperature also plays a significant role that leads to an increase in autooxidation and the decomposition of hydroperoxides. The rate of oxidation depends on a variety of factors, including the chemical composition of oil, temperature, exposure to light, and presence of oxygen. The main change in storing oil occurs due to the decrease in polyunsaturated fatty acids (PUFAs). To evaluate the progress of the oxidation of cold-press black cumin seed oil (BCSO) during the acceleration thermal aging test, specific absorbance coefficients and some characteristic FTIR bands were used.

3.1.1. Specific Absorbance Coefficients

The presence of conjugated diene (CD) and triene (CT) systems resulting from oxidation processes were determined by measuring the specific absorptivity at 232 and 268 nm. The calculated values from Equation (1) of K232 and K268, presented in Table 1, indicated the existence of primary and secondary oxidation products, respectively. The behavior of the obtained value of this parameters during storage at 60 °C was similar to that reported by Ramadan and Morsel [26]. No significance change in the K232 value was noticed up to 18 days of storage for the uncovered samples. Later, a slight acceleration was observed. Comparable results of K232 for BCSO were obtained by Kiralan [17], although, in this study, after 10 days of heating, a significant increase in the K232 value was noted from the initial 8 up to 27. In the case of the covered probes, K268 showed a smaller (no statistically differences) alteration at the end of the storage time. The observed differences between the open and closed samples’ behavior were the result of the oxygen presence. It was indicated that oxygen accelerates the oxidation process in oils [27], so, in open probes, the primary oxidation products were created more efficiently. For the second absorption indicator, K268, no evidenced increase in these values during storage was observed for both kinds of oil probes. This is related to the fact that the amount of CT triene systems, as a result of the next step of oxidation, usually increased in the middle or late phase of this process [28]. Only a slight change in specific absorptivity values indicated that the BCSO was resistance to thermal treatment.

3.1.2. FTIR Spectra

FTIR spectroscopy is an effective tool for analysis, as band intensities correlate with compound concentrations. It is widely used to characterize edible oils and fats, as the FTIR spectra vary in intensity and frequency based on the sample’s composition and nature. In this study, the FTIR spectra of oil samples were used as an indicator for lipid oxidation and were simultaneously used to track changes in the TQ content (see Section 3.2).
The FTIR spectra of the thermal treatment BCSO “open” probes, scanned at mid-infrared regions, were shown on Figure 2. They exhibit the characteristic peaks and shoulders commonly present in fatty acids and triacylglycerols, of which the assignment to various functional groups can be found in the literature [20,29]. Some of them, when the oil is exposed to excessive heat or oxidation, change in intensity and thereby can be used to monitor aging processes of oils [30]. A peak at around 3009 cm−1 arises from the stretching vibration of the cis double bond (=C-H), which, during oxidation, was converted in a single methylene bond confirmed by a peak at 2854 cm−1. Another peak at 987 cm−1 associated with the bending vibration of the C-H trans and cis conjugated diene groups of hydroperoxides can be connected with the first step of the oxidation of the tested oil. Hence, the peak ratio 3009/2854 or intensities at 987 cm−1 could be used as an indicator for the oxidation level of lipids [31].
All samples were shown to have no significant modifications in the intensity of the absorption bands’ characteristic for the oxidation process. Presented in Figure 3, the value of the peak ratio 3009/2854 for both the “open” and “closed” BCSO samples oscillated about 0.226–0.228 over 24 days of thermal treatment with any characteristic tendency, whereas a change in intensities at 987 cm−1 was exhibited, with a slight increase after 10 and 14 days of thermal treatments, for the “closed” and “open” samples, respectively. This agreed with the trend of the specific absorptivity value at 232 nm indicating only a small amount of increase in hyperoxides as the primary oxidation products in BCSO undergoing thermal stress. The high oxidative stability of BCSO compared to other cold-press oils was also reported in previous studies [26,32].

3.2. TQ Content Estimation

In our experiments, BCSO was subjected to an accelerated aging process at 60 °C in an oxygen atmosphere and with limited oxygen access. During this test some of the potentially important bioactive components could be degraded, thus reducing the quality of the oil. One of the most desired compounds of BCSO is thymoquinone (TQ), the main aroma compound of BCSO. In our work, the TQ content in the BCSO samples during the storage test was determined both qualitatively (FTIR spectroscopy) and quantitatively (UV spectrophotometry and HPLC assay).

3.2.1. Specification of Used Methods

The FTIR spectrum of TQ showed strong absorption bands and shoulders in the 1700–1600 cm−1 region that could be assigned to carbonyl stretching, and weaker bands corresponded to aliphatic (~2967 cm−1) and vinylic (~3040 cm−1) C-H stretching [33,34]. Moreover, TQ contains chromophores that absorb in the UV range, with a prominent peak (λmax) at about 254–257 nm (Figure S1, inset), which can be used for estimating its quantity [35]. The most accurate methods of quantitative analysis are undoubtedly chromatographic methods. In this study, we therefore utilized high-performance liquid chromatography (HPLC) to confirm the possible observed changes in TQ content in BCSO detected by the used spectroscopy techniques. HPLC analyses (monitored at 254 nm) of the oil samples after extraction with methanol revealed a peak with a retention time at 10.5 min, which corresponds to TQ (Figure S1). The peak was identified by comparing the retention time and UV spectrum with a TQ standard and with literature data [14].
The obtained FTIR spectra of BCSO, Figure 2, have demonstrated the existence of a variety of sharp, strong peaks belonging mainly to the triglycerides [36,37]. Some of the weaker peaks can, in turn, be attributed to the presence of a known bioactivate component like TQ, dithymoquinone, or thymol, the presence of which in BCSO was confirmed, among others, by FTIR spectroscopy [19].
In the frequency region, at the FTIR spectra characteristic to TQ, an absorption band was observed with a maximum at 1659 cm−1 (inset at Figure 2) belonging to the C=O stretching, which is supported by the values reported for TQ [19,33]. The changes in the intensity of this band were used to track variations in the TQ content in the heating oil and, together with spectrophotometric and HPLC results, were shown in Figure 4. The quantification of TQ in BCSO was established on the base of the UV spectra, by measurements of the absorption intensity at λmax = 254 nm, using the Beer–Lambert Law and a standard curve with the correlation coefficient of 0.9965. The amount of TQ from HPLC chromatograms (retention time 10.5 min) was calculated based on a standard curve with the correlation coefficient of 0.9976.

3.2.2. Changes in TQ Content During Thermal Treatment of BCSO

The analysis of the TQ amount demonstrated that its content in BCSO (9.5 mg/mL and 6.65 mg/mL for the UV and HPLC assay, respectively) was in accordance with previous research [5,38]. As can be seen in Figure 4, during storage at 60 °C, its content was changed depending on the storage conditions. For “open” samples (Figure 4a), after more than three weeks of heating, the intensity of the bands discussed above were clearly decreased, indicating a reduction in TQ concentration in the oil samples at about 45%, 65%, and 75% of the initial value obtained for FTIR, UV, and HPLC dependence, respectively. In BCSO, during heating in open bottles, TQ, as the volatile compound, decreases under thermal storage, but, as reported in other research, simultaneously remained more stable compared to most of the other terpenes [17]. The differences in the quantity amounts of TQ obtained by the spectrophotometric and HPLC methods could be due to the presence of other oil compounds, containing chromophores and functional groups that absorb at the same TQ wavelength range [4,35]. However, the results obtained from each of the methods used showed the same trend during the entire heating process. The calculated Pearson correlation coefficients between the HPLC and spectroscopic results (r = 0.7416 ÷ 0.9949) confirmed a statistically significant relationship between the used methods. This study demonstrated that spectroscopic methods are a good alternative to the quantitate determination of TQ by an HPLC assay during the accelerate storage test.
Interestingly, in the first days of heating, the TQ content in “open” probes has clearly grown (at about 10%) compared to the no treatment oil, which is evidently seen for all three dependences presented at Figure 4a. In addition, for “closed” samples (Figure 4b), the TQ content after 3 days of heating increased at about 25%, keeping that higher value by almost all over days. A statistically significant decrease occurred only at the end of heating. Moreover, after 24 days of heating, the amount of TQ was still higher compared to BCSO before starting storage at 60 °C. In order to check in which period of time this rise in TQ content occurs, an additional experiment was performed, where, initially, the oil was heated in a closed vial (first part for 3 days, and second part for 6 days), and then the vial was opened. Also, in that test, an increase of about 25% in the TQ concentration was observed after 3 days, which was kept during the time when the dish was closed and a systematic decrease in its content was started after opening the vial (Figure S2). The obtained results indicate the growth in TQ content, presumably as a result of the conversion of some other compounds present in the oil to TQ which occurred at the initial period of heating.
It is known that, in plants, the biosynthesis of TQ primarily occurs through the terpene biosynthetic pathway, where thymol or carvacrol serve as the intermediate products [8,9,11]. In our study, the increasing TQ content in BCSO probably ensued from the conversion of one or both of the above-mentioned or other monoterpenes, which may occur at a higher temperature. Such a hypothesized mechanism of the transition between quinones by the oxidation of thymol under controlled heat finally leading to the formation of TQ was indicated in [39]. However, it cannot be ruled out that the presence of other oil compounds is necessary for the process we observed to take place. As previous results indicate, the volatiles’ accumulation, including TQ, in N. sativa, similar to the presence other oil components, was closely associated with, for example, the developmental stage of the seeds, environmental conditions of plant growth, or extraction methods [9,11]. Therefore, the final BCSO composition may vary, which can influence the possibility of achieving TQ synthesis during heating.
Similar to our research, Kiralan [17], for BCSO heating in open bottles, also observed an increase in the TQ concentration at the early stage of thermal treatment but no explanation or comments about that phenomena was provided by this author. In present study, we described, for the first time ever, to the best of our knowledge, the synthesis of TQ in bulk oils under thermal treatment occurring without any additional chemicals or condition, and, furthermore, together with its possible elucidation. This opportunity seems important because the observed increase occurred during the initial heating period, when the higher temperature had no significant effect on the oxidative stability of BCSO (see Section 3.1). The exact explanation of the stages of this process, along with the identification of the involved compounds and its conditions, will be the subject of future studies.

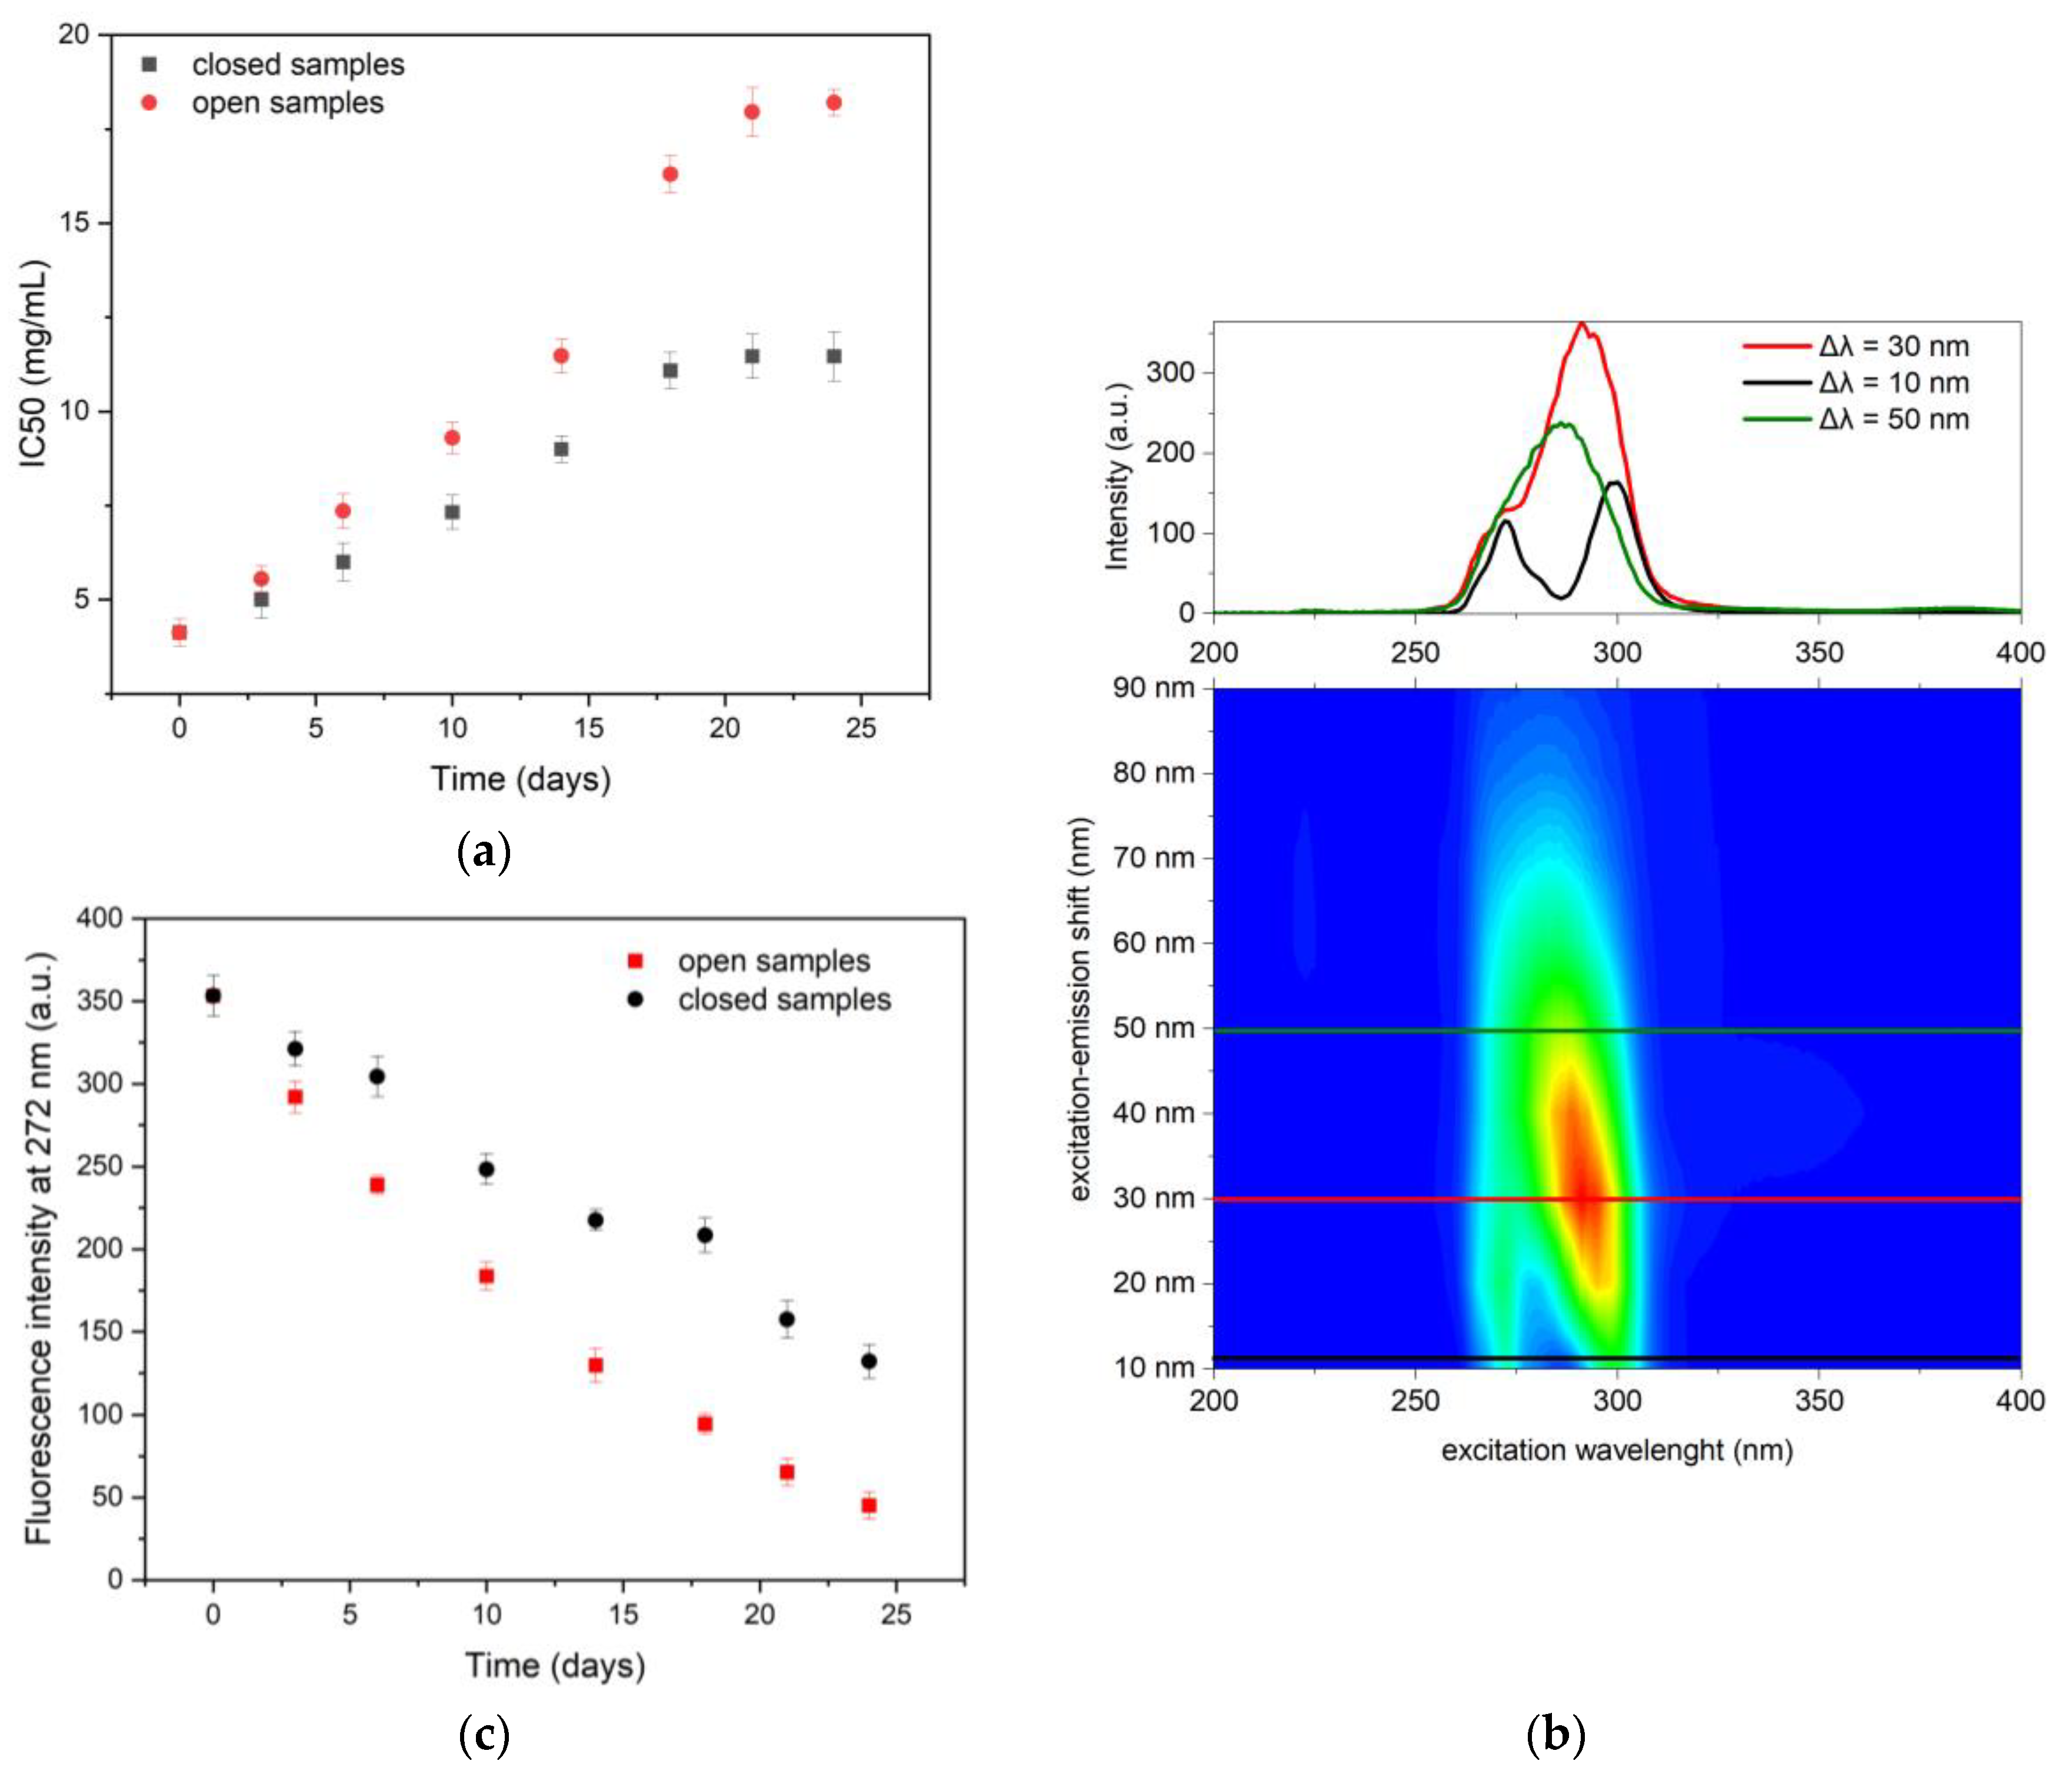
3.3. DPPH Radical Scavenging Activity

Previous studies have shown that BCSO has high radical scavenging activity [18,32,38]. Some reports indicate that the phenolic compounds have a dominant effect on these properties [40], while others suggest the contribution to TQ and other essential oil compounds to them [38,41]. In conditions in which the loss of TQ was limited, we examined its possible share in the observed oil’s antiradical properties using the DPPH test.

3.3.1. No Treatment BCSO and TQ Probe

The unheated BCSO was shown an IC50 value equal to 4.13 ± 0.36 mg/mL (Table 2), which was very close to those reported in the literature and simultaneously relatively lower compared to other oils [18]. The low IC50 level indicates strong antioxidant activity; therefore, the obtained IC50 value confirmed the high radical scavenging ability of BCSO. We obtained for TQ IC50 a value equal to 72.31 ± 0.26 µg/mL, which indicated its lower radical-scavenging capacity than control samples, Trolox, or α-tocopherol (Table 2). Other results indicated that TQ also possessed a significantly lower antioxidant potential compared to gallic acid, ascorbic acid, or some others volatile components of BSCO [35,42,43,44]. Moreover, we can find that the antiradical properties of antioxidants could depend on the solvent used during the experiment [45]. Therefore, the DPPH test was also made for the methanolic extract of BCSO, because methanol is reported to be the highest extraction solvent of TQ and has the highest free radical scavenging activity compared to other extraction solvents [35]. However, in our case, the higher IC50 value found for the BCSO methanolic extract reflected its weaker antioxidant activity against DPPH radicals. This difference can be explained by the presence in the ethyl acetate oil solution of additional lipophilic components exhibiting antioxidant properties, which the methanolic extract did not contain. The antioxidant properties of the lipophilic part of the oils were investigated in [46].

3.3.2. The Role of TQ in BCSO Radical Scavenging Activity

As can be seen in Figure 5a, during the accelerated storage test performed at 60 °C, the IC50 value was increased linearly with the heating time up to 18 days for both the “open” and “closed” samples. However, the growth rate for the “open” samples was clearly higher. In the final stage of the heating, after 18 days, the growth rate was decreased, maintaining the IC50 value at a constant level until the end of the test. Our studies indicate that the antioxidants contained in BCSO responsible for the observed antiradical properties were not resistant to elevated temperatures and were subject to degradation during oil heating. Additionally, the presence of oxygen enhanced this process.
Even though, for the “open” samples, the trend of the changes in antiradical properties mostly reflects the loss of TQ in BSCO and a statistically significant relationship between the IC50 value and TQ amount was observed (r = −0.9729), the changes in IC50 do not completely correlated with the variations in the TQ content in the “closed” samples (r = 0.0986). Namely, for the covered samples, IC50 increased gradually with storage time, while the alteration in TQ concentration was not statistically significant, beyond the first and last period (Figure 4b). Therefore, the obtained results indicating that TQ did not play a decisive role in the observed DPPH radicals scavenging of BCSO. It is probably due to the TQ low capacity to react as a hydrogen or electron donating antioxidant and, therefore, it exhibited low DPPH reactivity [42], although the free radical scavenging potential of TQ was clearly exhibited in [47]. Simultaneously, TQ is a significant hydroxyl radical and hydrogen peroxide scavenger, and may be converted by enzymatic reduction into thymohydroquinone, which exerts a highly radical-scavenging capacity [42,48].

3.3.3. Association Between the Phenolic Compound Content and BCSO Antioxidant Capacity

As reported in other research, BCSO contains a large amount of phenolic compounds [32,49]. It is known that phenols have a considerable effect on the oxidative stability of oils and, in many works of research, were assayed as the primary antioxidants in oils [40], although the content of minor compounds such as tocopherols can also impact the oxidation process of oils [50].
In our work, the change in phenol content was monitored spectroscopically based on the synchronous fluorescence spectra (SFS), which can be used to assess the presence of bioactive compounds in oils [22,51]. The total SFS of diluted BCSO (1%, v/v, in n-hexane), where the fluorescence intensity is presented as the wavelength interval (Δλ)/excitation wavelength relation (Figure 5b), reflects the most intense fluorescence for Δλ = 20–50 nm in the excitation region of 280–320 nm. The main fluorescence excitation maximum at 293 nm acquired at Δλ = 30 nm exhibits an additional band with a low intensity on the short-wavelength side. The better resolved fluorescence bands exhibited SFS obtained at an 10 nm wavelength interval, where two separate bands at 272 nm and 300 nm were noted, similar to virgin olive oil [21]. The first one can be assigned to phenols, whereas the second is attributed to tocopherols [21,52,53]. For the longer Δλ, behind the main maximum (Δλ = 50 nm), an asymmetric fluorescence band with a maximum at about 285 nm was assigned, which may result from the overlap of the characteristic bands of both groups of compounds [21]. The short-wavelength band observed for Δλ = 10 nm, referring to different phenols, was used to evaluate the total phenolic content in BCSO during the accelerated storage test in our study.
The intensity of this band decreased considerably with the heating time, along with maintaining the difference in the rate of change of this parameter between the “open” and “closed” samples (Figure 5c). Although the resistance and stability of antioxidants in different edible oils to thermal oxidation are highly variable [54], our results indicate the significant degradation of phenols in BSCO upon heating, especially in the presence of oxygen, similar to that observed for virgin olive oil [55]. On the other hand, antioxidant activity is known to have a linear correlation with the phenolic contents [5]. The first stage of the obtained relations presented in Figure 5a demonstrates this tendency. Moreover, statistically significant linear correlations were found between IC50 and the maximum fluorescence intensity of band appears at Δλ = 10 nm, with a correlation coefficient r = −0.8000 and −0.9300 for the open and closed samples of BSCO, respectively.
The observed linear trend, together with the strong correlation found, indicates the significant participation of phenolic compounds in the observed antioxidant properties of BCSO. A positive correlation between the amount of total phenols and BCSO oxidative stability was found in [49]. Nevertheless, it is not always possible to associate a high content of phenolic compounds with strong oxidative stability or antioxidant properties [26,38], since different phenolic compounds can differently affect the oxidative stability of the oil [40]. Moreover, in our study, disturbances in the linear trend of IC50 were visible in the ending stage of thermal oxidation, although linearity was maintained until the end of the experiment for the phenol content. The obtained relationships indicate that, in the final stage of heating, the action of some more thermal resistance antioxidants probably begins to be revealed. The mechanisms responsible for this phenomenon, however, require further analysis.

4. Conclusions

In this study, spectroscopic methods like FTIR, spectrofluorimetric, and emission spectral measurements were used as alternatives to chemical and more time-consuming methods for assessing the oxidation process of BCSO. These techniques also helped evaluate the TQ content in thermal oxidation tests. A highly statistically significant correlation was found between the techniques used, indicating the possibility of using spectroscopic methods as an alternative tool for both oxidative tests and TQ content calculation.
Moreover, by examining the effect of temperature on the TQ content in oil under different heating conditions, we have shown a significant effect of phenolic compounds and an unnoticeable effect of TQ on the observed free radical scavenging capacity of BCSO. In addition, we discovered a new way to increase the TQ content in bulk oil by thermal treatment. This is significant, as the observed rise occurs during the initial heating period, when higher temperatures do not yet significantly affect the oil’s oxidative stability. It should be noted that a detailed analysis of this initial thermal storage period should provide better insight into the kinetics of this process and contribute to improving the oil’s health-promoting properties. However, it should be considered that the composition of the oils is variable and depends on many factors. Therefore, the final composition of BCSO may affect the possibility of synthesizing TQ during thermal treatment.

Supplementary Materials

The following supporting information can be downloaded at: https://www.mdpi.com/article/10.3390/app15010377/s1, Figure S1: HPLC absorbance elution profile of methanolic extract of BCSO and absorption spectrum of TQ in BCSO corresponding to peak at 10.5 min (inset). Figure S2: Change of thymoquinone (TQ) content in BCSO: (a) samples open after 3 days and (b) samples open after 6 days of heating, expressed as FTIR intensity band at 1659 cm−1 (black line—right scale) and quantity amount of TQ calculated spectrophotometrically and from HPLC assay (bars—left scale). Error bars show the variations of three determinations in terms of standard deviation.

Author Contributions

Conceptualization, G.N.; methodology, G.N., W.K. and J.N.-K.; software, G.N., W.K. and J.N.-K.; validation, G.N., W.K. and J.N.-K.; formal analysis, G.N., W.K. and J.N.-K.; investigation, G.N., W.K. and J.N.-K.; data curation, G.N. and J.N.-K.; writing—original draft preparation, G.N.; writing—review and editing, G.N., W.K. and J.N.-K.; visualization, G.N. and J.N.-K.; supervision, G.N.; project administration, G.N. All authors have read and agreed to the published version of the manuscript.

Funding

This research received no external funding.

Institutional Review Board Statement

Not applicable.

Informed Consent Statement

Not applicable.

Data Availability Statement

The original contributions presented in this study are included in the article. Further inquiries can be directed to the corresponding author.

Conflicts of Interest

The authors declare no conflicts of interest.

References

  1. Gholamnezhad, Z.; Havakhah, S.; Boskabady, M.H. Preclinical and clinical effects of Nigella sativa and its constituent, thymoquinone: A review. J. Ethnopharmacol. 2016, 190, 372–386. [Google Scholar] [CrossRef]
  2. Zielińska, M.; Dereń, K.; Polak-Szczybyło, E.; Stępień, A.E. The role of bioactive compounds of nigella sativa in rheuma-toid arthritis therapy—Current reports. Nutrients 2021, 13, 3369. [Google Scholar] [CrossRef]
  3. Kiralan, M.; Ulaş, M.; Özaydin, A.; Özdemır, N.; Özkan, G.; Bayrak, A.; Ramadan, M.F. Blends of Cold Pressed Black Cumin Oil and Sunflower Oil with Improved Stability: A Study Based on Changes in the Levels of Volatiles, Tocopherols and Thymoquinone during Accelerated Oxidation Conditions. J. Food Biochem. 2017, 41, e12272. [Google Scholar] [CrossRef]
  4. Gad, H.A.; El-Ahmady, S.H. Prediction of thymoquinone content in black seed oil using multivariate analysis: An efficient model for its quality assessment. Ind. Crop. Prod. 2018, 124, 626–632. [Google Scholar] [CrossRef]
  5. Mohammed, N.K.; Abd Manap, M.Y.; Tan, C.P.; Muhialdin, B.J.; Alhelli, A.M.; Hussin, A.S.M. The Effects of Different Extraction Methods on Antioxidant Properties, Chemical Composition, and Thermal Behavior of Black Seed (Nigella sativa L.) Oil. Evid. Based Complement. Altern. Med. 2016, 2016, 6273817. [Google Scholar] [CrossRef] [PubMed]
  6. Isik, S.; Kartal, M.; Erdem, S.A. Quantitative analysis of thymoquinone in Nigella sativa L. (Black cumin) seeds and commercial seed oils and seed oil capsules from Turkey. J. Fac. Pharm. Ankara/Ankara Ecz. Fak. Derg. 2017, 41, 34–41. [Google Scholar] [CrossRef]
  7. Kurowska, N.; Madej, M.; Strzalka-Mrozik, B. Thymoquinone: A Promising Therapeutic Agent for the Treatment of Colorectal Cancer. Curr. Issues Mol. Biol. 2024, 46, 121–139. [Google Scholar] [CrossRef] [PubMed]
  8. Ahmad, A.; Mishra, R.K.; Vyawahare, A.; Kumar, A.; Rehman, M.U.; Qamar, W.; Khan, A.Q.; Khan, R. Thymoquinone (2-Isoprpyl-5-methyl-1, 4-benzoquinone) as a chemopreventive/anticancer agent: Chemistry and biological effects. Saudi Pharm. J. 2019, 27, 1113–1126. [Google Scholar] [CrossRef]
  9. Elyasi, R.; Majdi, M.; Krause, S.T.; Kücükay, N.; Azizi, A.; Degenhardt, J. Identification and functional characterization of a γ-terpinene synthase in Nigella sativa L (black cumin). Phytochemistry 2022, 202, 113290. [Google Scholar] [CrossRef]
  10. Sakdasri, W.; Sakulkittiyut, B.; Ngamprasertsith, S.; Sawangkeaw, R. Volatile Compound Fingerprints of Black Cumin (Nigella sativa L.) Seed Oil Extracted by Supercritical Carbon Dioxide. Biol. Life Sci. Forum 2021, 6, 31. [Google Scholar] [CrossRef]
  11. Edris, A.E. Evaluation of the volatile oils from different local cultivars of Nigella sativa L. Grown in Egypt with emphasis on the effect of extraction method on thymoquinone. J. Essent. Oil-Bearing Plants 2010, 13, 154–164. [Google Scholar] [CrossRef]
  12. Dockal, E.R.; Cass, Q.B.; Brocksom, T.J.; Brocksom, U.; Corrêa, A.G. A simple and efficient synthesis of thymoquinone and methyl p-benzoquinone. Synth. Commun. 1985, 15, 1033–1036. [Google Scholar] [CrossRef]
  13. Rasoul-Amini, S.; Fotooh-Abadi, E.; Ghasemi, Y. Biotransformation of monoterpenes by immobilized microalgae. J. Appl. Phycol. 2011, 23, 975–981. [Google Scholar] [CrossRef]
  14. Salmani, J.M.M.; Asghar, S.; Lv, H.; Zhou, J. Aqueous solubility and degradation kinetics of the phytochemical anticancer thymoquinone; probing the effects of solvents, pH and light. Molecules 2014, 19, 5925–5939. [Google Scholar] [CrossRef] [PubMed]
  15. Soliman, R.M.; Abdel Salam, R.A.; Eid, B.G.; Khayyat, A.; Neamatallah, T.; Mesbah, M.K.; Hadad, G.M. Stability study of thymoquinone, carvacrol and thymol using HPLC-UV and LC-ESI-MS. Acta Pharm. 2020, 70, 325–342. [Google Scholar] [CrossRef]
  16. Ahmad, A.; Husain, A.; Mujeeb, M.; Khan, S.A.; Najmi, A.K.; Siddique, N.A.; Damanhouri, Z.A.; Anwar, F. A review on therapeutic potential of Nigella sativa: A miracle herb. Asian Pac. J. Trop. Biomed. 2013, 3, 337–352. [Google Scholar] [CrossRef] [PubMed]
  17. Kiralan, M. Changes in volatile compounds of black cumin (Nigella sativa L.) seed oil during thermal oxidation. Int. J. Food Prop. 2014, 17, 1482–1489. [Google Scholar] [CrossRef]
  18. Albakry, Z.; Karrar, E.; Mohamed Ahmed, I.A.; Oz, E.; Proestos, C.; El Sheikha, A.F.; Oz, F.; Wu, G.; Wang, X. Nutritional Composition and Volatile Compounds of Black Cumin (Nigella sativa L.) Seed, Fatty Acid Composition and Tocopherols, Polyphenols, and Antioxidant Activity of Its Essential Oil. Horticulturae 2022, 8, 575. [Google Scholar] [CrossRef]
  19. Mohammed, S.J.; Amin, H.H.H.; Aziz, S.B.; Sha, A.M.; Hassan, S.; Abdul Aziz, J.M.; Rahman, H.S. Structural Characterization, Antimicrobial Activity, and In Vitro Cytotoxicity Effect of Black Seed Oil. Evid.-Based Complement. Altern. Med. 2019, 2019, 6515671. [Google Scholar] [CrossRef]
  20. Dong, Y.; Shi, S.; Li, Q.; Zhang, L. An indirect analytical approach based on ATR-FTIR spectroscopy for determining the FFA content in vegetable oils. RSC Adv. 2020, 10, 24073–24078. [Google Scholar] [CrossRef]
  21. Sikorska, E.; Khmelinskii, I.; Sikorski, M. Analysis of Olive Oils by Fluorescence Spectroscopy: Methods and Applications. In Olive Oil: Constituents, Quality, Health Properties and Bioconversions; IntechOpen: London, UK, 2007; pp. 63–88. ISBN 0000957720. [Google Scholar]
  22. Siejak, P.; Neunert, G.; Kamińska, W.; Dembska, A.; Polewski, K.; Siger, A.; Grygier, A.; Tomaszewska-Gras, J. A crude, cold-pressed oil from elderberry (Sambucus nigra L.) seeds: Comprehensive approach to properties and characterization using HPLC, DSC, and multispectroscopic methods. Food Chem. 2025, 464, 141758. [Google Scholar] [CrossRef] [PubMed]
  23. Papoti, V.T.; Tsimidou, M.Z. Looking through the qualities of a fluorimetric assay for the total phenol content estimation in virgin olive oil, olive fruit or leaf polar extract. Food Chem. 2009, 112, 246–252. [Google Scholar] [CrossRef]
  24. Tura, M.; Ansorena, D.; Astiasarán, I.; Mandrioli, M.; Toschi, T.G. Evaluation of Hemp Seed Oils Stability under Accelerated Storage Test. Antioxidants 2022, 11, 490. [Google Scholar] [CrossRef] [PubMed]
  25. AOCS Official Method Ch 5-91 Specific extinction of oils and fats, ultraviolet absorption (Ch 5-91). In Official Methods and Recommended Practices of the American Oil Chemists’ Society; AOCS Press: Champaign, IL, USA, 2009; pp. 5–91. ISBN 978-1-893997-74-5.
  26. Ramadan, M.F.; Mörsel, J.T. Oxidative stability of black cumin (Nigella sativa L.), coriander (Coriandrum sativum L.) and niger (Guizotia abyssinica Cass.) crude seed oils upon stripping. Eur. J. Lipid Sci. Technol. 2004, 106, 35–43. [Google Scholar] [CrossRef]
  27. Pooja, C.; Sukhneet, S. Chauhan Polar Compounds in Frying Oils: A Review. Appl. Ecol. Environ. Sci. 2021, 9, 21–29. [Google Scholar] [CrossRef]
  28. Shahidi, F.; Zhong, H.J. Methods for Measuring Lipid Oxidation. In Bailey’s Industrial Oil and Fat Products; Wiley: Hoboken, NJ, USA, 2020; pp. 1–27. [Google Scholar]
  29. Prabowo, S.; Muflihah; Rohman, A. Monitoring oxidative levels of frying oils using ftir spectroscopy and multivariate calibration. Int. J. Appl. Pharm. 2018, 10, 82–87. [Google Scholar] [CrossRef]
  30. Poiana, M.A.; Alexa, E.; Munteanu, M.F.; Gligor, R.; Moigradean, D.; Mateescu, C. Use of ATR-FTIR spectroscopy to detect the changes in extra virgin olive oil by adulteration with soybean oil and high temperature heat treatment. Open Chem. 2015, 13, 689–698. [Google Scholar] [CrossRef]
  31. Rexhepi, F.; Behrami, A.; Samaniego-SÃ, C.; Rebezov, M.; Shariati, M.A.; da Silva, A.B.; de Souza, C.K. Chemical changes of pumpkin seed oils and the impact on lipid stability during thermal treatment: Study by ftir-spectroscopy. J. Microbiol. Biotechnol. Food Sci. 2022, 11, e5839. [Google Scholar] [CrossRef]
  32. Gaca, A.; Kludská, E.; Hradecký, J.; Hajšlová, J.; Jeleń, H.H. Changes in volatile compound profiles in cold-pressed oils obtained from various seeds during accelerated storage. Molecules 2021, 26, 285. [Google Scholar] [CrossRef] [PubMed]
  33. Raschi, A.B.; Romano, E.; Benavente, A.M.; Altabef, A.B.; Tuttolomondo, M.E. Structural and vibrational analysis of thymoquinone. Spectrochim. Acta Part. A Mol. Biomol. Spectrosc. 2010, 77, 497–505. [Google Scholar] [CrossRef]
  34. Pagola, S.; Benavente, A.; Raschi, A.; Romano, E.; Molina, M.A.A.; Stephens, P.W. Crystal structure determination of thymoquinone by high-resolution x-ray powder diffraction. AAPS PharmSciTech 2004, 5, 28. [Google Scholar] [CrossRef] [PubMed]
  35. Wei, P.L.Y.; Xin, C.K.; Akowuah, G.A. Effect of different extraction solvents on the content of Thymoquinone content of Nigella sativa L. seeds using UV-Visible spectroscopy and evaluation of the free radical scavenging activity. Indian. J. Nat. Prod. Resour. 2023, 14, 22–27. [Google Scholar] [CrossRef]
  36. Rohman, A.; Wibowo, D.; Sudjadi; Lukitaningsih, E.; Rosman, A.S. Use of fourier transform infrared spectroscopy in combination with partial least square for authentication of black seed oil. Int. J. Food Prop. 2015, 18, 775–784. [Google Scholar] [CrossRef]
  37. Farhan, N.; Salih, N.; Salimon, J. Physiochemical properties of Saudi Nigella sativa L. (‘Black cumin’) seed oil. OCL Oilseeds Fats Crop. Lipids 2021, 28, 11. [Google Scholar] [CrossRef]
  38. Lutterodt, H.; Luther, M.; Slavin, M.; Yin, J.J.; Parry, J.; Gao, J.M.; Yu, L.L. Fatty acid profile, thymoquinone content, oxidative stability, and antioxidant properties of cold-pressed black cumin seed oils. LWT 2010, 43, 1409–1413. [Google Scholar] [CrossRef]
  39. Jakaria, M.; Cho, D.Y.; Haque, M.E.; Karthivashan, G.; Kim, I.S.; Ganesan, P.; Choi, D.K. Neuropharmacological potential and delivery prospects of thymoquinone for neurological disorders. Oxid. Med. Cell. Longev. 2018, 2018, 1209801. [Google Scholar] [CrossRef] [PubMed]
  40. Mikołajczak, N.; Tańska, M.; Ogrodowska, D. Phenolic compounds in plant oils: A review of composition, analytical methods, and effect on oxidative stability. Trends Food Sci. Technol. 2021, 113, 110–138. [Google Scholar] [CrossRef]
  41. Tesarova, H.; Svobodova, B.; Kokoska, L.; Marsik, P.; Pribylova, M.; Landa, P.; Vadlejch, J. Determination of oxygen radical absorbance capacity of black cumin (Nigella sativa) seed quinone compounds. Nat. Prod. Commun. 2011, 6, 213–216. [Google Scholar] [CrossRef] [PubMed]
  42. Khither, H.; Sobhi, W.; Khenchouche, A.; Mosbah, A.; Benboubetra, M. In-Vitro Antioxidant Effect of Thymoquinone. Annu. Res. Rev. Biol. 2018, 25, 1–9. [Google Scholar] [CrossRef]
  43. Burits, M.; Bucar, F. Antioxidant activity of Nigella sativa essential oil. Phyther. Res. 2000, 14, 323–328. [Google Scholar] [CrossRef]
  44. Sandhya, A.; Kannayiram, G. Pharmacological, bioactive screening of medicinal plant nigella sativa and the derived compound thymoquinone: An invitro study. Int. J. Res. Pharm. Sci. 2020, 11, 2458–2465. [Google Scholar] [CrossRef]
  45. Dawidowicz, A.L.; Olszowy, M. The importance of solvent type in estimating antioxidant properties of phenolic compounds by ABTS assay. Eur. Food Res. Technol. 2013, 236, 1099–1105. [Google Scholar] [CrossRef]
  46. Sielicka, M.; Malecka, M.; Purlan, M. Comparison of the antioxidant capacity of lipid-soluble compounds in selected cold-pressed oils using photochemiluminescence assay (PCL) and DPPH method. Eur. J. Lipid Sci. Technol. 2014, 116, 388–394. [Google Scholar] [CrossRef]
  47. Hossen, J.; Ali, M.A.; Reza, S. Theoretical investigations on the antioxidant potential of a non-phenolic compound thymoquinone: A DFT approach. J. Mol. Model. 2021, 27, 173. [Google Scholar] [CrossRef] [PubMed]
  48. Armutcu, F.; Akyol, S.; Akyol, O. The interaction of glutathione and thymoquinone and their antioxidant properties. Electron. J. Gen. Med. 2018, 15, 4–11. [Google Scholar] [CrossRef] [PubMed]
  49. Tarasevičienė, Ž.; Laukagalis, V.; Paulauskienė, A.; Baltušnikienė, A.; Meškinytė, E. Quality Changes of Cold-Pressed Black Cumin (Nigella sativa L.), Safflower (Carthamus tinctorius L.), and Milk Thistle (Silybum marianum L.) Seed Oils During Storage. Plants 2023, 12, 1351. [Google Scholar] [CrossRef] [PubMed]
  50. Fathi-Achachlouei, B.; Azadmard-Damirchi, S.; Zahedi, Y.; Shaddel, R. Microwave pretreatment as a promising strategy for increment of nutraceutical content and extraction yield of oil from milk thistle seed. Ind. Crop. Prod. 2019, 128, 527–533. [Google Scholar] [CrossRef]
  51. Poulli, K.I.; Mousdis, G.A.; Georgiou, C.A. Rapid synchronous fluorescence method for virgin olive oil adulteration assessment. Food Chem. 2007, 105, 369–375. [Google Scholar] [CrossRef]
  52. Rodríguez-Delgado, M.A.; Malovaná, S.; Pérez, J.P.; Borges, T.; García Montelongo, F.J. Separation of phenolic compounds by high-performance liquid chromatography with absorbance and fluorimetric detection. J. Chromatogr. A 2001, 912, 249–257. [Google Scholar] [CrossRef]
  53. Sikorska, E.; Wójcicki, K.; Kozak, W.; Gliszczynska-Swigło, A.; Khmelinskii, I.; Górecki, T.; Caponio, F.; Paradiso, V.M.; Summo, C.; Pasqualone, A. Front-face fluorescence spectroscopy and chemometrics for quality control of cold-pressed rapeseed oil during storage. Foods 2019, 8, 665. [Google Scholar] [CrossRef] [PubMed]
  54. Aydeniz, B.; Yilmaz, E. Performance of different natural antioxidant compounds in frying oil. Food Technol. Biotechnol. 2016, 54, 21–30. [Google Scholar] [CrossRef] [PubMed]
  55. Daskalaki, D.; Kefi, G.; Kotsiou, K.; Tasioula-Margari, M. Evaluation of phenolic compounds degradation in virgin olive oil during storage and heating. J. Food Nutr. Res. 2009, 48, 31–41. [Google Scholar]
Figure 1. The molecular structure of thymoquinone (TQ).
Applsci 15 00377 g001
Figure 2. Infrared spectrum of “open” BCSO samples at room temperature obtained at 0, 3, 6, 10, 14, 18, 21, and 24 days of heating with the main peaks’ assignment; inset: changes in the absorption intensity at 1659 cm−1.
Applsci 15 00377 g002
Figure 3. The spectral changes in 3009/2854 peak ratio (circle—right scale) and at 987 cm−1 (rectangle—left scale) during heating of BCSO open and closed samples. Error bars show the variations in three determinations in terms of standard deviation.
Applsci 15 00377 g003
Figure 4. Change in thymoquinone (TQ) content in BCSO: (a) “open” and (b) “closed” samples expressed as FTIR intensity band at 1659 cm−1 (black line—right scale) and quantity amount of TQ calculated spectrophotometrically and from HPLC assay (bars—left scale). Error bars show the variations in three determinations in terms of standard deviation.
Applsci 15 00377 g004
Figure 5. (a) The calculated IC50 for BCSO samples; (b) the total synchronous fluorescence spectra (SFS) of diluted BCSO (1%, v/v, in n-hexane); and (c) the change in fluorescence intensity at 272 nm (Δλ = 10 nm) for both BSCO open and closed samples.
Applsci 15 00377 g005
Table 1. The specific absorbance coefficient K232 and K268 for covered (“closed”) and uncovered (“open”) BCSO samples during storage at 60 °C.
Day of StorageOpen SamplesClosed Samples
K232K268K232K268
06.02 ± 0.58 a1.34 ± 0.18 ab6.02 ± 0.58 a1.34 ± 0.18 a
35.99 ± 0.33 a1.43 ± 0.11 a6.56 ± 0.51 a1.38 ± 0.53 a
65.76 ± 0.11 a1.31 ± 0.05 abc6.02 ± 0.43 a1.28 ± 0.47 a
105.83 ± 0.59 a1.11 ± 0.15 bcd6.33 ± 0.42 a1.61 ± 0.17 a
145.91 ± 0.09 a1.12 ± 0.03 bcd6.78 ± 0.32 ab1.59 ± 0.17 a
187.17 ± 1.05 ab1.02 ± 0.19 d6.78 ± 0.39 ab1.66 ± 0.15 a
218.54 ± 0.72 b1.04 ± 0.08 cd7.01 ± 1.01 ab1.39 ± 0.25 a
248.57 ± 0.62 b1.09 ± 0.04 d7.46 ± 0.52 b1.25 ± 0.30 a
The data in the table are presented as the means ± standard deviation (SD). a–d Means within columns with different superscripts are significantly different (p < 0.05).
Table 2. The calculated IC50 for BCSO, and methanolic extract of BCSO, TQ, and control samples.
SampleIC50 [µg/mL]Reference
This StudyLiterature
Trolox5.60 ± 0.223.70 ± 0.08[41]
Tocopherol2.21 ± 0.12
TQ72.31 ± 0.26125.65 ± 0.76[42]
121.56 ± 0.66[44]
211.0 ± 0.0[43]
IC50 [mg/mL]
BCSO4.13 ± 0.362.30 ± 0.02[5]
0.46 ± 0.00[43]
4.02 ± 0.04[18]
Methanolic extract of BCSO5.07 ± 0.3811.26 ± 0.93 (seeds)[44]
The data in the table are presented as the means ± standard deviation (SD).
Disclaimer/Publisher’s Note: The statements, opinions and data contained in all publications are solely those of the individual author(s) and contributor(s) and not of MDPI and/or the editor(s). MDPI and/or the editor(s) disclaim responsibility for any injury to people or property resulting from any ideas, methods, instructions or products referred to in the content.

