Article

Design of Safety Evaluation and Risk Traceability System for Agricultural Product Quality

1
College of Quality and Safety Engineering, China Jiliang University, Hangzhou 310018, China
2
Science and Technology Research Center of China Customs, Beijing 100026, China
*
Author to whom correspondence should be addressed.
Appl. Sci. 2024, 14(7), 2980; https://doi.org/10.3390/app14072980
Submission received: 29 February 2024 / Revised: 24 March 2024 / Accepted: 29 March 2024 / Published: 2 April 2024
(This article belongs to the Section Agricultural Science and Technology)

Abstract

:
The quality and safety of agricultural products involve a variety of risk factors, a large amount of risk information data, and multiple circulation and disposal processes, making it difficult to accurately trace the source of risks. To achieve precise traceability of agricultural product quality and safety, the monitoring and supervision level of agricultural product traceability systems needs to be improved. In this paper, the agricultural product quality- and safety-related detection data are taken as the research object, the agricultural product supply chain and business process are sorted out, the agricultural product risk factors under the influence of heavy metals are analyzed, and the agricultural product quality and safety risk evaluation model is established. The agricultural product risk traceability system was designed based on the six-layer architecture of the equipment layer, data layer, service layer, application layer, display layer, and user layer. Combined with the agricultural product quality and safety risk evaluation model, the system data were stored and modified by using the MySQL relational database, and the agricultural product risk traceability system was developed, which realized the accurate traceability of the risk link of the quality and safety of agricultural products. The research results of this paper provide an effective information means for the quality and safety supervision of agricultural products, and provide a technical reference for the development of a traceability system of risk factors related to agricultural products, which has good practical significance.

1. Introduction

In recent years, the frequent occurrence of food safety problems in China has seriously jeopardized people’s lives and health [1], and has also brought a huge economic burden [2]. Governments are highly concerned and have introduced a series of laws and regulations to ensure the quality and safety of agricultural products [3,4]. Through the traceability of agricultural products, it realizes the tracking and tracing of product information in each link of the supply chain of agricultural products, strengthens the supervision and management of each link of agricultural products, and is of great significance for safeguarding the safety of people’s lives and properties and maintaining the harmonious and stable development of the society. According to the relevant data statistics in the 2019–2021 China Food Safety Annual Report (as shown in Figure 1), although the number of food poisoning cases has shown a downward trend in the past three years, it still maintains a relatively high level. At present, the situation of food safety is still relatively severe [5], the number of patients and deaths caused by food poisoning remains high, and traditional traceability methods for agricultural products can no longer meet the demands of today’s society for the quality and safety of agricultural products [6,7]. Therefore, accelerating the construction of a traceability system for agricultural product quality and safety is of positive significance for improving the level of social public safety.
In recent years, scholars at home and abroad have explored the application of information technology in agricultural quality and safety traceability systems from different angles. The research on traceability systems by scholars in China started in the early 21st century and gradually developed into a relatively mature traceability system [8]. The design of traceability systems has also gradually shifted from single information data traceability to a system with evaluation functionality. Wang Jihua et al. [9] elaborated on the challenges faced by Internet of Things technology in the traceability of the entire agricultural product industry chain. By reviewing the application of Internet of Things technology in the direction of agricultural product quality and safety monitoring, their value was affirmed, and the development significance of agricultural product quality and safety traceability systems was also demonstrated; Hu Jinyou et al. [10] faced the issue of identifying the effectiveness of information in the development of traceability systems. By establishing a unified language model and incorporating it into a system design, they achieved the identification and classification of dynamic participant groups in the vegetable supply chain traceability system that they had designed and developed. This provided a reference for establishing the model and incorporating it into the system’s functional design; Zhou Zhongwei et al. [11] aimed to apply Internet of Things technology to supply chain management to improve the management level. By analyzing and dismantling the supply chain process, they designed and developed an agricultural supply chain management system based on RFID tag technology. They proposed a traceability model for visualizing the quality of agricultural products, providing a reference for achieving full traceability; Song Yongjie et al. [12] designed a traceability system framework based on multi-agent and Internet of Things technology to better control the quality of agricultural products. They combined Agent technology with the agricultural product quality and safety traceability system, and the designed chain system improved the pertinence of controlling agricultural product quality.
In response to mad cow disease, the European Union gradually established a traceability system starting in 1997, which was the earliest manifestation of a food traceability system [13]. Sven et al. [14] constructed a traceability system for agricultural chemicals in food based on a monomer architecture to optimize the filtering ability of data categories during automatic storage. RFID tags were used as storage systems to achieve the function of recording and transmitting data in the traceability system. However, due to the limitation that the monomer architecture needs to be deployed as a unified solution with the storage capacity of RFID tags, the designed traceability system is difficult to support high-capacity data transmission; Ganjar et al. [15] aimed to seek the application of RFID technology in the traceability system of perishable food. By analyzing the supply chain of perishable food and combining it with IoT sensors, a traceability system was constructed to effectively trace the source of perishable food. However, the design of the system was limited by the capacity of electronic labels and sensor storage data.
Microservice architecture is a distributed system architecture and has the following characteristics: the application system uses microservice architecture according to the business function, technical implementation, etc., and is split into the smallest components; these components are independent of each other but cooperate between themselves to complete a task, where each component or process is a microservice. Most of the traditional agricultural quality and safety traceability systems are built using monolithic architecture or SOA architecture, i.e., service-oriented architecture. Monolithic architectures have the advantage of being easy to develop, test, and deploy, but deploying the entire system program as a unified solution prevents the system’s constituent modules from operating independently [16,17].
When dealing with larger system programs, monolithic architectures are difficult to maintain, and updates to any of the system’s constituent modules necessitate retesting and redeploying the entire system program. In addition, monolithic architectures create technology lock-in, where program development of all components must follow the same framework and technology system [18]. The system components under SOA architecture are independent and autonomous, but compared to SOA architecture, microservices architecture pays more attention to the characteristics of high availability, scalability, load balancing, and so on. System programs under microservice architecture run in a highly available distributed environment have better stability and reliability, while the fine-grained nature of microservice architecture improves development efficiency [19]. Nowadays, the traceability system of agricultural quality and safety has many kinds of projects, many user levels, and huge and complex data volume; however, the operation mechanism needs further in-depth study, and the architectural design and management rules also need to be further improved.
Heavy metals exceeding the standard is an important factor affecting the quality and safety of agricultural products. In order to improve the quality and safety supervision level of agricultural products and improve the risk traceability efficiency of agricultural products, this paper has designed a quality and safety risk evaluation system for agricultural products, constructed a quality and safety risk evaluation model for agricultural products, and realized a quantitative evaluation of the quality and safety of agricultural products. Based on the six-layer system architecture division, the agricultural product risk traceability system for regulatory authorities, enterprises, and consumers was designed by using information technology, database technology, and a front-end framework. The designed agricultural product quality and safety evaluation model was integrated with the risk traceability system. According to the risk evaluation results, the storage and traceability of agricultural-product-related monitoring data were completed, and the precise direction of the factors affecting the quality and safety of agricultural products was realized.

2. Design of Agricultural Product Quality and Safety Evaluation System

2.1. Screening of Evaluation Indicators

In terms of heavy metal enrichment, microorganisms in the soil cannot fully decompose heavy metal pollutants, resulting in the accumulation of a large number of heavy metal pollutants due to the failure to decompose. After the absorption and enrichment of heavy metals by crops, various biochemical processes are disordered, which not only affects the growth of crops and the safety of agricultural products but also causes various diseases after the accumulation of heavy metals in the human body. Although the quality and safety of agricultural products involve a wide range, the problem of heavy metal pollution is particularly prominent in the quality and safety of agricultural products. There are both natural and social indicators, both qualitative and quantitative indicators in the analysis of heavy metal pollution sources. When constructing the index system, the design of each index should reflect a certain level.
In general, for the risk of exceeding the standard of heavy metals, by analyzing the content level and spatial distribution characteristics of eight kinds of heavy metal in agricultural products, the factor analysis method was used to analyze the monitoring-related indicators, including total content of heavy metals in soil, soil pH value, soil organic matter content, soil redox potential, planted crop varieties, nutritional status, cultivation measures, heavy metal content in pesticides, heavy metal content in fertilizers, heavy metal content in atmosphere, and heavy metal content in irrigation water. Three principal components were extracted from the total and determined as being first-class indicators: the available content of heavy metals in soil, the absorption coefficient of heavy metals in crops, and other sources of heavy metals. After a literature review and data analysis, the second-class indicators under each first-class indicator were further defined. The selection of specific agricultural product quality and safety risk assessment indicators is shown in Table 1.

2.2. Design of Evaluation System

By inviting experts from agricultural product industry research institutes, relevant universities, and industry associations to evaluate the rationality of the selection of indicators, the importance of each indicator was compared according to the 1–9 scale method, and the relative importance of each indicator was assigned. The final weight of each indicator was determined by weighted addition and equalization according to the assignment of experts. When constructing the evaluation index system, we followed the principle of completeness as much as possible. The scoring methods and results of secondary indicators in the specific agricultural product quality and safety risk evaluation model are shown in Table 2.

2.3. Construction of Evaluation Model

In the process of constructing the evaluation model, the standard deviation statistical method was used to conduct a statistical analysis of the obtained agricultural product sample testing data. The sample information and statistical results obtained are shown in Table 3. Using the CRITIC method [20] to solve the correlation between the average value and standard deviation of the obtained sample data, the coefficients of the fitting indicators were further optimized through the comprehensive expert survey method. Due to the close relationship between indicators of the designed risk assessment system within the same main category, while the relationship between indicators of different main categories is not closely related, the commonly used addition and multiplication mixed method is used to construct the model [21].
The sources of heavy metals in agricultural products are mainly their absorption of heavy metals in soil and in the environment or inputs except soil. Through multi-factor nonlinear response analysis, the response model of quality and safety risk assessment can be simplified as the following Equation (1) after the coefficient is eliminated:
E M = A c s × A c + O s
In Equation (1): E M : score value of agricultural product quality and safety risk assessment; A c s : available content of heavy metals in soil; Ac: absorption coefficient of heavy metals in crops; Os: heavy metal content from other sources.
In this paper, the method of assigning points is used to optimize the fitting of the model. The total content of heavy metals in soil was an important factor affecting the existence of heavy metals in soil, while the available state coefficient of heavy metals in soil was a state factor affecting the existence of heavy metals in soil, mainly including soil pH value, soil organic matter content, and soil redox potential. After the principal component linear analysis equation and Bayesian classification, the weight coefficients of the total content of soil heavy metals, soil pH, soil organic matter, and soil redox potential were obtained by the expert scoring method. After the standardization coefficient, Equation (2) of the risk assessment model was obtained as follows:
A c s = a × ( 5 b + 3 c + 2 d )
In Equation (2): a : total content of heavy metals in soil; b : risk level of soil pH; c : risk level of soil organic matter; and d : risk level of soil redox potential. When the content of heavy metals in soil exceeds the standard, the effective content score of heavy metals in soil will exceed the warning score of 60 points under the condition that the influencing factors of the effective coefficient of heavy metals in soil have great effects.
The absorption coefficient of heavy metals by crops is closely related to crop varieties, cultivation, and irrigation methods. After the same scoring and regression analysis, the weight coefficients of crop varieties, crop nutrition, and crop cultivation measures were obtained by the expert scoring method. The final risk assessment model Equation (3) is as follows:
A c = 0.6 e + 0.2 f + 0.2 g
In Equation (3): e : risk level of crop varieties; f : risk level of crop nutritional status; g : risk level of crop cultivation measures. According to Equation (3) and the scoring analysis, the maximum absorption coefficient score is four and the minimum is one, which means that under normal circumstances, only when there is a risk warning of heavy metals in the external environment can the heavy metals in agricultural products exceed the standard. If the absorption coefficient of crops increases due to their own varieties, nutritional status, or improper farming, the heavy metals in the environment may also exceed the standard.
Through a literature review and sample detection, four secondary indicators of heavy metals from other sources were set: heavy metal content in pesticides, heavy metal content in fertilizers, heavy metal content in the atmosphere, and heavy metal content in irrigation water. The weight coefficients of each secondary indicator were obtained after scoring by experts. The risk assessment model Equation (4) obtained after regression analysis is as follows:
O s = 3 h + 4 i + j + 2 k
In Equation (4): h : content of heavy metals in pesticides; i : heavy metal content in fertilizer; j : heavy metal content in the atmosphere; k : heavy metal content in irrigation water. If heavy metal pollution also exists in other external environments other than soil, the risk of heavy metal residues in agricultural products will be increased, and the risk value can be increased by up to 10 points.
Finally, Equation (5) of the agricultural product quality and safety risk assessment model is obtained as follows:
E M = a × 5 b + 3 c + 2 d × 0.6 e + 0.2 f + 0.2 g + ( 3 h + 4 i + j + 2 k )
The risk early warning value of the agricultural product quality and safety risk assessment score (EM) is 60 points. When the EM value is early warning, that is, the risk early warning score exceeds 60 points, it can be considered that under the influence of heavy metals, the quality and safety risk of agricultural products is high, which should be traced and disposed of.

3. Construction of Risk Traceability System

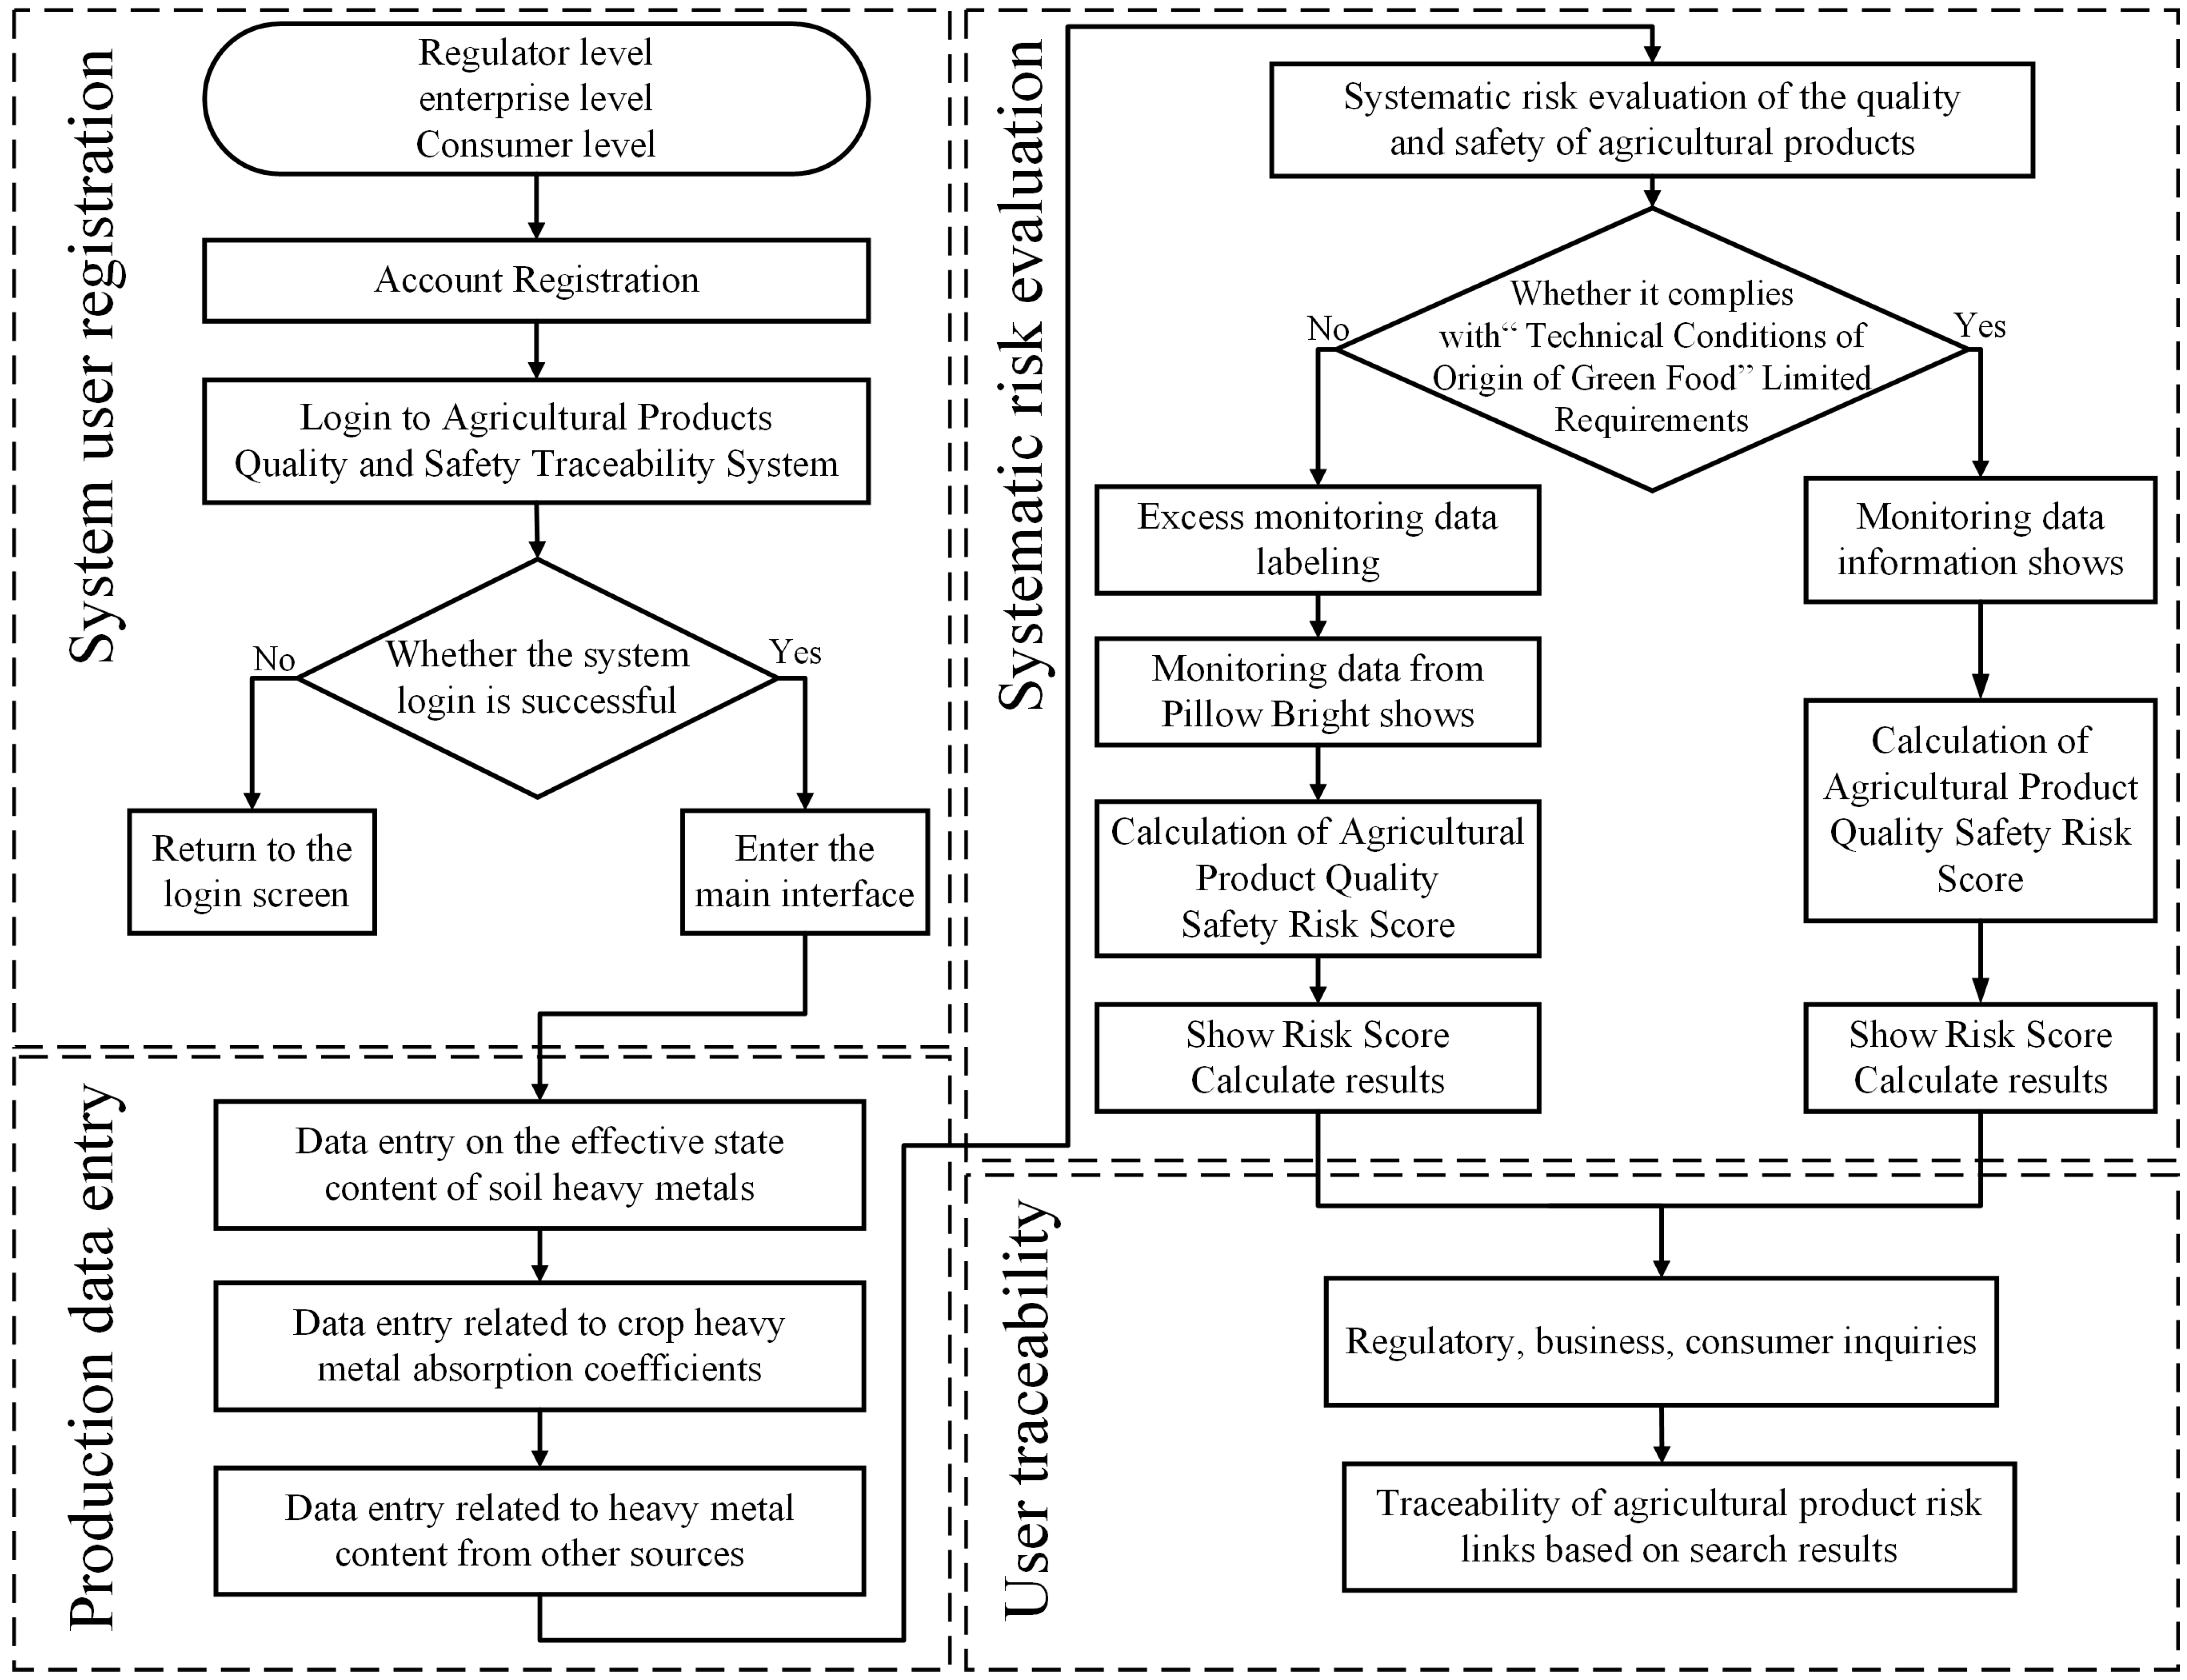
3.1. Systematic Traceability Methods

The basis of agricultural product quality and safety traceability is the establishment of a traceability system and a traceability business process designed in accordance with the form of distribution of agricultural products. A perfect traceability system and scientifically designed traceability methods can support the better establishment of an agricultural product quality and safety traceability system so as to realize the needs of meeting the safety supervision of agricultural products.
Traceability system refers to relying on public service platforms, from the collection of commodities from production, trade, and circulation to the consumer of the whole process of the fragmented quality information. The use of big data analysis and cloud computing means, the formation of standards and quality as the core content of the whole chain, and a closed-loop large quality management mechanism will achieve the true transmission of commodity value [22]. There are two types of traceability processes, forward and reverse traceability; that is, the distinction is made according to the order in which the distribution of agricultural products from the upstream link to the downstream link is traced.
Traceability of the quality and safety of agricultural products, on the other hand, is a process of reverse traceability, that is, from the consumer to the planting base [23]. Agricultural products from the planting base to the hands of consumers need to go through a number of flow links such as processing, transportation, etc. [24,25], and at the same time will produce different data information.
The business flowchart of agricultural product quality and safety traceability is shown in Figure 2. The current distribution model of agricultural products consists mainly of producers, processors, wholesalers, distributors, and consumers [26]. Through the traceability system, users can query the quality and safety monitoring data of agricultural products stored in the system database, as well as the quality and safety score values of agricultural products evaluated by the system. By using classical logic to quantitatively analyze the quality and safety status of agricultural products, further improvement measures can be proposed through the quantitative score analysis. The main requirements of the traceability system based on this are as follows: the entry and storage of the actual testing data of agricultural products, the querying of the data information of agricultural products by the users, the evaluation of the risk level of the input data by the system, and the labeling of the risky data for early warning, and so on. When the system is running, the user first logs in through the interface and then calls the AJAX engine to launch HTTP requests containing data parameters to the server, and the server receives the requests and then obtains the produce traceability data through SQL statements. Then, the data will be returned to the client after serialization and deserialization through JSON, and finally parsed into an interface and displayed to the user by string separation tools, so as to realize the forward tracking and reverse traceability of the agricultural product quality and safety traceability system.

3.2. Traceability System Design

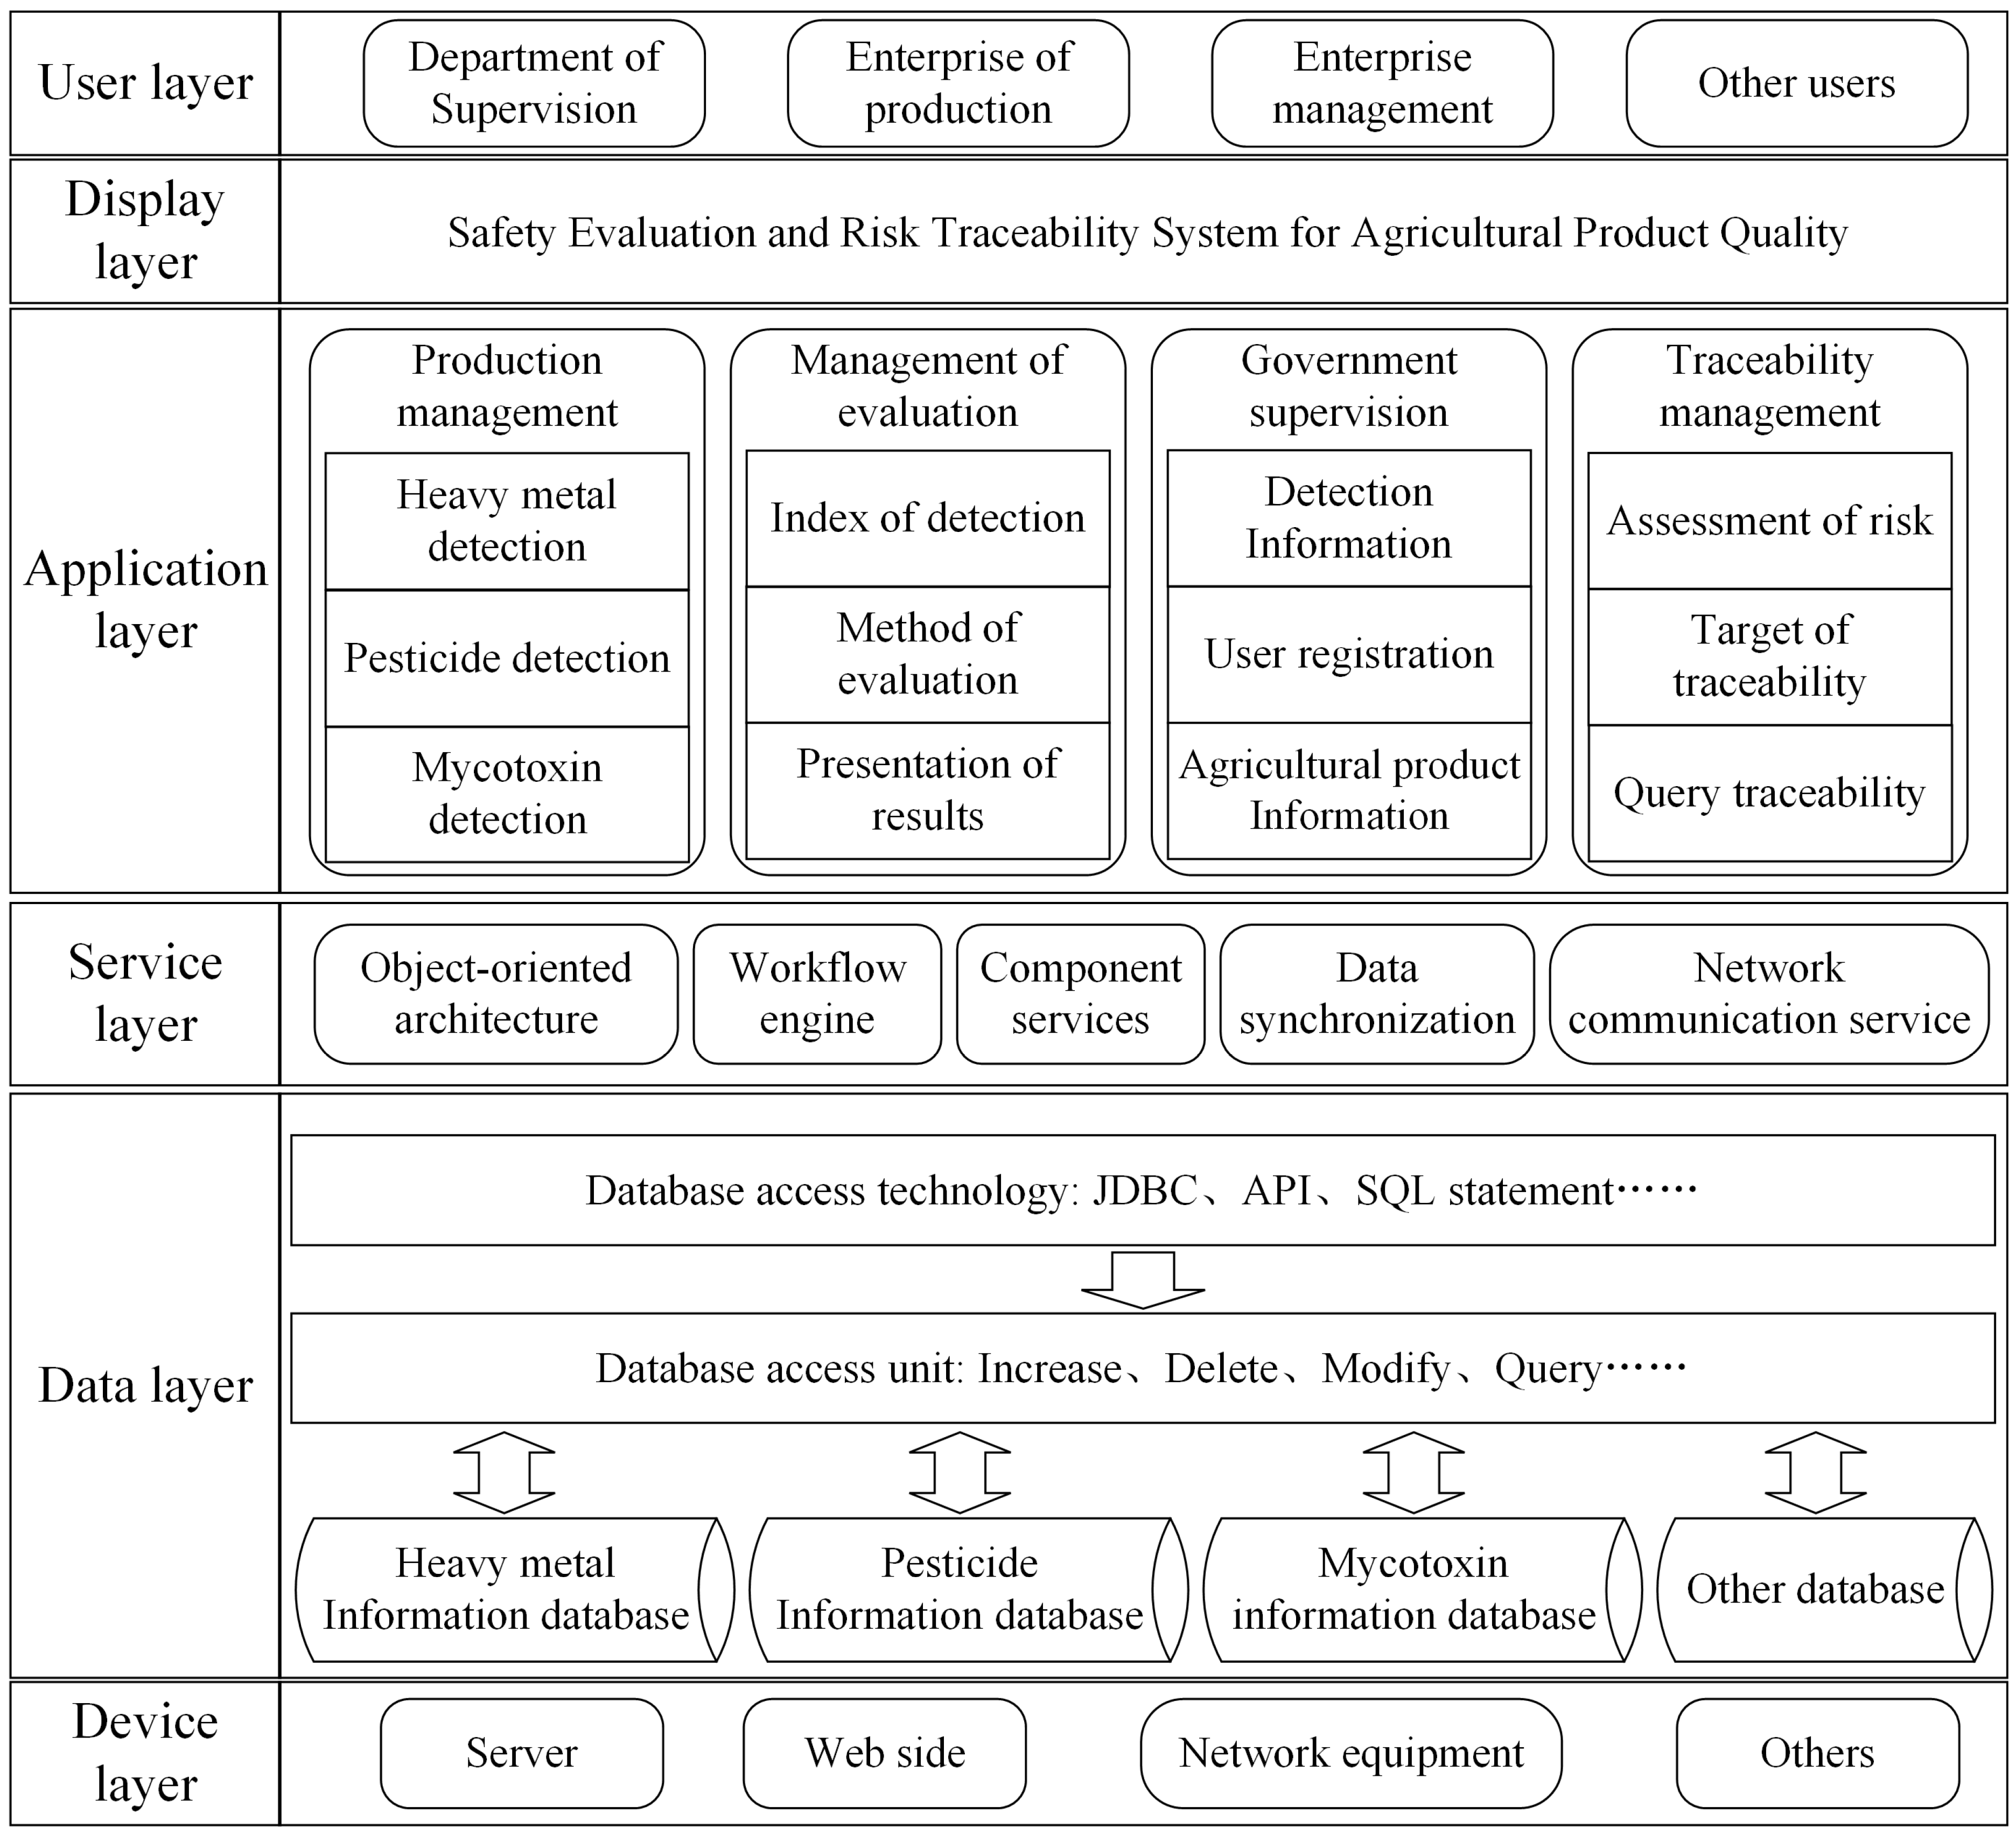
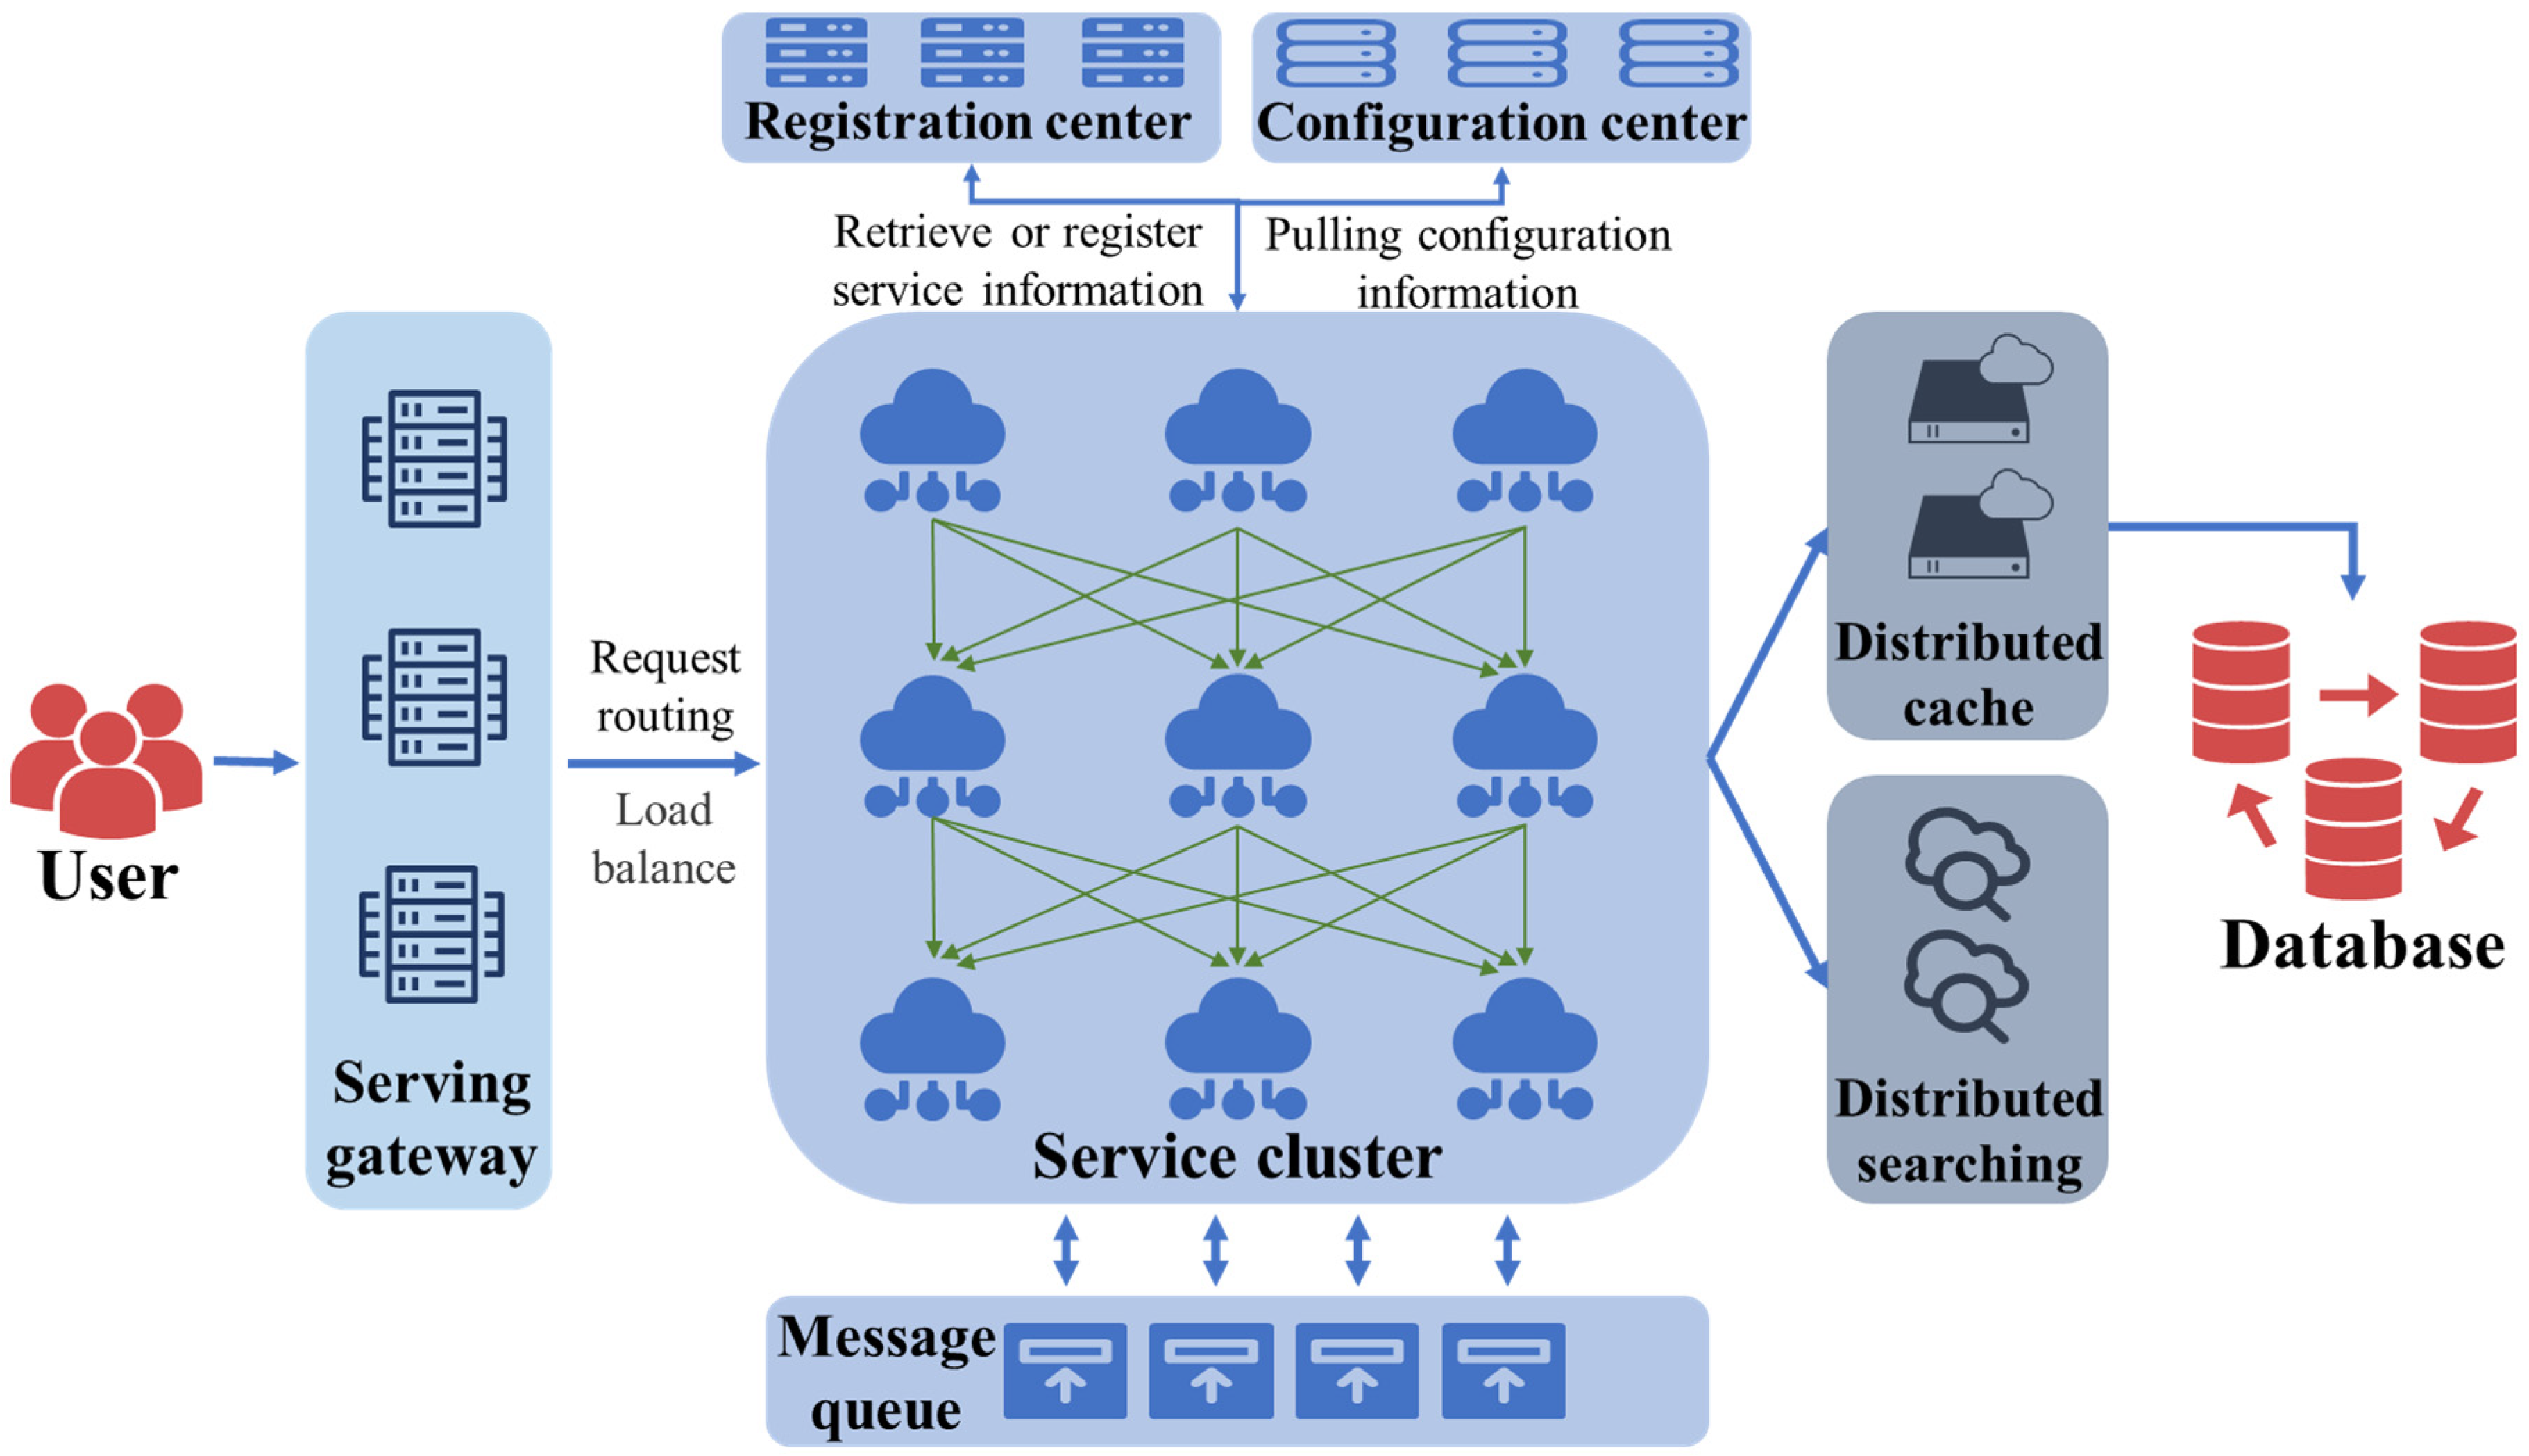
3.2.1. System Architecture Design

The system architecture uses a B/S architecture modeled on a six-tier development framework. With the rise and development of network information technology, B/S architecture is also an improvement of C/S architecture. Compared with the traditional three-layer architecture divided into the presentation layer, business logic layer, and data access layer, the six-layer architecture for system design can better realize the design idea of “high cohesion, low coupling”, so that the system has better compatibility and stability. At the same time, compared with the traditional three-tier system architecture, the six-tier system architecture has many advantages, mainly reflected in the maintainability, scalability, reusability, and architecture clarity of the agricultural product risk traceability system. The six-layer system architecture improves the applicability and maintainability of the design system. Each layer module can be deployed independently, which not only reduces the development cycle but also reduces the hardware requirements of the deployment server. The system architecture is divided into a device layer, data layer, service layer, application layer, display layer, and user layer. This makes the structure and function of the system clearer, and better adapted to the characteristics of many monitoring access devices, with a large data flow and wide range of service objects, and so on, and it better meets the actual use scenarios. The specific system architecture is shown in Figure 3.
Compared to C/S architecture, B/S architecture is more lightweight and easier to deploy on the server. B/S architecture is technically pure HTML technology, which makes it better at integration, greatly reducing the development cycle.
(1)
The equipment layer is the foundation for system construction and operation. The collection of monitoring data for agricultural product risk tracing and system maintenance involves various service support devices. Dividing the equipment layer separately helps to clarify equipment interfaces and improve system development efficiency. The device layer is centered around the server, including network devices and other devices. The terminal for collecting agricultural-product-related data information is connected to the system based on actual sensors to achieve data collection. The main data collection sensors involved in the system are gas sensors, pH sensors, etc.
(2)
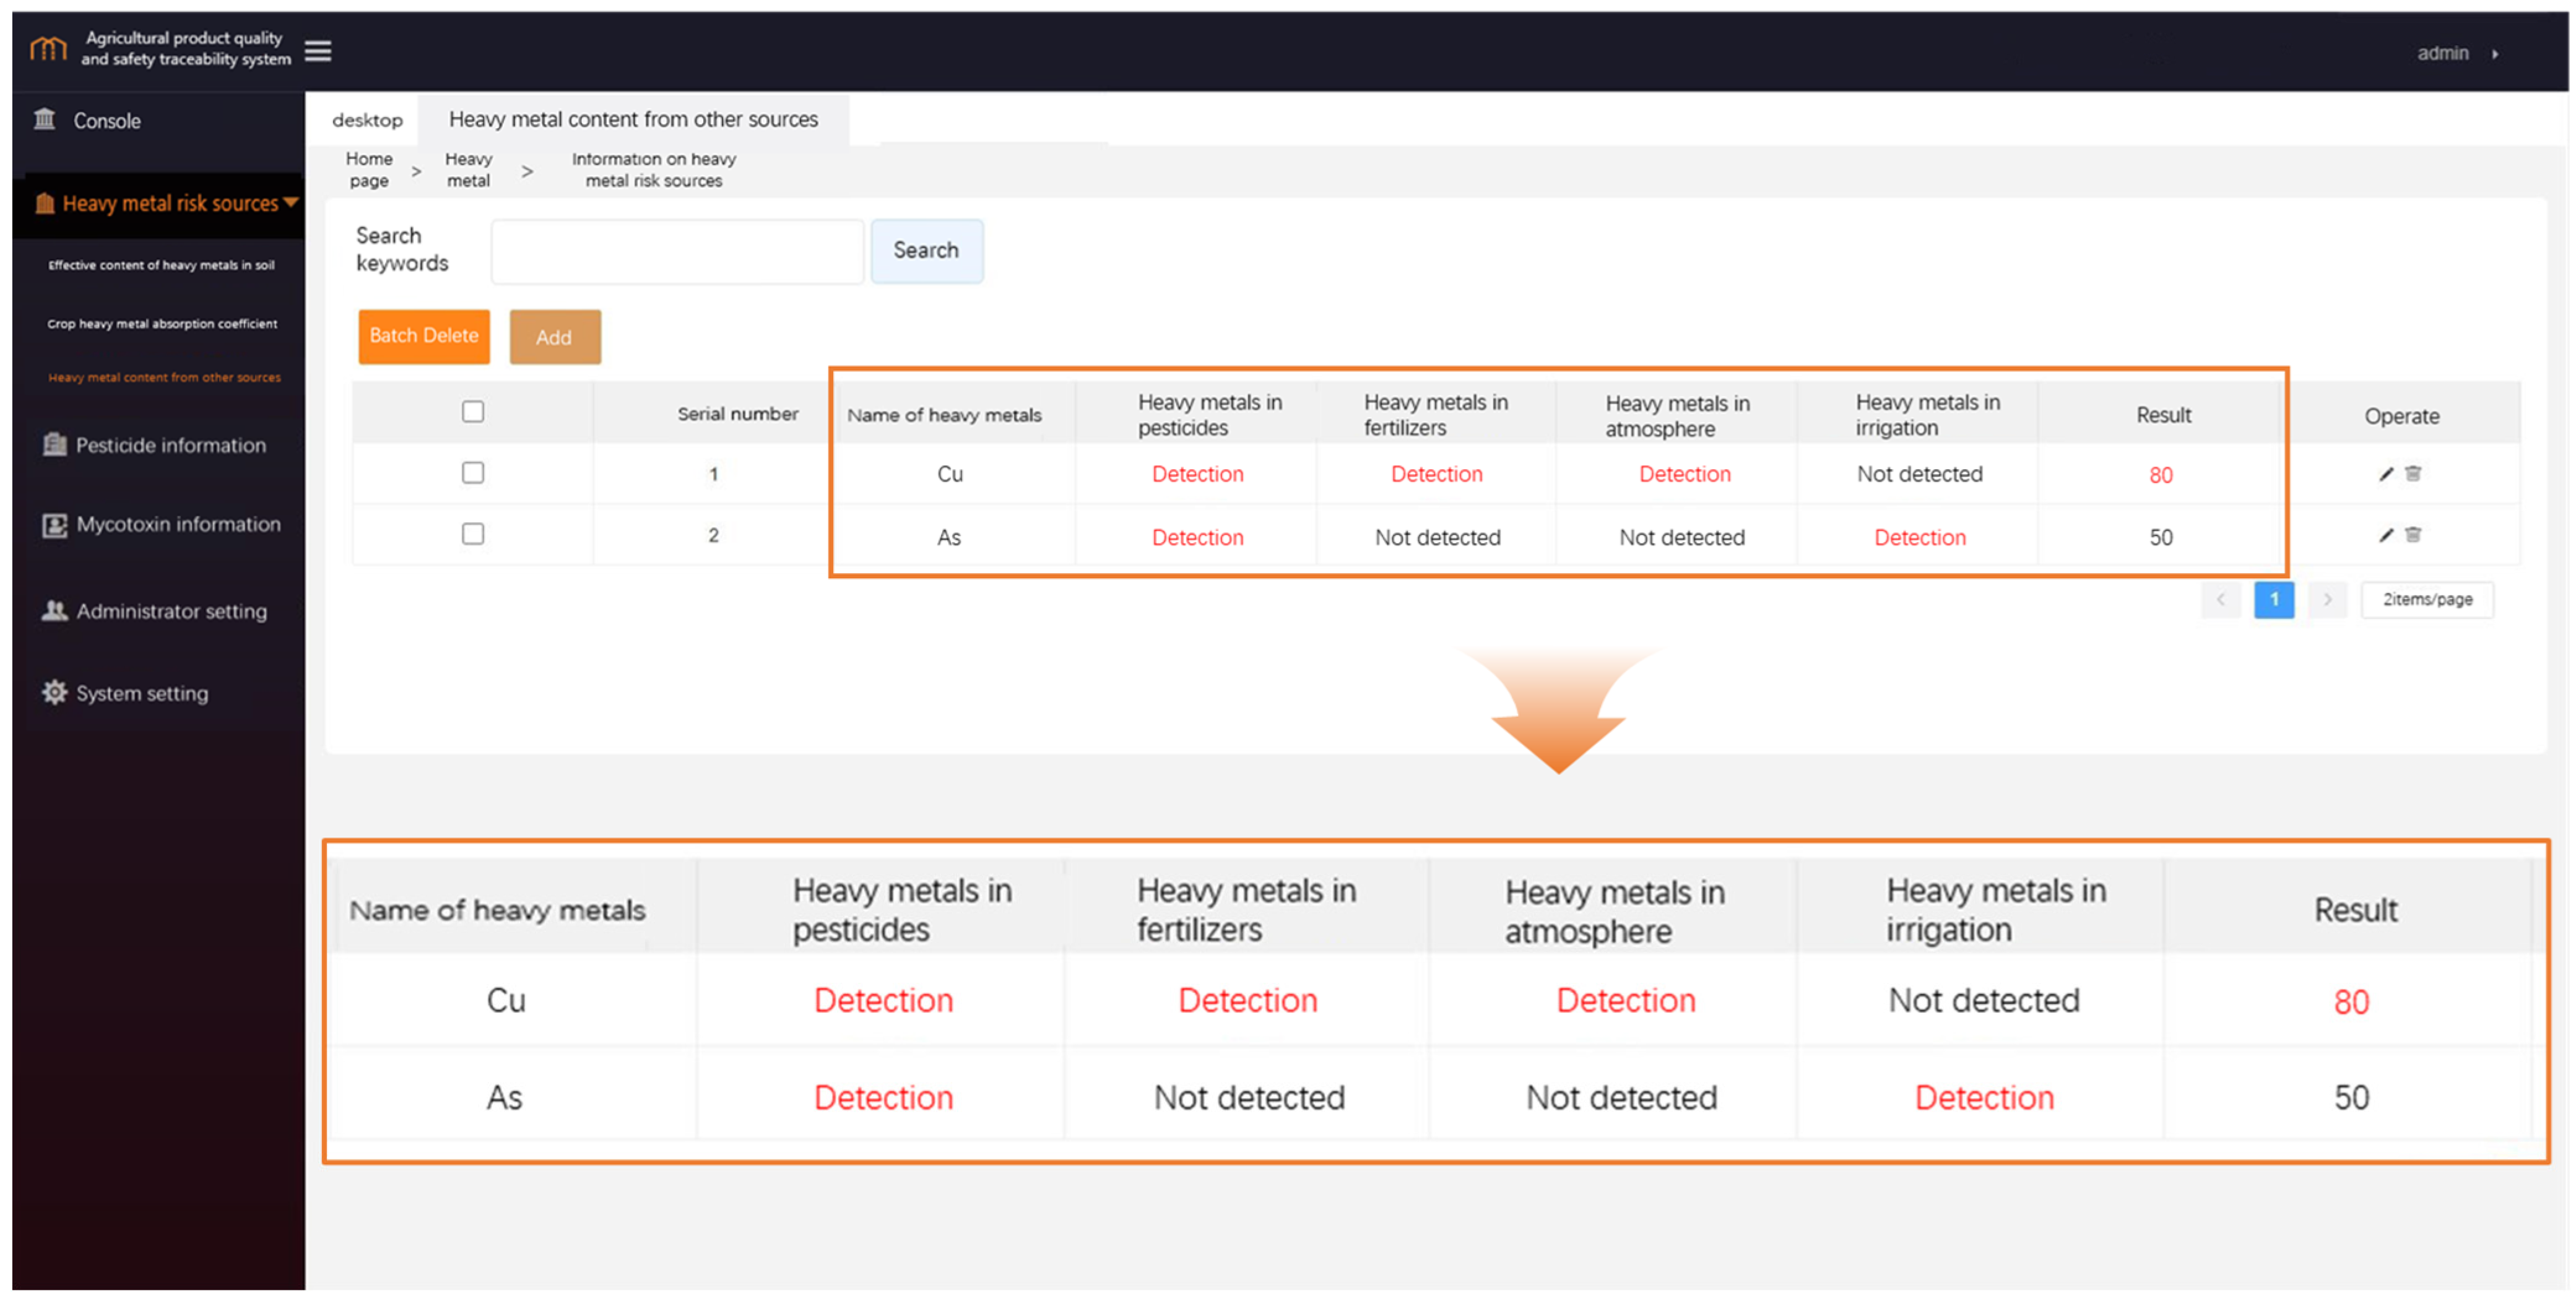
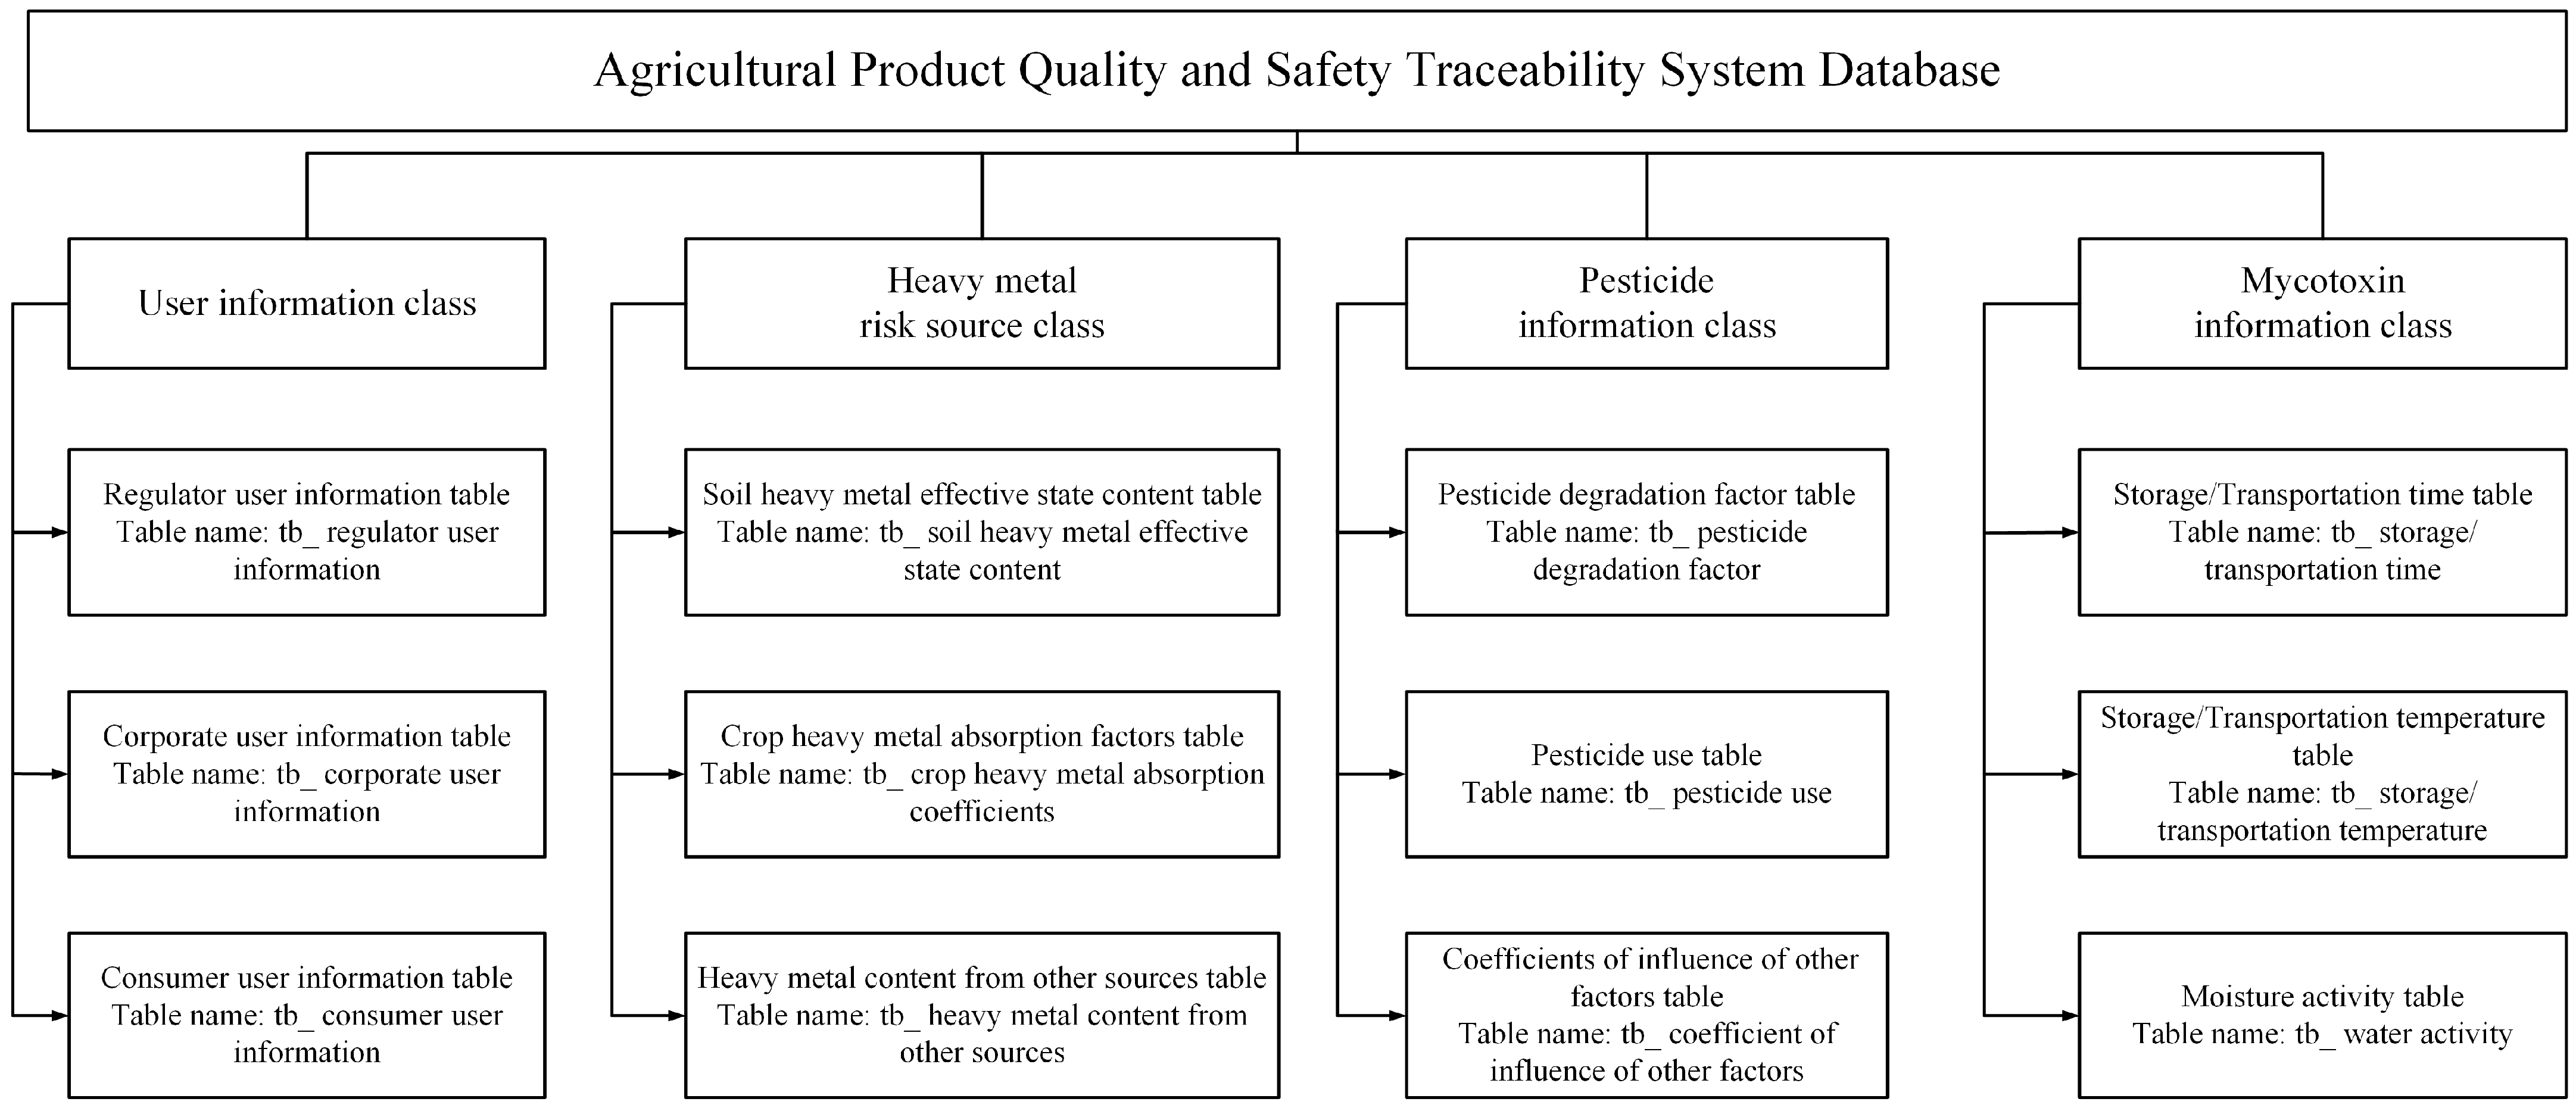
The data layer is the actual inspection data related to the quality and safety of agricultural products. A large number of circulation data will be generated during the circulation of agricultural products. Data processing is also the key to the design and development of an agricultural product risk traceability system. Dividing the data layer can refine the data processing function design, improve the efficiency of data storage and access, and then improve the speed and accuracy of traceability. The data layer roughly divides the processing data into four directions: heavy-metal-related detection data, pesticide-related monitoring data, mycotoxin-related detection data, and other data. The relevant regulatory authorities provide support for the monitoring data of agricultural product quality and safety required for the system’s research and judgment; that is, they provide the detection data required by the data layer.
(3)
The service layer is the basic service support layer of the traceability system, which is used to connect the database and the application layer. The business functions and data transmission required by the risk traceability system involve intermediate links such as data synchronization and component implementation. Separate design and development can improve the understanding of functions during development and the reusability of functional components in the service layer. The service layer of the agricultural product risk traceability system is supported by the data provided by the data layer. It provides data synchronization to the application layer, and the back-end framework provides data management, quality and safety risk assessment calculation, user registration, and other business functions to the front end.
(4)
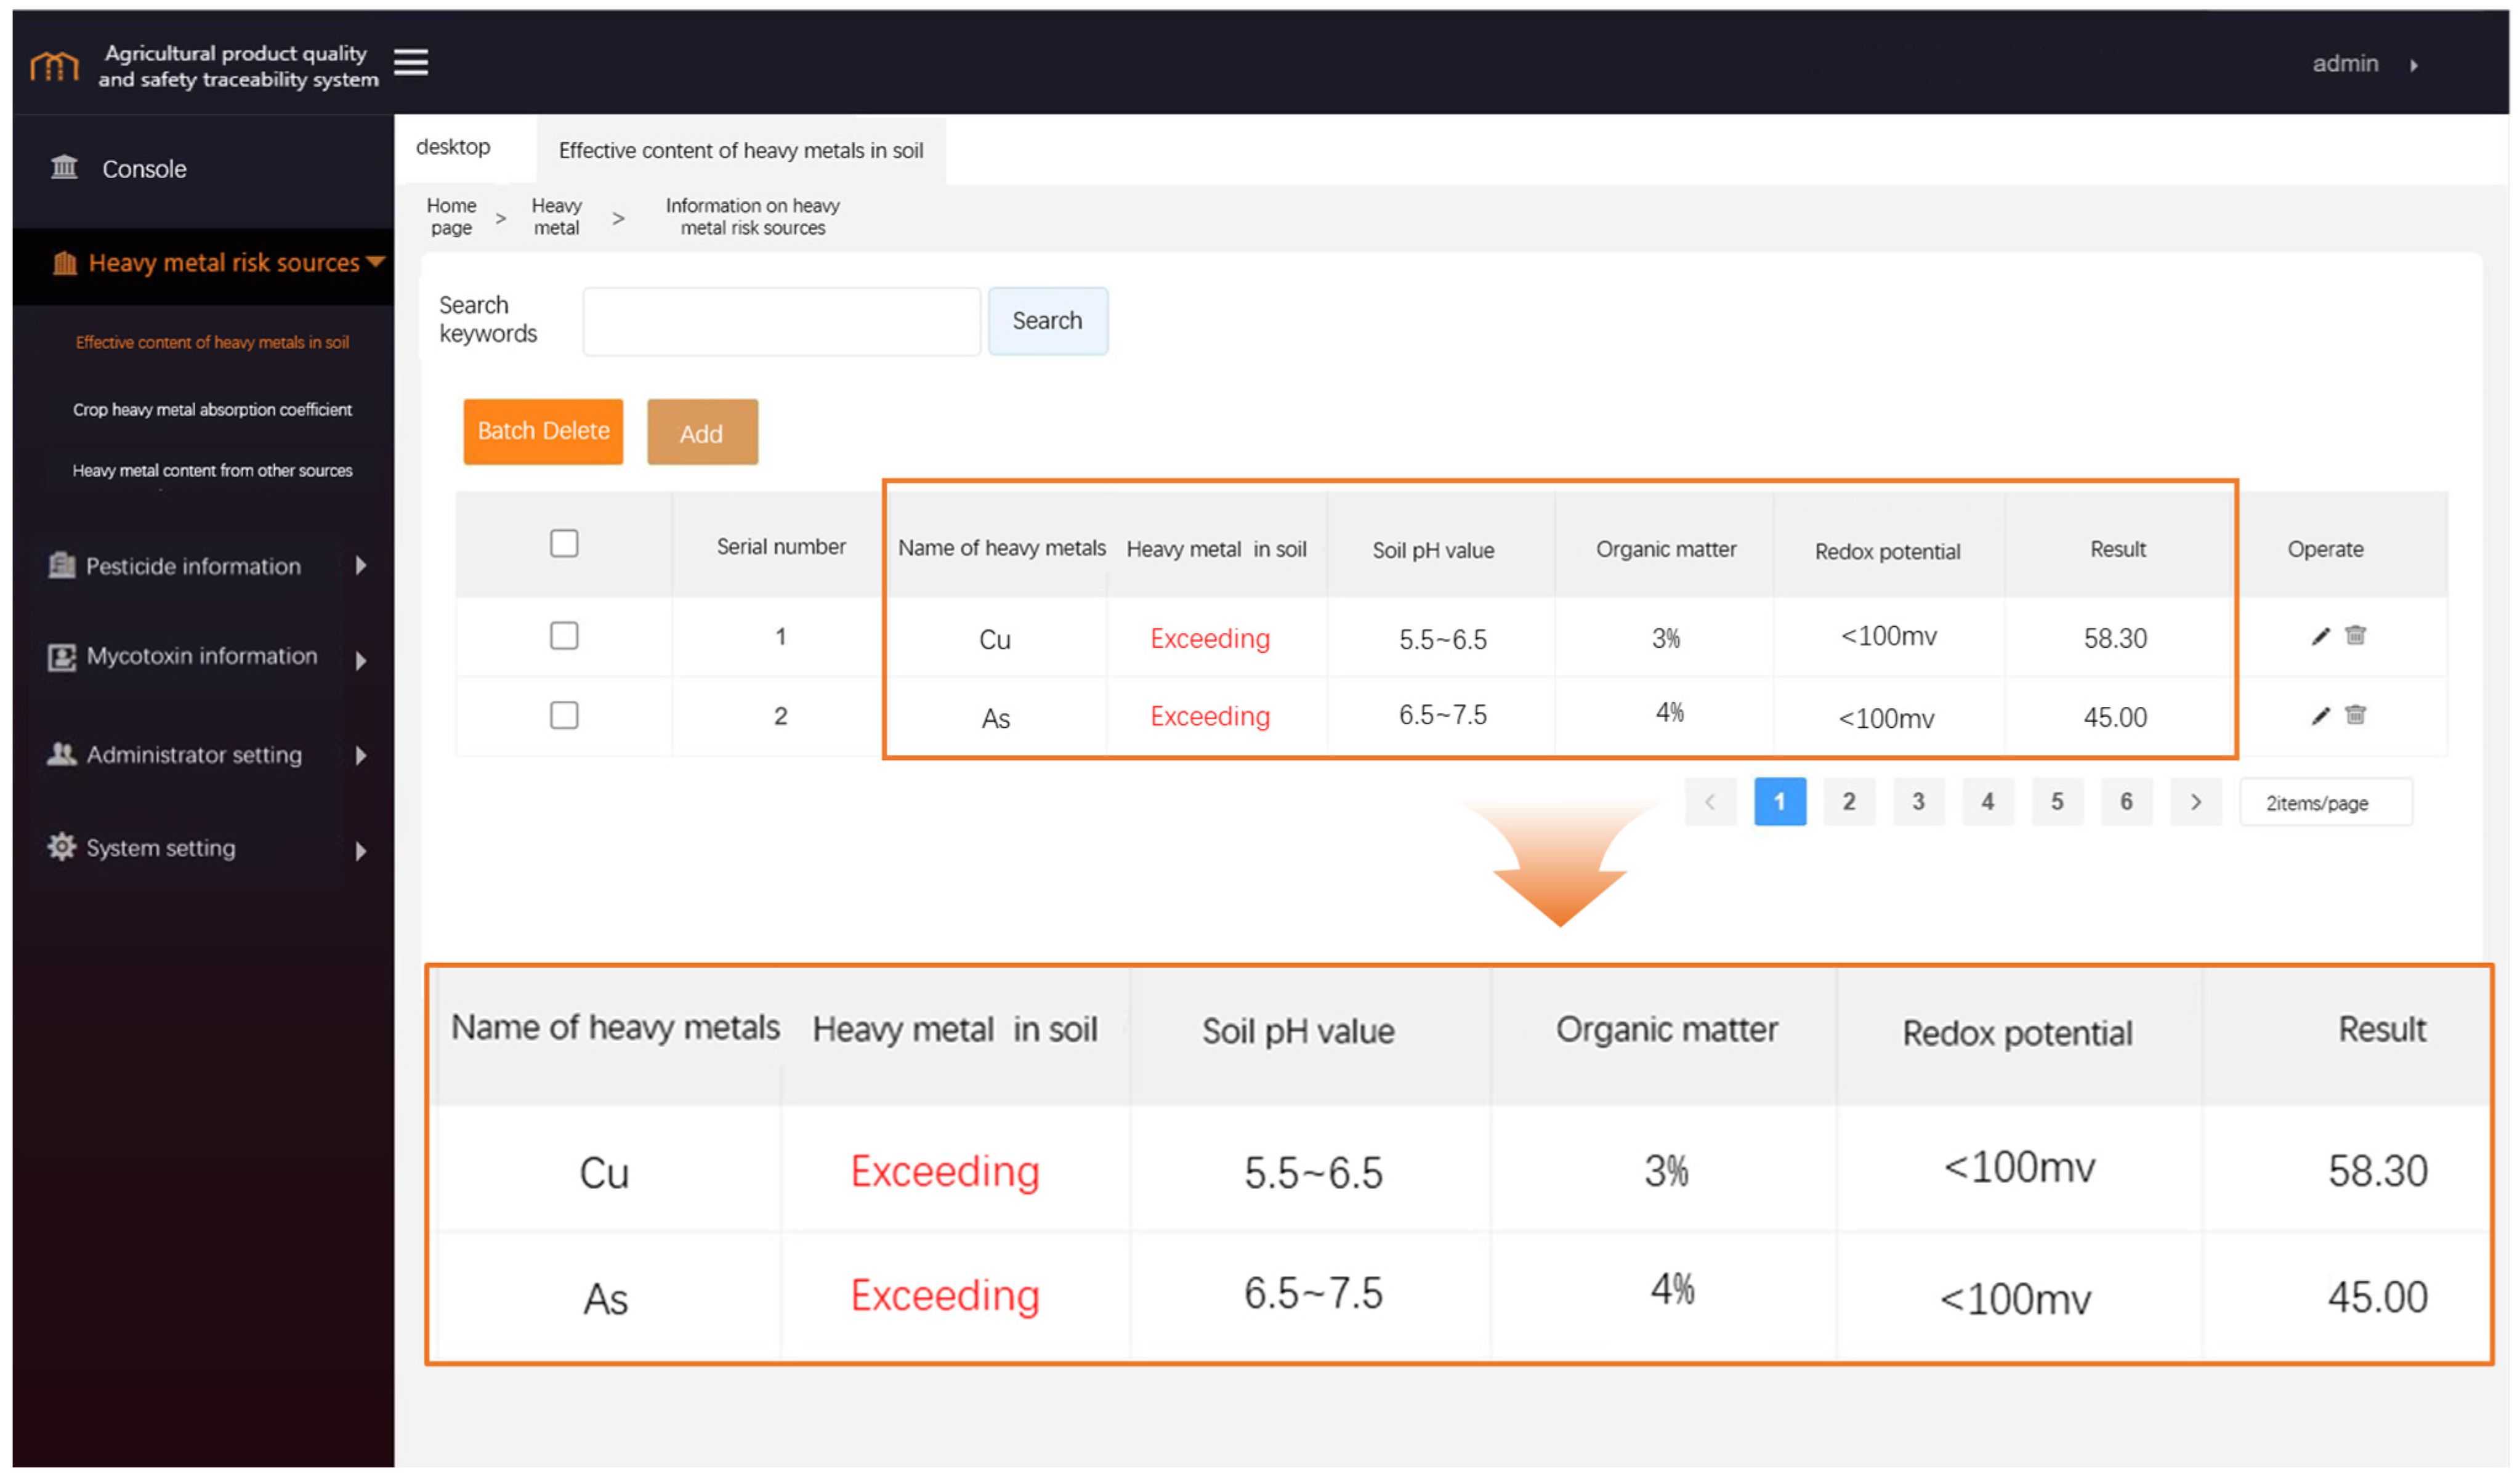
The application layer is the business function layer of the risk traceability system. During system development, the application functions are designed and developed according to the traceability function division, the actual agricultural product business scenario, and business logic. The application layer improves the coordination efficiency of the development team. Developers can focus on the development and maintenance of a single function, and coordinate the deployment of different development function modules in the application layer to ultimately realize the system functions. The application layer receives the request information from the front-end users and transmits the request information to the back-end service layer for response and processing. For example, for the detection data of agricultural product inputs by the front-end users, the application layer transmits the data to the back end after receiving it, and the back end calculates the score of the received actual detection data according to the set risk evaluation model algorithm to obtain the risk score. Further mining is conducted according to the obtained scores, and production suggestions and traceability risk objectives are put forward.
(5)
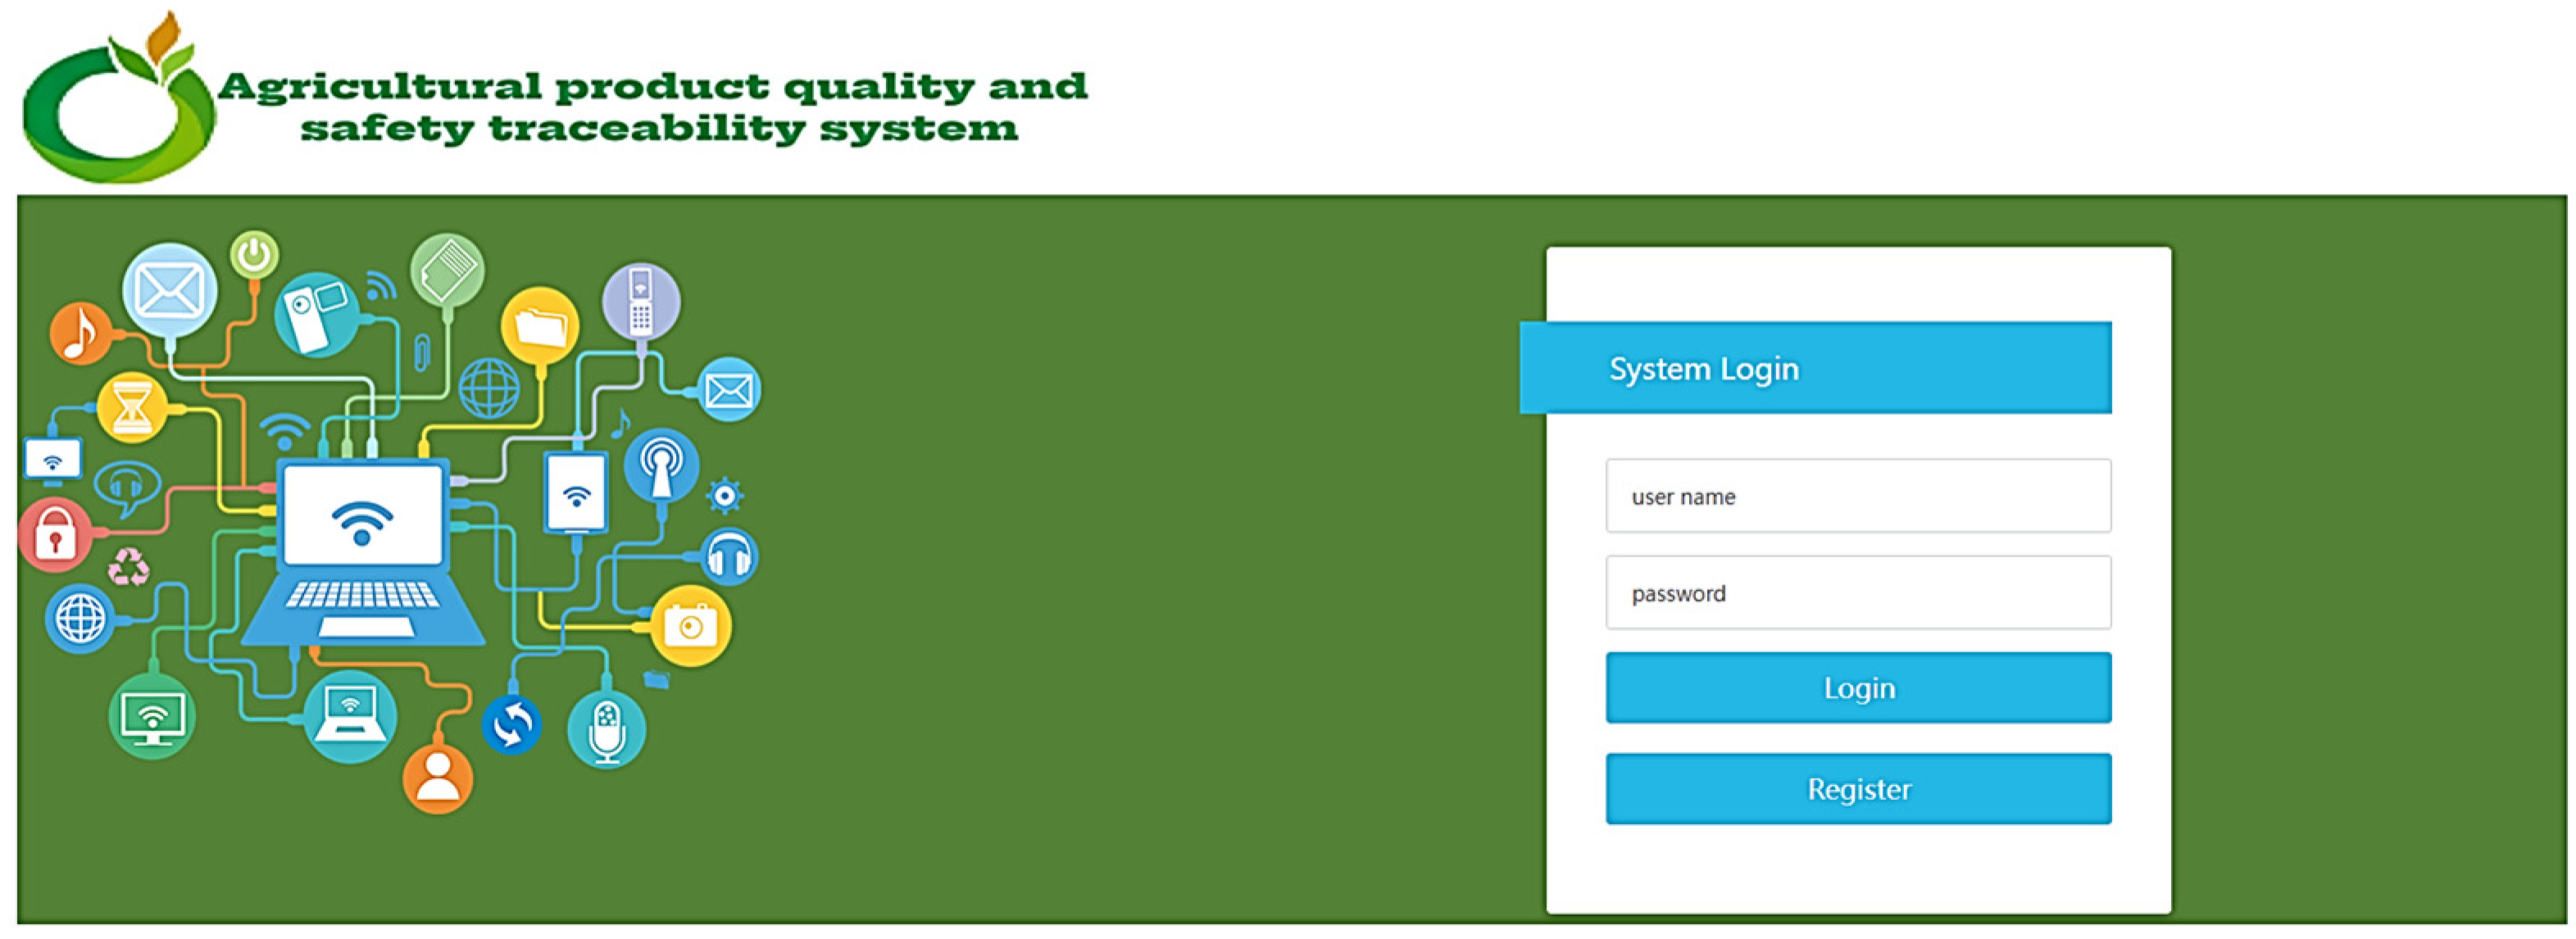
The display layer is the human–computer interaction interface designed by the user. The display interface of the risk traceability system uses HTML, JavaScript, and other development technologies to achieve interactive functions. The display layer unifies the development of interaction classes and improves the development specification of the system display interface. The risk traceability system uses web technology to provide users with operation functions. Different users can enter the system through different terminal devices. The applicability of web technology is better, and the designed system has better popularization significance.
(6)
The user layer refers to all users who have clear requirements for the agricultural product risk traceability system. It defines the definition of permissions and the differences in the operation functions of different users. The division of the user layer is conducive to developers to clarify the responsibilities and boundaries between different user roles, including supervision department personnel, production enterprise personnel, enterprise management personnel, etc.
The design of the six-layer architecture of the agricultural product risk traceability system defines the responsibilities of each layer and coordinates the relationship between different layers. Through the division of the system architecture, the functions of some layers during development are reused. The division of the six-layer architecture not only clarifies the system structure but also simplifies the workload of subsequent system updating and optimization. When updating and improving the system, it is no longer necessary to reconstruct the whole system, which not only improves development efficiency, it also enhances the practical adaptability of the system. To achieve better processing of the number of requests, services are split and clustered according to the architecture. The interfaces between the separated microservices are exposed. The registration and configuration are designed as a unified whole, and a cluster is formed through mutual calls. The specific microservice technology stack is shown in Figure 4.
In the actual system deployment process, considering the impact on system flexibility and scalability, a containerized approach is chosen for deployment to achieve distributed search and storage. The design system is divided based on the system architecture, and the separated independent components are deployed separately. In the front-end design and development of the system, the Vue framework is used to build a front-end human–computer interaction page. The lightweight framework and component-based development reduce the difficulty of development and shorten the development cycle.

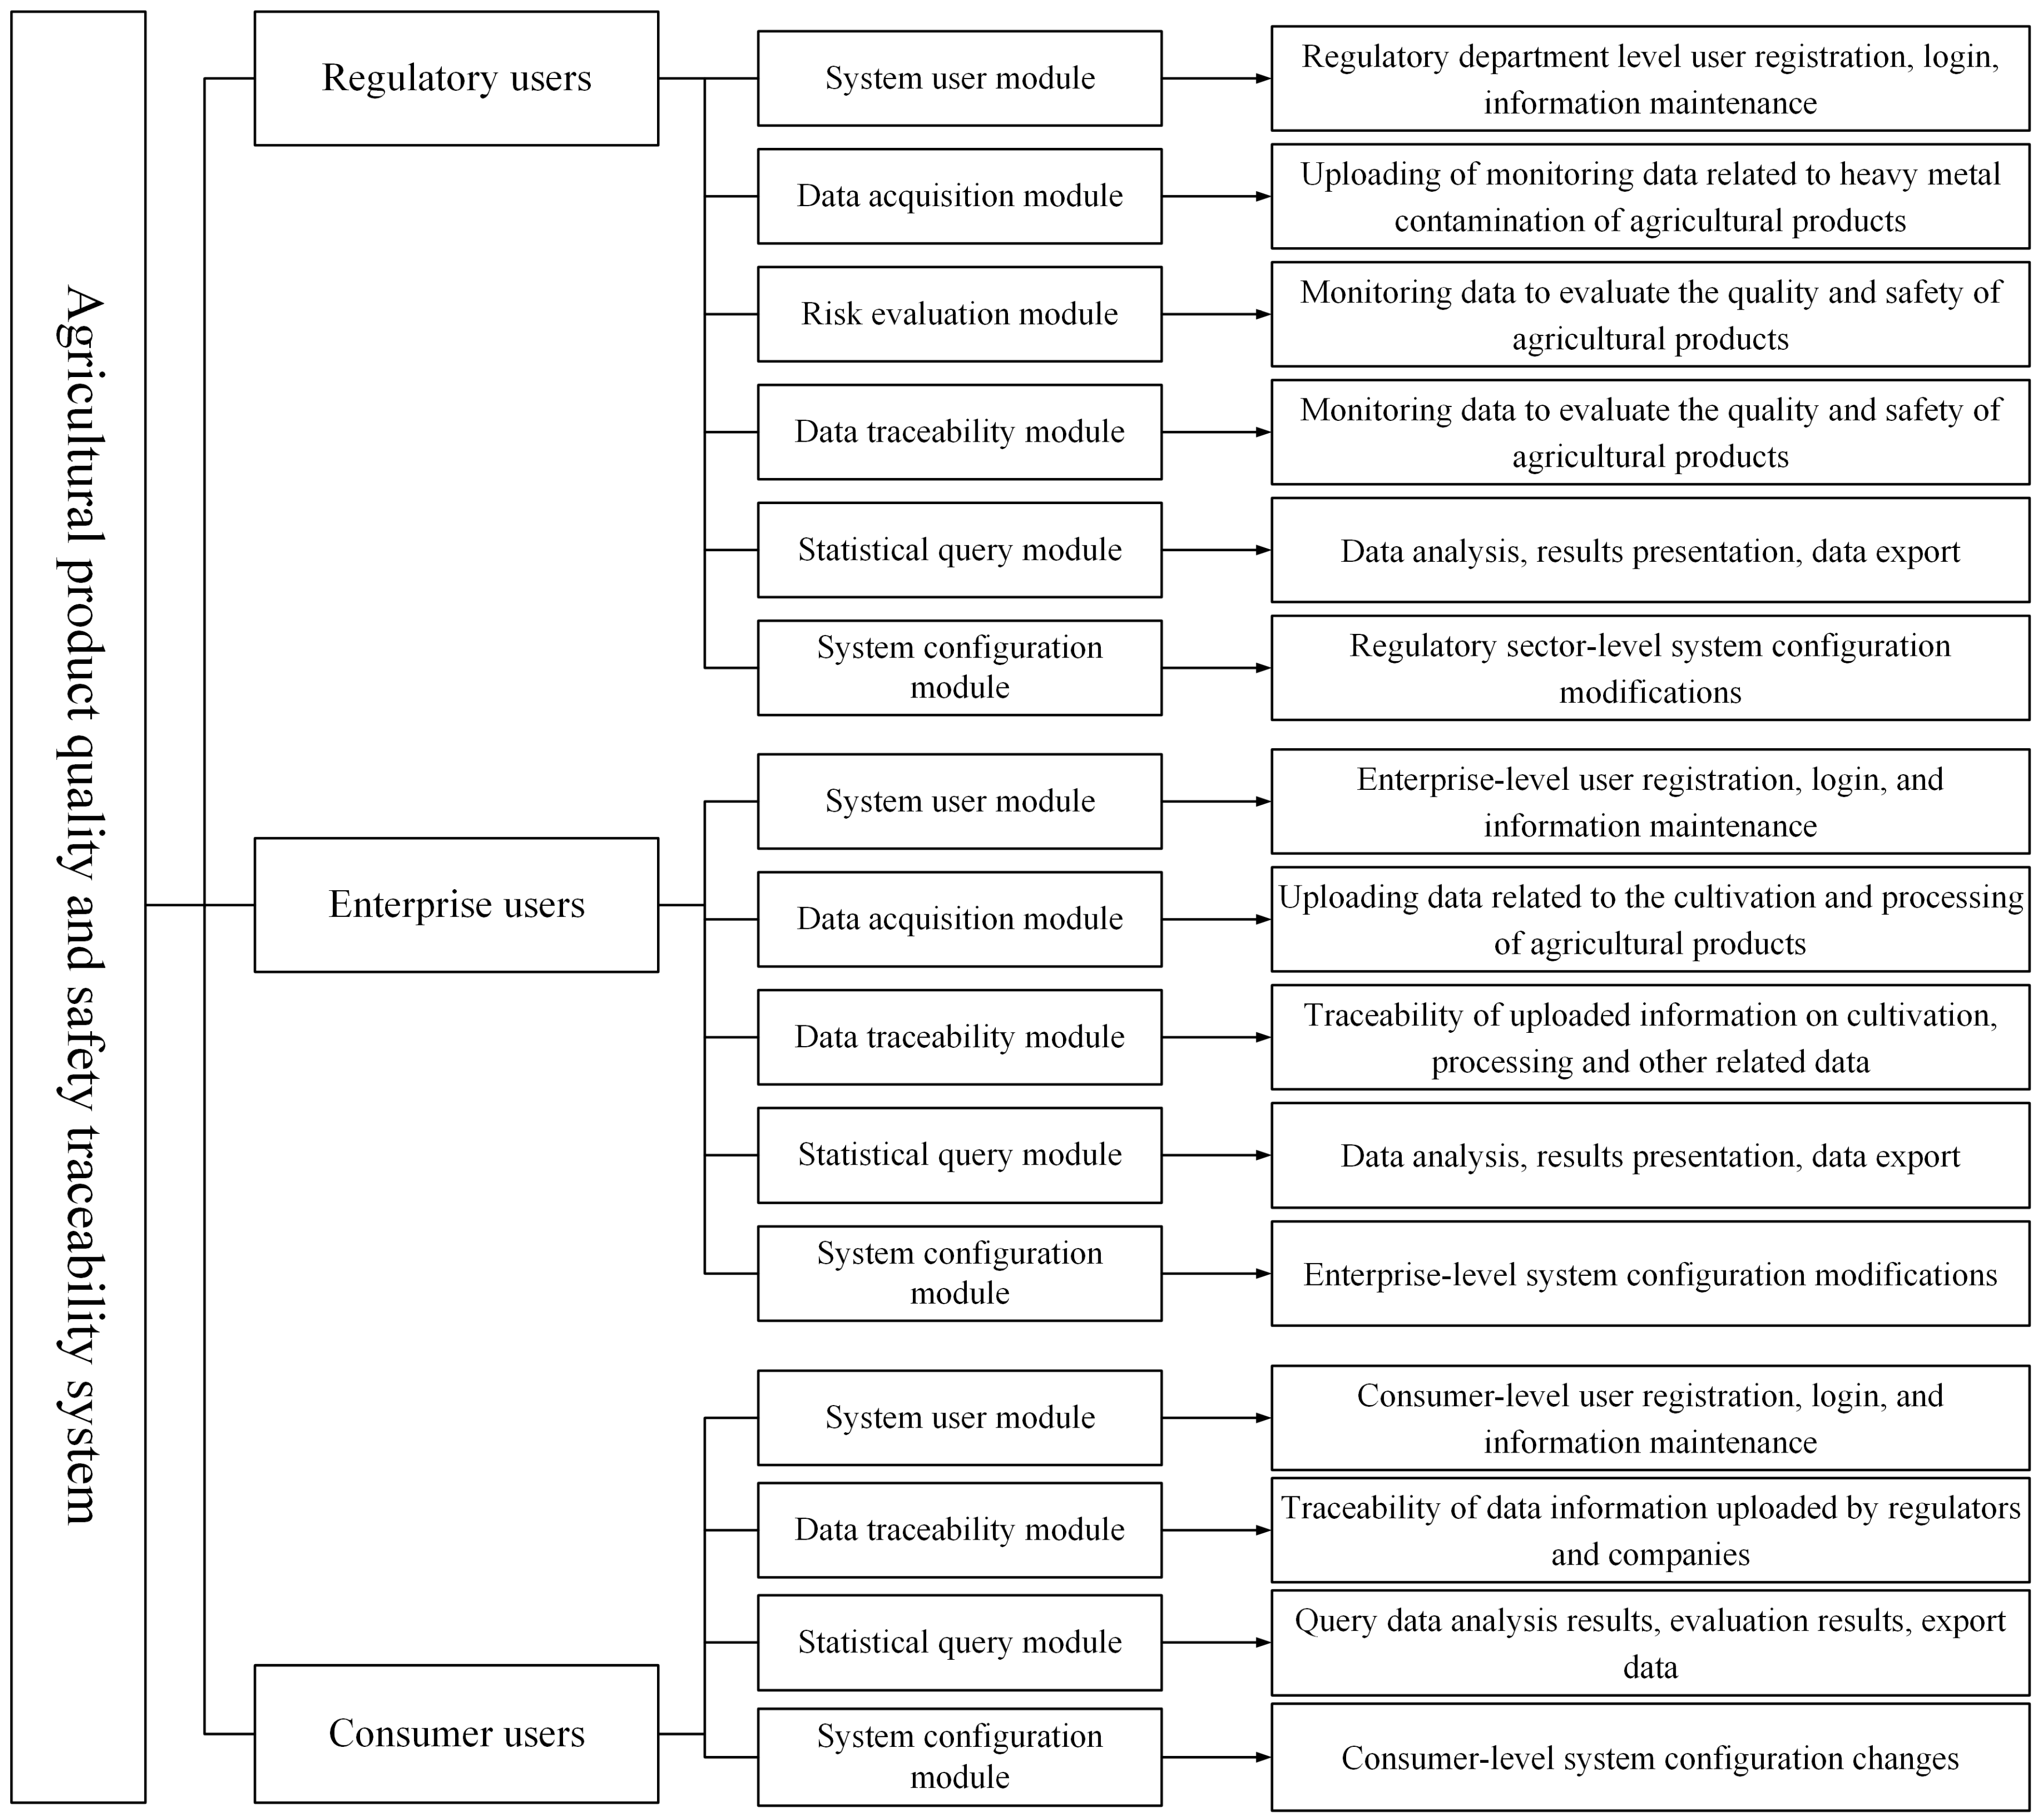
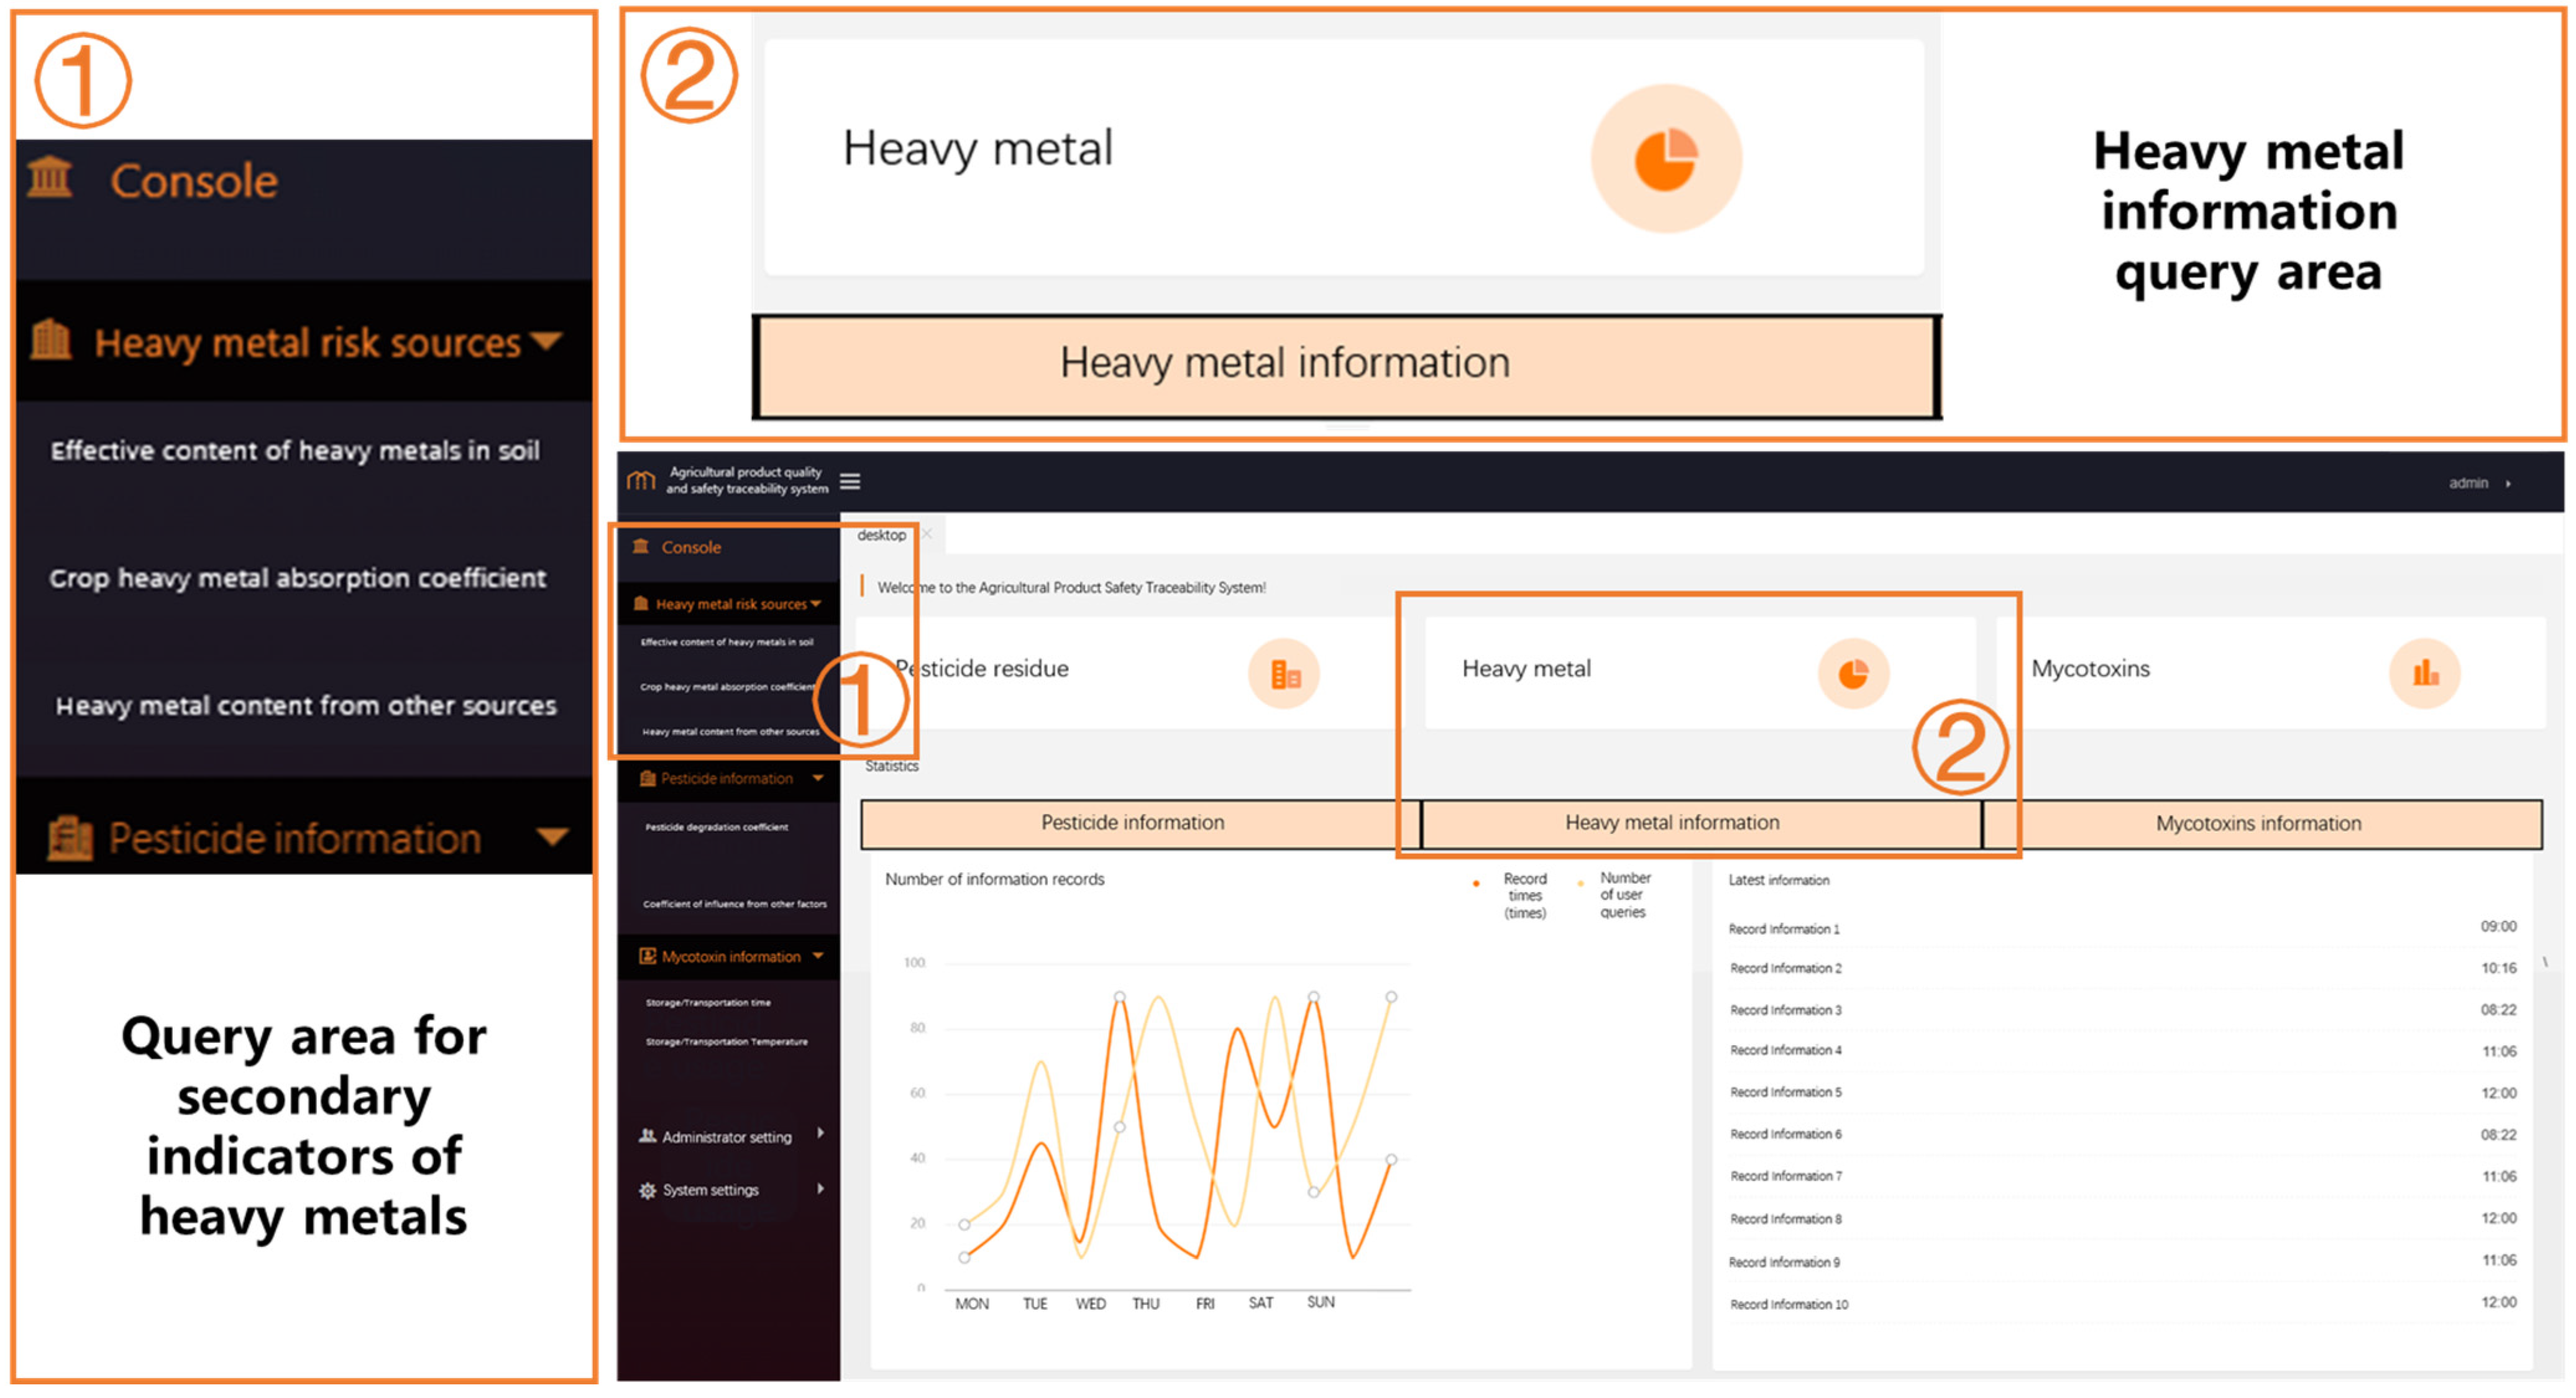
3.2.2. System Function Module Design

According to the system construction objectives and demand analysis, the system needs to be built to complete the basic database, data collection, risk evaluation, data display, user management, system configuration, and other functions.
According to the idea of top-level design in system engineering, a modular design method is used to construct the main functional modules of the system, as shown in Figure 5, System Functional Module Diagram. The functions of the system modules are as follows: (1) System user module. The module provides the registration, login, and user maintenance functions for three levels of users of agricultural product quality and safety traceability at the supervisory department level, enterprise user level, and consumer level. (2) Data acquisition module. This module provides the uploading function of the data and information of the supervisory department and enterprise users for the testing data of agricultural products, the evaluation of the quality of agricultural products, the environmental testing data, and other data and information. Regulatory authorities and relevant enterprises play a supportive role in the data collection process. (3) Risk evaluation module. This module mainly focuses on the risk evaluation of the obtained data information related to the quality and safety of agricultural products based on the limit value standard. It has functions such as analyzing the results of risk evaluations and independently highlighting risky data information. (4) Data traceability module. This module provides three levels of user traceability record information. (5) Statistical query module. This module uses risk assessment methods combined with recorded agricultural product monitoring data to perform scoring analysis on the quality and safety status of agricultural products. After statistical analysis, the scoring results are displayed. (6) System configuration module. This module mainly provides modified configuration functions for system operation and maintenance.

3.2.3. System Database Design

To build the system and realize the functional characteristics, the relational database MySQL was used to compare and analyze the system data. Based on the data flow generated by the functional business to be accomplished by the system, the system database was standardized and designed in accordance with the steps of database construction.
According to the actual research and the analysis of the realized functional requirements, the traceability system of agricultural product quality and safety designed by the research of this paper divides the agricultural product hazards into three major categories, including heavy metal, pesticide, and mycotoxin contamination. The occurrence of the risk of exceeding the standards for all three hazards is a systematic process, and the level of risk of agricultural products as affected bodies is determined by the sources of risk and exposure pathways, i.e., by the impact factors. Therefore, the following database tables were created: user information table, soil heavy metal effective state content table, crop heavy metal uptake coefficients table, heavy metal content from other sources table, pesticide degradation coefficients table, pesticide usage table, other factors influence coefficients table, storage and transportation schedules table, storage and transportation temperatures table, and moisture activity table, and the tables were instantiated by creating MySQL relational databases in Navicat software. The specific form name design and system database table design diagram is shown in Figure 6.
The above data sheet records the detailed information required for the evaluation of agricultural products in the process of agricultural products from planting to marketing, and establishes an electronic file for the traced agricultural products. The use of information technology means to trace the monitoring data of agricultural products has the following advantages: more efficiently completes the business needs of the traceability of agricultural product quality and safety; according to the results of the system evaluation, the data can be further excavated; and more effective improvement measures can be put forward, which will achieve the unified management of the traceability information on the production of agricultural products.

4. Realization of Results

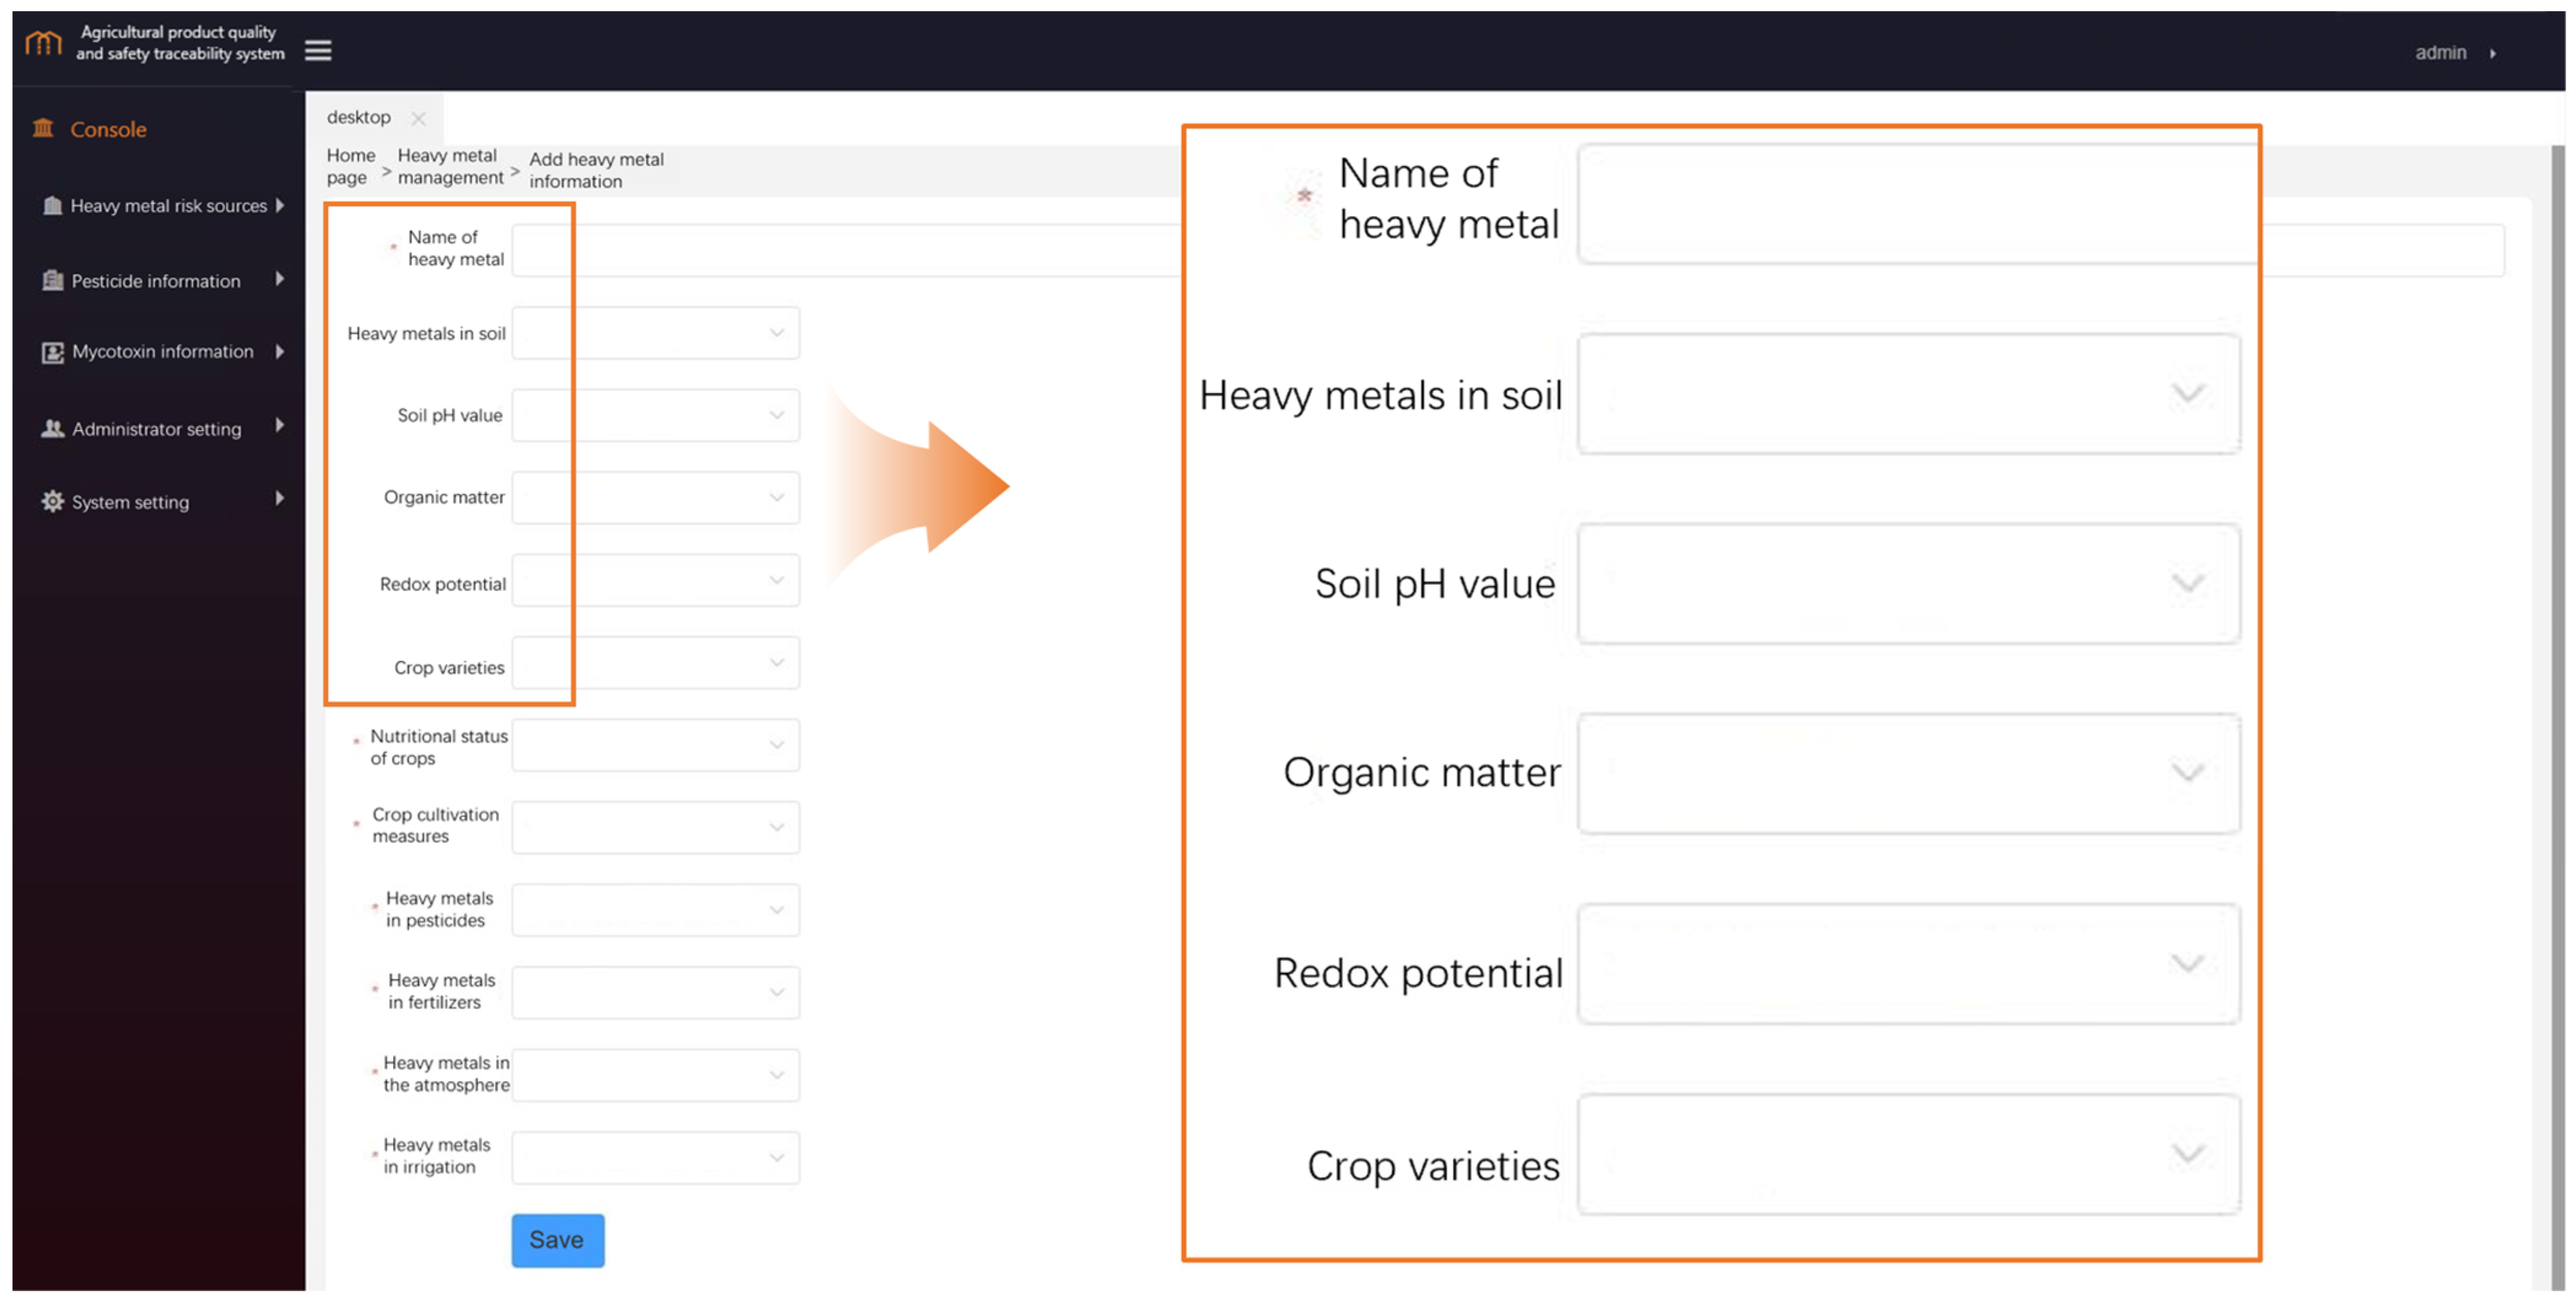
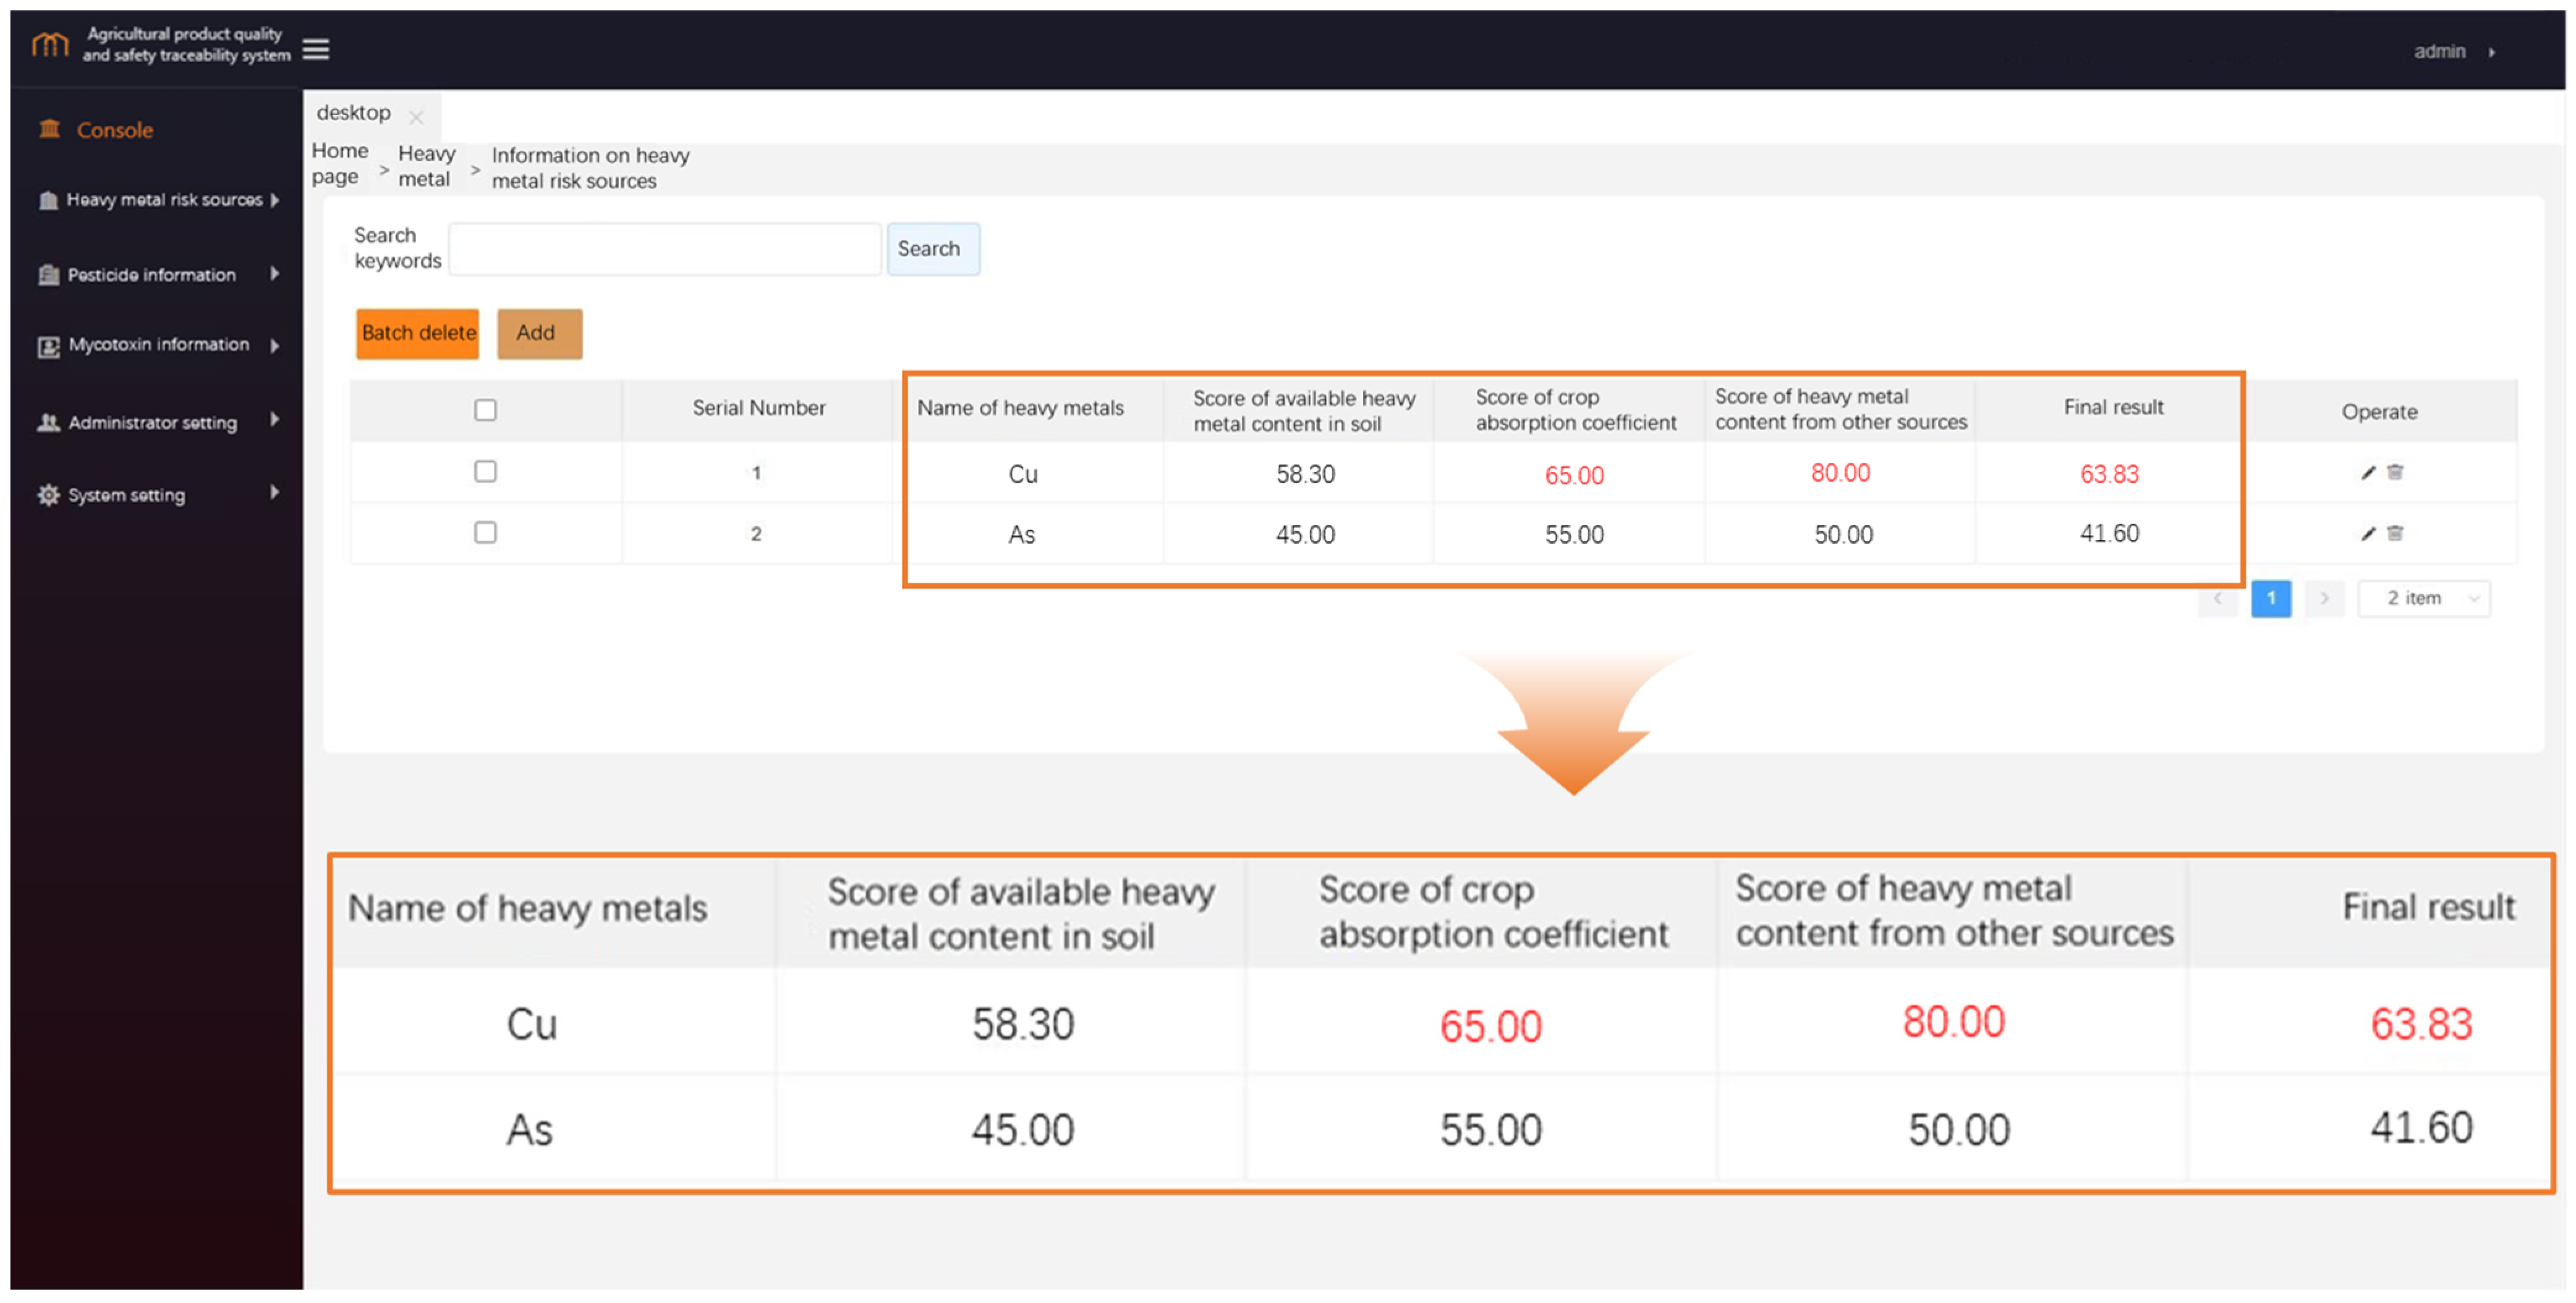
4.1. System Implementation

The agricultural product risk traceability system adopts a multi-layer browser/server structure, which is composed of client, server, and database. In the process of building the system, the designed risk assessment model was introduced into the data processing module of the system. The recording and storage of user-uploaded data information by the risk traceability system and the display of quantitative score results of data information analyzed by the risk assessment model were realized. During operation, the system can support three levels of multi-user login at the same time: regulatory department level, enterprise level, and consumer level. The main business demand functions such as uploading and information query of agricultural product quality and safety detection data, dynamic adjustment of user permissions, the highlighting of abnormal detection data and evaluation scores, and display of risk evaluation results were realized.
The system registration and login screen are shown in Figure 7. Three levels of users first need to enter the correct username and password; after the input is completed, a click on the login button will log into the system. Unregistered users can register by clicking on the Register button. Username and password data will be stored in the user information database table.
The main system interface is shown in Figure 8. The left navigation bar shows the testing information of relevant agricultural products that users can query, including under heavy metal risk sources: soil heavy metal effective state content, crop heavy metal uptake coefficients, heavy metal content from other sources; under pesticide information: pesticide degradation coefficients, pesticide use, and impact coefficients of other factors; and under mycotoxin information: storage/transportation time, storage/transportation temperature, and moisture activity. Users can also make administrator settings and system configuration settings.
In the main interface: the graph in the information statistics section can show the number of information records and the number of user inquiries. The most recent information can be displayed under the latest information content and time; pesticide residues, heavy metals, and fungal toxins are three buttons that when clicked will enter the information input page. Taking heavy metals as an example, the information input page is shown in Figure 9. In the information input interface, the relevant detection data of agricultural products can be recorded, including name of heavy metals, heavy metal content in soil, soil pH, soil organic matter, redox potential, crop varieties, nutritional status of crops, crop cultivation measures, heavy metal content of pesticides, the total metal content of fertilizers, the atmospheric content of heavy metals, and the heavy metal content in the irrigation. The system stores the data in well-categorized database tables.

4.2. System Test

Based on the experimental pilot of relevant planting bases, the sample soil was tested and analyzed. Based on the system implementation, the detection data of the sample soil were further applied to the system, and the risk assessment results obtained after the system operation were used to verify its practical significance. The pH value of the obtained sample soil is 7.65, the organic matter content in the soil is 26.18 g/kg, and the soil oxidation–reduction potential is 158 mv. The specific heavy metal contents of soil, fertilizer, atmosphere, and irrigation water are shown in Table 4.
The bioaccumulation coefficient (BCF) and transfer coefficient (BTF) were used to evaluate the heavy metal enrichment ability of agricultural products, and the evaluation results were used to refer to the accuracy of the design system for heavy metal traceability. The specific calculation formula is as follows:
B C F = w c r o p / w s o i l
In Equation (6): w c r o p represents the mass fraction of heavy metals in agricultural objects (mg/kg); w s o i l represents the mass fraction of heavy metals in the rhizosphere soil of crops (mg/kg).
B T F = w a b o v e / w r o o t
In Equation (7): w a b o v e represents the mass fraction of heavy metals in the aboveground parts of crops (mg/kg); w r o o t represents the mass fraction of heavy metals in the roots of crops (mg/kg);
The soil heavy metal threshold based on crop food safety is H M T , and the calculation formula is:
H M T = E / B C F
In Equation (8), E represents the limit value standard in the corresponding health standard. Taking copper as an example, the copper content in the sample exceeds its safety threshold, which poses a significant enrichment risk in agricultural products.
The system adopts a designed agricultural product quality and safety risk assessment model to conduct a risk assessment on the detection data related to Cu in the obtained sample soil. As shown in Figure 10, according to the evaluation results displayed by the system, it can be seen that the warning score of Cu in the sample soil is 63.83 points. If it exceeds the set warning score by 60 points, the system will mark it with a red warning prompt. The first-level indicator scores are 58.30 points, 65.00 points, and 80.00 points, respectively. According to the system evaluation prompt, the Cu content in the sample soil will have a significant impact on the accumulation of heavy metals in planted crops. Therefore, the soil environment should be improved to reduce the accumulation effect of Cu in crops.
By clicking on the secondary indicator option under heavy metal risk sources in the navigation bar on the left side of the main interface, the available content of soil heavy metals and the absorption coefficient of crop heavy metals are shown in Figure 11 and Figure 12, respectively. The interface can display monitoring data for each indicator, with the evaluation indicator with the highest risk highlighted in red and the evaluation indicator with the highest risk highlighted in blue.
In Figure 13, when observing the heavy metal content of other sources, various indicators are highlighted, and the results show that Cu was detected in soil, fertilizer, and an atmospheric environment. The system’s red warning score of 80 points indicates that the Cu metal content in the agricultural product’s planting environment is too high, and corresponding measures are urgently needed to reduce the Cu content in the planting environment to reduce the impact of the environment on the enrichment of Cu in agricultural products, in order to ensure the quality and safety of agricultural products. In the traceability process, heavy metals can be fuzzily searched through the search box on the upper side of the interface. Based on the highlighted information, the high-risk links of quality and safety issues for the problematic products can be traced, and the production or processing methods can be improved to reduce the probability of quality and safety issues in agricultural products.
According to the evaluation prompts of the system, the risk of heavy metal enrichment in agricultural products can be well determined. The established agricultural product quality and safety risk assessment system and the constructed agricultural product quality and safety risk assessment model can effectively achieve a quantitative assessment of heavy metal enrichment risk. By establishing a method for evaluating the quality and safety of agricultural products and a risk tracing system to monitor the environmental factors of crop growth, the ecological environment will be indirectly protected, and the development of green agriculture will be promoted. Through multi-stage supervision, the level of factory management will be improved, and the risk sources of quality and safety issues in agricultural products will be identified in a timely manner, which helps to avoid food quality and safety accidents, thereby reducing production costs and better responding to potential risks.

5. Conclusions

The quality and safety of agricultural products are characterized by many types of risk factors, many risk information data, and many circulation links, and in order to solve the problems of low traceability efficiency and the difficulty in updating agricultural product traceability systems under these conditions of huge traceability content and complex project categories, the actual needs of precise risk traceability must be faced. By combing and analyzing the business process of the agricultural product supply chain, the risk assessment method was introduced to design a risk assessment system for agricultural product quality and safety, and a risk assessment model for heavy metal traceability was constructed. The top-level design idea was used to build the functional modules of the system, create database tables according to the data flow generated by the business functions, and design a six-tier system architecture based on microservices, and an agricultural product risk traceability system combined with risk assessment model was developed. The development system supports multiple users to fill in and upload relevant data information. The human–computer interface pays more attention to the display of the traceability results. The quality- and safety-related monitoring data recorded by the independent statistical analysis system can obtain a quantitative evaluation of heavy metal pollution in agricultural products and the accurate traceability of the risk link of quality and safety problems, so as to improve the reliability of the traceability results. Using the system, regulatory authorities can dynamically monitor the quality and safety of agricultural products, consumers can trace the quality and safety monitoring data of agricultural products, and production enterprises can optimize the operation specifications of agricultural products. It provides a reference for the application of agricultural product quality and safety evaluation in a traceability system, and has better practical significance.

Author Contributions

Conceptualization and methodology, C.L. and Y.B.; writing—original draft preparation, writing—review and editing, C.L. and Y.L.; software, validation, and visualization, Y.L., M.Y. and J.T. All authors have read and agreed to the published version of the manuscript.

Funding

This research was funded by the National key research and development program of China (2023YFC2605800, 2023YFC2605801).

Institutional Review Board Statement

Not applicable.

Informed Consent Statement

Not applicable.

Data Availability Statement

The data presented in this study are available in article.

Conflicts of Interest

The authors declare no conflicts of interest.

References

  1. Yang, L.; Zhu, J.; Huang, Z.; Geng, J. A Systematic Review of China’s Food Safety Management since Reform and Opening Up. Emerg. Mark. Financ. Trade 2019, 55, 3472–3489. [Google Scholar] [CrossRef]
  2. Jaa, B.; Rmt, C.; Mdk, D.; Aeh, A.; Atn, A. Evaluating food safety management systems in Singapore: A controlled interrupted time-series analysis of foodborne disease outbreak reports—ScienceDirect. Food Control 2020, 117, 107324. [Google Scholar]
  3. Wales, C.; Harvey, M.; Warde, A. Recuperating from BSE: The shifting UK institutional basis for trust in food. Appetite 2006, 47, 187–195. [Google Scholar] [CrossRef] [PubMed]
  4. Dong, X.W.; Qi, Q.; Fang, S.S. The Optimization and Countermeasures Research of Agricultural Products Quality and Safety Supervision Mode. Adv. Mater. Res. 2014, 1061–1062, 1271–1274. [Google Scholar]
  5. Zhang, X.; Guo, Q.; Shen, X.; Yu, S.; Qiu, G. Water quality, agriculture and food safety in China:Current situation, trends, interdependencies, and management. J. Integr. Agric. 2015, 11, 2365–2379. [Google Scholar] [CrossRef]
  6. Wang, J.; Yue, H.; Zhou, Z. An Improved Traceability System for Food Quality Assurance and Evaluation Based on Fuzzy Classification and Neural Network. Food Control 2017, 79, 363–370. [Google Scholar] [CrossRef]
  7. Demestichas, K.; Peppes, N.; Alexakis, T.; Alexakis, T.; Adamopoulou, E. Blockchain in Agriculture Traceability Systems: A Review. Appl. Sci. 2020, 10, 4113. [Google Scholar] [CrossRef]
  8. Zhang, X.; Zhang, J.; Liu, F.; Fu, Z.; Mu, W. Strengths and limitations on the operating mechanisms of traceability system in agro food, China. Food Control 2010, 21, 825–829. [Google Scholar] [CrossRef]
  9. Ping, H.; Wang, J.; Ma, Z.; Du, Y. Mini-review of application of IoT technology in monitoring agricultural products quality and safety. Int. J. Agric. Biol. Eng. 2018, 11, 35–45. [Google Scholar] [CrossRef]
  10. Hu, J.; Zhang, X.; Moga, L.; Neculita, M. Modeling and implementation of the vegetable supply chain traceability system. Food Control 2013, 30, 341–353. [Google Scholar] [CrossRef]
  11. Zhou, Z.; Zhou, Z. Application of Internet of things in agriculture products supply chain management. In Proceedings of the 2012 International Conference on Control Engineering and Communication Technology, Shenyang, China, 7–9 December2012. [Google Scholar]
  12. Song, Y.; Lv, C.; Liu, J. Quality and safety traceability system of agricultural products based on Multi-agent. J. Intell. Fuzzy Syst. 2018, 35, 2731–2740. [Google Scholar]
  13. Schwägele, F. Traceability from a European perspective. Meat Sci. 2005, 71, 164–173. [Google Scholar] [CrossRef] [PubMed]
  14. Peets, S.; Gasparin, C.P.; Blackburn, D.; Godwin, R.J. RFID tags for identifying and verifying agrochemicals in food traceability systems. Precis. Agric. 2009, 10, 382–394. [Google Scholar] [CrossRef]
  15. Alfian, G.; Syafrudin, M.; Farooq, U.; Ma’Arif, M.R.; Syaekhoni, M.A.; Fitriyani, N.L.; Lee, J.; Rhee, J. Improving efficiency of RFID-based traceability system for perishable food by utilizing IoT sensors and machine learning model. Food Control 2020, 110, 107016. [Google Scholar] [CrossRef]
  16. Velepucha, V.; Flores, P. A Survey on Microservices Architecture: Principles, Patterns and Migration Challenges. IEEE Access 2023, 11, 88339–88358. [Google Scholar] [CrossRef]
  17. Söylemez, M.; Tekinerdogan, B.; Tarhan, A.K. Challenges and Solution Directions of Microservice Architectures: A Systematic Literature Review. Appl. Sci. 2022, 12, 5507. [Google Scholar] [CrossRef]
  18. Namiot, D.; Sneps-Sneppe, M. On Micro-services Architecture. Int. J. Open Inf. Technol. 2014, 2, 24–27. [Google Scholar]
  19. Raj, V.; Sadam, R. Patterns for Migration of SOA Based Applications to Microservices Architecture. J. Web Eng. 2021, 20, 1229–1245. [Google Scholar]
  20. Krishnan, A.R.; Kasim, M.M.; Hamid, R.; Ghazali, M.F. A Modified CRITIC Method to Estimate the Objective Weights of Decision Criteria. Symmetry 2021, 13, 973. [Google Scholar] [CrossRef]
  21. Keshavarz-Ghorabaee, M.; Amiri, M.; Zavadskas, E.K.; Turskis, Z.; Antucheviciene, J. Determination of Objective Weights Using a New Method Based on the Removal Effects of Criteria (MEREC). Symmetry 2021, 13, 525. [Google Scholar] [CrossRef]
  22. Shivanagowda, G.P.; Chitimalla, R.; Karabasanavar, N.; Sen, A.R. A Database for Buffalo Meat Traceability in India. Buffalo Bull. 2023, 42, 437–447. [Google Scholar] [CrossRef]
  23. Govindan; Kannan. Sustainable consumption and production in the food supply chain: A conceptual framework. Int. J. Prod. Econ. 2018, 195, 419–431. [Google Scholar] [CrossRef]
  24. Wong, D.R.; Bhattacharya, S.; Butte, A.J. Prototype of running clinical trials in an untrustworthy environment using blockchain. Nat. Commun. 2019, 10, 10–18. [Google Scholar] [CrossRef] [PubMed]
  25. Cocco, L.; Mannaro, K.; Tonelli, R.; Mariani, L.; Lodi, M.B.; Melis, A.; Simone, M.; Fanti, A. A Blockchain-Based Traceability System in Agri-Food SME: Case Study of a Traditional Bakery. IEEE Access 2021, 9, 62899–62915. [Google Scholar] [CrossRef]
  26. Surjandari, I.; Yusuf, H.; Laoh, E.; Maulida, R. Designing a Permissioned Blockchain Network for the Halal Industry using Hyperledger Fabric with multiple channels and the raft consensus mechanism. J. Big Data 2021, 8, 10. [Google Scholar] [CrossRef]
Figure 1. Statistical chart of food safety incidents in China in the past three years.
Applsci 14 02980 g001
Figure 2. Agricultural products quality and safety traceability business flow chart.
Applsci 14 02980 g002
Figure 3. System architecture diagram.
Applsci 14 02980 g003
Figure 4. System technology stack diagram.
Applsci 14 02980 g004
Figure 5. System function module diagram.
Applsci 14 02980 g005
Figure 6. System database table design diagram.
Applsci 14 02980 g006
Figure 7. System registration and login interface.
Applsci 14 02980 g007
Figure 8. Main interface of the system.
Applsci 14 02980 g008
Figure 9. Heavy metal information input interface.
Applsci 14 02980 g009
Figure 10. Heavy metal information display interface.
Applsci 14 02980 g010
Figure 11. Heavy metal active state content display interface.
Applsci 14 02980 g011
Figure 12. Heavy metal absorption coefficient display interface.
Applsci 14 02980 g012
Figure 13. Other sources of heavy metal display interface.
Applsci 14 02980 g013
Table 1. Risk assessment indicators for agricultural product quality and safety.
Primary IndicatorsSecondary IndicatorsUnit of Measurement
Available content of
heavy metals in soil
(Acs)
Total content of heavy metals in soil (a)mg/kg
Soil pH (b)/
Organic matter (c)g/kg
Redox potential (d)mV
Absorption coefficient of heavy metals in crops
(Ac)
Crop varieties (e)/
Nutritional status (f)/
Cultivation measures (g)/
Heavy metal content
from other sources
(Os)
Heavy metal content in pesticides (h)mg/kg
Heavy metal content in fertilizers (i)mg/kg
Heavy metal content in the atmosphere (j)mg/kg
Heavy metal content in irrigation water (k)mg/kg
Table 2. Scoring of agricultural product quality and safety risk assessment.
Risk Level Evaluation IndexScoring CriteriaScore (Point)
Total content of heavy metals
in soil (a)
Exceeding the standard1
Not exceeding the standard0
Risk level of soil pH
(b)
pH value < 4.5, Extremely acid6
4.5 ≤ pH value < 5.5, Strong acid5
5.5 ≤ pH value < 6.5, acid4
6.5 ≤ pH value < 7.5, neutral3
7.5 ≤ pH value < 8.5, alkalinity2
8.5 ≤ pH value < 9.5, Strong alkalinity1
9.5 ≤ pH value, Extreme alkalinity0
Risk level of soil organic matter
(c)
Soil organic matter content 0%6
Soil organic matter content < 1%5
Soil organic matter content < 2%4
Soil organic matter content < 3%3
Soil organic matter content < 4%2
Soil organic matter content < 5%1
Soil organic matter content > 5%0
Risk level of soil redox potential
(d)
Soil redox potential ≤ −200 mv6
−200 mv ≤ Soil redox potential < −100 mv5
−100 mv ≤ Soil redox potential < 0 mv4
0 mv ≤ Soil redox potential < 100 mv3
100 mv ≤ Soil redox potential < 200 mv2
200 mv ≤ Soil redox potential1
Risk level of crop varieties
(e)
Extremely easy to absorb heavy metals5
Easy to absorb heavy metals4
General to absorb heavy metals3
Low to absorb heavy metals2
Extremely low to absorb heavy metals1
Risk level of crop nutritional status (f)High content of nutrient elements that can resist the absorption of heavy metals1
General content of nutrient elements that can resist the absorption of heavy metals2
Low content of nutrient elements that can resist the absorption of heavy metals3
Risk level of crop
Cultivation measures
(g)
Application of related substances inhibiting the absorption and transport of heavy metals1
Not application of related substances inhibiting the absorption and transport of heavy metals2
Content of heavy metals
in pesticides (h)
Detection1
Not detected0
Heavy metal content
in fertilizer (i)
Detection1
Not detected0
Heavy metal content
in the atmosphere (j)
Detection1
Not detected0
Heavy metal content
in irrigation water (k)
Detection1
Not detected0
Table 3. Average value and standard deviation of agricultural product samples.
Item (Unit)Sample SizeAverage ValueStandard Deviation
Soil pH2004.460.432
Soil organic matter content (g/kg)20033.760.493
Soil cation exchange capacity (cmol/kg)20014.670.539
Cadmium content (mg/kg)2000.050.398
Mercury content (mg/kg)2000.120.425
Arsenic content (mg/kg)2004.450.512
Lead content (mg/kg)20037.620.563
Table 4. Sample soil information table.
CategoryHeavy Metal Content (mg/kg)
CuPbCrCdAsHgNiZn
Soil395.197.253.52.7613.50.1438.1849.3
Fertilizer75.4629.642.41.5\0.551\\
Atmosphere48.284.482.72.25\0.21320.06176.7
Irrigation\00.5701.46000
Disclaimer/Publisher’s Note: The statements, opinions and data contained in all publications are solely those of the individual author(s) and contributor(s) and not of MDPI and/or the editor(s). MDPI and/or the editor(s) disclaim responsibility for any injury to people or property resulting from any ideas, methods, instructions or products referred to in the content.

