1. Introduction
Neurodegenerative disorders (NDs) are conditions characterized by the progressive loss of specific neuron populations. The most common of these disorders include Alzheimer’s disease, Parkinson’s disease, Amyotrophic Lateral Sclerosis, and Huntington’s disease. These diseases are a significant challenge for clinicians due to their diverse clinical presentations and shared molecular pathology [
1].
Despite significant progress in understanding the NDs, particularly in the areas of pathology and pharmacology, the translation of preclinical innovations into effective clinical therapies has been challenging [
2].
This study focuses on Parkinson’s disease. PD primarily affects older individuals and is associated with a range of motor and nonmotor symptoms [
3]. This is a neurodegenerative disorder characterized by the loss of dopaminergic neurons, particularly in the substantia nigra (a small region in the middle of the brain) [
4]. In neurological terms, in Parkinson’s disease, there is a specific pattern of neuronal loss; the dopaminergic neurons of the midbrain that project to the striatum are selectively and primarily destroyed [
5,
6].
The result of this neuronal damage is the manifestation of neurological symptoms. Neurological symptoms of Parkinson’s disease primarily include tremors, muscle stiffness, slowed movement (bradykinesia), and impaired balance and coordination. Cognitive changes, such as difficulties with memory and problem solving, can also occur as the disease progresses.
Despite the fact that this damage is significant, it often goes unnoticed at first. This is partly because the brain has mechanisms to compensate for the damage. Keeping in mind that neuronal degeneration is a normal part of aging, in NDs, this process occurs much more rapidly and is initially masked by the brain’s compensatory responses. That makes it difficult to identify specific biomarkers for early detection, diagnosis, and disease progression [
7].
Therefore, the lack of a cure for Parkinson’s disease can be attributed to several factors and challenges in hidden manifestations across various domains (including genetic, clinical, and pathophysiological).
1.1. The Intersection of PD and AD
The most common neurodegenerative condition is Alzheimer’s disease (AD). In this disease, another small and specific area of the brain is damaged. Research suggests that the early stages of Alzheimer’s disease are characterized by changes in the entorhinal–hippocampal system, particularly in the entorhinal cortex (EC) and the hippocampus [
8].
The hippocampus is essential for the formation of new memories. It helps in consolidating short-term memory to long-term memory, a process that involves making these memories stable and stored efficiently for later retrieval. The entorhinal cortex, particularly its medial aspect, contains grid cells, which are critical for spatial navigation and mapping environments. This region suffers the most severe neuronal loss among the affected areas in this disease.
The outcome of the neurodegeneration in different brain regions is that patients with Alzheimer’s primarily exhibit memory loss, while those with Parkinson’s are more likely to suffer from movement disorders. Unfortunately, there can be an overlap in symptoms between these two neurodegenerative diseases. However, the mechanisms underlying the disease, including the role of misfolded proteins and the interaction between dopamine and acetylcholine, remain unclear [
9,
10].
1.2. The Hidden Progression of the Disease
This complexity and hidden progression make NDs one of the major causes of neurological disability and mortality worldwide. Despite technological advancements, we still pessimistically estimate the number of people with dementia is expected to increase from 57 million cases globally in 2019 to 152 million cases globally in 2050, notably with a three-fold increase projected in China [
11,
12]. Therefore, we urgently need to address the gap in understanding of these diseases, particularly in terms of the complex interplay of factors that contribute to these conditions.
To bridge this gap, there is a need for more effective screening and diagnostic methods. These should not only facilitate widespread diagnosis but also accurately identify individuals at risk of these diseases. With this objective, we selected the Montreal Cognitive Assessment (MoCA, a pen-and-paper test considered as the gold standard for cognitive evaluation), and we transformed it into an online version. Here, we present the results of applied machine learning algorithms to determine the reliability of this approach.
1.3. The Cognitive Assessment
The Montreal Cognitive Assessment (MoCA) is a brief test used by doctors to find early signs of problems with thinking and memory, which can be linked to Parkinson’s disease. MoCA is a one-page 30-point test that includes tasks such as visuospatial/executive functions, naming, memory, attention, language, abstraction, delayed recall, and orientation. It is designed to quickly assess cognitive functioning and screen for mild cognitive impairment. This test is usually carried out face-to-face in a clinical setup and takes around 15 min to complete.
Despite this, checkups of cognitive state are rare exceptions, as they generate additional workload to the budget of healthcare systems. This leads to the underdiagnosis of neurodegenerative conditions. Because of this challenge, it makes sense to use the web and machine learning models to support the process diagnosis. This removes the geographical and economical constraints, making it possible to screen wider populations, providing valuable data.
However, transitioning to an online environment poses its own set of challenges, especially for elderly users who may struggle with digital tasks that differ from their paper-based counterparts, such as drawing. Difficulty with the technology might result in lower test scores that inaccurately reflect a person’s cognitive abilities rather than their familiarity with computers.
Therefore, while the prospects are promising, there are challenges to consider, including ensuring the privacy and security of sensitive medical data, addressing digital literacy and accessibility issues among older populations, and validating the efficacy of machine learning models across diverse populations. Thus, further research is needed to ensure their reliability, accuracy, and integrate them into clinical practice.
Hence, to evaluate available methods, we created an online platform in which participants can solve a self-administered version of the MoCA test. The platform is accessible via web browsers, ensuring ease of access for users from the comfort of their homes. It features a simple, intuitive interface that guides users through the screening or diagnostic process step by step. Given the sensitivity of medical data, the platform adheres to privacy and security standards, such as data encryption, secure data storage, and anonymization techniques.
Then, we analyzed the results, we used machine learning models to classify our participants according to their health status, and we compared our findings with the existing literature.
2. Methods
Taking these challenges into account, we created the online version of the MoCA test. Then, we compared multiple machine learning methods in the task of classification of healthy subjects and patients with Parkinson’s disease. Each experiment measured the effectiveness and reliability of selected machine learning algorithms in detecting signs of the disease.
2.1. The Montreal Cognitive Assessment
MoCA is a cognitive health evaluation tool, primarily used for detecting mild cognitive impairment [
13]. This test covers a range of cognitive domains, including short-term memory recall, visuospatial abilities, and executive functions. This ability to evaluate various cognitive aspects in a short (around 15 min) time makes it a practical and comprehensive screening tool.
MoCA has proven to be more effective than some other cognitive tests, such as the Mini-Mental State Examination (MMSE), especially in the context of Parkinson’s disease [
14,
15]. Here, research indicates that MoCA is more sensitive in detecting cognitive impairments in PD patients.
Furthermore, it is helpful in predicting cognitive decline in the early stages of PD, with scores of 26 or lower marking a significant risk for progressive cognitive deterioration [
16]. This sensitivity to early-stage cognitive issues in PD highlights MoCA’s clinical importance.
Additionally, MoCA’s adaptability for remote administration is particularly beneficial for patients with movement disorders [
17]. This enhances its accessibility in varied clinical settings. MoCA’s effectiveness extends to reflecting cognitive reserve, with emphasis on the influence of education and work activity [
18].
It is important to acknowledge reported limitations, as for example, cultural and educational biases present a significant challenge. The MoCA’s performance can vary across diverse cultural and educational backgrounds, potentially leading to misinterpretation of results. Moreover, individuals with lower education levels may score lower on the MoCA, not necessarily due to cognitive impairment but due to the test’s design, which might favor those with higher educational and cultural backgrounds [
19]. However, Gagnon (2013) cautioned that adjusting the MoCA for education could decrease its sensitivity, leading to an increased number of false negatives [
20].
Another noteworthy concern is its susceptibility to practice effects, especially between the first and second administrations. This could potentially skew results and requires consideration in clinical interpretation [
21].
In summary, while the MoCA is a valuable tool for detecting cognitive impairment, it is essential to be aware of its limitations. These include cultural and educational biases, the potential for overdiagnosis, difficulty in distinguishing between different cognitive disorders, language barriers, and time constraints in clinical administration. Awareness and consideration of these factors are crucial for ensuring appropriate use of the MoCA in nuanced contexts.
2.2. Development of the Online Platform
The development of an online Parkinson’s disease screening platform is guided by earlier research demonstrating the effectiveness of online tools in neurological assessment. For example, Youngmann (2019) presented a machine learning algorithm specifically designed for Parkinson’s screening through a web platform, showing the feasibility and effectiveness of online tools in diagnosing PD [
22]. Furthermore, Kim (2020) developed a more advanced point-of-care platform, which is geared towards the early diagnosis of Parkinson’s disease [
23]. These studies highlighted the growing trend and potential of using web platforms for various aspects of Parkinson’s research, including data collection, patient monitoring, and early diagnostic procedures.
To conduct remote experiments and confirm this method’s feasibility and performance, we created a controlled web environment. This validation is important in understanding and improving cognitive assessment tools. We developed the platform using open-source components of React 16.14.0 and Bootstrap 4.5.2, PHP8 API, and MySQL database. This choice allowed us to develop a user-friendly interface with adjustable fonts and contrasts, enhancing accessibility and ensuring the quality of data. This is an important component for participants with cognitive challenges.
The test begins with a supervisor registering a participant. The participant receives a unique URL, including a unique token, to start the test. During the test, we present screens with instructions that the participant should follow. Each of their responses was stored in the database. The test automatically scores simpler MoCA tasks. However, complex tasks like the clock drawing test were evaluated manually, according to established standards.
2.3. Inclusion Criteria for Patients and Healthy Subjects
To evaluate data aggregated by this platform, we invited two groups of people.
Our approach is targeted to establish a distinction between individuals with varying stages of PD and a generally healthy population. This method allowed us to explore and identify patterns related to PD’s impact on health status.
- (1)
The first group included people with Parkinson’s disease. All of them had a confirmed Parkinson’s disease diagnosis, and they were receiving treatment and advice from neurologists at UMass Chan Medical School. Eight participants had UPDRS III scores between 10 and 29 (indicative of mild symptoms of PD), and seven participants had UPDRS III scores above 30 (indicative of advanced symptoms of PD).
- (2)
For reference, we selected students from the Polish Japanese Academy of Information Technology. This approach was based on the lower likelihood of young people having PD. These individuals did not undergo neurological examination to confirm the absence of PD.
In this study, we applied disease-specific criteria for the patient group and combined convenience, demographic, and health status criteria for selecting healthy subjects. The sample size (n = 31) allows for preliminary comparisons and insights into the differences between patient and reference groups. We plan a study with a larger group to confirm these findings and explore other variables that may influence the results.
Before the study, the plan was reviewed and approved by two groups: the Institutional Review Board at UMass Chan Medical School (protocol code: IRB H0008962) and the Ethics Committee at the Polish Japanese Academy of Information Technology (protocol code: OKE-02-06-2022) to ensure compliance with the Declaration of Helsinki.
2.4. Implementation of Time-Based Measures
Currently, there is a debate in Parkinson’s disease research whether digital methods can yield more detailed and precise data than traditional assessment methods, especially in detecting invisible cognitive and motor changes [
24,
25].
Interestingly, eye-tracking studies in Parkinson’s disease confirmed that it is possible to capture these subtle changes with digital technologies [
26,
27]. In these studies, we can detect if patients show increased saccadic and antisaccadic delays compared to healthy controls. This suggests that certain subtle motor impairments in PD, such as delays in eye movements, can be measured using digital tools.
For this, we included two types of time measurements in the online MoCA test: Instrumental Reaction Time (IRT) and Time to Submit (TTS). Specifically, we measured the time taken to interact with the interface (IRT) and to complete and submit answers (TTS) for each MoCA test question.
IRT and TTS were tracked for each question, presented individually. IRT measures the time from the presentation of a stimulus to the initiation of a response, capturing the cognitive processing period, and TTS records the total time from stimulus presentation to the completion and submission of a response. By design, both measures reflect cognitive decision-making and motor execution abilities.
IRT and TTS are measured in the front-end layer (closest to the user). Both values are on a millisecond scale, captured without network delays using a JavaScript method performance.now. These measures were integrated into the digital platform, tracking the response times of each participant as they interacted with the MoCA test.
2.5. Statistical Analysis
To analyze aggregated data, we used the IBM SPSS 29 software. We examined variables such as age, gender, UPDRS group scores, and MoCA scores. We compared these variables between healthy individuals and patients with Parkinson’s disease, with a p-value below 0.05 marked as significant.
2.6. Rough Set Theory
For data modeling, we used a method called rough set theory (RST). This is because earlier research shows that RST can be better than other machine learning methods for classifying diseases [
28].
Rough set theory (RST), introduced by Zdzisław Pawlak in the 1980s, is a mathematical approach to data analysis that deals with vagueness and uncertainty [
29,
30]. RST is particularly effective in identifying patterns within imprecise or incomplete information. It operates on the principle of approximating sets by a pair of lower and upper bounds, which represent the crisp sets of all definitely and possibly belonging elements, respectively.
The fundamental operations of RST are based on the concepts of lower and upper approximations. Given a set
within the universe
, the lower approximation
is the set of elements that are certainly in
based on the available information, while the upper approximation
includes elements that could possibly belong to
.
where
denotes the equivalence class of
under the equivalence relation
, exposing indiscernibility between objects in the context of available attributes.
Decision rules generated from RST analysis are in the form:
Decision rules derived from lower approximation sets represent certain conclusions, and decision rules derived from upper approximation sets represent uncertain conclusions. These rules can be directly interpreted, providing insights into the data’s underlying structure and decision-making logic.
Interestingly, RST is like the way primates, like humans, visually understand complex objects they have not seen before [
31]. When we see something new, our brain uses what it knows about other objects to guess what this object might be. Sometimes the new object may have features that do not match our existing knowledge, yet our brain gradually recognizes it using rule-based processes similar to RST. Likewise, RST-like mechanisms enable our brains to sort and interpret confusing or conflicting information, gradually narrowing down the gap between concepts of objects to their crisp images.
Intriguingly, this approach often yields better results than other classical machine learning approaches. An added value of RST is that the generated rules, unlike those from classical ML methods, can be easily interpreted by humans. Here, we used Rough Set Exploration System (RSES) 2.2.2 [
32]. In this software, we used a 3-fold cross-validation method to test 10 objects per iteration. This means that the data were split into three parts, where a classifier is built on the basis of the training set (random 21 objects) and evaluated on 10 independent and unseen objects.
2.7. Machine Learning Approach
To challenge the Rough Set Exploration System results, we implemented three classic machine learning models in Python using the scikit-learn (sklearn) library, which facilitates a range of machine learning tools. Additionally, we utilized complementary Python libraries for data manipulation and visualization, including pandas, seaborn, and matplotlib [
33,
34,
35,
36].
Here, we employed a train_test_split approach, allocating 30% of the data for testing before modelling. This split was performed randomly to ensure that 21 subjects were used for training and 10 independent subjects for testing.
We note that a small dataset generates a higher risk of overfitting, where the model learns the noise and specific details of the training data too well and performs poorly on new, unseen data. Therefore, to mitigate the risk of overfitting, we also implemented cross-validation techniques during the model training phase. This approach allowed us to assess the model’s performance more accurately and ensure its generalizability to new, unseen data.
Moreover, due to the risk of overfitting, we avoided more complex solutions like deep neural networks. Thus, we considered simpler models with regularization (e.g., L2). Specifically, we selected Logistic Regression, Support Vector Machine (SVM), and Random Forest models. The application of L2 regularization indirectly influences feature selection by shrinking the less important feature’s coefficients closer to zero, which helps in identifying more significant predictors. However, L2 regularization does not perform explicit feature elimination but rather adjusts the scale of contribution of each feature.
Each of these models has its strengths and weaknesses, and their performance can vary based on the specific characteristics of the dataset. Therefore, for a better overview of the performance, we analyzed and compared them side by side.
To address the consideration of hyperparameter tuning, we used GridSearchCV with cross-validation, and we limited the range and number of hyperparameters. We used a Stratified K-Fold cross-validation method that ensured the same proportion of classes in each fold. The dataset was balanced, meaning there was no need for synthetic oversampling techniques like SMOTE.
3. Results
The study involved a total of 31 participants, who were divided into two groups: the Parkinson’s disease (PD) group and the healthy subjects (HS) group.
3.1. Statistical Analysis
The PD group contained fifteen patients (eight females and seven males), with an average age of 70.8 years (standard deviation [SD] = 5.931). The reference group contained sixteen healthy subjects: four females and twelve males, with a mean age of 23.26 years (SD = 0.964).
The PD group had a slightly higher percentage of females, representing 53% of the participants. However, males were the majority of the reference group (75%) (
Table 1).
3.2. Data Profiling
The dataset includes thirty-one observations, and each observation has six variables. Categorical features were managed during preprocessing and modeling stages:
- (1)
The ‘gender’ variable was encoded as a binary categorical feature, with 0 representing male (M) and 1 representing female (F). This encoding was straightforward, given the binary nature of the aggregated data, and was directly utilized in machine learning models without further transformation.
- (2)
The ‘is_healthy’ variable was also a binary categorical feature indicating the health status of the subjects (0 for patients with Parkinson’s disease and 1 for healthy subjects). This binary encoding was chosen to enable clear distinction and modeling of health status as a response variable in predictive analyses.
- (3)
Although the ‘UPDRS Group’ variable was included in our dataset for a general overview, it was not used during the training of our models. The decision to exclude this variable from training was made because the UPDRS Group is related to the diagnosis and severity of Parkinson’s disease, which could introduce bias into the model when predicting the health status based on broader, non-diagnostic features. Its primary role was to provide context and depth to the clinical profile of the PD patients for the readers and was not intended as a feature for prediction.
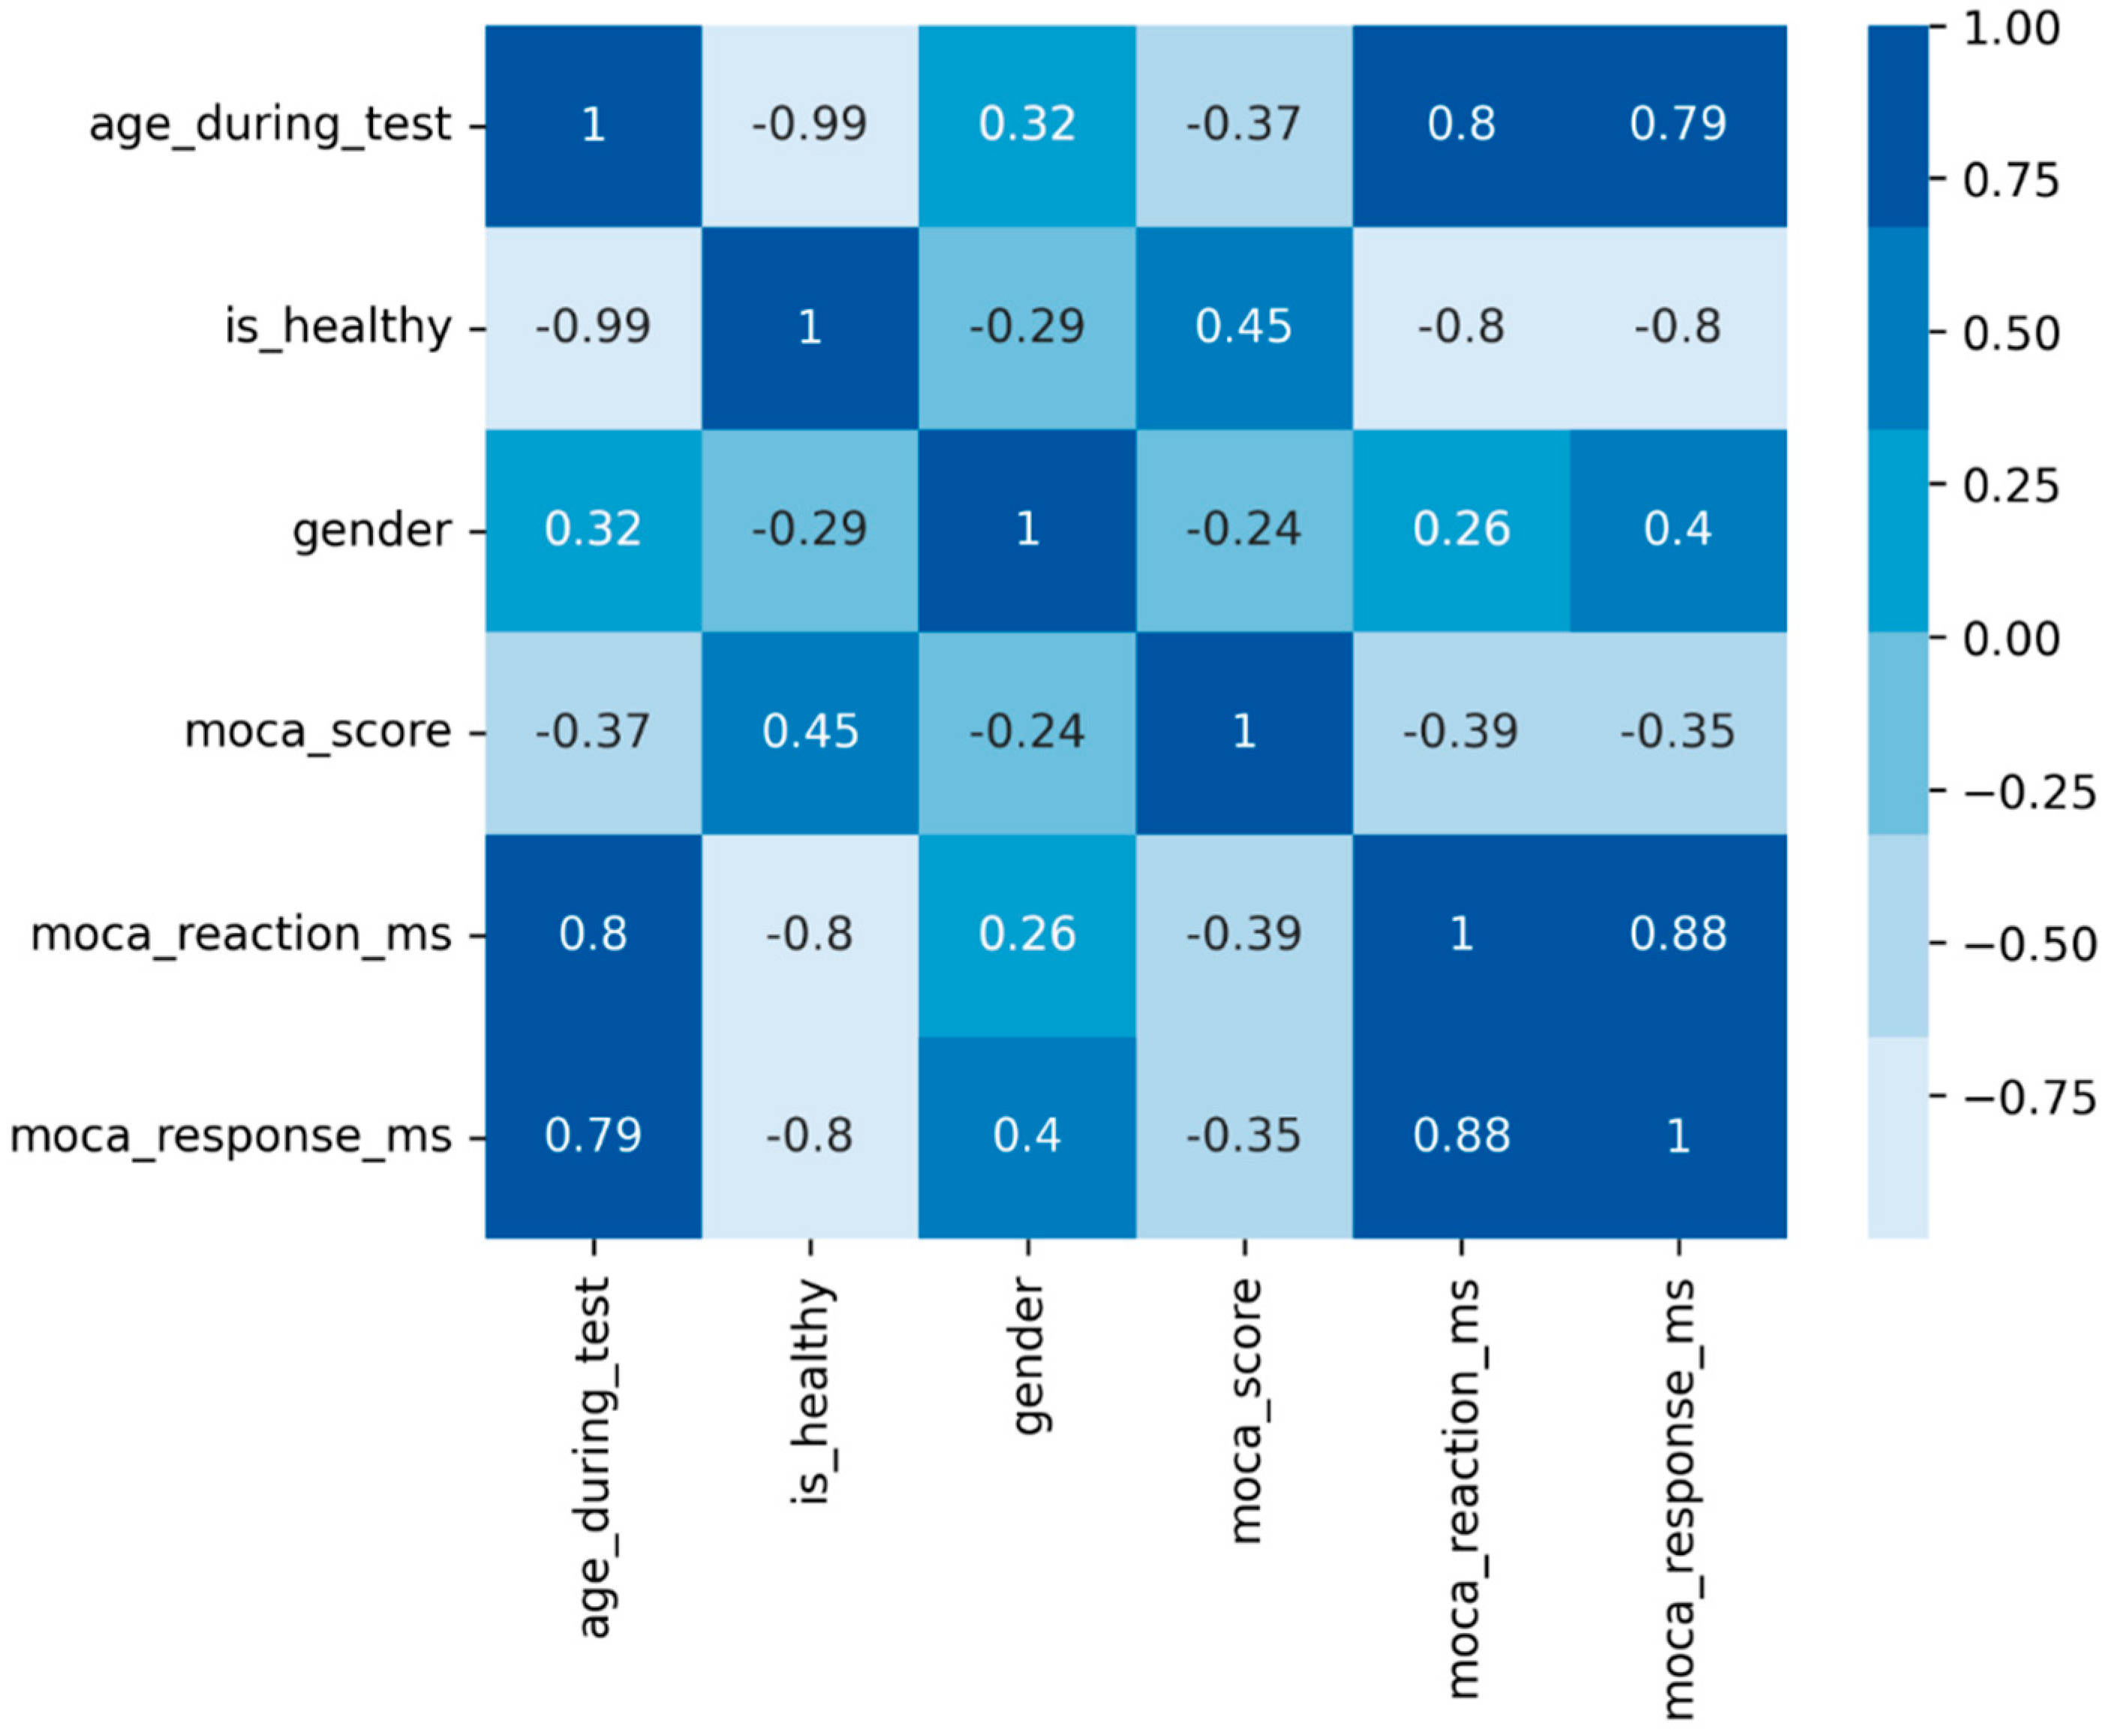
To suggest potential connections between variables, we used a matrix of Pearson correlation coefficients, showing that age is strongly negatively correlated with the healthy status and positively with IRT and TTS (
Figure 1).
There was a notable age gap among participants, with a strong correlation between age and health status. Preliminary analyses indicated that using age as a predictor would lead to a model that essentially segregates the data into two clusters based solely on age.
Finally, we conducted three experiments on the dataset. The goal was to calculate how distinguishable the web test results of PD patients and healthy subjects are. Surprisingly, unsupervised PD participants performed significantly better than we expected. Their average MoCA score was higher than noted in the literature, oscillating around 24 points, creating a challenge for classification methods.
3.3. Experiment I/III: Predict Health Status Based Solely on MoCA Score
The first experiment targeted the prediction of whether a participant is healthy based only on the total MoCA score. In predicting PD patients (0) using the MoCA score alone, the RSES model demonstrated effectiveness with total accuracy of 80% across all cases it evaluated, presenting its capability to classify individuals accurately (
Table 2 and
Figure 2). Specifically, the model’s performance when identifying healthy subjects (1) was perfect, with a 100% accuracy rate, showing its strength in recognizing individuals without PD. However, the specificity, or the model’s ability to correctly identify healthy individuals as healthy, was calculated as 57.13%.
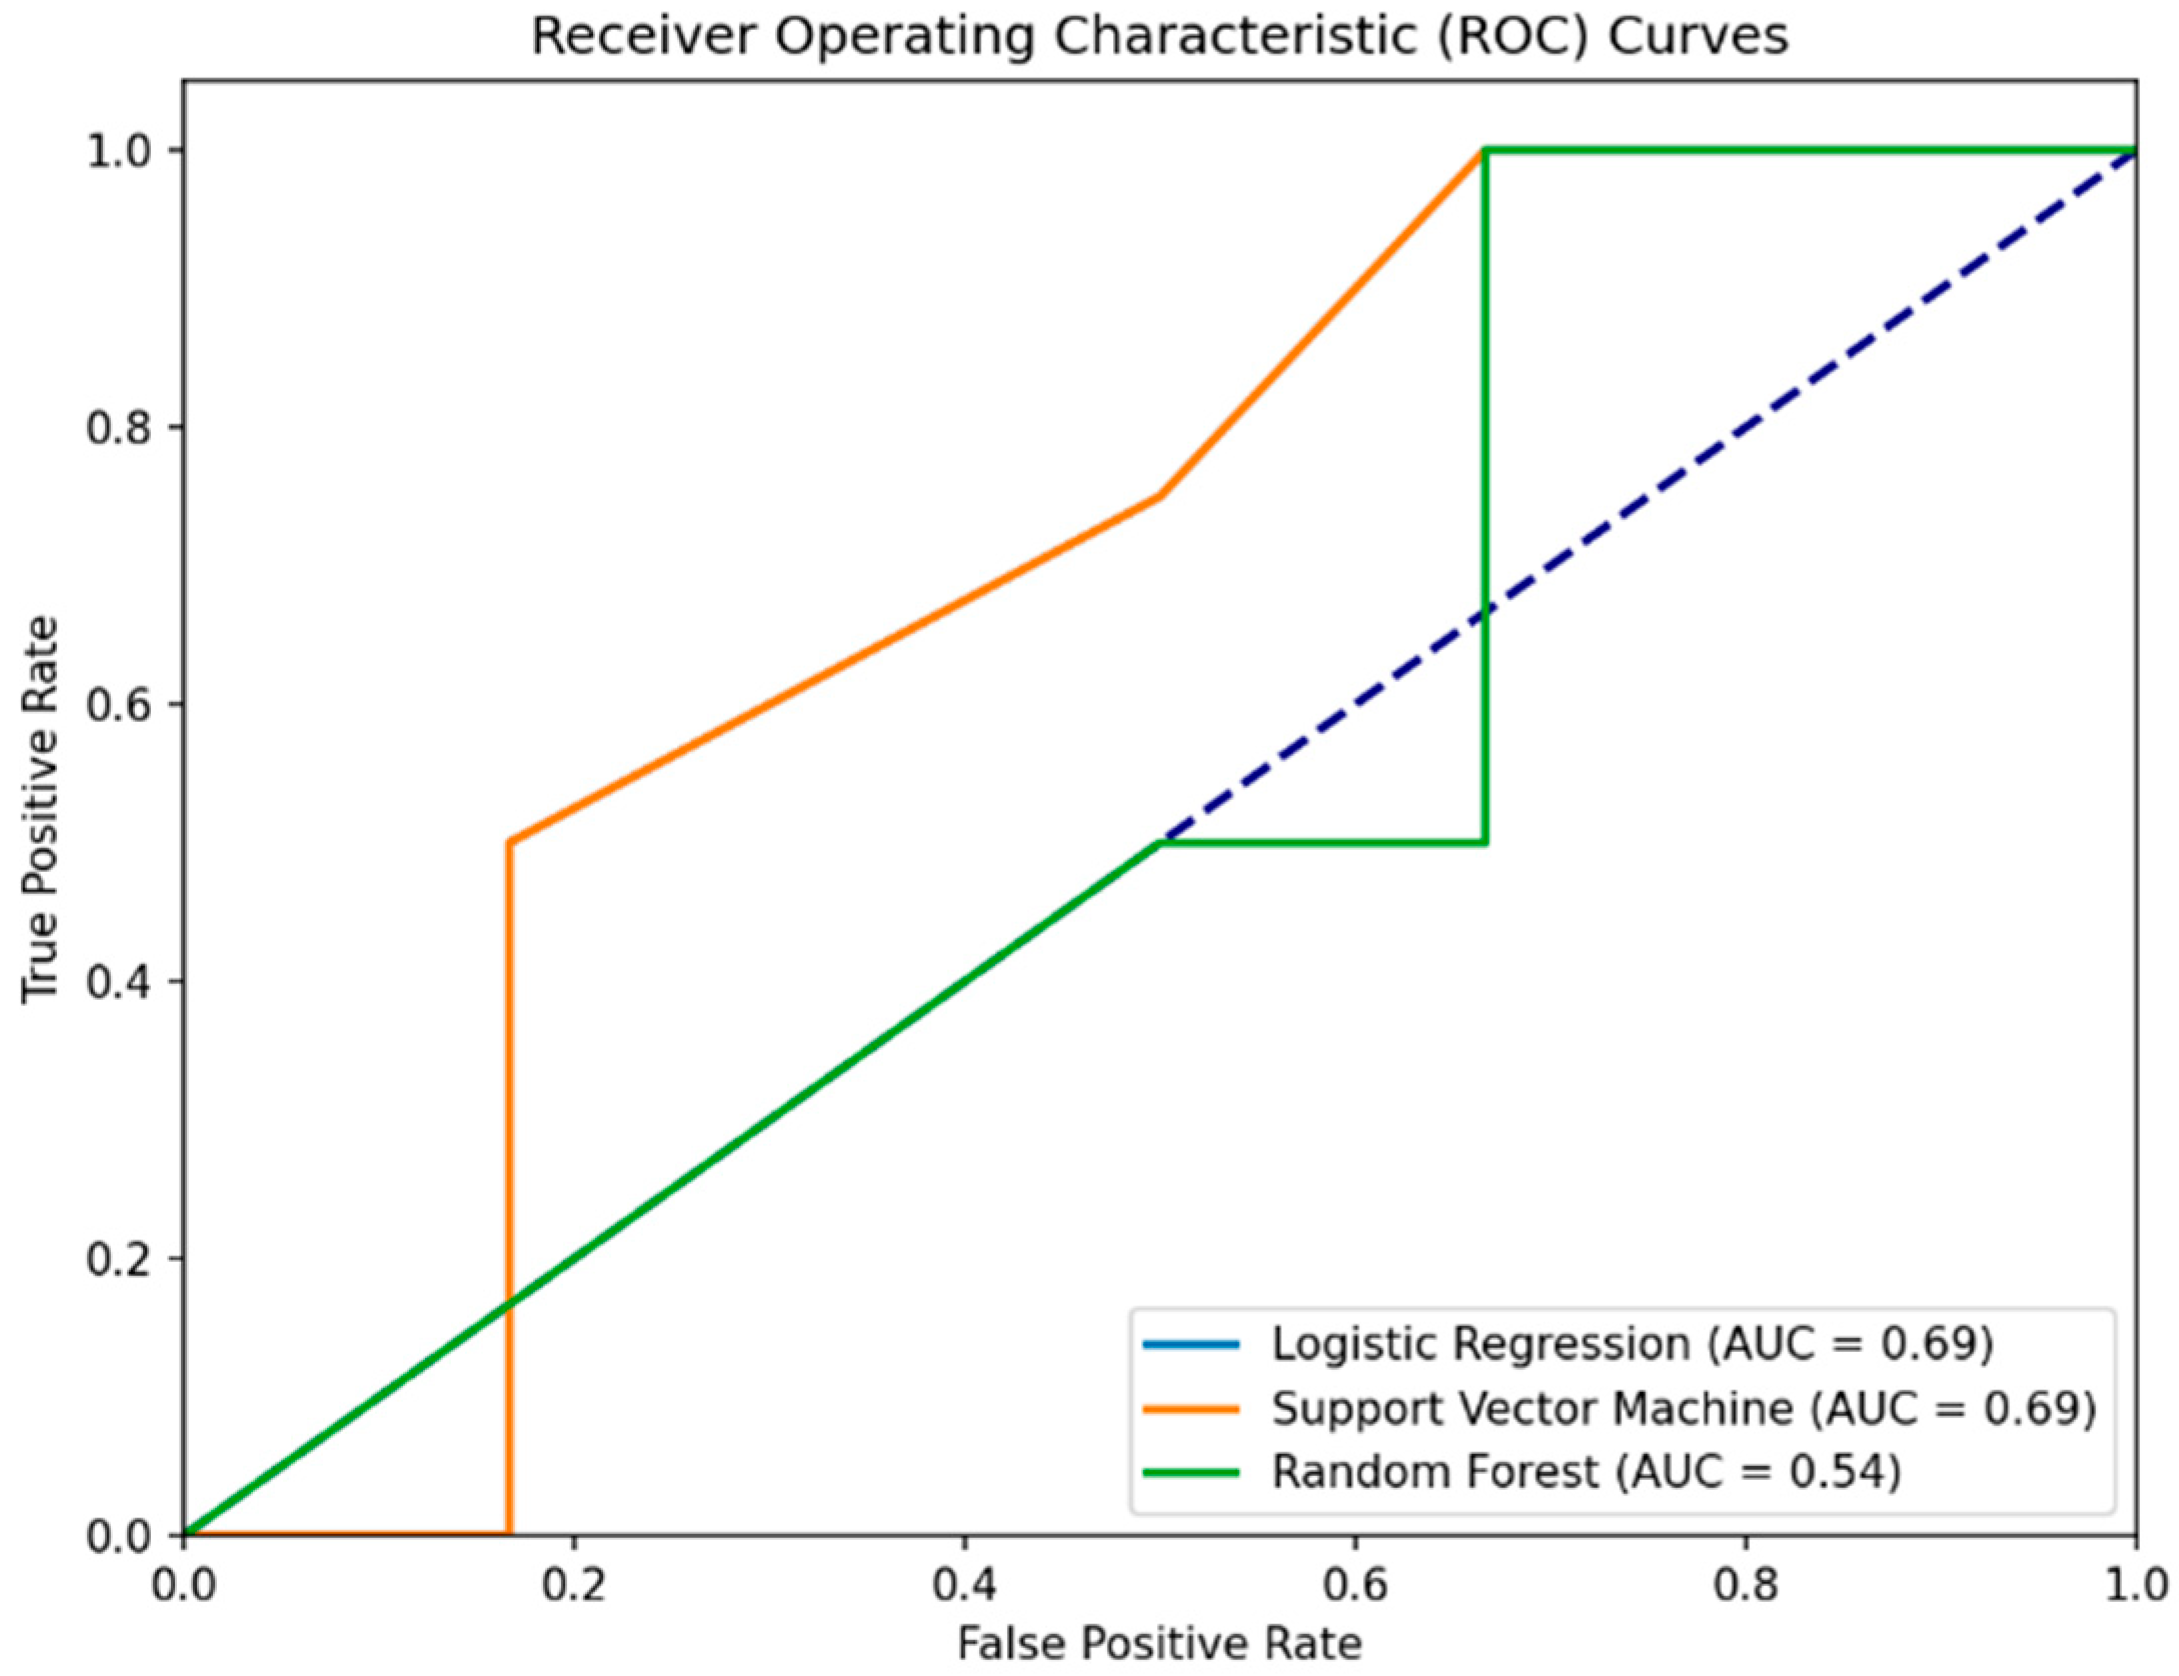
To validate, we used hyperparameter-tuned and cross-validated ML models, including Logistic Regression, Support Vector Machine (SVM), and Random Forest. Interestingly, all three models reported a 60% accuracy, which is 20% lower than the RSES model, showing a lesser ability to generalize the prediction of health status based on MoCA scores alone. When predicting health status using only the MoCA score, all ML models achieved a precision of 50%. This indicates that half of the positive predictions were incorrect, misclassifying healthy individuals as PD patients.
The recall of 100% across models suggests that all PD cases were correctly identified, echoing the RSES’s true positive rate but contrasting with its overall accuracy. The consistent confusion matrix results (2 TN, 4 FP, 0 FN, 4 TP) demonstrate the models’ tendency to misclassify healthy controls as PD patients, thus presenting specificity issues. The specificity for the Logistic Regression, Support Vector Machine, and Random Forest models in Experiment I/III is all 33.3%. This indicates that each model correctly identified 33.3% of the actual negatives (healthy subjects) as being healthy. This highlights a challenge in distinguishing between PD patients and healthy controls based solely on the MoCA score in this experimental setup.
In summary, the RSES model outperformed traditional ML methods in terms of accuracy in this specific experiment, presenting a potential in handling the predictive task with a limited set of features (MoCA score alone) (
Table 3). High recall across all methods highlights a common strength in identifying PD cases but also underscores a shared weakness in specificity, particularly evident in the ML methods where false positives were a significant issue.
3.4. Experiment II/III: Predict Health Status Based on MoCA Score and Gender
The second experiment targeted the prediction of whether a participant is healthy based on both the (a) MoCA score and (b) gender. This experiment examined whether the addition of gender as a predictive variable would enhance the model’s performance compared to using the MoCA score alone.
By focusing on gender, we wanted to develop models that could potentially identify health status indicators across more diverse and inclusive demographic profiles. This approach allows for the exploration of health determinants in settings where age may not be the primary factor of interest or where age information is not available.
Interestingly, the RSES analysis with the inclusion of gender showed a decrease in accuracy compared to the first experiment (80% to 70%). The detailed results indicate a mixed accuracy for different classes, with a significant true positive rate (the ability to correctly identify healthy individuals) but a lower accuracy for classifying PD patients (
Table 4). The specificity for the RSES model in Experiment II/III is approximately 0.875. This indicates that the RSES model correctly identified 87.5% of the actual healthy individuals as being healthy, demonstrating a better performance in distinguishing between PD patients and healthy controls than the model based solely on MoCA scores.
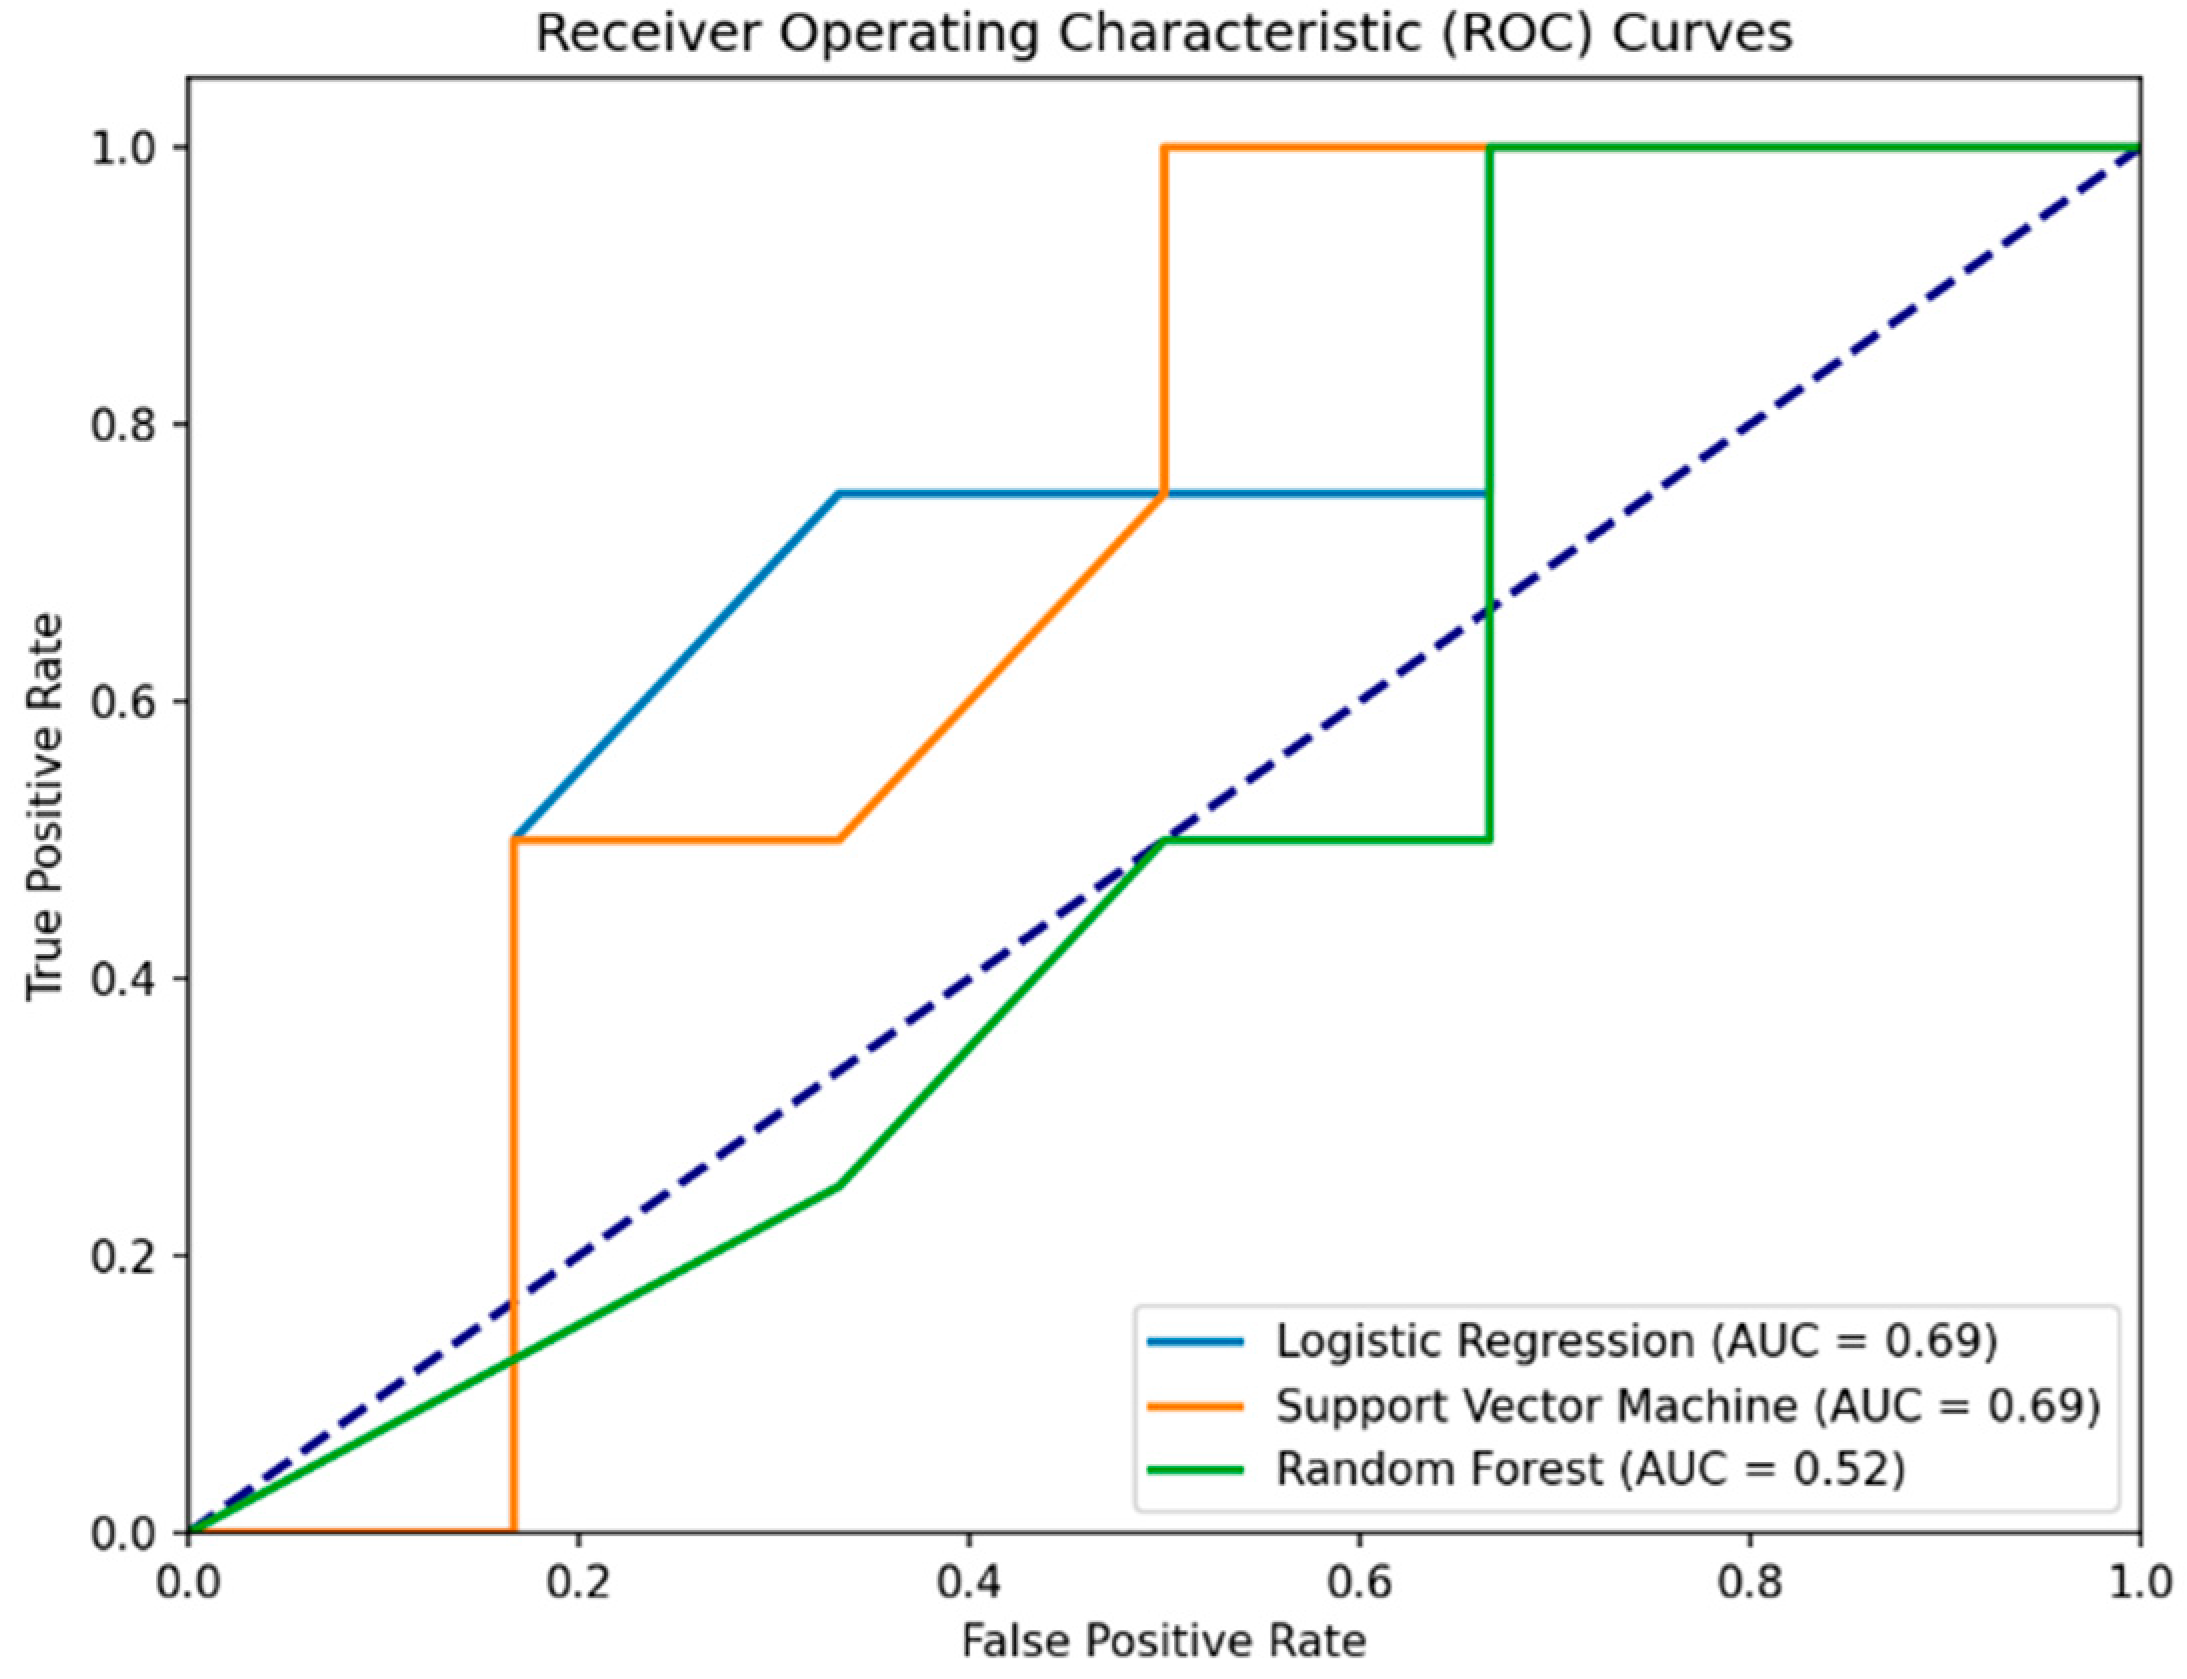
Surprisingly, the addition of gender as a predictive variable in Experiment II did not enhance the classical model’s performance as well. The Logistic Regression model, despite a high sensitivity (75%), showed a decrease in overall accuracy (50%) and precision (42.86%) when including gender, compared to its performance in the first experiment. SVM maintained its sensitivity at 100% but did not show an improvement in overall accuracy (60%) or precision (50%) with the inclusion of gender. Random Forest showed a significant decrease in performance across all metrics (accuracy = 40%, precision = 33.33%, sensitivity = 50%) compared to the first experiment.
The specificity for the Logistic Regression, Support Vector Machine, and Random Forest models in Experiment II is 0.333, or 33.3%. This indicates that each model correctly identified 33.3% of the actual healthy individuals (label 1) as being healthy, highlighting a challenge across all models in this experimental setup (
Table 5 and
Figure 3).
The results highlight the challenge in selecting features for predictive modeling, especially in small datasets. The inclusion of additional variables does not always lead to improved performance and may sometimes detract from the model’s accuracy due to overfitting or the introduction of noise.
To conclude, the addition of gender as a feature alongside MoCA scores does not seem to significantly improve the models’ performance, especially in the case of Random Forest, where accuracy decreases. However, the RSES model demonstrates a better balance in sensitivity when predicting between PD patients and healthy individuals compared to the individual ML models, although with a slight drop in overall accuracy compared to Experiment I/III.
3.5. Experiment III/III: Predict Health Status Based on MoCA Score and IRT + TTS
The third experiment targeted the prediction of whether a participant is healthy based the (a) MoCA score, (b) IRT, and (c) TTS. This experiment examined whether the addition of temporal measures as a predictive variable would enhance the model’s performance compared to using the MoCA score alone.
Importantly, the RSES analysis with the inclusion of temporal values showed an increase in accuracy compared to the first experiment (80% to 93%). The detailed results indicate a high accuracy for different classes, with a significant true positive rate and higher accuracy for classifying PD patients (
Table 6). The specificity for the RSES model in Experiment III/III is approximately 0.934. This indicates that the RSES model correctly identified 93.4% of the actual healthy individuals as being healthy, demonstrating a better performance in distinguishing between PD patients and healthy controls than based solely on MoCA scores, or MoCA scores together with gender.
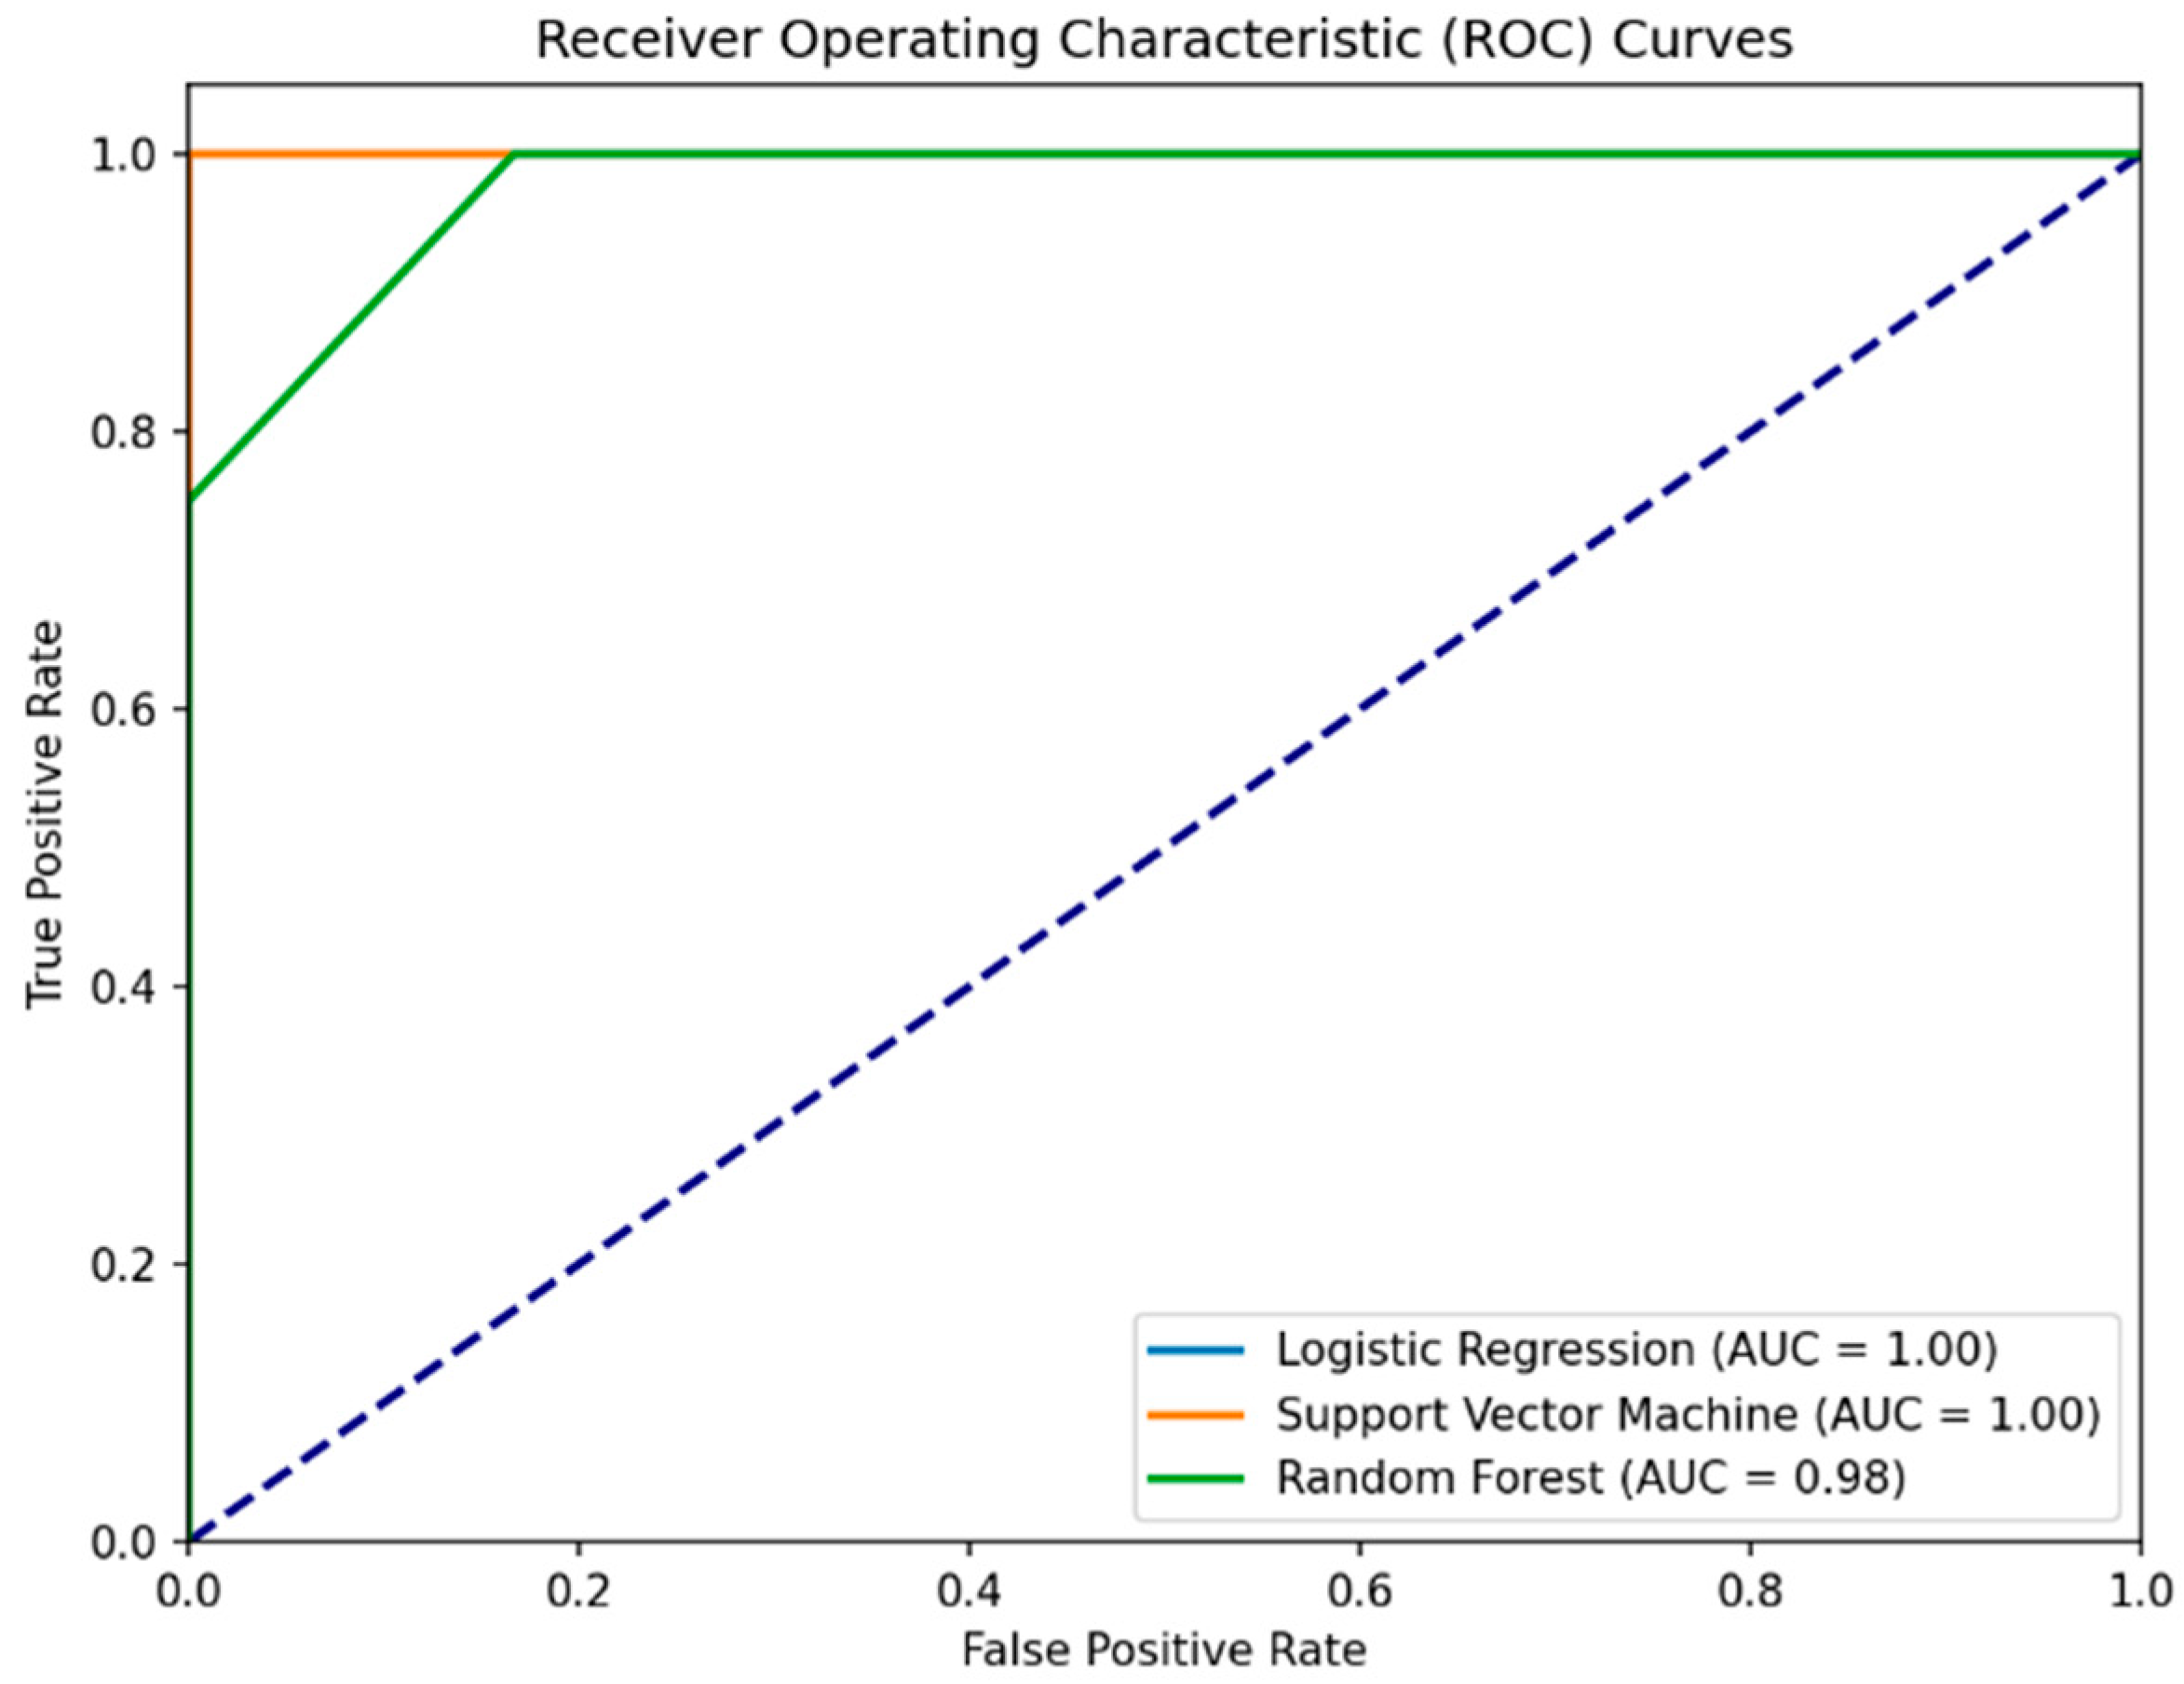
The addition of temporal measures as a predictive variable in Experiment III enhanced the classical model’s performance as well. The Logistic Regression model achieved perfect sensitivity (100%) and showed an increase in overall accuracy (93%) and precision (80%). SVM maintained its sensitivity at 100% and showed an improvement in overall accuracy (90%) and precision (80%) with the inclusion of IRT and TTS. Random Forest showed a significant increase in performance across all metrics (accuracy = 90%, precision = 100%, sensitivity = 75%) compared to the first and second experiments. The specificity for all ML models also increased. For the Logistic Regression and Support Vector Machine, this value increased to 83.3%, and Random Forest achieved a perfect (100%) specificity score.
In summary, Experiment III analyzed the impact of adding Instrumental Reaction Time and Time to Submit to MoCA scores for prediction of health status. The RSES model achieved a 93% accuracy and sensitivity rate. Machine learning models like Logistic Regression, Support Vector Machine, and Random Forest also showed marked improvements in their predictive capabilities (
Table 7 and
Figure 4). Specifically, Random Forest demonstrated perfect specificity, suggesting that temporal measures significantly enhance the model’s ability to correctly identify healthy individuals.
The results from Experiment III seem very promising. The AUC values provided for the models in the ROC curves suggest near-perfect or perfect classification ability. Understandably, to confirm the model’s predictive accuracy, additional validation using an independent dataset or through a longitudinal prospective study is recommended. We plan future studies with larger samples to confirm these findings and explore other variables that may influence the results.
4. Discussion
We examined the predictive accuracy of health status based on MoCA scores. Experiment I focused solely on MoCA scores, Experiment II added gender as a variable, and Experiment III included IRT and TTS, alongside MoCA scores. The inclusion of temporal variables, as presented in Experiment III, highlighted how behavioral and temporal data can significantly refine the models’ predictive capabilities.
Initially, experiments revealed surprising specificity issues, especially when models were relying solely on MoCA scores. Interestingly, this aligns with the findings about the specificity issues of the Montreal Cognitive Assessment. The literature specifically mentions that while MoCA is good at detecting dementia (high sensitivity), it also produces a high number of false positives (low specificity). This means it often incorrectly identifies people as having dementia when they do not.
This issue was particularly raised by Davis et al. (2021), in their systematic review. They analyzed the accuracy of the MoCA test in detecting dementia across seven studies involving 9422 participants [
37]. Their findings highlighted a significant concern; over 40% of non-demented individuals were falsely identified as having dementia at the MoCA cut-off of less than 26 points. These findings are in line with the trends we saw in this study.
Furthermore, Rosenblum et al. (2020) highlight the challenges in accurately identifying mild cognitive impairment in Parkinson’s disease (PD-MCI) using MoCA [
38]. They emphasize that factors such as age, gender, and education significantly influence the test’s accuracy, complicating the early-stage diagnosis of PD-MCI. This reinforces the notion that MoCA, while useful, has limitations in distinguishing between PD-MCI and normal aging or other conditions, especially when demographic variables are significant.
Collectively, insights from the literature validate the patterns we observed in this study and suggest a potential limitation of MoCA’s effectiveness, particularly in diverse settings and populations, including the described web-based approach.
Hence, this research advocates for the integration of additional assessment tools or parameters alongside MoCA to enhance diagnostic accuracy. This is significant in advancing the field of cognitive assessment, encouraging a more comprehensive approach that accounts for individual differences.
The findings are particularly crucial for PD-MCI identification, and they show the need for a nuanced approach that considers demographic and behavioral factors. Accordingly, this research suggests that relying solely on MoCA may lead to misdiagnoses or overlooked cases in PD patients.
Importantly, the insights gained from this study can extend to other cognitive assessment tools. They prompt a re-evaluation of current practices and encourage the development of more inclusive and accurate assessment strategies, particularly in digital health platforms.
Furthermore, this study underscores the limitations of MoCA in accurately diagnosing cognitive impairment across different age groups and in web-based settings. This is significant because it challenges the one-size-fits-all approach to cognitive assessment and calls for more personalized or adaptable testing methods.
It is important to acknowledge the limitations of this study. These include the small size of the research groups, potentially limiting the generalizability of these findings. The demographic diversity of the described sample may not fully represent the broader population, particularly in terms of age, gender, ethnicity, and education. The use of a web-based platform for MoCA assessment has its constraints and may not accurately replicate the nuances of an in-person testing environment.
The study’s focus on a single tool, MoCA, may not encompass the multifaceted nature of cognitive impairments. The absence of longitudinal data prevents us from observing changes over time. External variables that could affect cognitive performance were not fully controlled. Finally, interpreting interactions in a web-based format poses unique challenges in understanding the complete cognitive assessment scenario.
Therefore, research should aim to address these limitations by including larger, more diverse study groups, employing a combination of cognitive assessment tools, and potentially incorporating longitudinal designs to track cognitive changes over time. Further, more detailed research is crucial for progress in the prevention of neurodegenerative diseases.
5. Conclusions
The advancement of this field of research can be achieved with the integration of time-based measurements and rough set theory. These methods significantly enhance the precision of the Montreal Cognitive Assessment in differentiating between individuals with Parkinson’s disease and healthy subjects. This enhancement is shown by an improvement in diagnostic accuracy (80.0% to 93.4%) and precision (57.2% to 93.4%). The use of RST allowed for the development of rule-based models that are more adaptable and sensitive to the nuances in cognitive assessment.
An important insight from this research is the role of movement slowness associated with PD in cognitive assessment. This suggests that cognitive assessments, particularly for conditions like PD, should not be isolated from other symptom dimensions.
In conclusion, the results of this study advocate for a more integrative approach in cognitive assessments, where temporal dynamics and other symptomatic features are considered alongside traditional cognitive measures. Future research should explore similar integrative approaches in other neurodegenerative conditions and different assessment settings, including more extensive web-based platforms.
Author Contributions
Conceptualization, A.C. and A.W.P.; methodology, A.W.P.; software, A.C.; validation, A.W.P.; formal analysis, A.C.; investigation, A.C. and A.W.P.; writing—original draft preparation, A.C.; writing—review and editing, A.C.; visualization, A.C.; supervision, A.W.P.; All authors have read and agreed to the published version of the manuscript.
Funding
This research received no external funding.
Institutional Review Board Statement
The study was reviewed and approved by two groups: the Institutional Review Board at UMass Chan Medical School (protocol code: IRB H0008962) and the Ethics Committee at the Polish Japanese Academy of Information Technology (protocol code: OKE-02-06-2022) to ensure compliance with the Declaration of Helsinki.
Informed Consent Statement
Informed consent was obtained from all subjects involved in the study.
Data Availability Statement
The data presented in this study are available on request from the corresponding author due to privacy and legal reasons.
Acknowledgments
The authors would like to thank all the participants who were involved in this study, including patients and doctors from UMass Chan Medical School and the students from the Polish Japanese Academy of Information Technology.
Conflicts of Interest
The authors declare no conflicts of interest.
References
- Taipa, R.; Pinho, J.; Melo-Pires, M. Clinico-Pathological Correlations of the Most Common Neurodegenerative Dementias. Front. Neurol. 2012, 3, 68. [Google Scholar] [CrossRef] [PubMed]
- Mari, Z.; Mestre, T.A. The Disease Modification Conundrum in Parkinson’s Disease: Failures and Hopes. Front. Aging Neurosci. 2022, 14, 810860. [Google Scholar] [CrossRef] [PubMed]
- Homayoun, H. Parkinson Disease. Ann. Intern. Med. 2018, 169, ITC33–ITC48. [Google Scholar] [CrossRef] [PubMed]
- Walia, V.; Gakkhar, A.; Garg, M. Parkinson’s Disease: A Progressive Disorder of the Nervous System That Affects Movement. In Handbook of Research on Critical Examinations of Neurodegenerative Disorders; IGI Global: Hershey, PA, USA, 2019; pp. 252–273. [Google Scholar] [CrossRef][Green Version]
- Donkelaar, H.J.T.; van de Warrenburg, B.; Willemsen, M.; Küsters, B.; Hashizume, Y.; Hori, A. Basal Ganglia. In Clinical Neuroanatomy; Springer International Publishing: Cham, Switzerland, 2020; pp. 591–667. [Google Scholar] [CrossRef]
- German, D.C.; Manaye, K.; Smith, W.K.; Woodward, D.J.; Saper, C.B. Midbrain dopaminergic cell loss in parkinson’s disease: Computer visualization. Ann. Neurol. 1989, 26, 507–514. [Google Scholar] [CrossRef] [PubMed]
- Yilmaz, R.; Hopfner, F.; van Eimeren, T.; Berg, D. Biomarkers of Parkinson’s disease: 20 years later. J. Neural Transm. 2019, 126, 803–813. [Google Scholar] [CrossRef] [PubMed]
- Kobro-Flatmoen, A.; Lagartos-Donate, M.J.; Aman, Y.; Edison, P.; Witter, M.P.; Fang, E.F. Re-emphasizing early Alzheimer’s disease pathology starting in select entorhinal neurons, with a special focus on mitophagy. Ageing Res. Rev. 2021, 67, 101307. [Google Scholar] [CrossRef] [PubMed]
- Grayson, M. Parkinson’s disease. Nature 2016, 538, S1. [Google Scholar] [CrossRef] [PubMed]
- Rizzi, G.; Tan, K.R. Dopamine and Acetylcholine, a Circuit Point of View in Parkinson’s Disease. Front. Neural Circuits 2017, 11, 110. [Google Scholar] [CrossRef] [PubMed]
- Li, F.; Qin, W.; Zhu, M.; Jia, J. Model-Based Projection of Dementia Prevalence in China and Worldwide: 2020–2050. J. Alzheimer’s Dis. 2021, 82, 1823–1831. [Google Scholar] [CrossRef] [PubMed]
- Nichols, E.; Steinmetz, J.D.; Vollset, S.E.; Fukutaki, K.; Chalek, J.; Abd-Allah, F.; Abdoli, A.; Abualhasan, A.; Abu-Gharbieh, E.; Akram, T.T.; et al. Estimation of the global prevalence of dementia in 2019 and forecasted prevalence in 2050: An analysis for the Global Burden of Disease Study 2019. Lancet Public Health 2022, 7, e105–e125. [Google Scholar] [CrossRef] [PubMed]
- Hobson, J. The Montreal Cognitive Assessment (MoCA). Occup. Med. 2015, 65, 764–765. [Google Scholar] [CrossRef] [PubMed]
- Zadikoff, C.; Fox, S.H.; Tang-Wai, D.F.; Thomsen, T.; de Bie, R.M.; Wadia, P.; Miyasaki, J.; Duff-Canning, S.; Lang, A.E.; Marras, C. A comparison of the mini mental state exam to the montreal cognitive assessment in identifying cognitive deficits in Parkinson’s disease. Mov. Disord. 2008, 23, 297–299. [Google Scholar] [CrossRef] [PubMed]
- Smith, T.; Gildeh, N.; Holmes, C. The Montreal Cognitive Assessment: Validity and Utility in a Memory Clinic Setting. Can. J. Psychiatry 2007, 52, 329–332. [Google Scholar] [CrossRef] [PubMed]
- Kandiah, N.; Zhang, A.; Cenina, A.R.; Au, W.L.; Nadkarni, N.; Tan, L.C. Montreal Cognitive Assessment for the screening and prediction of cognitive decline in early Parkinson’s disease. Park. Relat. Disord. 2014, 20, 1145–1148. [Google Scholar] [CrossRef] [PubMed]
- Abdolahi, A.; Bull, M.T.; Darwin, K.C.; Venkataraman, V.; Grana, M.J.; Dorsey, E.R.; Biglan, K.M. A feasibility study of conducting the Montreal Cognitive Assessment remotely in individuals with movement disorders. Health Inform. J. 2016, 22, 304–311. [Google Scholar] [CrossRef] [PubMed]
- Kang, J.M.; Cho, Y.-S.; Park, S.; Lee, B.H.; Sohn, B.K.; Choi, C.H.; Choi, J.-S.; Jeong, H.Y.; Cho, S.-J.; Lee, J.-H.; et al. Montreal cognitive assessment reflects cognitive reserve. BMC Geriatr. 2018, 18, 261. [Google Scholar] [CrossRef]
- Borda, M.G.; Reyes-Ortiz, C.; Pérez-Zepeda, M.U.; Patino-Hernandez, D.; Gómez-Arteaga, C.; Cano-Gutiérrez, C.A. Educational level and its Association with the domains of the Montreal Cognitive Assessment Test. Aging Ment. Health 2019, 23, 1300–1306. [Google Scholar] [CrossRef] [PubMed]
- Gagnon, G.; Hansen, K.T.; Woolmore-Goodwin, S.; Gutmanis, I.; Wells, J.; Borrie, M.; Fogarty, J. Correcting the MoCA for Education: Effect on Sensitivity. Can. J. Neurol. Sci./J. Can. Sci. Neurol. 2013, 40, 678–683. [Google Scholar] [CrossRef] [PubMed]
- Cooley, S.A.; Heaps, J.M.; Bolzenius, J.D.; Salminen, L.E.; Baker, L.M.; Scott, S.E.; Paul, R.H. Longitudinal Change in Performance on the Montreal Cognitive Assessment in Older Adults. Clin. Neuropsychol. 2015, 29, 824–835. [Google Scholar] [CrossRef] [PubMed]
- Youngmann, B.; Allerhand, L.; Paltiel, O.; Yom-Tov, E.; Arkadir, D. A machine learning algorithm successfully screens for Parkinson’s in web users. Ann. Clin. Transl. Neurol. 2019, 6, 2503–2509. [Google Scholar] [CrossRef]
- Kim, S.; Cho, M.; Lee, Y. Point-of-Care Platform for Early Diagnosis of Parkinson’s Disease. ACS Appl. Bio Mater. 2020, 3, 8997–9001. [Google Scholar] [CrossRef] [PubMed]
- Nair, S.S.; Muddapu, V.R.J.; Sriram, M.; Aditya, R.; Gupta, R.; Chakravarthy, S. Is There a Better Way to Assess Parkinsonian Motor Symptoms?—Experimental and Modelling Approach. In Techniques for Assessment of Parkinsonism for Diagnosis and Rehabilitation; Springer: Singapore, 2022. [Google Scholar] [CrossRef]
- Ryu, J.; Vero, J.; Dobkin, R.D.; Torres, E.B. Dynamic digital biomarkers of motor and cognitive function in parkinson’s disease. J. Vis. Exp. 2019, e59827. [Google Scholar] [CrossRef]
- Chudzik, A.; Śledzianowski, A.; Przybyszewski, A.W. Machine Learning and Digital Biomarkers Can Detect Early Stages of Neurodegenerative Diseases. Sensors 2024, 24, 1572. [Google Scholar] [CrossRef] [PubMed]
- Przybyszewski, A.W.; Śledzianowski, A.; Chudzik, A.; Szlufik, S.; Koziorowski, D. Machine Learning and Eye Movements Give Insights into Neurodegenerative Disease Mechanisms. Sensors 2023, 23, 2145. [Google Scholar] [CrossRef] [PubMed]
- Przybyszewski, A.W.; Chudzik, A.; Szlufik, S.; Habela, P.; Koziorowski, D.M. Comparison of Different Data Mining Methods to Determine Disease Progression in Dissimilar Groups of Parkinson’s Patients. Fundam. Inform. 2020, 176, 167–181. [Google Scholar] [CrossRef]
- Pawlak, Z. Rough sets. Int. J. Comput. Inf. Sci. 1982, 11, 341–356. [Google Scholar] [CrossRef]
- Pawlak, Z. Rough Sets: Theoretical Aspects of Reasoning about Data; Springer Science & Business Media: Dordrecht, The Netherlands, 1991; Volume 9. [Google Scholar]
- Przybyszewski, A.W.; Gaska, J.P.; Foote, W.; Pollen, D.A. Striate cortex increases contrast gain of macaque LGN neurons. Vis. Neurosci. 2000, 17, 485–494. [Google Scholar] [CrossRef] [PubMed]
- Bazan, J.G.; Szczuka, M. The rough set exploration system. In Transactions on Rough Sets III; Lecture Notes in Computer Science (including subseries Lecture Notes in Artificial Intelligence and Lecture Notes in Bioinformatics); Springer: Berlin/Heidelberg, Germany, 2005; Volume 3400. [Google Scholar] [CrossRef]
- Pedregosa, F.; Varoquaux, G.; Gramfort, A.; Michel, V.; Thirion, B.; Grisel, O.; Blondel, M.; Prettenhofer, P.; Weiss, R.; Dubourg, V.; et al. Scikit-learn: Machine learning in Python. J. Mach. Learn. Res. 2011, 12, 2825–2830. [Google Scholar]
- McKinney, W. Data Structures for Statistical Computing in Python. In Proceedings of the 9th Python in Science Conference, Austin, TX, USA, 28 June–3 July 2010; pp. 51–56. [Google Scholar] [CrossRef]
- Waskom, M.L. seaborn: Statistical data visualization. J. Open Source Softw. 2021, 6, 3021. [Google Scholar] [CrossRef]
- Hunter, J.D. Matplotlib: A 2D graphics environment. Comput. Sci. Eng. 2007, 9, 90–95. [Google Scholar] [CrossRef]
- Davis, D.H.; Creavin, S.T.; Yip, J.L.; Noel-Storr, A.H.; Brayne, C.; Cullum, S. Montreal Cognitive Assessment for the detection of dementia. Emergencias 2021, 2021, CD010775. [Google Scholar] [CrossRef]
- Rosenblum, S.; Meyer, S.; Gemerman, N.; Mentzer, L.; Richardson, A.; Israeli-Korn, S.; Livneh, V.; Karmon, T.F.; Nevo, T.; Yahalom, G.; et al. The Montreal Cognitive Assessment: Is It Suitable for Identifying Mild Cognitive Impairment in Parkinson’s Disease? Mov. Disord. Clin. Pract. 2020, 7, 648–655. [Google Scholar] [CrossRef] [PubMed]
Figure 1.
Correlation matrix. The similarity of all paired parameters is correlated with the color of the cell in the matrix.
Figure 1.
Correlation matrix. The similarity of all paired parameters is correlated with the color of the cell in the matrix.
Figure 2.
Comparative ROC curves for Logistic Regression, Support Vector Machine, and Random Forest models predicting health status from MoCA scores. The Logistic Regression curve (blue line) is covered by the Support Version Machine curve. The purple dashed line represents the baseline performance of a random classifier (random chance line).
Figure 3.
ROC curves for machine learning models predicting health status using MoCA scores and gender as features. The purple dashed line represents the baseline performance of a random classifier (random chance line).
Figure 3.
ROC curves for machine learning models predicting health status using MoCA scores and gender as features. The purple dashed line represents the baseline performance of a random classifier (random chance line).
Figure 4.
Enhanced ROC curves for Logistic Regression, Support Vector Machine, and Random Forest models predicting health status using MoCA scores, IRT, and TTS. The Logistic Regression curve is covered by the Support Version Machine curve. The Logistic Regression curve (blue line) is covered by the Support Version Machine curve. The purple dashed line represents the baseline performance of a random classifier (random chance line).
Table 1.
Comparison of the characteristics of patients and healthy subjects.
Table 1.
Comparison of the characteristics of patients and healthy subjects.
| Variable | PD Patients (n = 15) | Healthy Subjects (n = 16) | p-Value |
|---|
| Age | 70.80 ± 5.931 | 23.26 ± 0.964 | <0.001 |
| Gender (0 = M, 1 = F) | 0.53 ± 0.516 | 0.25 ± 0.447 | 0.115 |
| UPDRS Group (0 = HS, 1 = MILD, 2 = ADV) | 1.47 ± 0.516 | 0 ± 0 | <0.001 |
| Web MoCA Score (total) | 24.13 ± 3.543 | 26.69 ± 1.302 | 0.017 |
| Web MoCA IRT (avg, ms) | 5896.27 ± 1514.26 | 2894.25 ± 646.974 | <0.001 |
| Web MoCA TTS (avg, ms) | 13,667.00 ± 3445.42 | 6881.37 ± 1589.145 | <0.001 |
Table 2.
Confusion matrix for predicting participant status (is_healthy = 0/1) based on the MoCA score using the RSES model, detailing the total number of tested objects (10), total accuracy (0.8), and coverage (1.0).
Table 2.
Confusion matrix for predicting participant status (is_healthy = 0/1) based on the MoCA score using the RSES model, detailing the total number of tested objects (10), total accuracy (0.8), and coverage (1.0).
| | | Predicted | | | |
|---|
| | | 0 | 1 | No. of Obj. | Accuracy | Coverage |
|---|
| Actual | 0 | 2.67 | 2.00 | 4.67 | 0.607 | 1.000 |
| 1 | 0 | 5.33 | 5.33 | 1.000 | 1.000 |
| | True positive rate | 1.00 | 0.72 | | | |
Table 3.
Comparison of model performance in Experiment I/III.
Table 3.
Comparison of model performance in Experiment I/III.
| Model Name and Hyper Tuned Parameters | Accuracy | Precision | Sensitivity | Specificity |
|---|
| RSES | 0.8 | 0.727 | 0.86 | 0.572 |
| Logistic Regression {‘C’: 1} | 0.6 | 0.500 | 1.00 | 0.333 |
| SVM {‘C’: 0.1, ‘gamma’: 0.01} | 0.6 | 0.500 | 1.00 | 0.333 |
| Random Forest {‘n_estimators’: 4} | 0.6 | 0.500 | 1.00 | 0.333 |
Table 4.
Confusion matrix for predicting participant status (is_healthy = 0/1) based on the MoCA score and gender using the RSES model, detailing the total number of tested objects (10), total accuracy (0.7), and coverage (1.0).
Table 4.
Confusion matrix for predicting participant status (is_healthy = 0/1) based on the MoCA score and gender using the RSES model, detailing the total number of tested objects (10), total accuracy (0.7), and coverage (1.0).
| | | Predicted | | | |
|---|
| | | 0 | 1 | No. of Obj. | Accuracy | Coverage |
|---|
| Actual | 0 | 2.33 | 2.33 | 4.67 | 0.389 | 1.000 |
| 1 | 0.67 | 4.67 | 5.33 | 0.917 | 1.000 |
| | True positive rate | 0.67 | 0.66 | | | |
Table 5.
Comparison of model performance in Experiment II/III.
Table 5.
Comparison of model performance in Experiment II/III.
| Model Name and Hyper Tuned Parameters | Accuracy | Precision | Sensitivity | Specificity |
|---|
| RSES | 0.7 | 0.667 | 0.500 | 0.875 |
| Logistic Regression {‘C’: 1} | 0.5 | 0.429 | 0.750 | 0.333 |
| SVM {‘C’: 0.1, ‘gamma’: 0.01} | 0.6 | 0.500 | 1.000 | 0.333 |
| Random Forest {‘n_estimators’: 5} | 0.4 | 0.333 | 0.500 | 0.333 |
Table 6.
Confusion matrix for predicting participant status (is_healthy = 0/1) based on the MoCA score, IRT, and TTS using the RSES model, detailing the total number of tested objects (10), total accuracy (0.93), and coverage (1.0).
Table 6.
Confusion matrix for predicting participant status (is_healthy = 0/1) based on the MoCA score, IRT, and TTS using the RSES model, detailing the total number of tested objects (10), total accuracy (0.93), and coverage (1.0).
| | | Predicted | | | |
|---|
| | | 0 | 1 | No. of Obj. | Accuracy | Coverage |
|---|
| Actual | 0 | 4.67 | 0.33 | 5 | 0.933 | 1.000 |
| 1 | 0.33 | 4.67 | 5 | 0.933 | 1.000 |
| | True positive rate | 0.93 | 0.93 | | | |
Table 7.
Comparison of model performance in Experiment III/III.
Table 7.
Comparison of model performance in Experiment III/III.
| Model Name and Hyper Tuned Parameters | Accuracy | Precision | Sensitivity | Specificity |
|---|
| RSES | 0.933 | 0.934 | 0.93 | 0.934 |
| Logistic Regression {‘C’: 0.01} | 0.900 | 0.800 | 1.00 | 0.833 |
| SVM {‘C’: 0.01, ‘gamma’: 0.01} | 0.900 | 0.800 | 1.00 | 0.833 |
| Random Forest {‘n_estimators’: 2} | 0.900 | 1.000 | 0.75 | 1.000 |
| Disclaimer/Publisher’s Note: The statements, opinions and data contained in all publications are solely those of the individual author(s) and contributor(s) and not of MDPI and/or the editor(s). MDPI and/or the editor(s) disclaim responsibility for any injury to people or property resulting from any ideas, methods, instructions or products referred to in the content. |
© 2024 by the authors. Licensee MDPI, Basel, Switzerland. This article is an open access article distributed under the terms and conditions of the Creative Commons Attribution (CC BY) license (https://creativecommons.org/licenses/by/4.0/).


