Article

A New Discovery of Cu Mineralization in the North Qaidam, Tibet via Log-Ratio, Robust Factor Analysis, and Spectrum–Area Modeling

1
School of Earth Resources, China University of Geosciences, Wuhan 430074, China
2
The Northern Qinghai-Tibet Plateau Geological Processes and Mineral Resources Laboratory, Qinghai Geological Survey Institute, Xining 810012, China
3
Institute of Geological Survey, China University of Geosciences, Wuhan 430074, China
4
School of Earth Sciences and Resources, China University of Geosciences, Beijing 100083, China
*
Author to whom correspondence should be addressed.
Appl. Sci. 2024, 14(6), 2597; https://doi.org/10.3390/app14062597
Submission received: 1 December 2023 / Revised: 25 February 2024 / Accepted: 28 February 2024 / Published: 20 March 2024
(This article belongs to the Section Earth Sciences)

Abstract

:
The Qinghai–Tibet Plateau, abundant in mineral resources, is a treasure trove for geological explorers. However, exploration has been hindered by the presence of dense vegetation, weathering layers, and desert cover, particularly in the North Qaidam region. As a result, there is an urgent need to develop efficient geochemical composition methods. In a study of stream sediment geochemical data from the Lüliangshan area of the North Qaidam, the log-ratio transformation was used for data processing, Robust Factor Analysis (RFA) was used for model construction, and the spectrum–area (S-A) model was used for anomaly separation. The outcomes identified two distinct groups of element combinations associated with mineralization. The first group consisted of Au + Ag + Pb + Sb + Hg linked to tectonic-altered rock-type Au (antimony) deposits, while the second group consisted of Cu + Zn + Co and was closely associated with Cu-Ni sulfide deposits. The S-A fractal filtering technique amplified weak anomalies and minimized the area of anomalies against strong backgrounds. The study successfully detected substantial Cu mineralization in the source areas of geochemical anomalies in the Lüliangshan region. Consequently, the log-ratio–RFA–S-A fractal model has been proven to be an effective combination of methods for identifying and extracting geochemical anomalies from stream sediment samples and for mineral exploration in covered areas.

1. Introduction

Stream sediments are commonly sampled for geochemical prospecting in regional mineral exploration [1]. However, the dispersion patterns of geochemical elements are influenced by complex geological processes [2,3]. Additionally, geochemical anomalies exhibit complex spatial patterns because of the influence that geologic, geomorphologic and topographic factors have on the element contents in stream sediments [4,5,6,7]. Statistical geochemical methods such as the Mean + 2 standard deviations (Mean ± 2SD) [8], histograms, box plots [9], probability graphs, and univariate and multivariate analyses have proven successful in separating the background and extracting anomalies associated with straightforward geological settings [10,11,12]. However, in complex geological settings influenced by spatially and temporally complicated processes, such as an area covered by dense vegetation, weathering layers and deserts, etc., these statistical methods have limited effectiveness [3,10,13,14,15,16]. In this regard, the singularity mapping technique, which involves data within a small singularity around a specific spatial location, can be an excellent multifractal tool for identifying weak anomalies. Additionally, it facilitates local neighborhood statistical analysis, reduces the effects of the regional background and provides useful statistical information [5,10,11,14,17,18,19,20,21,22]. However, the above methods do not account for the compositional nature of geochemical data [4,6,23]. Two issues must be addressed to accurately obtain mineralization-related anomalies of multivariate geochemical footprints from the data: (1) the presence of outliers in geochemical data sets, which can lead to biased extraction of multivariate associations using classical statistical estimators [24,25,26], and (2) the closure problem of compositional data [27,28,29].
Therefore, this study selected Robust Factor Analysis (RFA) to first extract combinations of metallogenic elements. Subsequently, singularity mapping was employed to investigate the spatial patterns of geochemical data and extract weak anomalies. Finally, we compared the spatial associations between Cu anomalies identified by different methods and known deposits in the North Qaidam (NQ) region. This comparison provided an excellent opportunity to (1) identify primary element patterns related to mineralization, (2) evaluate the advantages of using multifractal singularity mapping in covered areas, and (3) guide the verification of weak anomalies and identification of potential deposits in the Lüliangshan area.

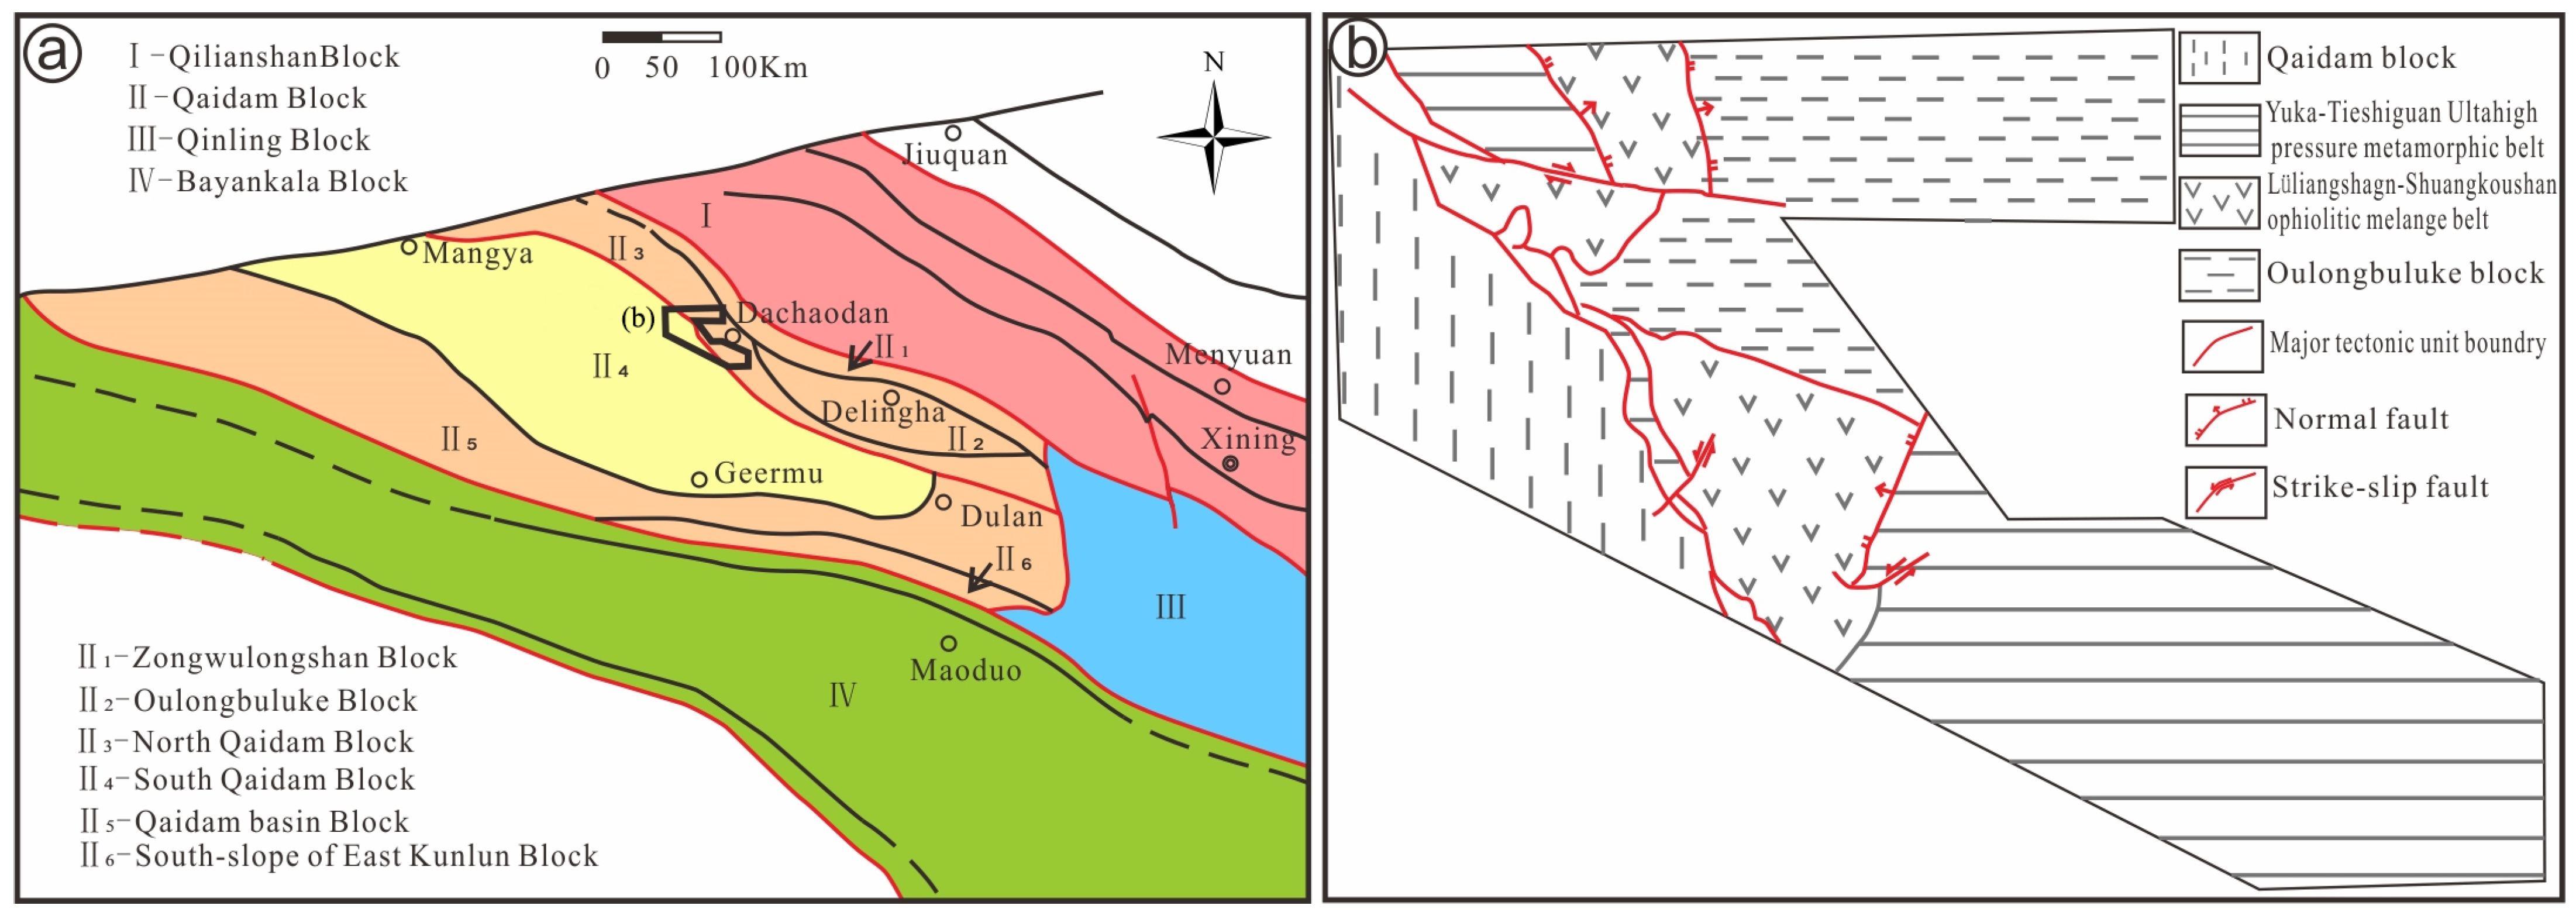
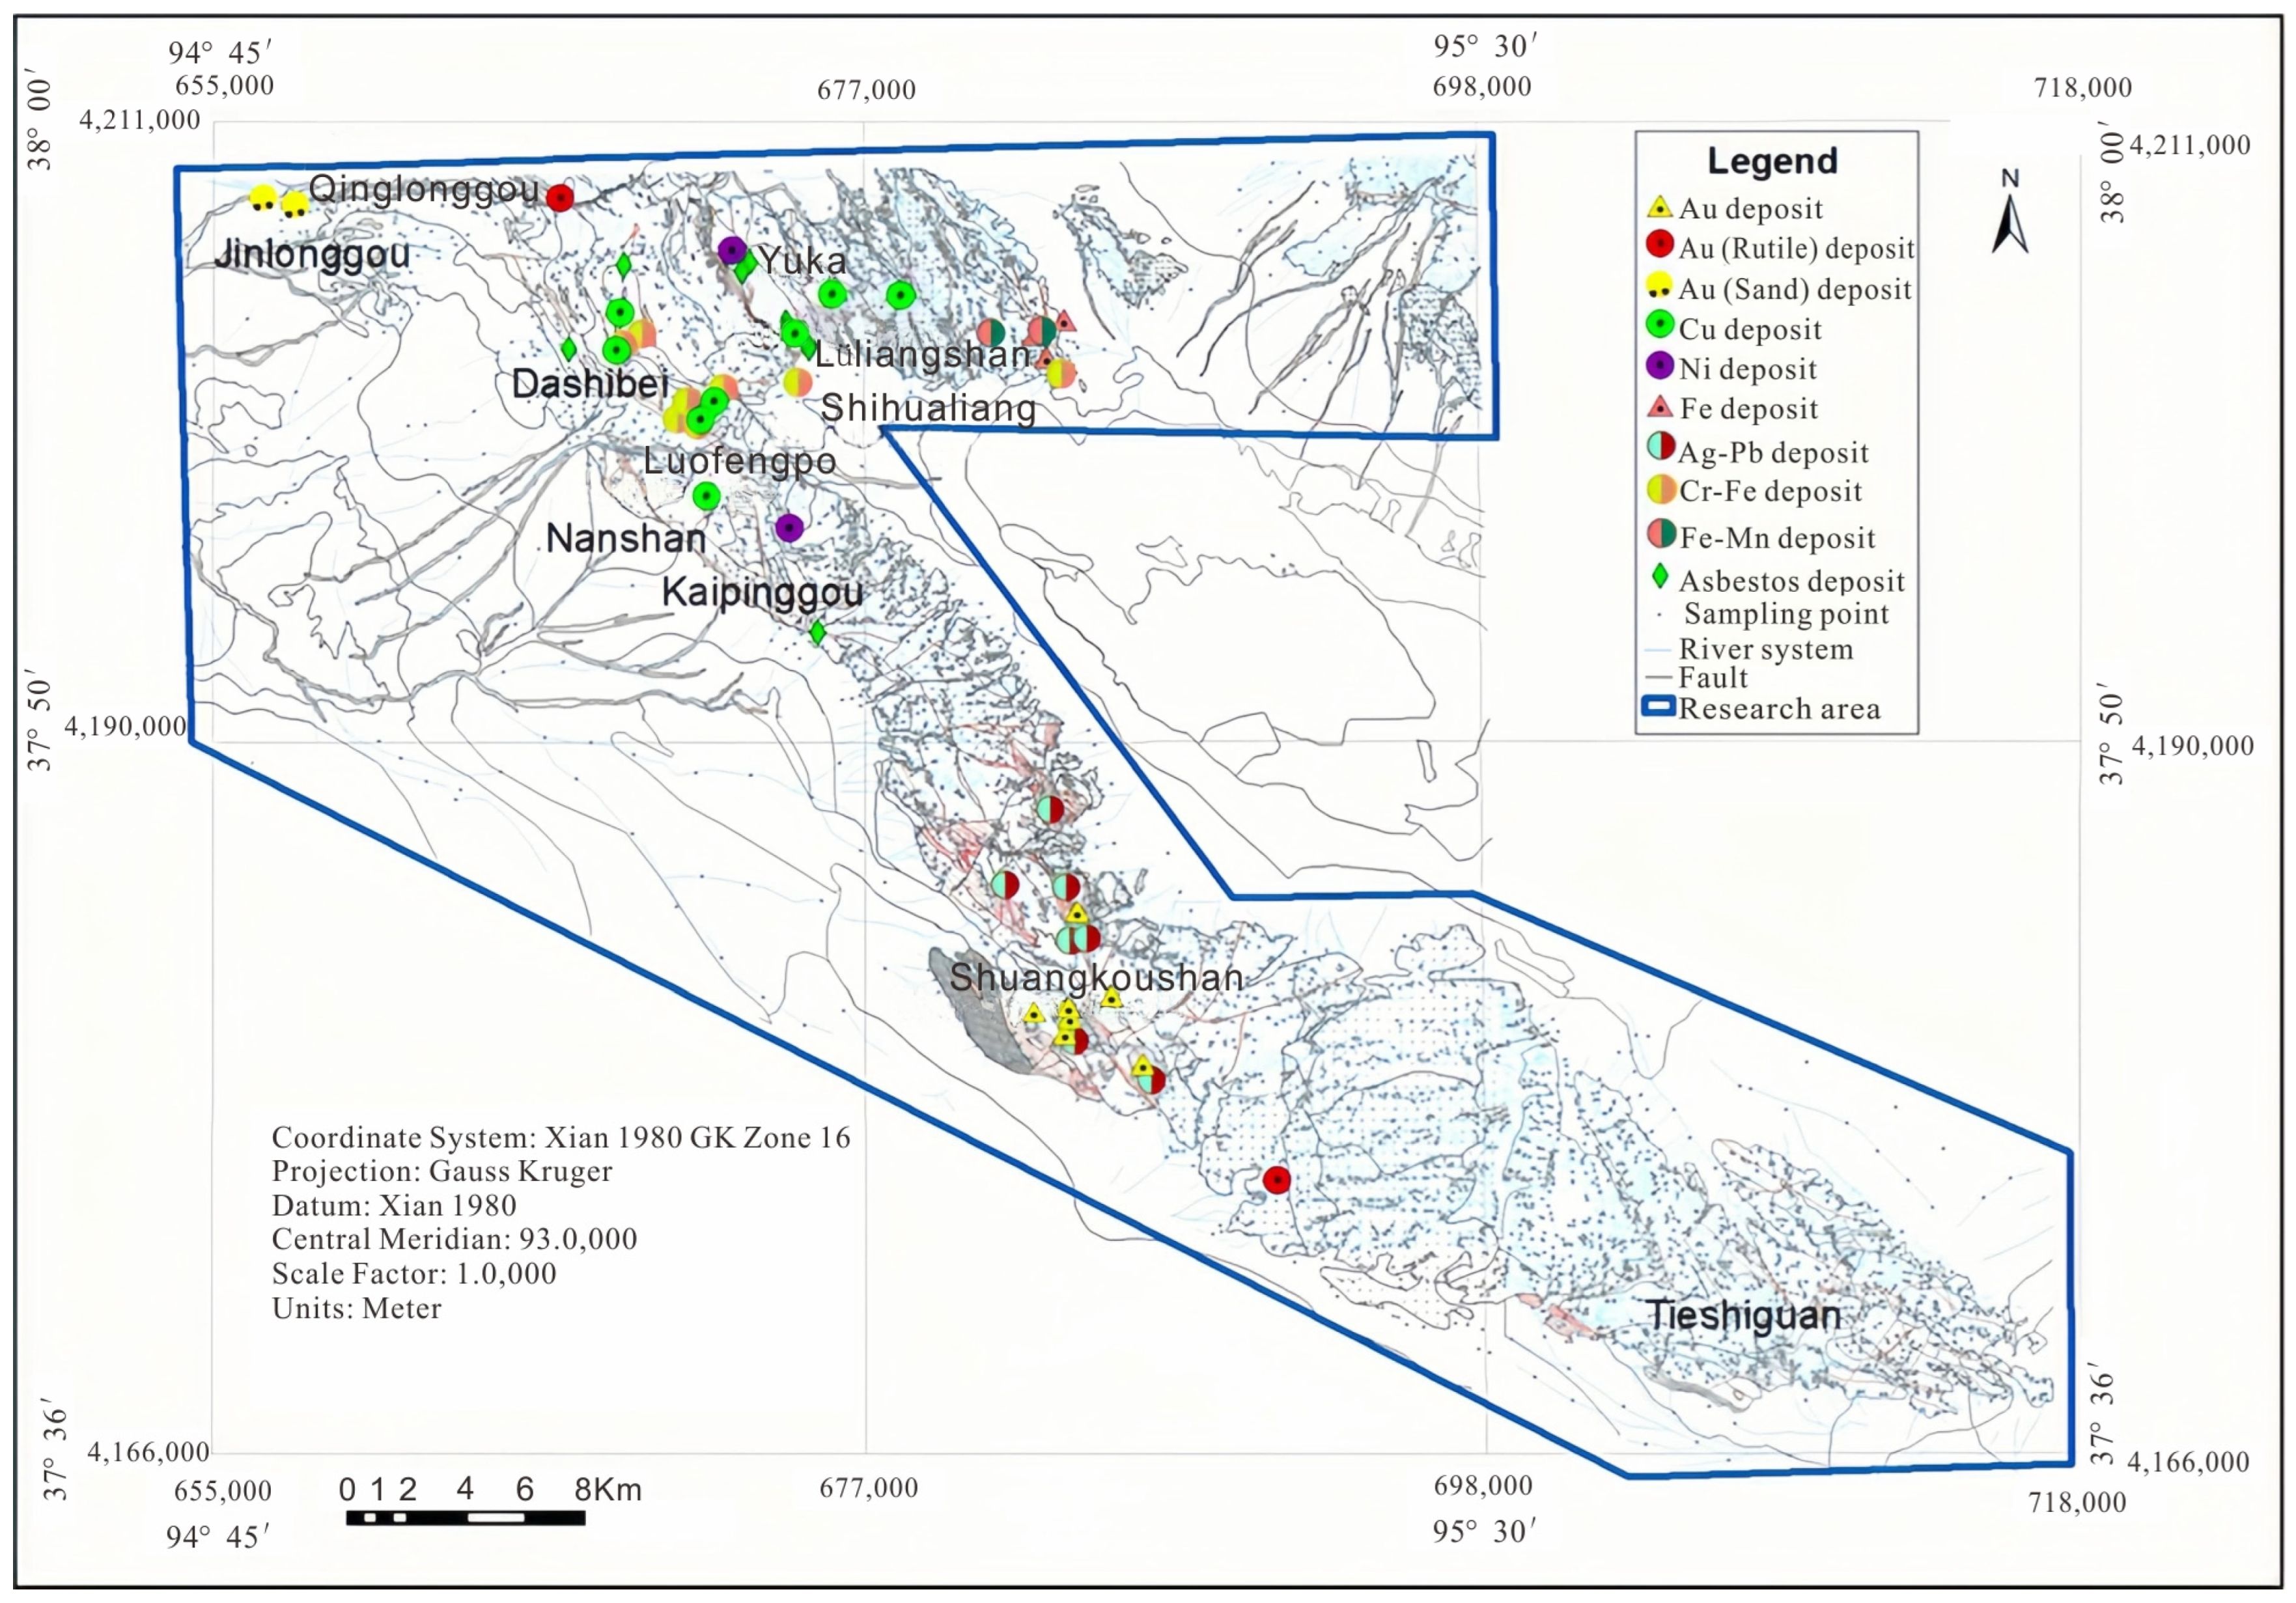
2. Geological Setting

The NQ is situated within the Qinling–Qilian–Kunlun orogenic belt, a part of the Central Orogenic Belt of China in the northern Tibetan Plateau. It delineates the boundary between the Qilianshan block to the north and the Qaidam block to the south, stretching approximately six hundred kilometers from Tanjianshan, through Xitieshan and Lüliangshan, to Dulan in a southeast–northwest direction (Figure 1 and Figure 2).
The cover sequence consists of Neoproterozoic metamorphic sedimentary rocks interspersed with marbles and eclogite blocks of varying size [30]. Additionally, it includes volcano–sedimentary deposits overlain by the Tanjianshan Formation and Ordovician to Silurian clastic rocks.
The NQ area in the Qinghai Province is a significant nonferrous metallogenic belt in China, characterized by the occurrence of Cu-Au and Cu-Co deposits primarily within the Cambrian–Ordovician meta-volcanic rock group and fault tectonic fracture zone. These deposits are controlled by intrusions and ductile and/or brittle faults [31], which not only provide energy but also serve as material sources for magmatic–hydrothermal mineralization. The structures, depicted in Figure 2 and predominantly oriented in a southeast–northwest direction, act as the primary ore-controlling faults for Cu, Ag, Zn, and Pb deposits. A regional geological survey of Qinghai revealed numerous basic and ultrabasic rocks in the NQ [30]. Notably, the discovery of the Niubiliang ultrabasic Cu-Ni sulfide deposit represented the first of its kind in the NQ. Subsequently, the Beishan and Xiarihamu Cu-Ni deposits were also identified. In recent years, 13 Cu ore bodies have been discovered in the Lüliangshan Cu deposit. However, the relatively limited exploration of resources in Lüliangshan, compared to other areas, suggests great potential and the need for further exploration.

3. Sampling and Analysis

Geochemical mapping is an important tool for both mineral exploration and environmental studies [32]. China’s National Geochemical Mapping Project (Regional Geochemistry National Reconnaissance) was initiated in 1979 [33], and has covered more than 6 million km2 of China’s territory [34]. The research area, located in the Lüliangshan area, NQ, Western China, is believed to have high potential for Cu, Co, Ni, Au mineral resources. As part of the regional geochemical exploration program, 6481 stream sediment samples were collected from an area of 66,900 km2 (latitude 94°45′–95°27′ E, longitude 37°32′–38°00′ N). For the purpose of verifying the feeble geochemical anomalies, more than 600 stream sediment samples at a density of eight samples per square kilometer were collected within an area of about 80 Km2 in the research area (Figure 3).
The sample collection and chemical analytical methods for stream sediments can be found in Xie et al. [33]. We selected 11 elements that are closely associated with mineralization for this research. The detection limits for Cu, Cr, Pb, Sb, Zn, Ag, Au, As, Cd, Co, and Ni were 1, 15, 2, 0.1, 10, 0.02, 0.0003, 1, 0.05, 1, and 2 ppm, respectively. The samples were analyzed for major and trace anions using ion chromatography on a Dionex 4000i Ion Chromatograph, with an AS14 analytical column for both UV/visible absorbance detection and conductivity [37]. X-ray fluorescence (XRF) was utilized to determine the concentrations of Cu, Co, Zn, and Cr, while inductively coupled plasma–mass spectrometry (ICPMS) was used to determine the concentration of Cd. Graphite furnace-atomic absorption spectrometry (GF-AAS) was employed to measure the Au concentrations and hydride generation-atomic fluorescence spectrometry (HG-AFS) was applied to obtain Sb and As concentrations. Emission spectrometry (ES) was used to determine the Ag concentrations [26,33,34,38]. The statistical characteristics of stream sediment elements from Lüliangshan and Shuangkoushan in the NQ area are presented in Table 1.

4. Methodology

4.1. Log-Ratio Approach

Using raw geochemical data for standard statistical methods can lead to misleading and confusing results because they are compositional data [22,39,40]. Compositional data refers to data that is distributed within a finite region and subject to unit and sum constraints; therefore, geochemical element concentration data are considered as typical compositional data [41]. The log-ratio transformation is a projection transformation of compositional data based on the fact that the ratio of compositional components is not affected by the “constant sum” constraint, and the logarithm of the ratio often follows a normal distribution. The specific definition [27,38,42] is as follows:
S D = x = ( x 1 , , x D ) , x i > 0 , i = 1 D x i = k
where SD represents the simplex space of compositional data, and k is an arbitrary constant [42].
Therefore, it is recommended to perform a suitable data transformation before analysis [42]. Log-ratio transformation of compositional data not only avoids the closure effect but also allows for analysis using unconstrained multivariate statistics [39,42,43]. There are three available transformations for compositional data: the centered log-ratio (CLR) transformation proposed by Aitchison, the additive log-ratio (ALR) given by Aitchison, and the isometric log-ratio (ILR) proposed by Egozcue [27,38,39] with the following functions:
a l r ( X ) = ln x i x j ( i = 1 , 2 , , D 1 )
c l r ( X ) = log x i i = 1 D x i D ( x = 1 , 2 , 3 , , D 1 , D )
i l r ( X ) = i i + 1 ln i = j i x j i x i + 1 ( i = 1 , 2 , 3 , D 1 )
where X (n × D) is a sequence of observed compositional components, xi is the i-th component, xj is the (i + 1)-th component, and D is the number of compositional components.
While alr transformation has some arbitrariness in the choice of denominator, clr transformation results in all variables summing to zero (i.e., matrix singularity issue, resulting in parallel data) [21,43,44]. Hence, both alr and clr transformations are not suitable for robust statistics. Instead, the ilr transformation is adopted. However, after ilr transformation, the dimension of the data is reduced by one, making it difficult for geological interpretation. Therefore, the ilr transformation is used to transform the compositional data into Euclidean space, and combined with Robust Factor Analysis (RFA) to obtain loadings and scores. Then, the loadings and scores are transformed into clr space to establish a connection with the original data, thereby addressing the issue of data interpretation [45].
Therefore, when using RFA to analyze geochemical compositional data, the ILR transformation should be performed first. However, because interpretation of the results is not feasible in ILR space [42], the loadings and scores need to be back-transformed to the CLR space. Histograms with ILR-transformed Cu, Co, and Zn data (Figure 4) showed that the ILR-transformed datasets had a roughly normal distribution. However, considering the presence of a small amount of outlier data, it is advisable to utilize robust estimates for more accurate results when estimating the center and spread of the data [26].
In addition, there is a close relationship between these three log-ratio transformations, which allows for spatial transformations and inverse transformations of compositional data among them [38,42].
c l r ( x ) = i l r ( x ) U
ilr ( x ) = clr ( x ) U = a l r ( x ) A
alr ( x ) = i l r ( x ) U F
A = 1 D D 1 1 1 1 1 D 1 1 1 1 1 D 1 1 1 1 1 1 D 1
F is the inverse matrix of A, i.e., A = F − 1.
The row vectors of matrix U are composed of
u i = i i + 1 1 i , 1 i i   e l e m e n t s , 1 , 0 , , 0 ( i = 1 , 2 , 3 , , D 1 )
The relationship between matrix U and u is
U = [ u 1 , u 2 , , u D 2 , u D 1 ] T ( i = 1 , 2 , 3 , , D 1 )
where U is the transformation matrix between ilr(x) and clr(x). u is a row vector of matrix U.
The main focus of this study is the application of the transformation formula between CLR and ILR.

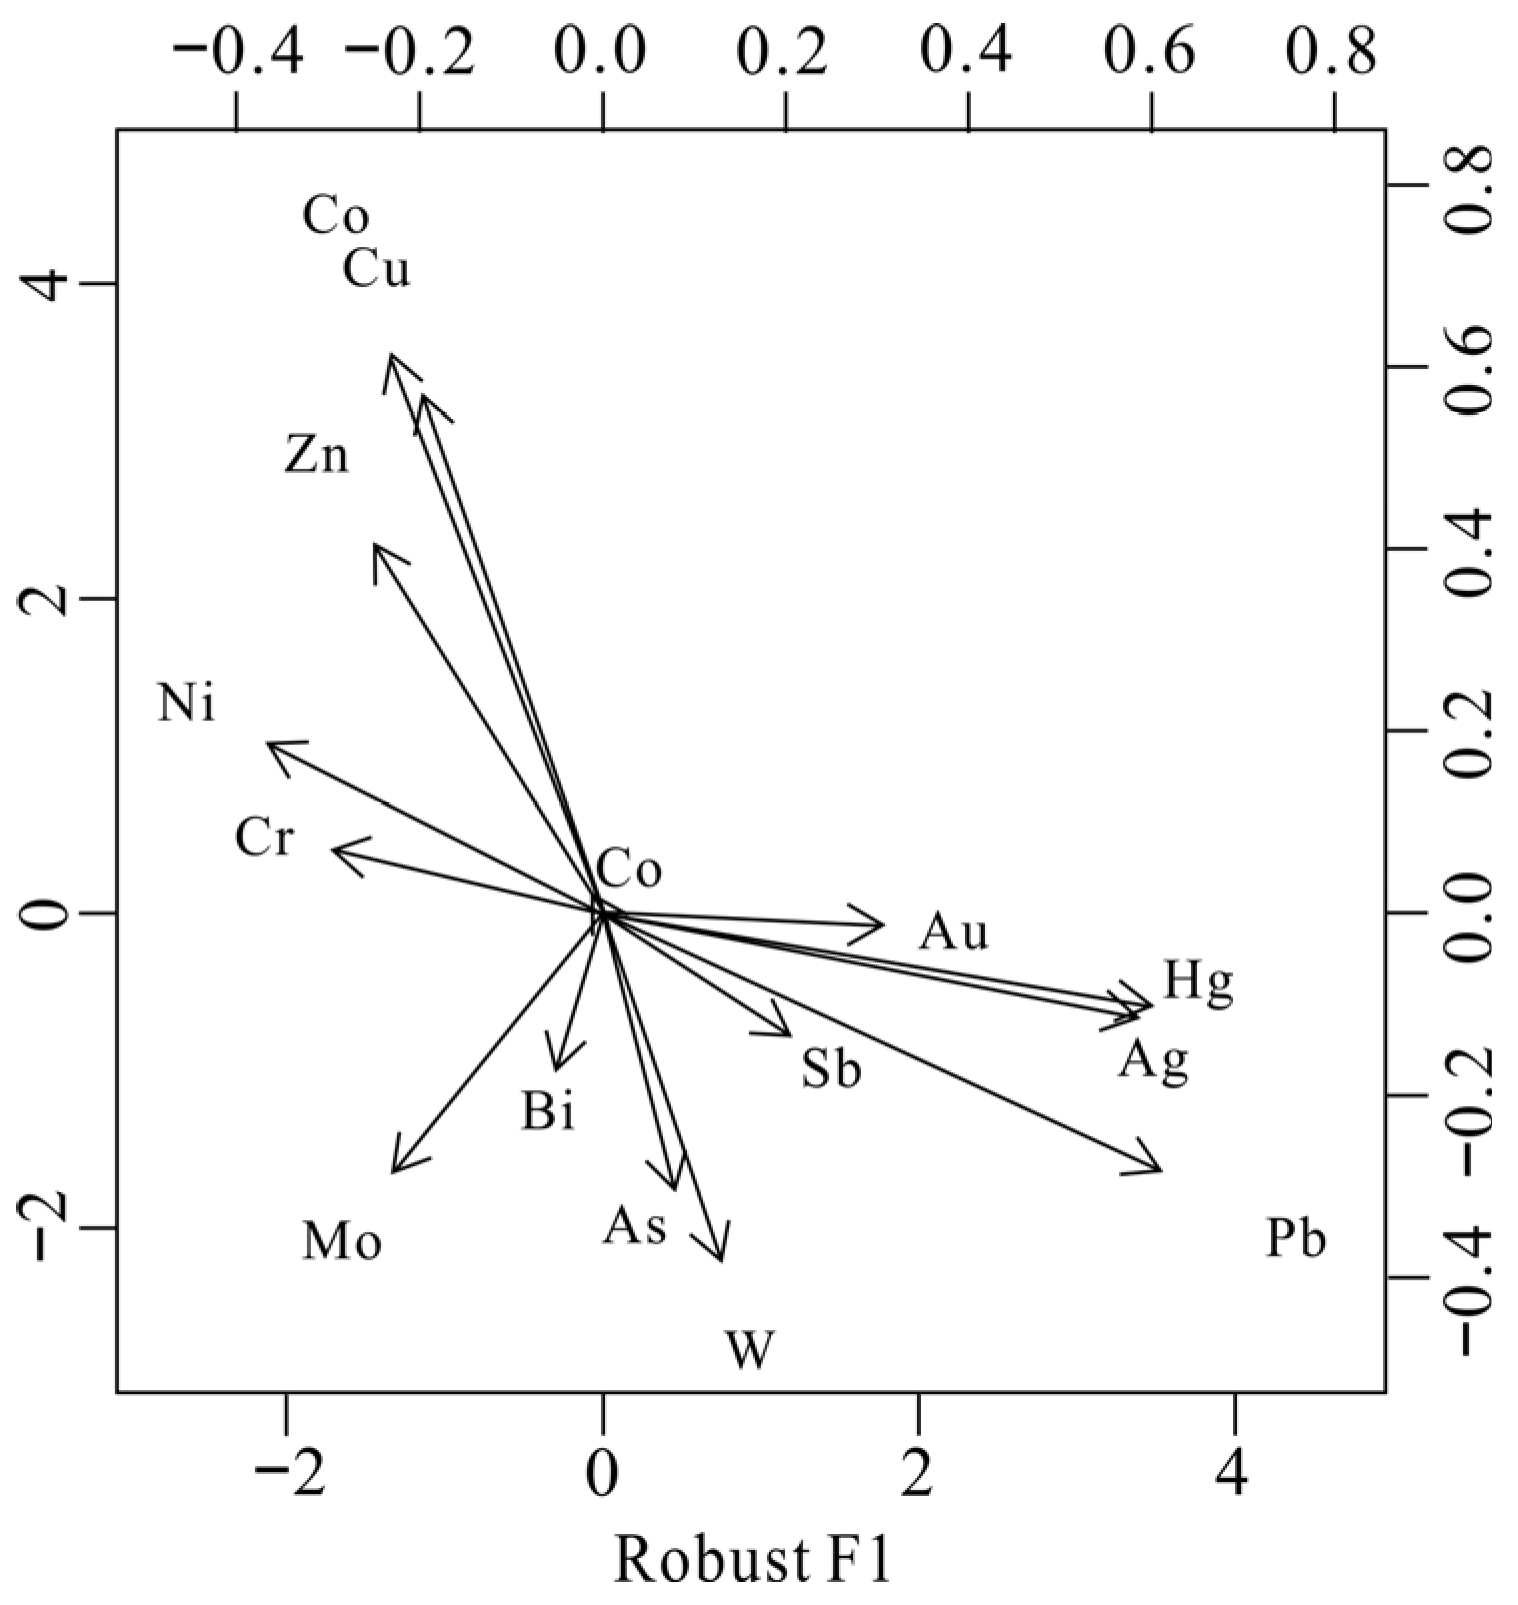
4.2. Robust Factor Analysis (RFA)

Factor analysis (FA) is a multivariate statistical method that establishes relationships between observed variables and underlying latent variables to improve interpretation. This is accomplished through axis rotation or loading reduction based on a covariance or correlation matrix. However, FA is prone to significant bias when influenced by outliers and is highly sensitive to extreme values [40,46]. Consequently, if the compositional geochemical data contains outliers and/or extreme values, the results obtained through classical FA are neither reliable nor robust [47]. Robust Factor Analysis (RFA) is designed to mitigate the impact of outliers and minimize the influence of extreme values using the minimum covariance determinant estimator [48]. RFA outputs, visualized in the compositional biplot, are scores representing observations and loadings representing variables [39]. Furthermore, the scores are considered indicative of mineralization presence [47]. The calculation relies on the R Project, a statistical computing software, as well as the robust statistical analysis of compositional data (robComposition) and the StatDA package [49]. A comprehensive explanation of the RFA process for compositional data can be found in previous works [42]. The R language for data analysis and graphics, in conjunction with the StatDA package [49] and robust statistical analysis [32], were used for calculation.

4.3. Spectrum–Area (S-A) Model

The scale-invariant properties of various geological processes, such as erosion, mineralization, the magnetic field of the Earth’s crust, earthquake distribution, and volcanic eruptions, often exhibit “self-similarity” or “self-affinity”. These properties can be measured in both the frequency and spatial domains [50]. In the frequency domain, power spectra can be used to represent such properties [51]. Spectral energy density functions illustrate the distribution of power spectra in the frequency domain, whereas for certain complex convolution operations in the spatial domain, such as correlation analysis, filtering, and transformation, dealing with fields in the frequency domain can significantly simplify the process [5].
Signal processing and time series analysis commonly employ Fourier and inverse Fourier transformations [51,52]. The power spectrum–area (S-A) model is a fractal filtering technique based on Fourier spectral analysis that is used to separate anomalies from background values [51]. Scaling properties in the spatial domain are related to the spatial geometry of patterns, histogram distributions of values, and changes in shape corresponding to changes in value. This is employed in the multifractal inverse distance weighted (MIDW) interpolation method. A fractal filter, derived from the S-A model [51], defines components with similar scaling properties based on the power-law characteristics of a power spectrum in the frequency domain [53]. This filter not only identifies anomalies from the background but also extracts significant patterns from the original map. Due to the complex intrinsic structure of geochemical datasets and anisotropy, the filter has an irregular shape [54]. Detailed equations for S-A multifractal filtering are shown in Equations (11) and (12) [54].
F ( w x , w y ) = f ( x , y ) cos ( w x x + w y y ) d x d y i f ( x , y ) sin ( w x x + w y y ) d x d y
f ( x , y ) = 1 2 π F ( w x , w y ) cos ( w x x + w y y ) d x d y 1 2 π F ( w x , w y ) sin ( w x x + w y y ) d x d y
In Equation (11) and Equation (12), F(wx, wy) represents the signal in the frequency domain, f(x, y) represents the geochemical map in the space domain, wx and wy are the “wave numbers” of the x and y axes respectively, i2 = −1.
From a generalized scale invariance (GSI) viewpoint, the S–A fractal model [55,56] is based on the power–law relationships between areas of sets of data consisting of wave numbers with spectral energy density above S[A(>S)] on the 2D frequency domain, and gives
A ( S ) S 2 d / β
where β is the anisotropic scaling exponent, and D is the GSI generator parameter representing the degree of overall contraction [57]. For a 2D linear case, d = 1; thus
A ( S ) S 2 / β
The expression A(Ss) denotes the area where the spectral density (S = ‖F(wx, wy)‖) exceeds a certain value s. β represents the fractal dimension, and ∝ stands for proportional.
G ( w x , w y ) = 1 , 0 , s 1 S ( w x , w y ) s 2 other
F F ( w x , w y ) = F ( w x , w y ) G ( w x , w y )
Noise exists where spectral density is less than s1; background occurs when spectral density is greater than s2; and anomalies exist where spectral density is between s1 and s2.
These power–law relations, including those in space domains [58] and Eigen domains [59] have been demonstrated to be useful tools for identifying geochemical anomalies for mineral resource exploration [5,60,61] and to determine geochemical baselines for environmental assessments [1] according to distinctive generalized self-similarity.

4.4. Extraction of Combination Anomalies Based on Factor Load

Xu et al. proposed the presence of SEDEX (sedimentary exhalative deposit) and VMS (volcanic massive sulfide deposit) mineralization in the Shuangkoushan and Lüliangshan areas, located on the northern margin of the Qaidam [35]. They suggested that these mineralizations underwent transformation into orogenic mineralization during the late stage. This transformation signifies that the superimposition of different elements resulting from multi-stage mineralization is conducive to mineralization. Zheng introduced the metallogenic strength complexity concept, which involves statistical analysis of geochemical data, calculating the element lining value for each sampling point in the statistical region, and identifying points with a value greater than 1 to serve as an index. A plane contour map is then generated based on this index, quantitatively reflecting the most favorable ore-forming target areas [62].
Prior research and geochemical exploration concepts were considered when setting the factor load of each element as the weight value. This facilitated the weighted evaluation of related combined elements and the delineation of abnormal target areas for the combined elements. During this process, outliers were first eliminated and replaced with high value elimination, using X + 3S (average value +3 times standard deviation of the average) as the highest value of the elements. The replaced element was then normalized to (0, 1) and multiplied by 100 to yield a range of (0, 100). Subsequently, RFA (CLR) was applied. The composite element’s main factor sub-load was weighted by the combined elements’ weight to produce the plane contour map (factor load combination element anomaly map).

5. Results and Discussion

5.1. Geochemical Anomalies Identified by Statistical Methods

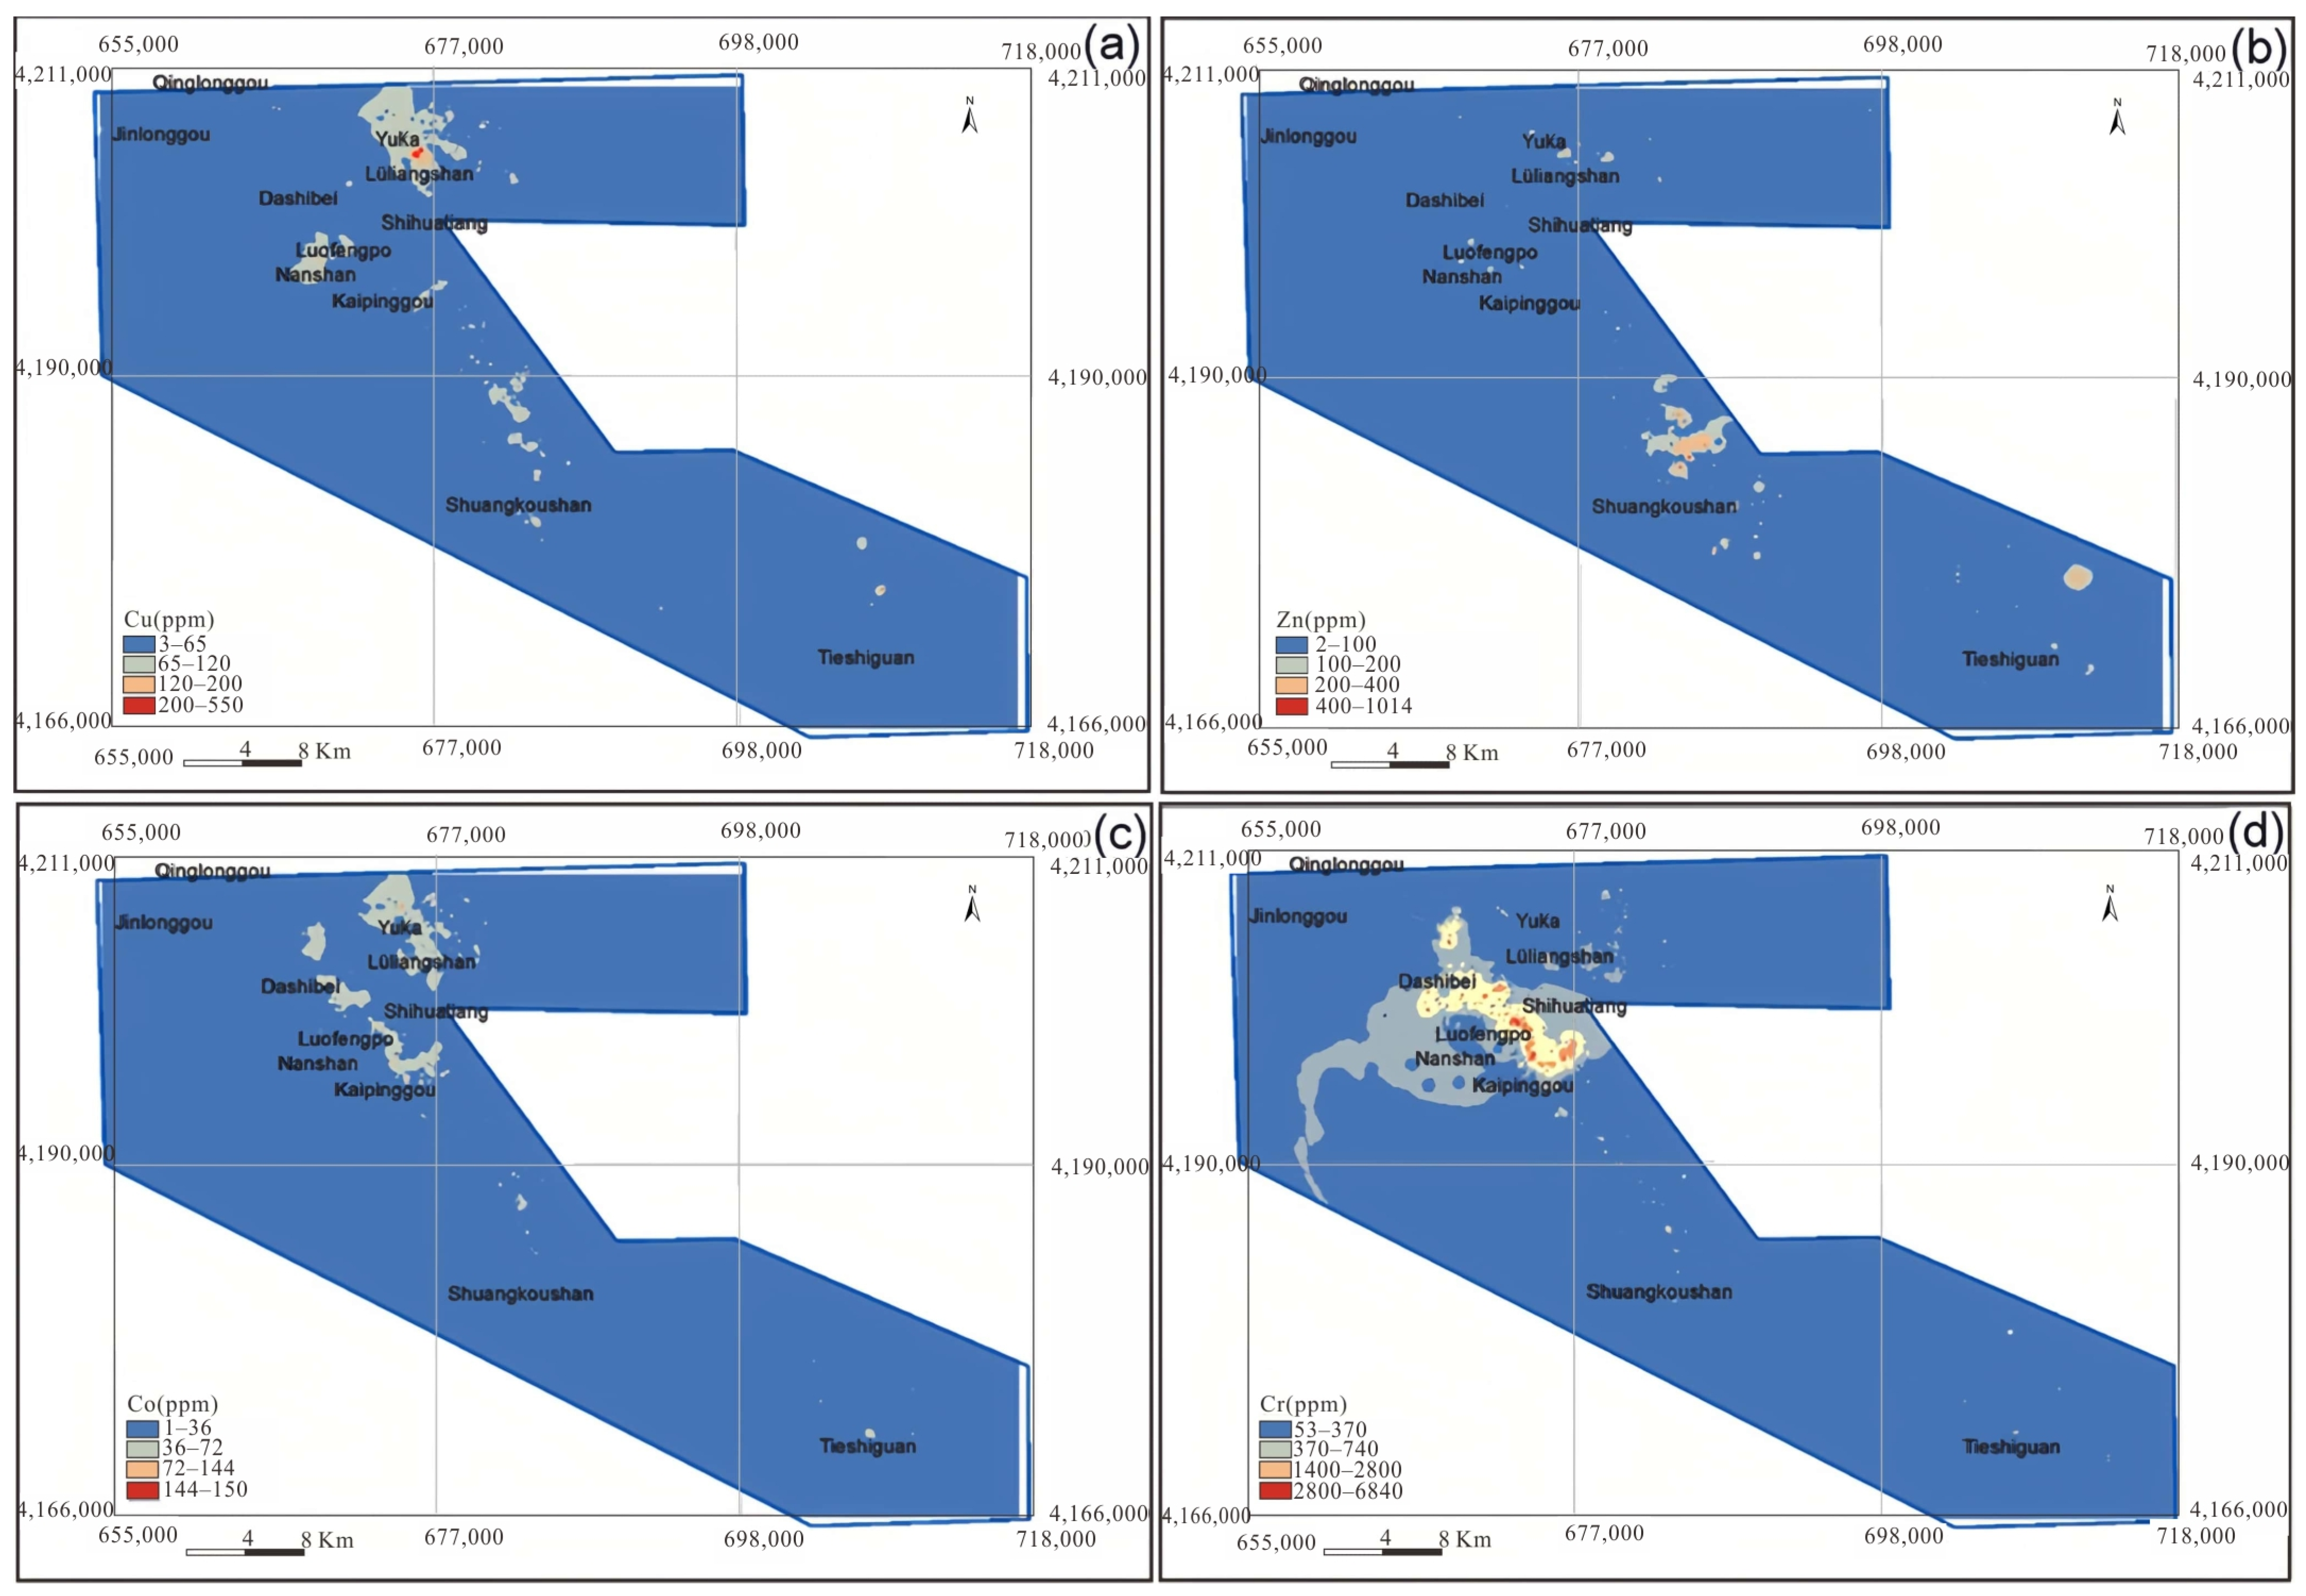
5.1.1. Single Geochemical Element Anomaly Analysis by Statistical Methods

There were numerous Cu deposits in Lüliangshan, NQ. The spatial distributions of Cu, Zn, Co, and Cr are shown in Figure 5. Notably, high concentrations of Cu and Co were similarly located in Lüliangshan and Luofengpo, as depicted in Figure 5a and Figure 5c, respectively. The anomalies in Lüliangshan were large in size, and had high elemental concentrations with a conspicuous coincidence of element assemblages. These anomalies were oriented along the NW–SE direction and demonstrated a pronounced correlation of Cu and Co anomalies, indicating their role as ore-forming elements. We employed the Mean + 2SD method (Table 2) to compute threshold values for identifying anomalies in Lüliangshan and Luofengpo. The mean value, influenced by specific outlier values, was often excessively large, leading to a discernible deviation between the anomalies identified by the traditional method and the actual ore points. The distribution of Cu anomalies was primarily concentrated in the Lüliangshan area. Consequently, due to the conspicuous Cu anomalies in this region, all three known ore points were within the range of the anomalies. In contrast, the anomalies in the Luofengpo area were relatively weak and the overlay was quite thick, resulting in the absence of known ore sites within the anomalous range. This indicated that statistical methods were not sufficiently precise in areas with thick overlay or weak anomalies.
The results for single geochemical elements Cu (Figure 5a), Zn (Figure 5b), Co (Figure 5c), and Cr (Figure 5d), as well as statistical anomaly analysis, were as follows:

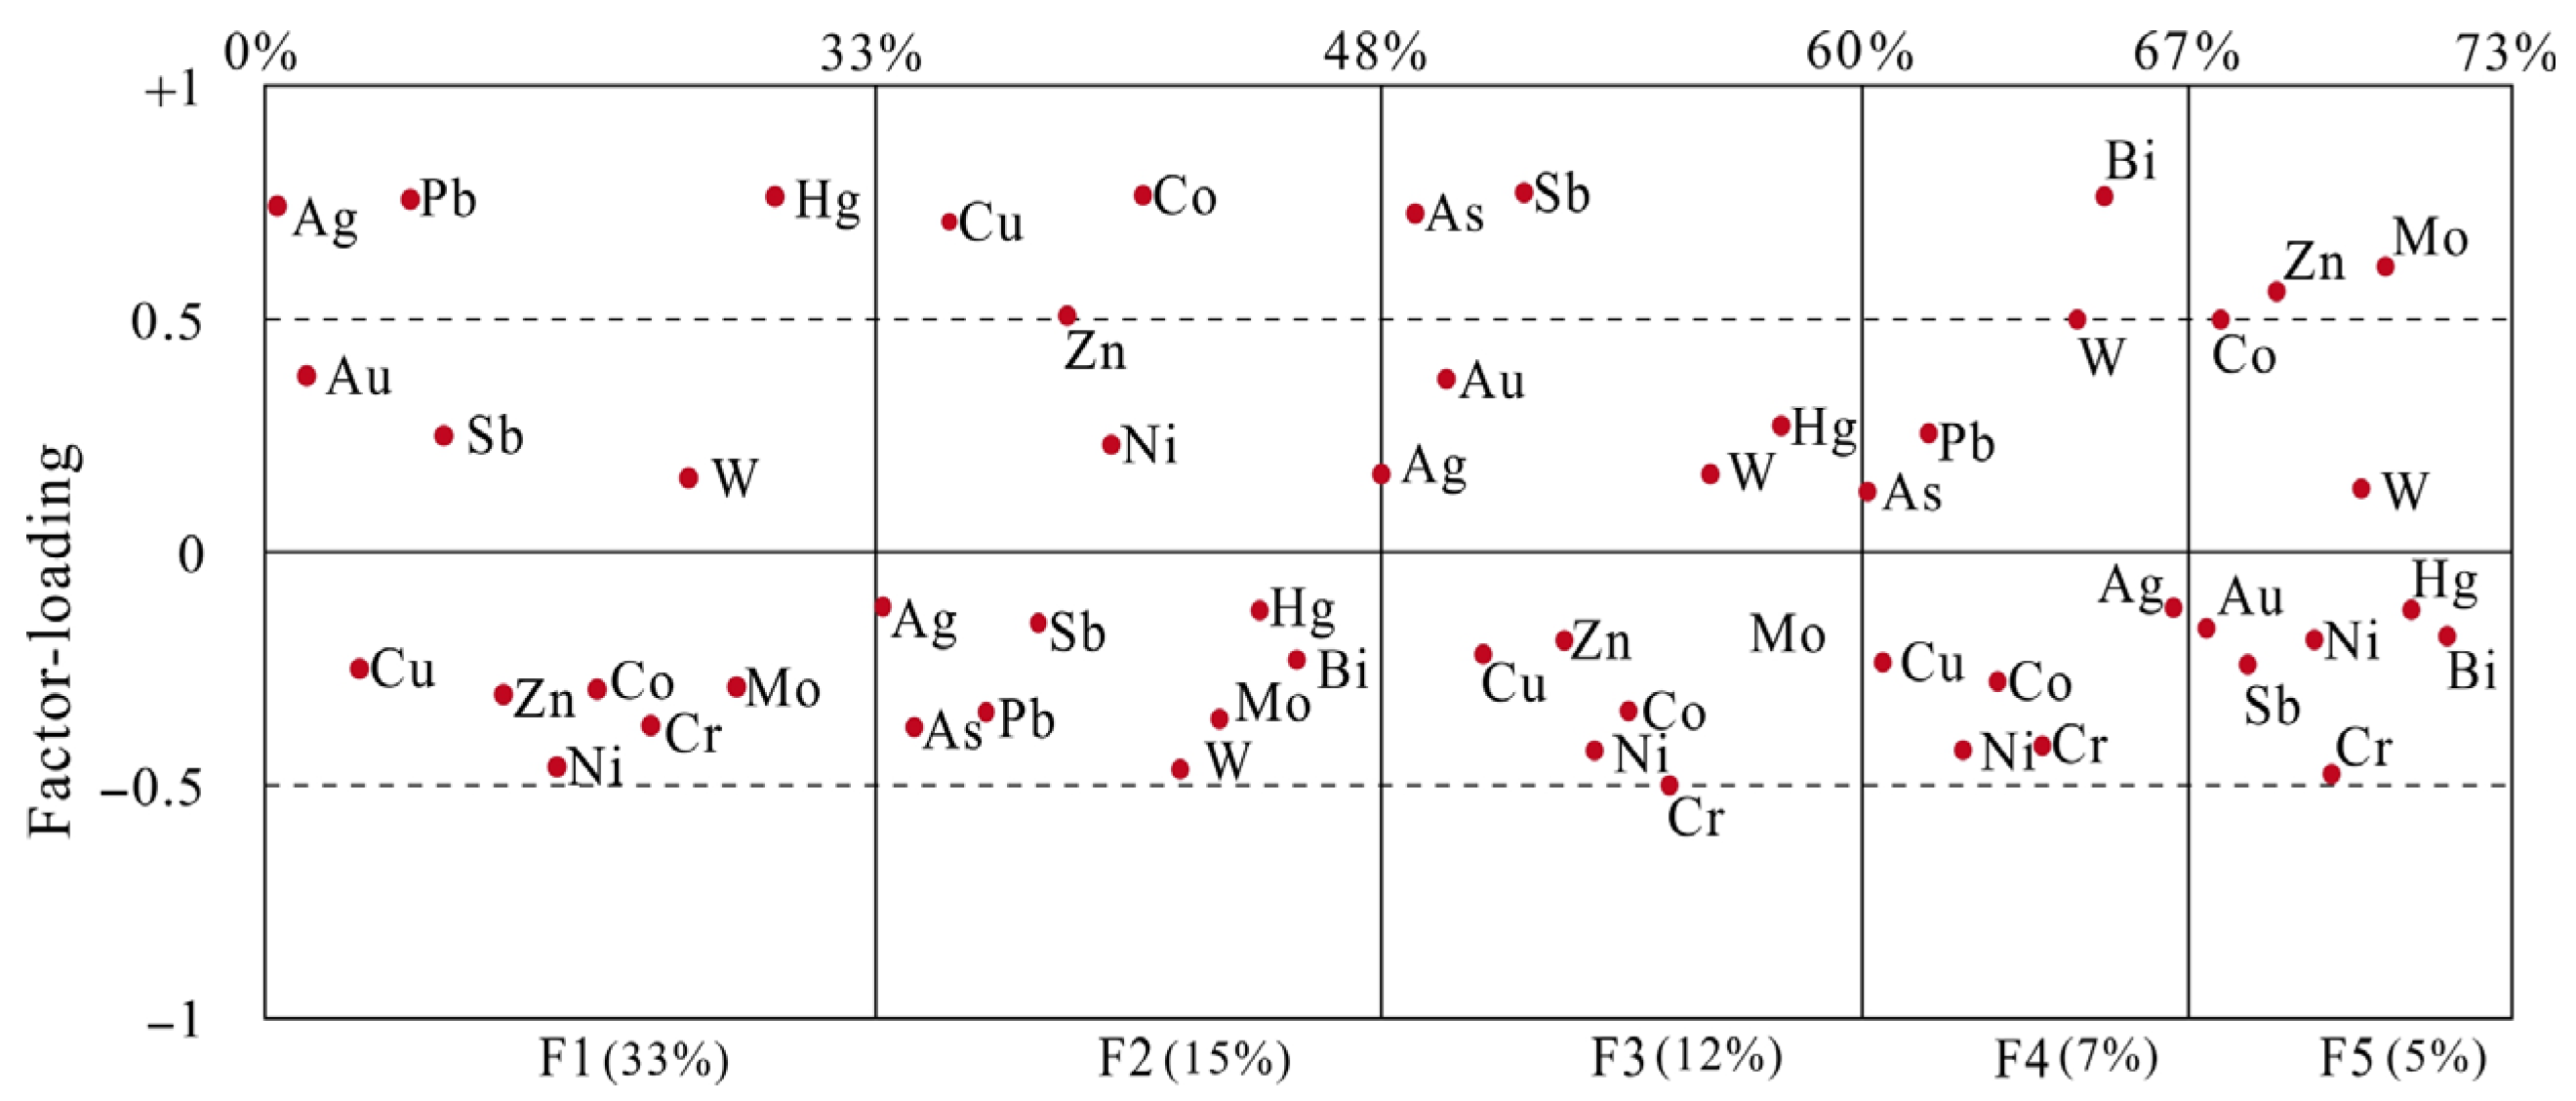
5.1.2. Mineralization-Related Multi Elements Anomaly Analysis Using Statistical Methods

RFA was applied to the log-ratio transformed geochemical data to examine the associations among elements. The results are shown in the loading plot (Figure 6) and the biplot (Figure 7). The first factor accounted for 33.0% of the total variance and the second accounted for 15.0%, as shown in Figure 6. The observations from the biplot (Figure 7) revealed two closely associated groups of elements. The first group consisted of Ag, Pb, Hg, Au, Sb, and W, exhibiting positive loadings on factor 1 (F1), while the second group was comprised of Cu, Zn, Co, Cr, Mo, and Ni. The prominent portion of the variance was explained by the loadings of factor 2 (F2), which was mainly influenced by Cu, Zn, and Co. This implied that a group of elements was associated with Cu, Zn, and Co mineralization in the NQ, including the Lüliangshan Cu deposit, which primarily consisted of volcanic massive sulfide deposits (VMS) and quartz vein-type Cu-Au mineralization. By applying RFA to limit the influence of outliers, two factors (F1 and F2) were differentiated, as shown in Figure 6.
The higher correlations among the 15 elements were divided into two groups. The first principal factor (F1) consisted of Au, Ag, Pb, Sb, and Hg, while the second principal factor (F2) consisted of Cu, Zn, Co, Cr, and Zn. The factor loads for Cu, Zn, and Co were greater than 0.5 and those of Cr and Ni were less than 0.25. In addition, considering that Cu and Zn are chalcophile elements based on the geological situation of the research area, it was more reasonable to reduce the combination of second main factor effective elements to Cu, Zn, and Co. This was because the VMS deposit found in this area exhibited Cu-Zn mineralization and was associated with Co. For the first two principal factors, F1 and F2, the contributions of each element to the main factor are shown in Table 3.
In this study, outliers or high values were removed from the original element table using X + 3S. The X + 3S value from the last iteration was then used to replace the high value. The equation for this calculation is shown below:
V = 100 X / ( X + 3 S )
In Equation (17), V represents the normalized elemental data, while X denotes a combination of elemental data following high-value substitution. Additionally, X + 3S is an iterative value, and multiplying by 100 guarantees the normalization of all data within the range of (0, 100).
The calculation of the combined element value is as follows:
P = a i V i
In Equation (18), P is the combined element value of the main factor after weighting, ai (i = 1, 2, …, n) represents the load of the element in the main factor (F) as a weight, Vi (i = 1, 2, …, n) is the single-element data value after normalization.

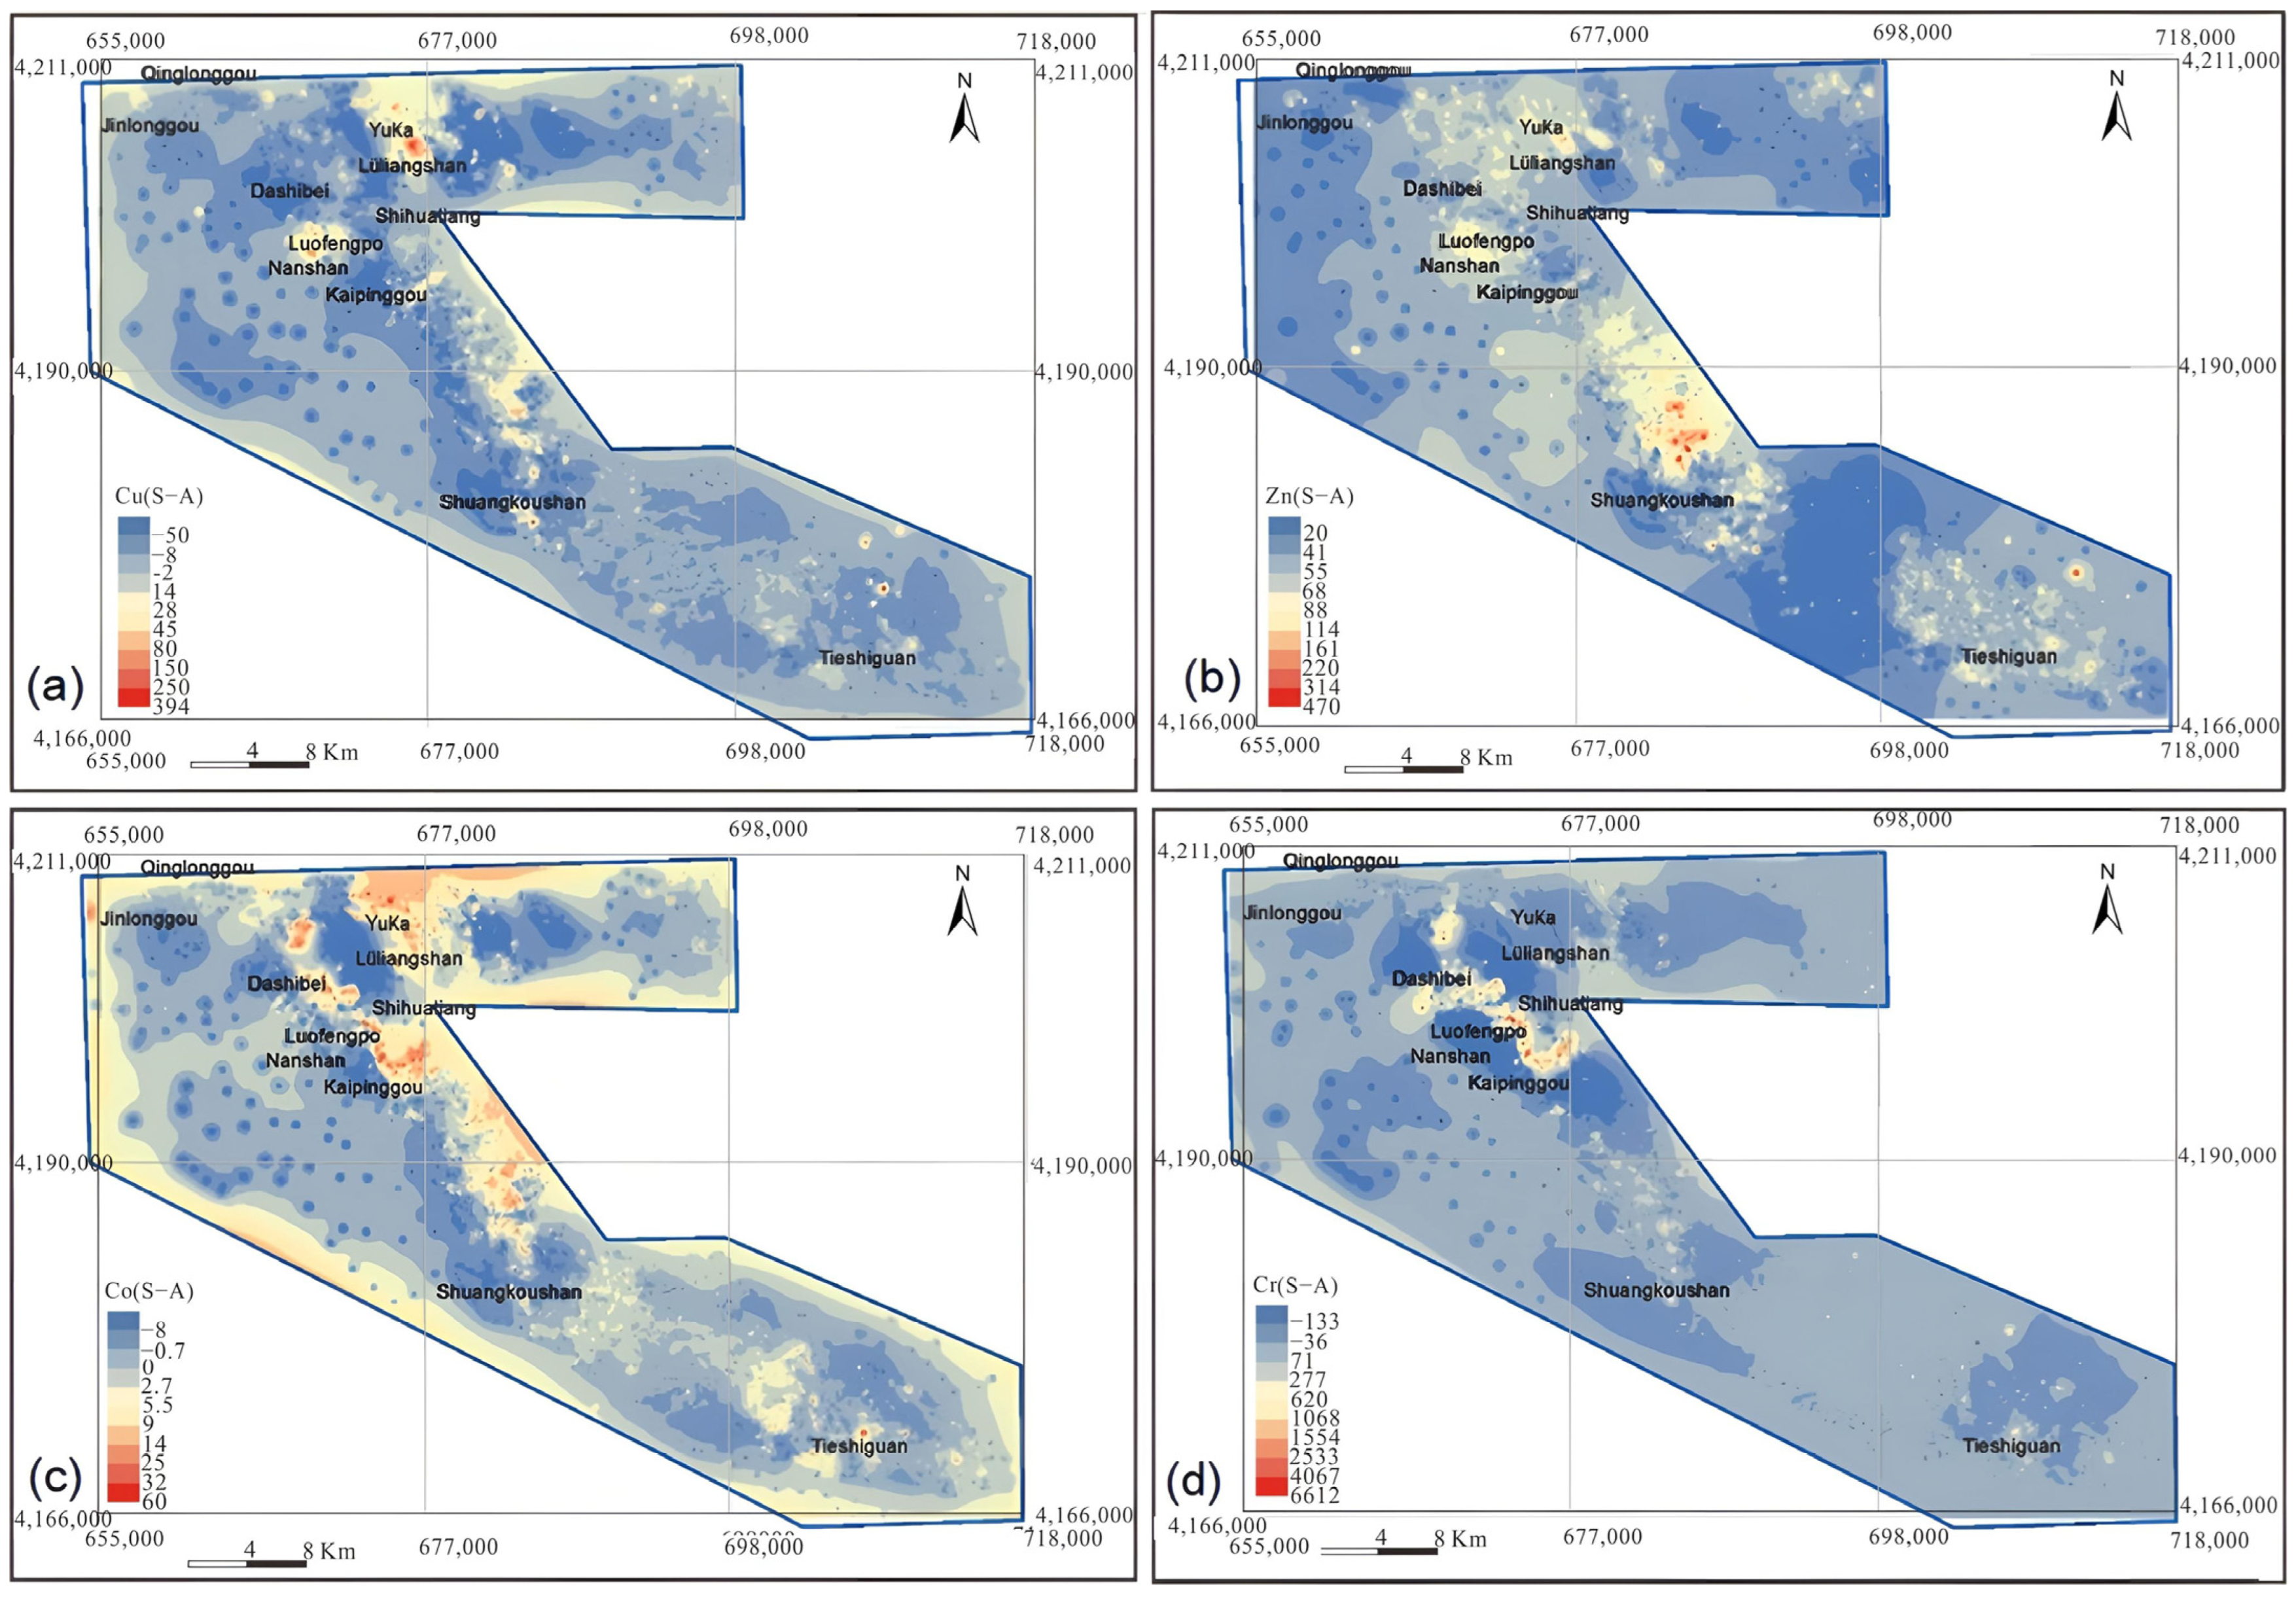
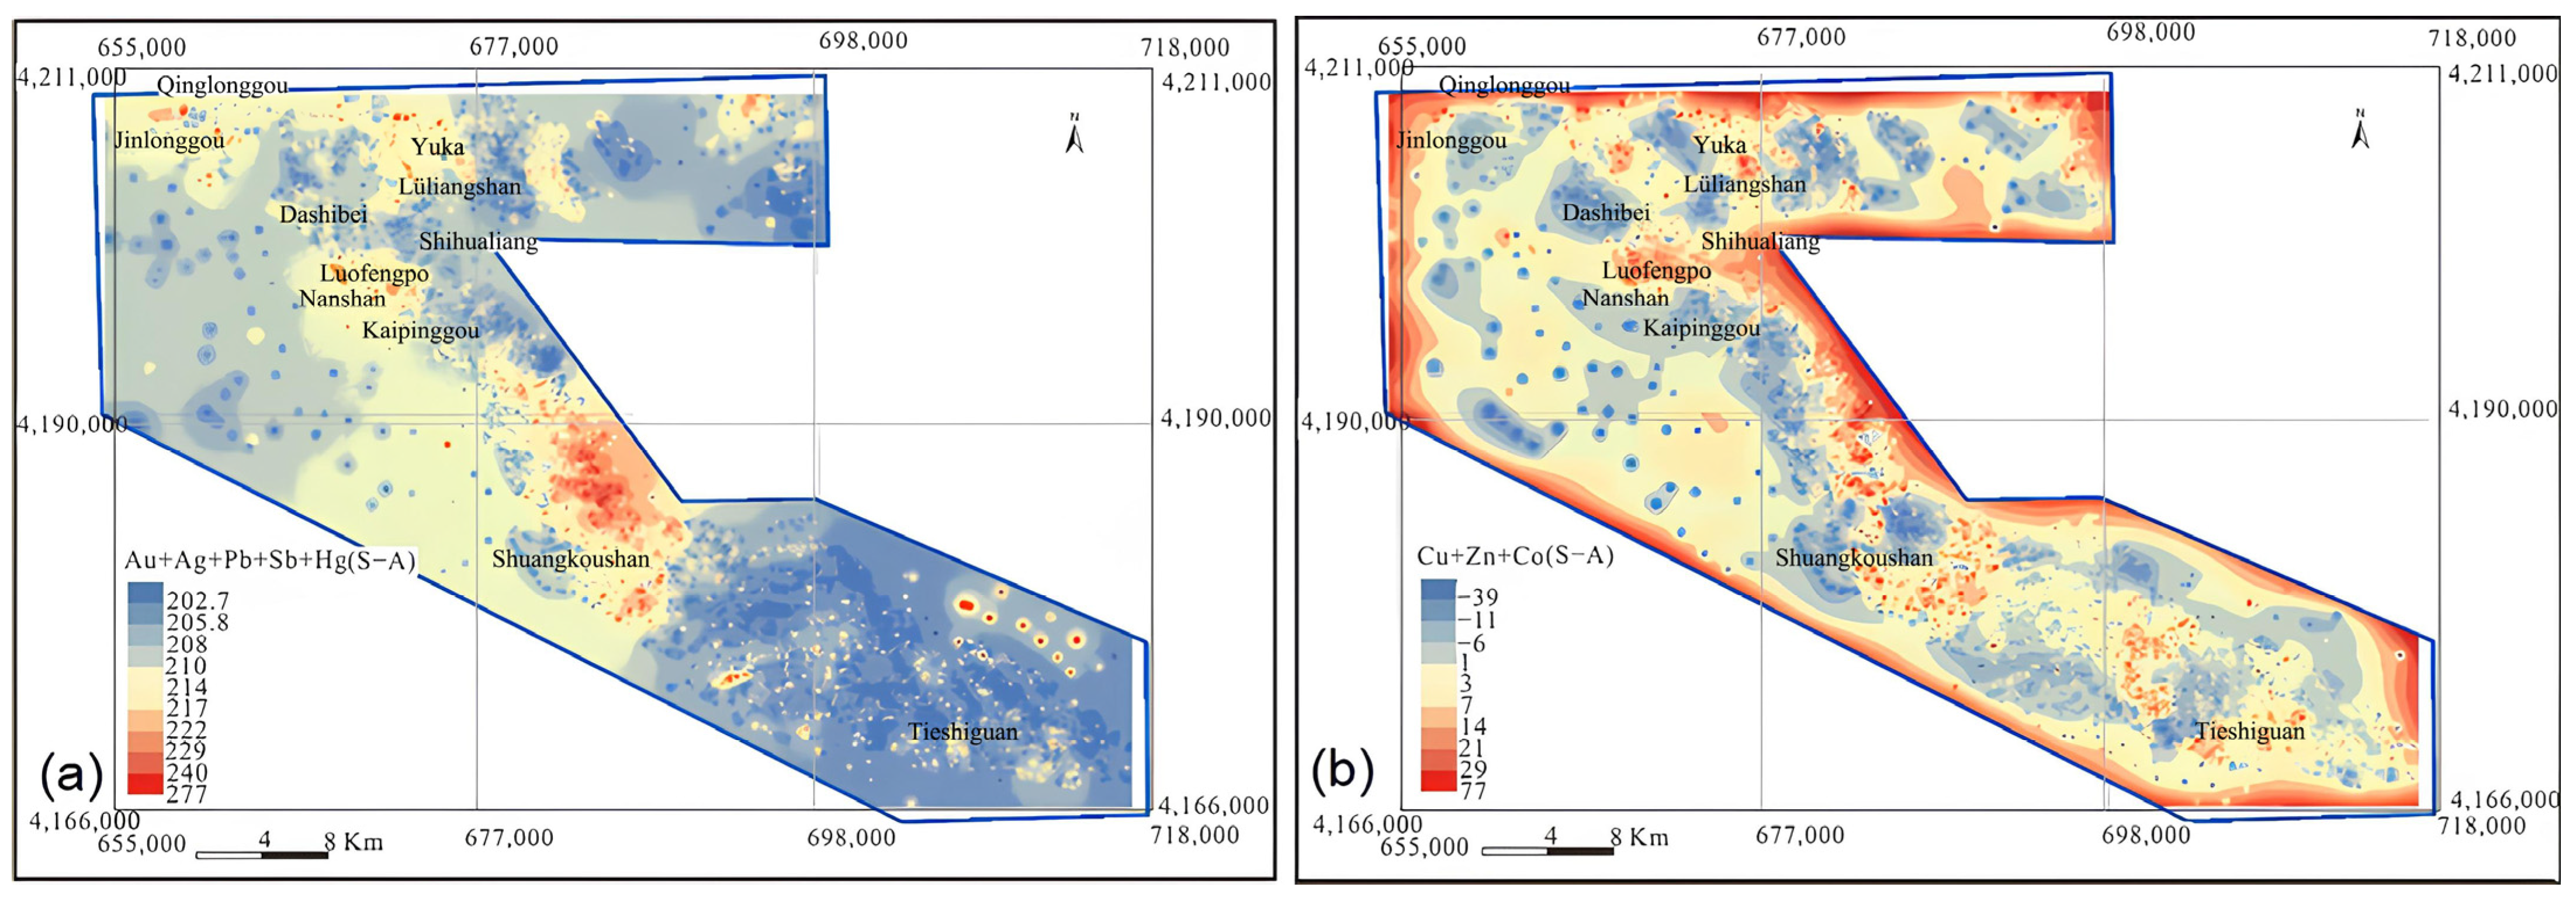
5.2. Geochemical Anomalies Identified by the S-A Method

Given that unsatisfactory results were obtained using the statistical method in the Lüliangshan area, which is characterized by a Gobi Desert landscape, the S-A method was used to identify weak anomalies related to mineralization. The S-A method does not require preprocessing of extreme or outlier values, thereby avoiding interference and extracting geochemical anomalies directly from the original element data structure. Its advantages are obvious: in addition to identifying the same anomalous areas as the statistical method, S-A can effectively delineate weak geochemical anomalies caused by metallogenic singularities while separating the anomaly field from the background field.
S-A was used to decompose the background and anomalies and obtain abnormal information of chemical elements from grid images obtained through MIDW interpolation. The data processing was as follows: spatial raster data were transformed from the spatial domain to the spectral domain via positive Fourier transform, followed by double logarithmic processing of the energy spectrum density (S) and identification of densities greater than a certain threshold. The least squares method was then utilized to fit three-segment equations. This study focused on the geochemical element Cu and the combined elements Cu + Zn + Co. Figure 8 shows the double logarithmic curve fitting results, where it can be observed that each R2 value of the fitting equation was greater than 0.98, indicating a significant fitting effect. For the individual geochemical element Cu (Figure 8a), the leftmost line (y = −1.32x + 21.09, 6.72 < lnS < 8.78) represents the interference factor, the middle line (y = −1.42x + 21.75, 8.78 < lnS < 9.74) represents the anomaly, and the rightmost line (y = −1.44x + 21.92, 9.74 < lnS < 10.88) represents the background. Similarly, for the combined elements Cu + Zn + Co (Figure 8b), three segments can be identified: the interference factor equation (y = −1.37x + 22.06, 9.90 < lnS < 12.20), the anomaly equation (y = −1.62x + 25.18, 12.20 < lnS < 12.81), and the background equation (y = −0.84x + 15.06, 12.81 < lnS < 13.04).
Results of the S-A fractal analysis for single elements Cu, Zn, Co, and Cr are shown in Figure 9. The analysis results for the combined element anomalies of Au + Ag + Pb + Sb + Hg and Cu + Zn + Co are shown in Figure 10.

5.3. Comparison between the Statistical and S-A Methods

The single element Cu, Co, and Cr anomalies (Figure 5 and Figure 10) were mainly distributed in the Lüliangshan and Luofengpo areas where they were characterized by obvious and wide-range anomalies. In other places, such as Tieshiguan and Shuangkoushan, there were weak Cu, Co, and Cr anomalies. The Zn anomaly was mainly distributed in Shuangkoushan.
We focused on the local region of Lüliangshan and Luofengpo, where the geochemical element Cu was predominantly distributed (Figure 11a,b), and the Shuangkoushan area, where Zn was present (Figure 11c,d). The statistical analysis results (Figure 11a,c) were compared with results from the S-A method (Figure 11b,d). The S-A results revealed delineated Cu anomalies in the Luofengpo area that aligned with known mineral occurrences. Additionally, the S-A method enhanced weak Cu anomalies that were identified by the statistical method, which were originally weakened by heavy cover or influenced by low background levels. This enhancement resulted in more obvious and distinguishable anomalies. In contrast, the S-A method highlighted more pronounced Zn anomalies in the Shuangkoushan area compared to the statistical method, producing more and stronger concentric centers.
The combined elements Cu, Zn, and Co were examined as an example in the locally enlarged regions of Lüliangshan, Luofengpo (Figure 12a,b), and Shuangkoushan (Figure 12c,d) areas. The results obtained through the statistical method (Figure 12a,c) and the S-A method (Figure 12b,d) were compared. They showed that S-A reduced the anomalous area of the combined elements more than the statistical method, while highlighting the geochemical anomaly. This allowed for more efficient discovery of potential mineralization.
The results for the single geochemical element Cu (Figure 11b) were compared with results for the combined geochemical elements Cu + Zn + Co (Figure 12b), both using the same S-A method. It was clear that the abnormal region of the combined elements Cu + Zn + Co covered a greater number of known Cu mining deposits compared to using only the single geochemical element Cu.
In Lüliangshan-Yuka, two anomalies were detected using the statistical method and three using the S-A method, with three known deposits present. In Luofengpo, the statistical method detected one anomaly and the S-A method detected four, with five known deposits present. No anomalies or known deposits were identified in Shuangkoushan.
The spatial relationships between Cu anomalies identified by different methods and the known deposits in the NQ were investigated. In the Lüliangshan-Yuka area, the statistical method detected two anomalies, while the S-A method detected three, and three known deposits were present. For the Luofengpo area, the statistical method identified one anomaly, and the S-A method revealed four, with five known deposits present. No anomalies or known deposits were identified in the Shuangkoushan area. In comparison to the less obvious anomalies delineated by the statistical method, the S-A method also identified Zn anomalies in Lüliangshan. This indicated that S-A was more capable of delineating the weak and small anomalies in the low background, considering the background variability. The results indicated that S-A had significant advantages for delineating geochemical anomalies in the NQ: (1) it highlighted geochemical anomalies associated with mineralization, and (2) it enhanced the identification of weak geochemical anomalies within a low background affected by heavy overburden. By combining the known mining deposits and ore points with the results obtained using the S-A method, a strong correlation was observed between the highlighted Cu and Cu-Zn anomalies in Lüliangshan, thus providing valuable targets for future exploration.

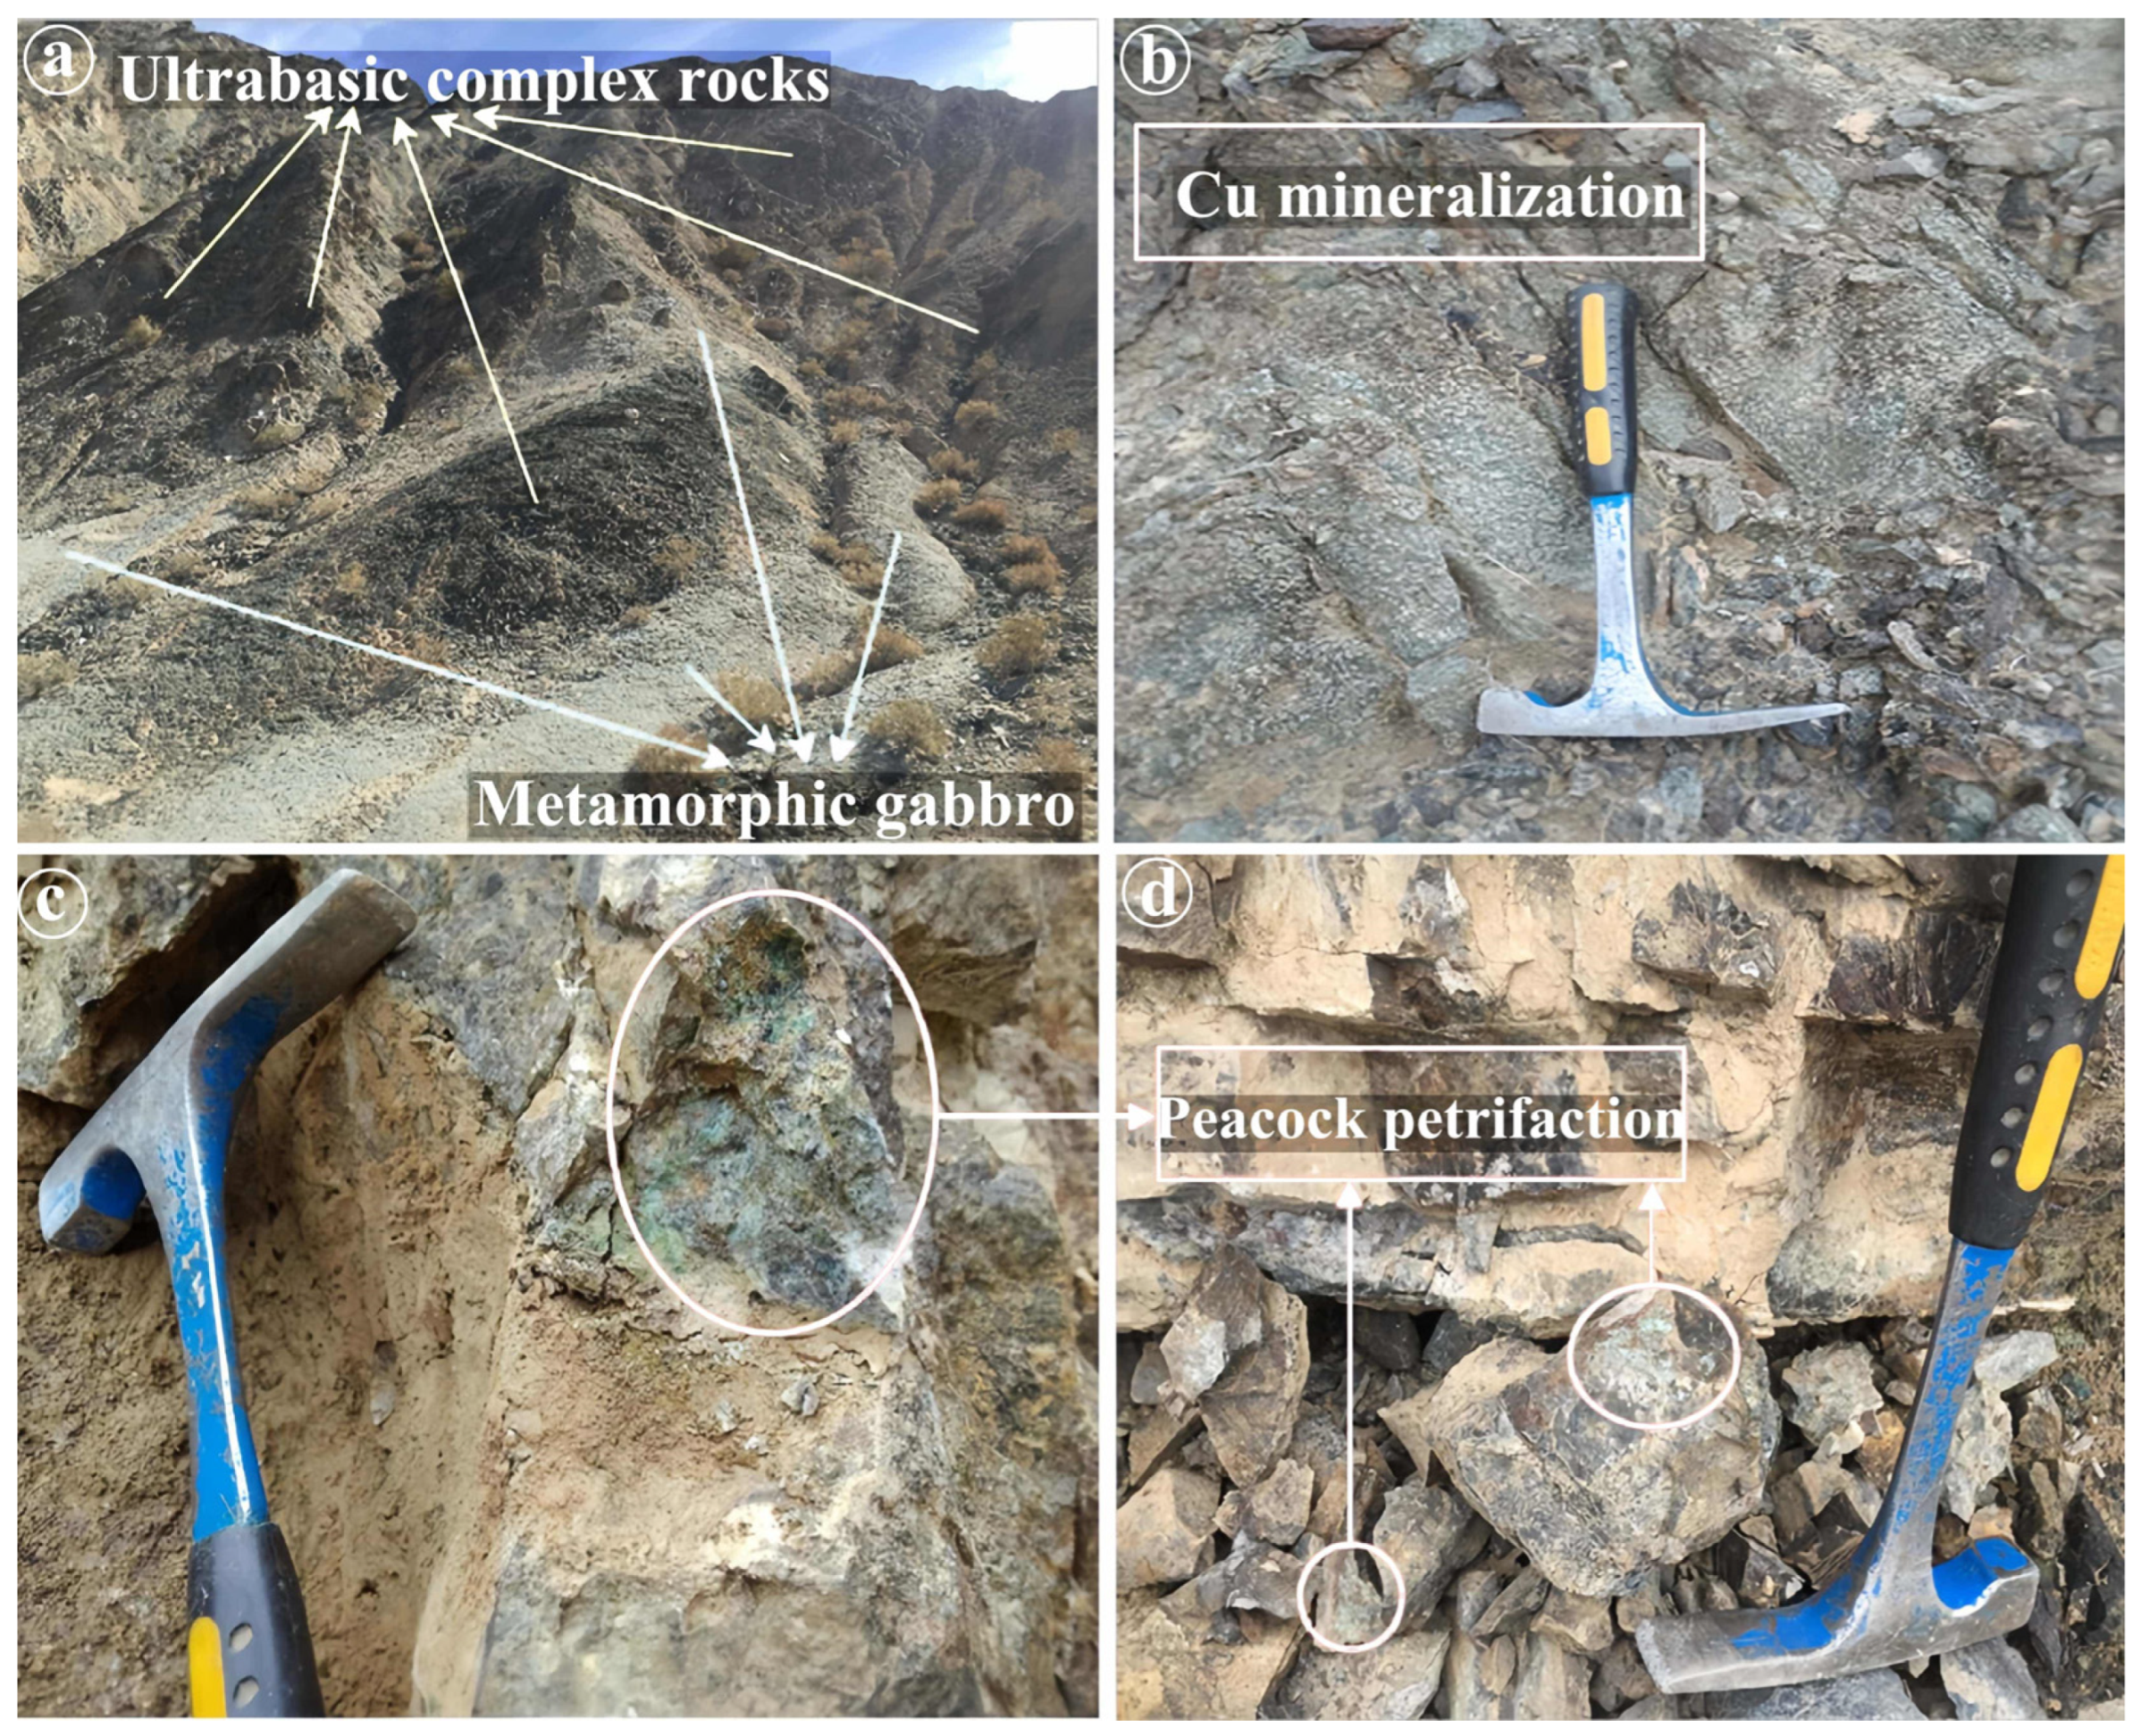
5.4. Potential Exploration Targets and Their Verification

Three exploration targets were delineated in the research area using statistical methods (Figure 13a) and four using the S-A method (Figure 13b), as shown by the combinatorial anomaly maps (Figure 13). Target I was situated in the Yuka–Dashibei–Lüliangshan area at the graph’s apex. The area has yielded several deposits, including the Yuka Au deposit and the Lüliangshan Cu deposit, which are, respectively, a volcanic massive sulfide deposit (VMS) and quartz vein-type Cu-Au deposit/mineralization. Additionally, significant peacock fossilization and mylonitization have been discovered. Target II was located in the Luofengpo area, where ferrochromite mineralization and several Cu mineralizations have been identified. Target III was situated in the Shuangkoushan area, characterized by various rock mixed areas, such as basaltic slate and ultrabasic rock in Cambrian Ordovician beaches, reflecting a high geological background of Co (Cr, Ni).
Geological exploration was used to validate the delineated targets. In the target I area, two types of mineralized ore bodies were identified. Firstly, the soil-like Cu mineralization’s ore body generally measured 2–8 m in width and 30–100 m in length. The surface was nearly cylindrical, with the drilling control extending well beyond the strike. After oxidation, the ore body turned into brown weathered rock, mainly composed of alum, potassium ferric alum, and secondary quartzite. The dominant sulfides were pyrite, chalcopyrite, and pyrite after washing, suggesting the possibility of massive sulfide Cu mineralization in the primary mineralization. Surface alteration of this ore body was not extensive. However, in the upper plate or the same horizon of the same layer, multi-layer ferrosiliceous rocks were produced in the 20–100 m green mud phyllite, forming intermittent interbeds influenced by late ductile deformation. Secondly, the Cu-Au mineralization related to the green mud schist phyllite was found in the upper plate of the soil-like Cu mineralization, occurring in the ductile shear zone. The exposed mineralized bodied had widths ranging from 0.3 to 3 m, determined by field geological observation and spectral analysis. Cu contents ranged from 1500 to 18,000 ppm and Au contents were 2–189 ppm, including visible Au in some sections. All the ore bodies in the Yuka area were found in an Au mineralization fracture zone measuring 1300 m in length and 500 m in width. Nearby, Au-bearing areas with 364 ppm and Cu up to 1500 ppm, larger than the regional background values, indicated good potential for Cu and Au prospecting in the area. Furthermore, multiple occurrences of Cu mineralization (peacock petrifaction) were found in Target II. Cu mineralization was identified in Luofengpo (Figure 14) using the target obtained by the S-A method in 2017, indicating a high possibility of new Cu deposits in Target II.
As verified above, more than industrial-grade Cu mineralization clues were found in the delineated target area, which can be used to direct future Cu exploration in this area.

6. Conclusions

The following conclusions can be drawn from this integrated study of geochemical anomalies.
(1)
The RFA method applied to log-ratio-transformed regional stream sediment-sampling geochemical data accurately identified associations between mineralization-related elements, such as Au, Ag, Pb, Sb, Hg, Cu, Zn, and Co.
(2)
The use of the S-A model on a single element or the component factor derived from RFA effectively reduced the anomaly area in high anomaly fields and highlighted weak anomalies in low background areas, surpassing the statistical Mean + 2SD method. The anomaly maps generated by the S-A model demonstrated good ore potential, with verification identifying numerous Cu ore bodies within the anomalous regions.
(3)
The combination of the Cu, Zn, and Co combinatorial elements anomaly map, field geological exploration, and regional geological structure revealed the presence of Cu ore bodies and Cu mineralization in the targeted area. Notably, the Lüliangshan and Luofengpo areas exhibited Au ore bodies primarily occurring in NW-striking ductile fractures, which were oriented along the NW–SE direction and showed a high coincidence of Cu and Co anomalies.
Therefore, the target area had considerable accuracy and economic value, pointing to the possibility for future exploration of Cu deposits in this area. It was also concluded that the combination of log-ratio, RFA and S-A is an effective method for identifying geochemical anomalies.

Author Contributions

Writing—original draft, S.Z., H.J. and X.C.; writing—review and editing, J.W., R.X., X.C. and Y.Y.; visualization, S.Z., X.C. and C.F.; investigation, C.F., R.X. and Y.Y.; methodology, J.W. and S.Z. All authors have read and agreed to the published version of the manuscript.

Funding

Research for this study was supported by the Qinghai Science and Technology Planning Project (2021-ZJ-741).

Data Availability Statement

Data is contained within the article.

Acknowledgments

We would like to express our sincere gratitude to Wuhan SampleSolution Analytical Technology Co., Ltd. for their generous support and assistance during the course of our research. Their expertise and resources have significantly contributed to the successful completion of our study.

Conflicts of Interest

The authors declare no conflicts of interest.

References

  1. Lima, A.; De Vivo, B.; Cicchella, D.; Cortini, M.; Albanese, S. Multifractal IDW interpolation and fractal filtering method in environmental studies: An application on regional stream sediments of (Italy), Campania region. Appl. Geochem. 2003, 18, 1853–1865. [Google Scholar] [CrossRef]
  2. Deecke, V.B.; Nykaenen, M.; Foote, A.D.; Janik, V.M. Vocal behaviour and feeding ecology of killer whales Orcinus orca around Shetland, UK. Aquat. Biol. 2011, 13, 79–99. [Google Scholar] [CrossRef]
  3. Jiang, X.J.; Chen, X.; Gao, S.B.; Zheng, Y.Y.; Ren, H.; Han, D.H.; Yan, C.C.; Jiang, J.S. The New Discovery of Ag-Pb-Zn Mineralization via Modern Portable Analytical Technology and Stream Sediment Data Processing Methods in Dajiacuo Area, Western Tibet (China). J. Earth Sci. 2020, 31, 668–682. [Google Scholar] [CrossRef]
  4. Carranza, E.J.M.; Hale, M. A catchment basin approach to the analysis of reconnaissance geochemical-geological data from Albay Province, Philippines. J. Geochem. Explor. 1997, 60, 157–171. [Google Scholar] [CrossRef]
  5. Cheng, Q.M. Mapping singularities with stream sediment geochemical data for prediction of undiscovered mineral deposits in Gejiu, Yunnan Province, China. Ore Geol. Rev. 2007, 32, 314–324. [Google Scholar] [CrossRef]
  6. Yousefi, N.; Gudarzi, M.M.; Zheng, Q.B.; Lin, X.Y.; Kim, J.K. Highly aligned, ultralarge-size reduced graphene oxide/polyurethane nanocomposites: Mechanical properties and moisture permeability. Compos. Part A 2013, 49, 42–50. [Google Scholar] [CrossRef]
  7. Chen, X.; Xu, R.K.; Zheng, Y.Y.; Jiang, X.J.; Du, W.Y. Identifying potential Au-Pb-Ag mineralization in SE Shuangkoushan, North Qaidam, Western China: Combined log-ratio approach and singularity mapping. J. Geochem. Explor. 2018, 189, 109–121. [Google Scholar] [CrossRef]
  8. Hawkes, H.E.; Webb, J.S. Geochemistry in Mineral Exploration. Soil Sci. 1963, 95, 283. [Google Scholar] [CrossRef]
  9. Tukey, J.W. Exploratory data analysis. J. Am. Stat. Assoc. 1977, 73, 885–887. [Google Scholar] [CrossRef]
  10. Zuo, R.G.; Wang, J.; Chen, G.X.; Yang, M.G. Identification of weak anomalies: A multifractal perspective. J. Geochem. Explor. 2015, 148, 12–24. [Google Scholar] [CrossRef]
  11. Zuo, R.G.; Carranza, E.J.M.; Wang, J. Spatial analysis and visualization of exploration geochemical data. Earth-Sci. Rev. 2016, 158, 9–18. [Google Scholar] [CrossRef]
  12. Zhao, J.N.; Chen, S.Y.; Zuo, R.G. Identifying geochemical anomalies associated with Au–Cu mineralization using multifractal and artificial neural network models in the Ningqiang district, Shaanxi, China. J. Geochem. Explor. 2016, 164, 54–64. [Google Scholar] [CrossRef]
  13. Stanley, C.R.; Sinclair, A.J. Comparison of Probability Plots and the Gap Statistic in the Selection of Thresholds for Exploration Geochemistry Data. J. Geochem. Explor. 1989, 32, 355–357. [Google Scholar] [CrossRef]
  14. Cheng, Q.M. Singularity theory and methods for mapping geochemical anomalies caused by buried sources and for predicting undiscovered mineral deposits in covered areas. J. Geochem. Explor. 2012, 122, 55–70. [Google Scholar] [CrossRef]
  15. Zhao, S.Y.; Kreuzer, P.O. Application of the tectono-geochemistry method to mineral prospectivity mapping: A case study of the Gaosong tin-polymetallic deposit, Gejiu district, SW China. Ore Geol. Rev. 2015, 71, 719–734. [Google Scholar] [CrossRef]
  16. Zheng, S.L.; Jiang, X.J.; Gao, S.B. Spatial Overlay Analysis of Geochemical Singularity Index α-Value of Porphyry Cu Deposit in Gangdese Metallogenic Belt, Tibet, Western China. Appl. Sci. 2023, 13, 10123. [Google Scholar] [CrossRef]
  17. Bai, J.; Porwal, A.; Hart, C.; Ford, A.; Yu, L. Mapping geochemical singularity using multifractal analysis: Application to anomaly definition on stream sediments data from Funin Sheet, Yunnan, China. J. Geochem. Explor. 2010, 104, 1–11. [Google Scholar] [CrossRef]
  18. Agterberg, F.P. Multifractals and geostatistics. J. Geochem. Explor. 2012, 122, 113–122. [Google Scholar] [CrossRef]
  19. Liu, Y.; Cheng, Q.M.; Xia, Q.L.; Wang, X.Q. Application of singularity analysis for mineral potential identification using geochemical data—A case study: Nanling W–Sn–Mo polymetallic metallogenic belt, South China. J. Geochem. Explor. 2013, 134, 61–72. [Google Scholar] [CrossRef]
  20. Wang, W.L.; Zhao, J.; Cheng, Q.M. Application of singularity index mapping technique to gravity/magnetic data analysis in southeastern Yunnan mineral district, China. J. Appl. Geophys. 2013, 92, 39–49. [Google Scholar] [CrossRef]
  21. Zuo, R.G.; Xia, Q.L.; Wang, H.C. Compositional data analysis in the study of integrated geochemical anomalies associated with mineralization. Appl. Geochem. 2013, 28, 202–211. [Google Scholar] [CrossRef]
  22. Zuo, R.G.; Xia, Q.L.; Zhang, D.J. A comparison study of the C-A and S-A models with singularity analysis to identify geochemical anomalies in covered areas. Appl. Geochem. 2013, 33, 165–172. [Google Scholar] [CrossRef]
  23. Bonham-Carter, G. Geographic Information Systems for Geoscientists: Modelling with GIS; Pergamon: Oxford, UK, 1994; p. 398. [Google Scholar] [CrossRef]
  24. Reimann, C.; Filzmoser, P. Normal and lognormal data distribution in geochemistry: Death of a myth. Consequences for the statistical treatment of geochemical and environmental data. Environ. Geol. 2000, 39, 1001–1014. [Google Scholar] [CrossRef]
  25. Filzmoser, P.; Hron, K.; Reimann, C.; Garrett, R. Robust factor analysis for compositional data. Comput. Geosci. 2009, 35, 1854–1861. [Google Scholar] [CrossRef]
  26. Filzmoser, P.; Todorov, V. An Object-Oriented Framework for Robust Multivariate Analysis. J. Stat. Softw. 2009, 32, 1–47. [Google Scholar] [CrossRef]
  27. Piepel, G.F. The Statistical Analysis of Compositional Data. Technometrics 1988, 30, 120–121. [Google Scholar] [CrossRef]
  28. Buccianti, A. Frequency Distributions of Geochemical Data, Scaling Laws, and Properties of Compositions. Pure Appl. Geophys. 2014, 172, 1851–1863. [Google Scholar] [CrossRef]
  29. Buccianti, A.; Grunsky, E. Compositional data analysis in geochemistry: Are we sure to see what really occurs during natural processes? J. Geochem. Explor. 2015, 141, 1–5. [Google Scholar] [CrossRef]
  30. Song, S.G.; Su, L.; Li, X.H.; Zhang, G.B.; Niu, Y.L.; Zhang, L.F. Tracing the 850-Ma continental flood basalts from a piece of subducted continental crust in the North Qaidam UHPM belt, NW China. Precambrian Res. 2010, 183, 805–816. [Google Scholar] [CrossRef]
  31. Xu, G.D. The Genesis Study of Shuangkoushan Lead-Zinc Deposit, Qinghai Province. Master’s Thesis, China University of Geosciences, Wuhan, China, 2012. (In Chinese). [Google Scholar]
  32. González, M.T.; Wu, S.M.; Huber, R.; Van Der Molen, S.; Schönenberger, C.; Calame, M. Electrical Conductance of Molecular Junctions by a Robust Statistical Analysis. Nano Lett. 2006, 6, 2238–2242. [Google Scholar] [CrossRef] [PubMed]
  33. Xie, X.J.; Mu, X.; Ren, T.X. Geochemical mapping in China. J. Geochem. Explor. 1997, 60, 99–113. [Google Scholar] [CrossRef]
  34. Xie, X.J.; Wang, X.Q.; Zhang, Q.; Zhou, G.H.; Cheng, H.X.; Liu, D.W.; Cheng, Z.Z.; Xu, S.F. Multi-scale geochemical mapping in China. Geochemistry 2008, 8, 333–341. [Google Scholar] [CrossRef]
  35. Xu, R.K.; Zheng, Y.Y.; Zhou, B.; Wu, L.; Zhu, H.Y.; Zhang, Y.; Ma, C.; Lu, D. The Metallogenic Regularity and Inspiration Prospecting of Copper Lead-Zinc Deposit Associated with Orogenic in the Lüliangshan Area Northern Margin of Qaidam Basin. Northwestern Geol. 2012, 45, 192–201. (In Chinese) [Google Scholar] [CrossRef]
  36. Chen, X. Metallogenic Conditions of Eclogite-Type Rutile Deposit from the North Qaidam UHP Metamorphic Belt and Their Implications for Mineral Exploration. Ph.D. Thesis, China University of Geosciences, Wuhan, China, 2020. (In Chinese). [Google Scholar] [CrossRef]
  37. Sandstrm, H.; Reeder, S.; Bartha, A.; Birke, M.; Berge, F.; Davidsen, B.; Grimstvedt, A.; Hagel-Brunnstr, M.M.; Kantor, W.; Kallio, E. Sample preparation and analysis. Geochem. Atlas Eur. Part 2005, 1–14. [Google Scholar]
  38. Egozcue, J.J.; Pawlowsky-Glahn, V.; Mateu-Figueras, G.; Barceló-Vidal, C. Isometric logratio transformations for compositional data analysis. Math. Geol. 2003, 35, 279–300. [Google Scholar] [CrossRef]
  39. Carranza, E.J.M. Analysis and mapping of geochemical anomalies using logratio-transformed stream sediment data with censored values. J. Geochem. Explor. 2011, 110, 167–185. [Google Scholar] [CrossRef]
  40. Filzmoser, P.; Hron, K.; Reimann, C. Univariate statistical analysis of environmental (compositional) data: Problems and possibilities. Sci. Total Environ. 2009, 407, 6100–6108. [Google Scholar] [CrossRef] [PubMed]
  41. Zhao, J.; Wang, W.L.; Dong, L.H.; Yang, W.Z.; Cheng, Q.M. Application of geochemical anomaly identification methods in mapping of intermediate and felsic igneous rocks in eastern Tianshan, China. J. Geochem. Explor. 2012, 122, 81–89. [Google Scholar] [CrossRef]
  42. Filzmoser, P.; Hron, K.; Reimann, C. Principal component analysis for compositional data with outliers. Environmetrics 2009, 20, 621–632. [Google Scholar] [CrossRef]
  43. Filzmoser, P.; Hron, K. Correlation Analysis for Compositional Data. Math. Geosci. 2009, 41, 905. [Google Scholar] [CrossRef]
  44. Aitchison, J. The Statistical Analysis of Compositional Data. J. R. Statist. Soc. B 1982, 44, 139–177. [Google Scholar] [CrossRef]
  45. Afzal, P.; Alghalandis, Y.F.; Khakzad, A.; Moarefvand, P.; Omran, N.R. Delineation of mineralization zones in porphyry Cu deposits by fractal concentration–volume modeling. J. Geochem. Explor. 2011, 108, 220–232. [Google Scholar] [CrossRef]
  46. Filzmoser, P.; Hron, K. Outlier Detection for Compositional Data Using Robust Methods. Math. Geosci. 2008, 40, 233–248. [Google Scholar] [CrossRef]
  47. Zuo, R.G. Identification of geochemical anomalies associated with mineralization in the Fanshan district, Fujian, China. J. Geochem. Explor. 2014, 139, 170–176. [Google Scholar] [CrossRef]
  48. Pison, G.; Rousseeuw, P.J.; Filzmoser, P.; Croux, C. Robust factor analysis. J. Multivar. Anal. 2003, 84, 145–172. [Google Scholar] [CrossRef]
  49. Templ, M.; Hron, K.; Filzmoser, P. robCompositions: Robust Estimation for Compositional Data. Biosci. Biotechnol. Biochem. 2017, 70, 1875–1881. [Google Scholar] [CrossRef]
  50. Turcotte, D.L. (Ed.) Fractals and Chaos in Geology and Geophysics: Fragmentation, 2nd ed.; Cambridge University Press: Cambridge, UK, 1997; p. 414. [Google Scholar]
  51. Cheng, Q.M. Spatial and scaling modelling for geochemical anomaly separation. J. Geochem. Explor. 1999, 65, 175–194. [Google Scholar] [CrossRef]
  52. Zuo, R.G. Decomposing of mixed pattern of arsenic using fractal model in Gangdese belt, Tibet, China. Appl. Geochem. 2011, 26, S271–S273. [Google Scholar] [CrossRef]
  53. Cheng, Q.; Xia, Q.; Li, W.; Zhang, S.; Chen, Z.; Zuo, R.G.; Wang, W. Density/area power-law models for separating multi-scale anomalies of ore and toxic elements in stream sediments in Gejiu mineral district, Yunnan Province, China. Biogeosciences 2010, 7, 3019–3025. [Google Scholar] [CrossRef]
  54. Cheng, Q.M. Multifractal and geostatistic methods forcharacterizing local structure and singularityproperties of exploration geochemical anomalies. Earth Sci. (J. China Univ. Geosci.) 2001, 26, 161–166. (In Chinese) [Google Scholar]
  55. Cheng, Q.M. Interpolation by means of multiftractal, kriging and moving average techniques. In Proceedings of the GAC/MAC Meeting of GeoCanada2000, Calgary, AB, Alberta, 29 May 2000. [Google Scholar]
  56. Zuo, R.G. Identifying geochemical anomalies associated with Cu and Pb-Zn skarn mineralization using principal component analysis and spectrum-area fractal modeling in the Gangdese Belt, Tibet (China). J Geochem Explor. 2011, 111, 13–22. [Google Scholar] [CrossRef]
  57. Cheng, Q.M. A New Model for Quantifying Anisotropic Scale Invariance and for Decomposition of Mixing Patterns. Math. Geol. 2004, 36, 345–360. [Google Scholar] [CrossRef]
  58. Qiuming, C.; Agterberg, F.P.; Ballantyne, S.B. The separation of geochemical anomalies from background by fractal methods. J. Geochem. Explor. 1994, 51, 109–130. [Google Scholar] [CrossRef]
  59. Cheng, Q.M. Multifractal distribution of eigenvalues and eigenvectors from 2D multiplicative cascade multifractal fields. Math. Geol. 2005, 37, 915–927. [Google Scholar] [CrossRef]
  60. Carranza, E.J.M. Geochemical Anomaly and Mineral Prospectivity Mapping in GIS; Elsevier: Amsterdam, The Netherlands, 2008; p. 368. [Google Scholar]
  61. Cheng, Q.M.; Agterberg, F.P. Singularity analysis of ore-mineral and toxic trace elements in stream sediments. Comput Geosci. 2009, 35, 234–244. [Google Scholar] [CrossRef]
  62. Pang, B.; Wu, S.; Yu, Z.Z.; Fan, L.Y.; Li, J.B.; Zheng, L.; Chen, H.; Li, X.X.; Shi, G.W. Rapid Exploration Using pXRF Combined with Geological Connotation Method (GCM): A Case Study of the Nuocang Cu Polymetallic District, Tibet. Minerals 2022, 12, 514. [Google Scholar] [CrossRef]
Figure 1. Satellite image of China (a), Qinghai Province (b) and the research area (c) in the NQ. Data from Google Earth.
Applsci 14 02597 g001
Figure 2. Sketch map of geological structures in the NQ (a) and the research area (b).
Applsci 14 02597 g002
Figure 3. Map of deposits and sampling locations in the NQ research area [35,36].
Applsci 14 02597 g003
Figure 4. Histograms of (a) Cu, (b) Co, and (c) Zn for the ILR-transformed regional geochemical data from the NQ.
Applsci 14 02597 g004
Figure 5. Spatial distributions for anomalies of Cu (a), Zn (b), Co (c), Cr (d) using the statistical method.
Applsci 14 02597 g005
Figure 6. Factor-loading plots for RFA based on log-ratio-transformed data for the regional geochemical data from the NQ.
Applsci 14 02597 g006
Figure 7. Biplots of RFA based on log-ratio -transformed data for the regional geochemical data, NQ.
Applsci 14 02597 g007
Figure 8. Double logarithm curve fitting results for the S-A model for Cu (a) and Cu + Zn + Co (b).
Applsci 14 02597 g008
Figure 9. Spatial distributions for anomalies of Cu (a), Zn (b), Co (c), Cr (d) based on the S-A method.
Applsci 14 02597 g009
Figure 10. Spatial distributions for mineralization-related multi element anomalies of Cu + Ag + Pb + Sb + Hg (a) and Cu + Zn + Co (b) based on the S-A method.
Applsci 14 02597 g010
Figure 11. Spatial distributions for anomalies of Cu (a,b), Zn (c,d) by the statistical method (a,c) and the S-A method (b,d) [35,36].
Applsci 14 02597 g011
Figure 12. Spatial distributions for mineralization-related multi element Cu + Zn + Co anomalies based on the statistical method (a,c) and the S-A method (b,d) [35,36].
Applsci 14 02597 g012
Figure 13. Spatial distribution maps showing the combined anomalies of Cu, Zn, and Co using statistical methods (a) and S-A method (b) [35,36].
Applsci 14 02597 g013
Figure 14. Representative photographs of rocks and Cu mineralization from geochemically anomalous areas in Luofengpo. (a) Ultrabasic complex rocks and metamorphic gabbro rocks; (b) Cu mineralization; (c,d) Peacock petrifaction.
Applsci 14 02597 g014
Table 1. Statistical characteristics of stream sediment elements from Lüliangshan and Shuangkoushan, NQ.
ElementMinMaxMeanMedianStandard DeviationSkewnessKurtosisCoefficient of Variation
Au04981.310.741.122070.57
Ag0.020.080.040.040.0161.4242500.33
Cu2.683.426.319.3196.2780.73
Pb4.839.822.321.65.724.27880.26
Zn1.7124.947.546.225.724.27880.54
Cr2.5497.411565.9126.89.31321.1
Ni1.8181.946.529.445.16.8610.97
Co1.346.815.111.310.52.2120.7
W0.214.361.471.190.9623.947550.65
Mo0.012.160.670.540.4921.856640.74
Cd0.010.230.0920.080.0516.555180.5
As0.6414.855.374.453.1516.23940.59
Sb0.11.050.420.370.218.511220.49
Hg00.030.010.01034.6315570.3
Bi0.010.920.250.180.2223.079350.87
Note: The unit for the element Au is ppb, while the unit for other elements is ppm.
Table 2. Anomaly threshold values calculated using the Mean + 2SD method for regional geochemical data in the NQ.
ElementAuAgCuPbZnCrNiCoWMoCdAsSbHgBi
Calculated value2.70.06464.333.899368.7136.636.23.381.660.18411.660.840.020.69
Applied value2.70.06565.034100370137363.381.660.18120.840.020.70
Note: The unit for the element Au is ppb, while the unit for other elements is ppm.
Table 3. Main factor loading.
TypeAgAsAuCuCdPbSbZnNiCoCrWMoHgBi
F10.73 0.10 0.38 0.25 0.01 0.76 0.25 0.31 0.46 0.29 0.37 0.16 0.29 0.75 0.06
F20.14 0.38 0.02 0.71 0.02 0.35 0.17 0.51 0.23 0.77 0.09 0.48 0.36 0.13 0.21
Disclaimer/Publisher’s Note: The statements, opinions and data contained in all publications are solely those of the individual author(s) and contributor(s) and not of MDPI and/or the editor(s). MDPI and/or the editor(s) disclaim responsibility for any injury to people or property resulting from any ideas, methods, instructions or products referred to in the content.

