Review

Finite Element Modeling of Cells Adhering to a Substrate: An Overview

by
Lorenzo Santoro
1,
Lorenzo Vaiani
1,
Antonio Boccaccio
1,*,
Luciano Lamberti
1,*,
Lorenzo Lo Muzio
2,
Andrea Ballini
2 and
Stefania Cantore
1
1
Dipartimento di Meccanica, Matematica e Management, Politecnico di Bari, 70125 Bari, Italy
2
Dipartimento di Medicina Clinica e Sperimentale, Università di Foggia, 71122 Foggia, Italy
*
Authors to whom correspondence should be addressed.
Appl. Sci. 2024, 14(6), 2596; https://doi.org/10.3390/app14062596
Submission received: 16 February 2024 / Revised: 17 March 2024 / Accepted: 19 March 2024 / Published: 20 March 2024
(This article belongs to the Special Issue New Trends in Biosciences III)

Abstract

:
In tissue formation and regeneration processes, cells often move collectively, maintaining connections through intercellular adhesions. However, the specific roles of cell–substrate and cell-to-cell mechanical interactions in the regulation of collective cell migration are not yet fully understood. Finite element modeling (FEM) may be a way to assess more deeply the biological, mechanical, and chemical phenomena behind cell adhesion. FEM is a powerful tool widely used to simulate phenomena described by systems of partial differential equations. For example, FEM provides information on the stress/strain state of a cell adhering to a substrate, as well as on its mechanobiological behavior. This review paper, after briefly describing basic principles of cell adhesion, surveys the most important studies that have utilized FEM to investigate the structural response of a cell adhering to a substrate and how the forces acting on the cell–substrate adhesive structures affect the global cell mechanical behavior.

1. Introduction

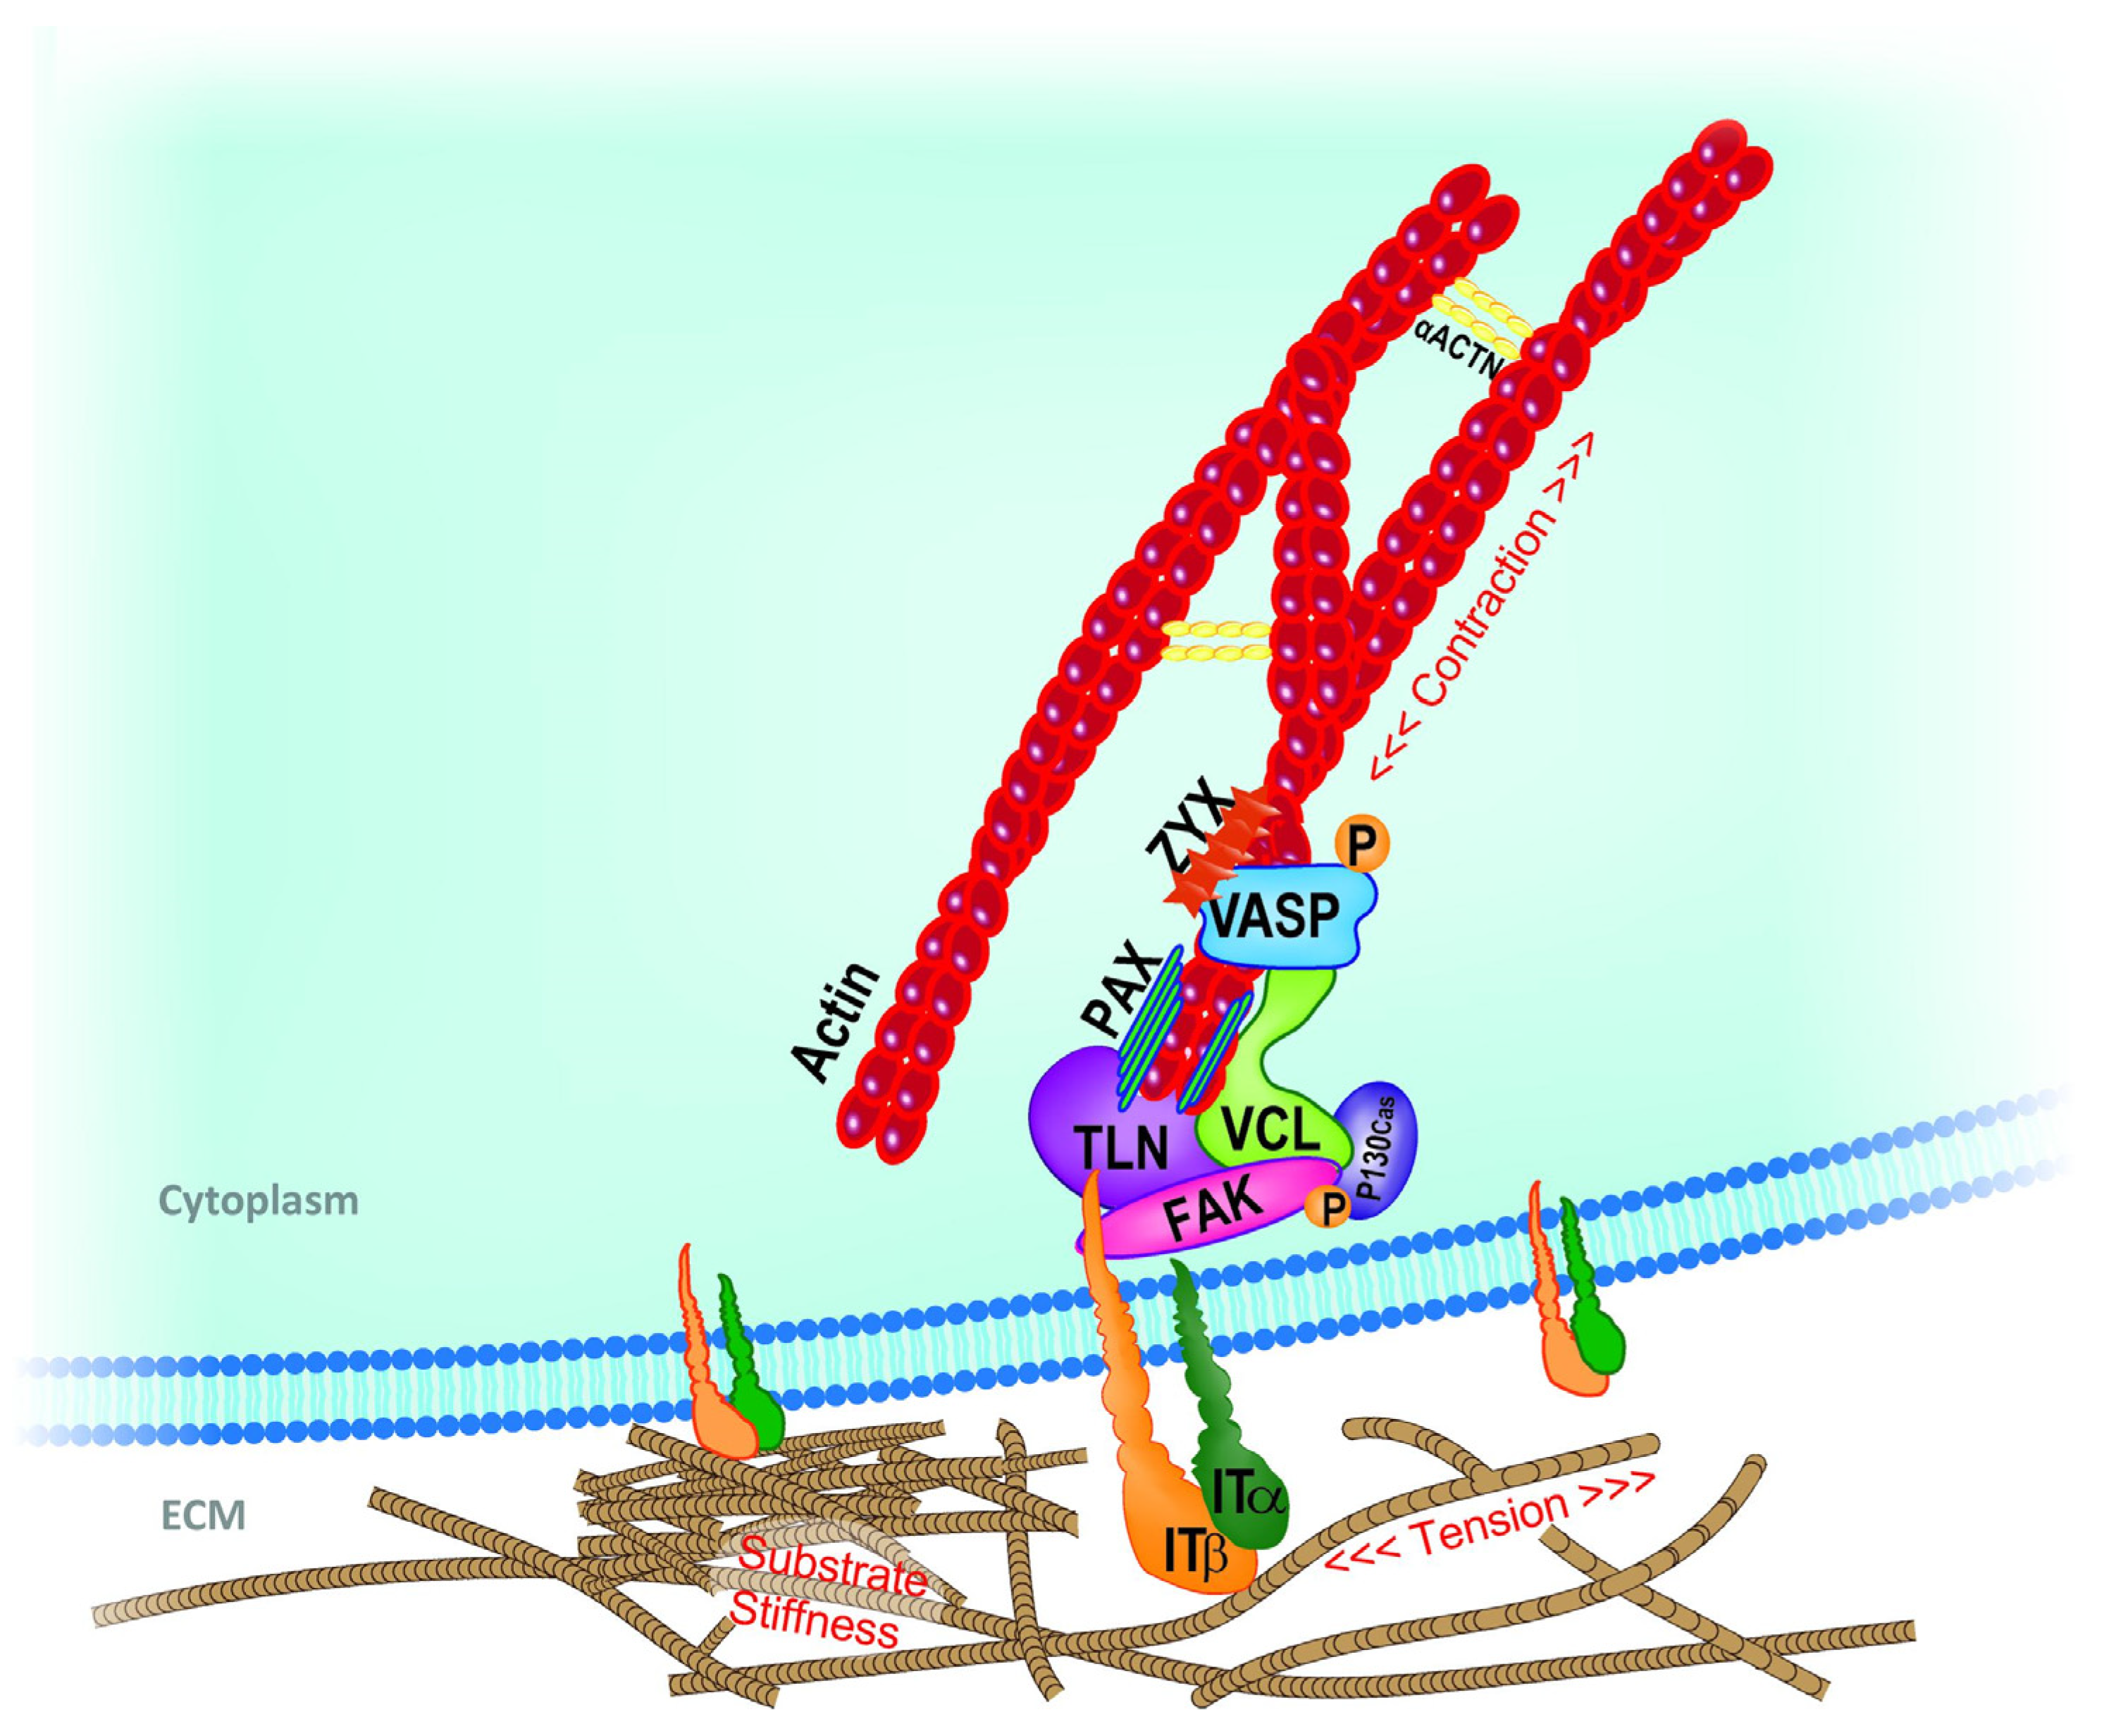
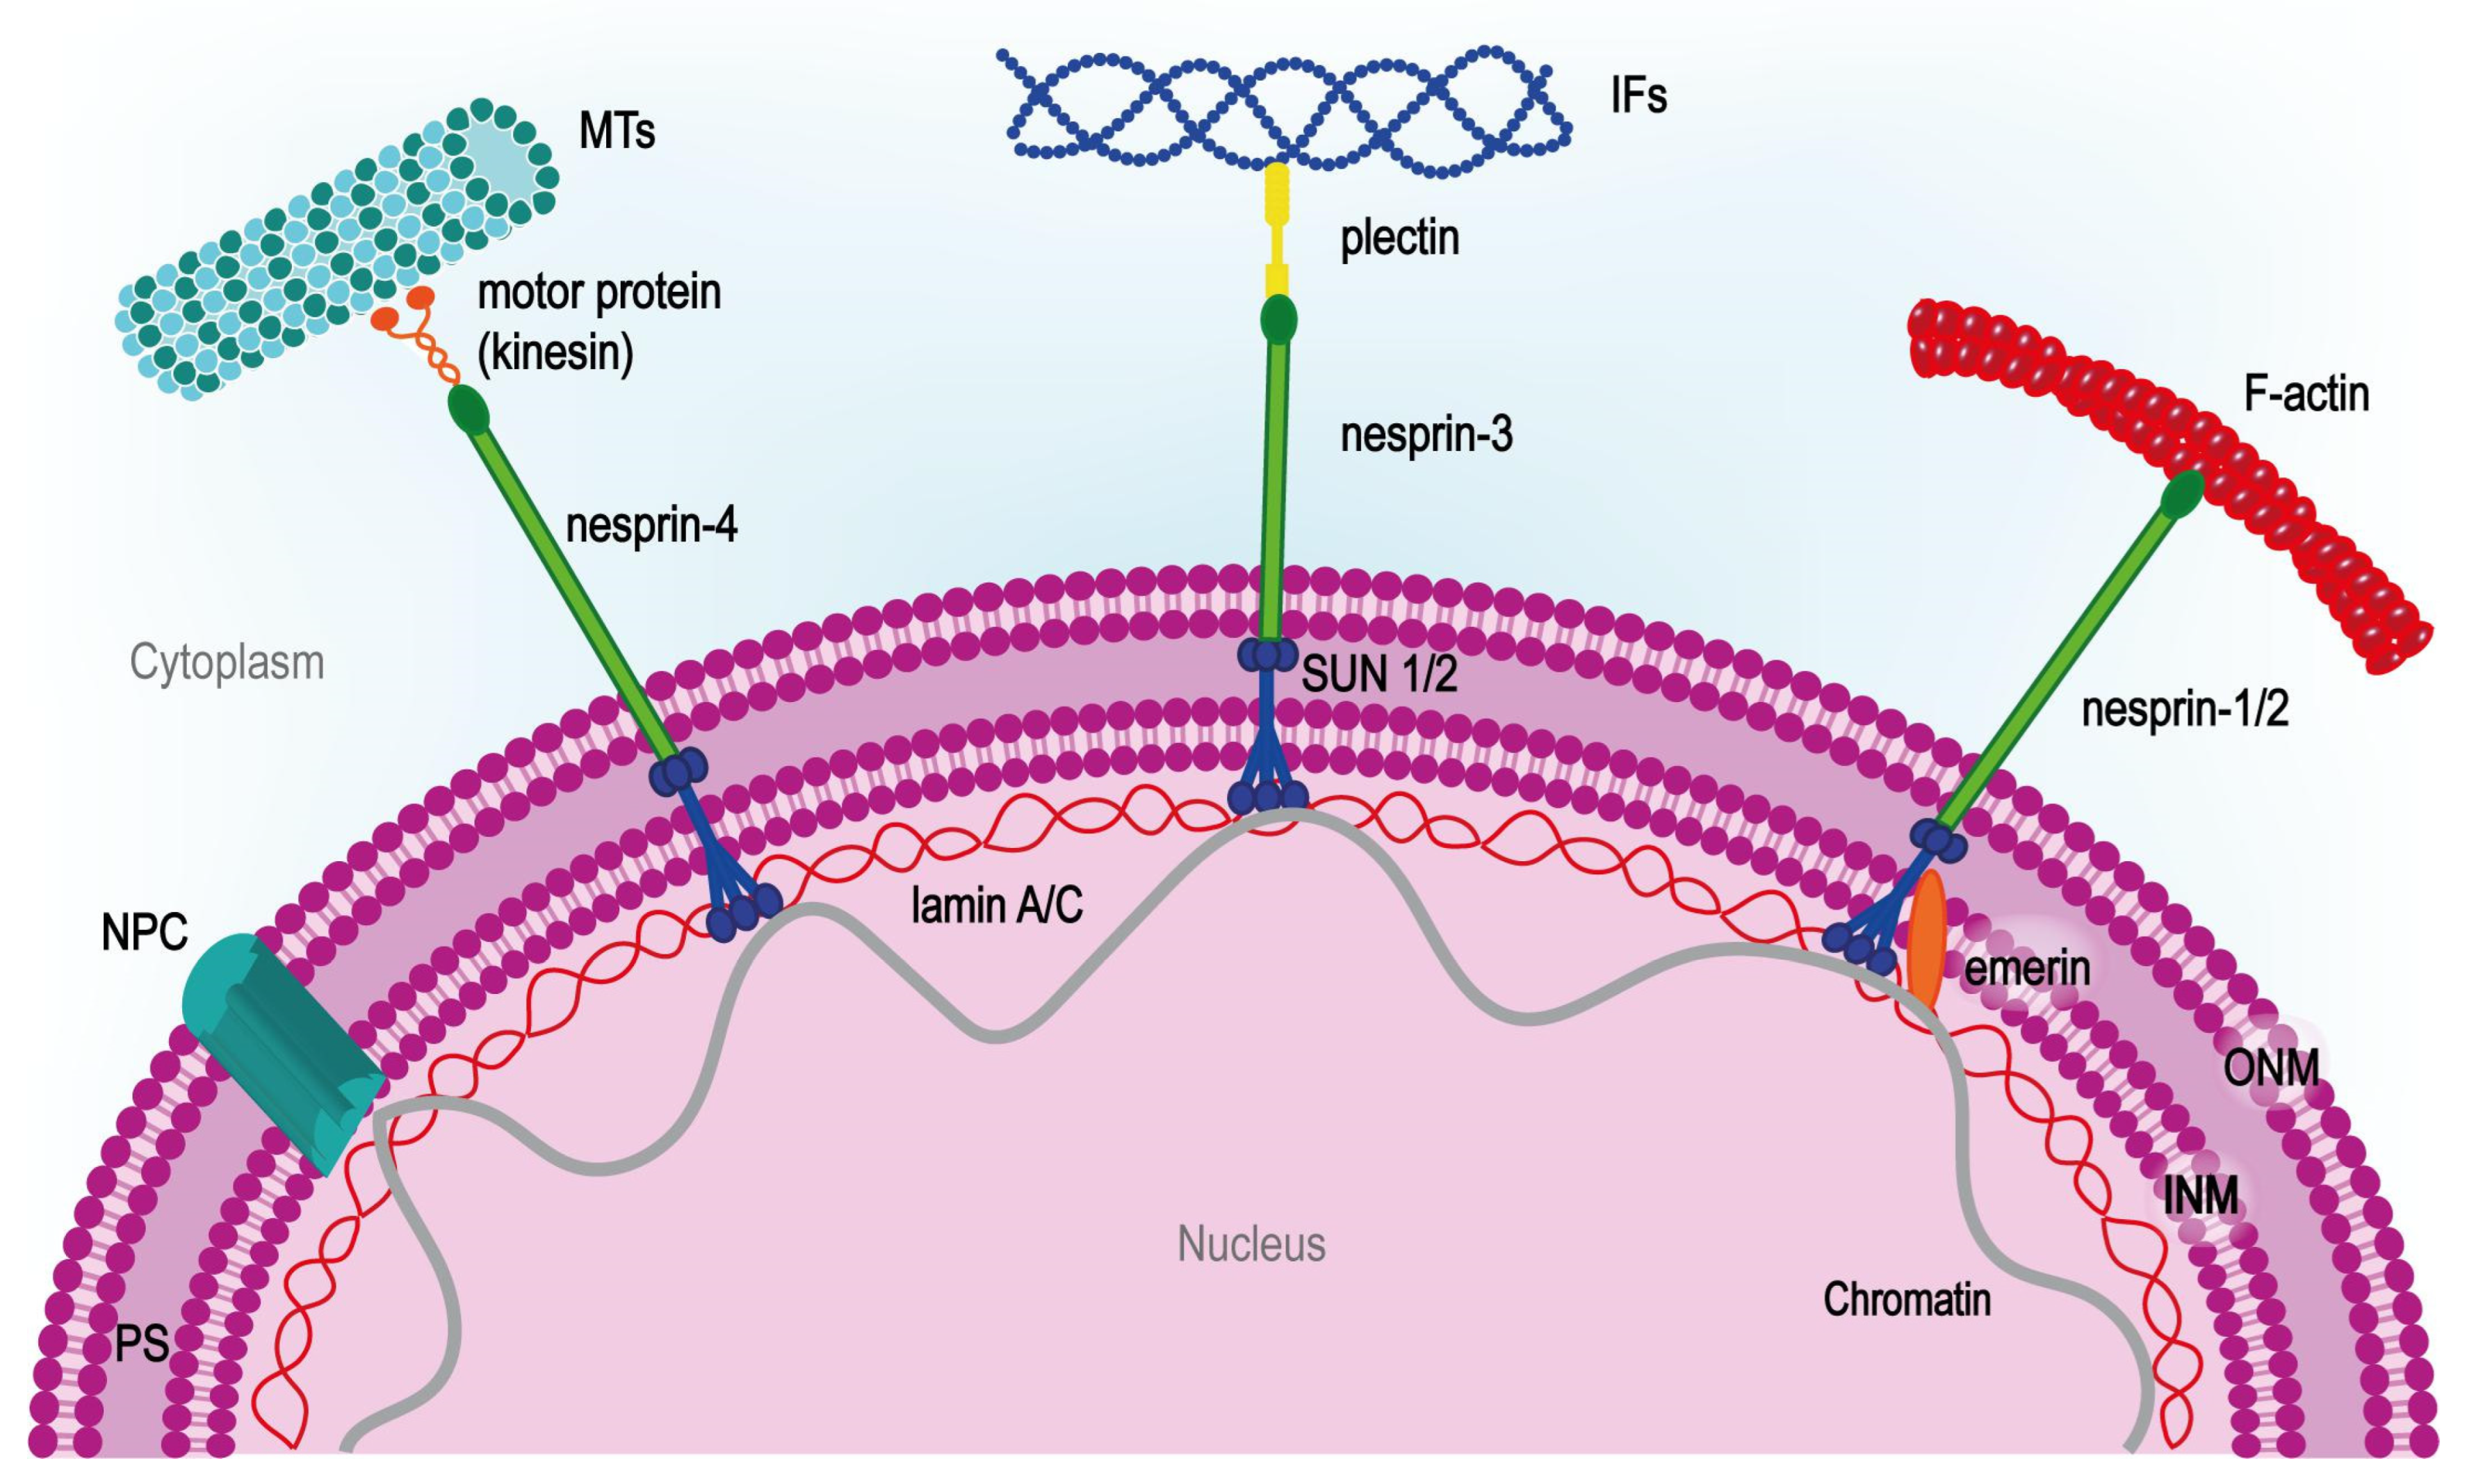
1.1. Theoretical Background (Principles) of Cell Adhesion and Mechanotransduction Mechanism

The interaction between the cell and environment originating from cell–substrate contact is mediated by cell adhesion phenomena entailed in crucial cell mechanisms (e.g., motility and cellular life cycle phases from growth to differentiation) [1,2,3,4,5,6,7,8,9,10,11,12,13,14,15,16,17,18,19]. The assembly of protein complexes called focal adhesions (FAs), deriving from early protein agglomerate at the lamellipodia–environment interface, allows cells to adhere to the underlying surface and carry on cellular activities triggered by cell–environment interaction [20,21,22,23,24,25,26,27]. FA architecture consists of (i) transmembrane proteins (i.e., integrins), which link to extra-cellular matrix ligands, thus ensuring cell–substrate connection; and (ii) an intracellular protein structure composed of vinculin, paxillin, talin, adaptor protein p130Cas, zyxin, vasodilator-stimulated phosphoprotein, and focal adhesion kinase, which binds integrins to stress fibers, thus enabling the interaction between cytoskeleton and cellular membrane [28,29,30,31,32,33,34] (Figure 1). The cytoskeleton serves as a framework, offering mechanical support to the cell to uphold specific morphology and internal organization. Cytoskeleton structural components (i.e., F-actin bundles (F-abs), microtubules (MTs), and intermediate filaments (IFs)) are, in turn, connected to internal nuclear architecture through nesprin and Sad1-UNC-84homology (SUN) protein complexes (i.e., the linker of nucleoskeleton and cytoskeleton (LINC) complexes) [35,36]. These protein complexes are constituted by SUN proteins that span over the inner nuclear membrane (INM) and bind the perinuclear space (PS) to nesprin isoforms that pass through the outer nuclear membrane (ONM) and link directly with F-actin and IFs and MTs via plectin and kinesin-1, respectively. On the nucleoskeleton side, SUN proteins connect to the nuclear lamina and interact with chromatin (Figure 2).
Therefore, the interconnection between the cellular adhesion region and the nuclear domain allows environment mechanical cues to be detected by FAs at the contact interface and to be transmitted to the cell nucleus through the load-carrying cytoskeletal components in the form of stress waves traveling along cytoskeleton structures at a speed approximately 15 times faster than chemical diffusion and 28 times faster than motor-driven transport [20,22]. This architecture ensures that mechanical information can be swiftly transferred to multiple locations within the cell, resulting in a cascade of biochemical signals. Force transmission towards the nuclear region leads to altered cellular behavior and functions in response to environment cues by determining the rearrangement of chromatin, the opening of nuclear pores, and inducing genetic and transcription programs [35]. In order to prevent the dissipation of mechanical energy caused by the transmission across totally soft cytoskeletal material, the information contained in mechanical stimuli must be carried to the nucleus along cytoskeletal preferential transferring channels (i.e., actin bundles). These channels are characterized by a prestressed state that results in stiffened filaments compared to the surrounding cytoskeleton domain. Therefore, stiffness variations in the cell structure effectively canalize mechanical signals to the nucleus along stiffer paths that prevent quick stress wave energy dissipation. Moreover, the tensional state characterizing cytoskeleton architecture allows the cell to auto-support its constantly evolving structure, in which bundles of cytoskeletal filaments polymerize and depolymerize continually, thus adapting cell conformation to the external environment [36]. Simulation of cell adhesion phenomena requires careful consideration of all these issues related to cell structure and behavior.
The cell adhesion process is the main interest of the many researchers who try to design and optimize the surface of biodevices, such as scaffolds for bone tissue engineering. The analysis of the current state of the art indicates that extensive research was conducted to determine the optimal scaffold architecture [37,38,39,40,41,42,43,44,45,46,47,48,49,50,51,52]; however, rather few studies focused on the identification of the optimal surface micro-geometry favoring the most extended adhesion of mesenchymal stem cells (MSCs) to the scaffold walls and their subsequent differentiation in the osteoblastic sense [53].

1.2. Finite Element Modeling (FEM)

Computational models became increasingly valuable in supplementing experimental observations to better understand the mechanisms underlying collective cell migration. Cell models were developed in order to investigate mechanical interactions between cells and the ECM. Among computational approaches, finite element modeling (FEM) [54,55,56,57,58] represents a very effective tool for mimicking cell behavior in adhesion. FEM provides researchers with useful techniques, instruments, and modeling options that allow them to address crucial issues, such as stiffness differentiation within cellular components, prestressed auto-supporting architecture, and rearranging the cytoskeletal load-bearing structure [59]. FEM-based approaches including lattice spring modeling were adopted to simulate cells adhering to a substrate and subjected to nanoindentation measurements [60]. High-fidelity computational models can be developed by embedding in the FEM framework strategies that (i) divide cells into regions with assigned specific constitutive behaviors, (ii) subdivide numerical analysis into consecutive steps where material properties and loading conditions are updated as analysis proceeds, thus accounting for intrinsic changes in adhering cell behavior, and (iii) adopt predefined fields by assigning pre-existing tensional and deformation states to cell domain.
The strong multidisciplinary character of FEM is the pivotal aspect characterizing the development of these techniques over the years. The broad range of applications has led finite element software to be equipped with numerous algorithms and simulation techniques suited for the various fields (i.e., structural, thermal, fluid dynamic, electromagnetic, chemical, and diffusive aspects). This peculiarity is very useful in the investigation of complex systems, like cells, as it provides analysts with several routines derived from many scientific fields for simulating cellular behavior. Indeed, the study of cellular adhesion phenomena encompasses several aspects ranging from materials science and mechanics to fluid mechanics, passing through signal transmission via cellular pathways. General-purpose finite element codes (i.e., ABAQUS, ANSYS, ADINA, COMSOL) include user-friendly interfaces to integrate modules with analysis procedures and routines for modeling the cell and its environment. This multidisciplinary approach to modeling may result in a fruitful interaction among research profiles with different backgrounds. In this sense, researchers with expertise in physics and engineering may share information with biochemists, biotechnologists, and physicians to obtain a comprehensive perspective of the cell–substrate system. Therefore, the integrated approach offered by finite element software may result in an enhanced predictive ability of the cell model. Moreover, FE numerical solutions allow us to overcome difficulties in defining a closed-form analytical formulation that takes into account the complex multi-physical character of cellular behavior. The finite element method is also able to handle geometrical and material nonlinearity, which inherently characterize cell–substrate interaction, by resorting to the implicit and explicit formulation to limit convergence problems due to the nonlinear behavior of the analyzed system. Furthermore, large deformation FE analysis allows researchers to investigate cell behavior at a larger time scale than that commonly analyzed with linear elastic theory, thus providing a more complete perspective on the cell–environment interaction mechanisms. Another advantage of FEM is the possibility of implementing user-defined routines either written in some programming language (i.e., Python and Fortran) or coded in commercial software, such as MATLAB. This allows us to customize the modeling strategy by integrating innovative algorithms able to face complex cellular physics. Moreover, the suites proposed by software providers (i.e., Autodesk, Dassault Systèmes, Siemens, Altair, Hexagon) allow to integrate FE solver potentialities with the geometrical modeling advanced capacity of 3D CAD software (i.e., Inventor, CATIA, SolidWorks). High-quality CAD software can enhance the fidelity level of numerical analysis by offering the possibility of replicating the complex geometries of the environment surrounding the cell, which presents a 3D architecture characterized by curved surfaces, porous features, and lattice structures.
This review article presents an overview of useful guidelines for implementing accurate finite element simulation of cellular adhesion phenomena. By adopting appropriate modeling approaches, it is possible to reproduce findings obtained through experiments [61,62,63,64,65] and develop numerical frameworks capable of predicting cell behavior evolution, thus providing an in-depth insight into cell adhesion mechanisms.

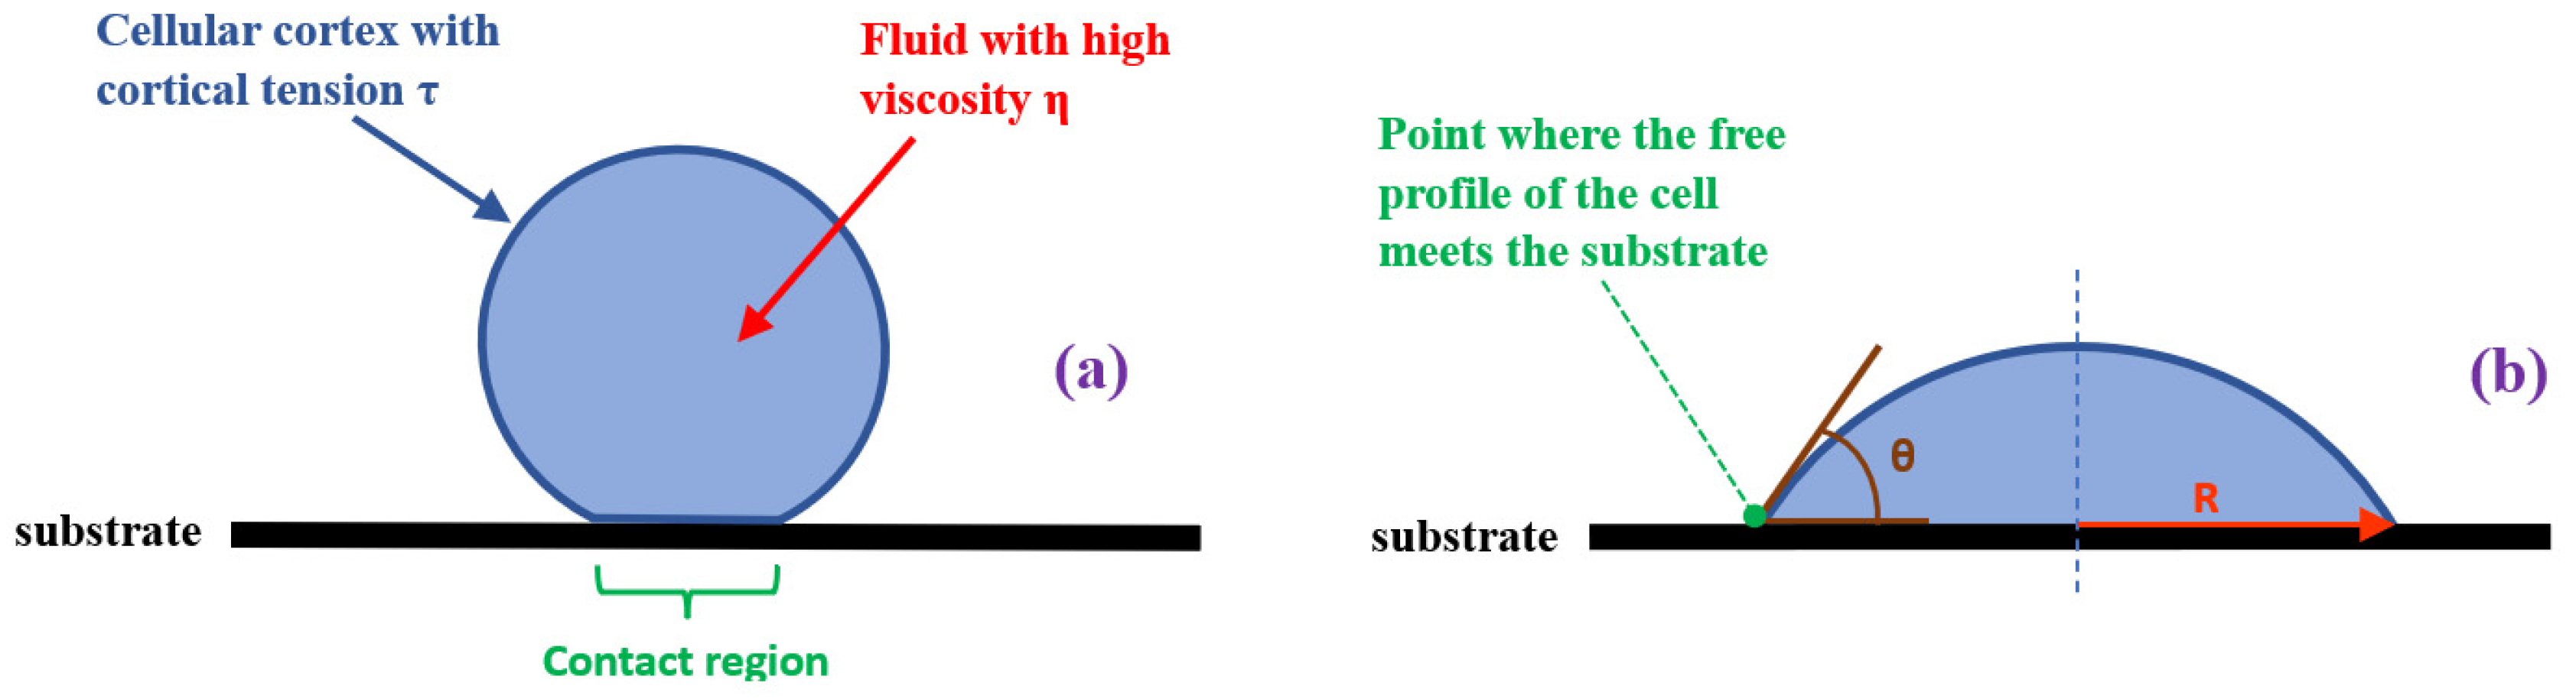
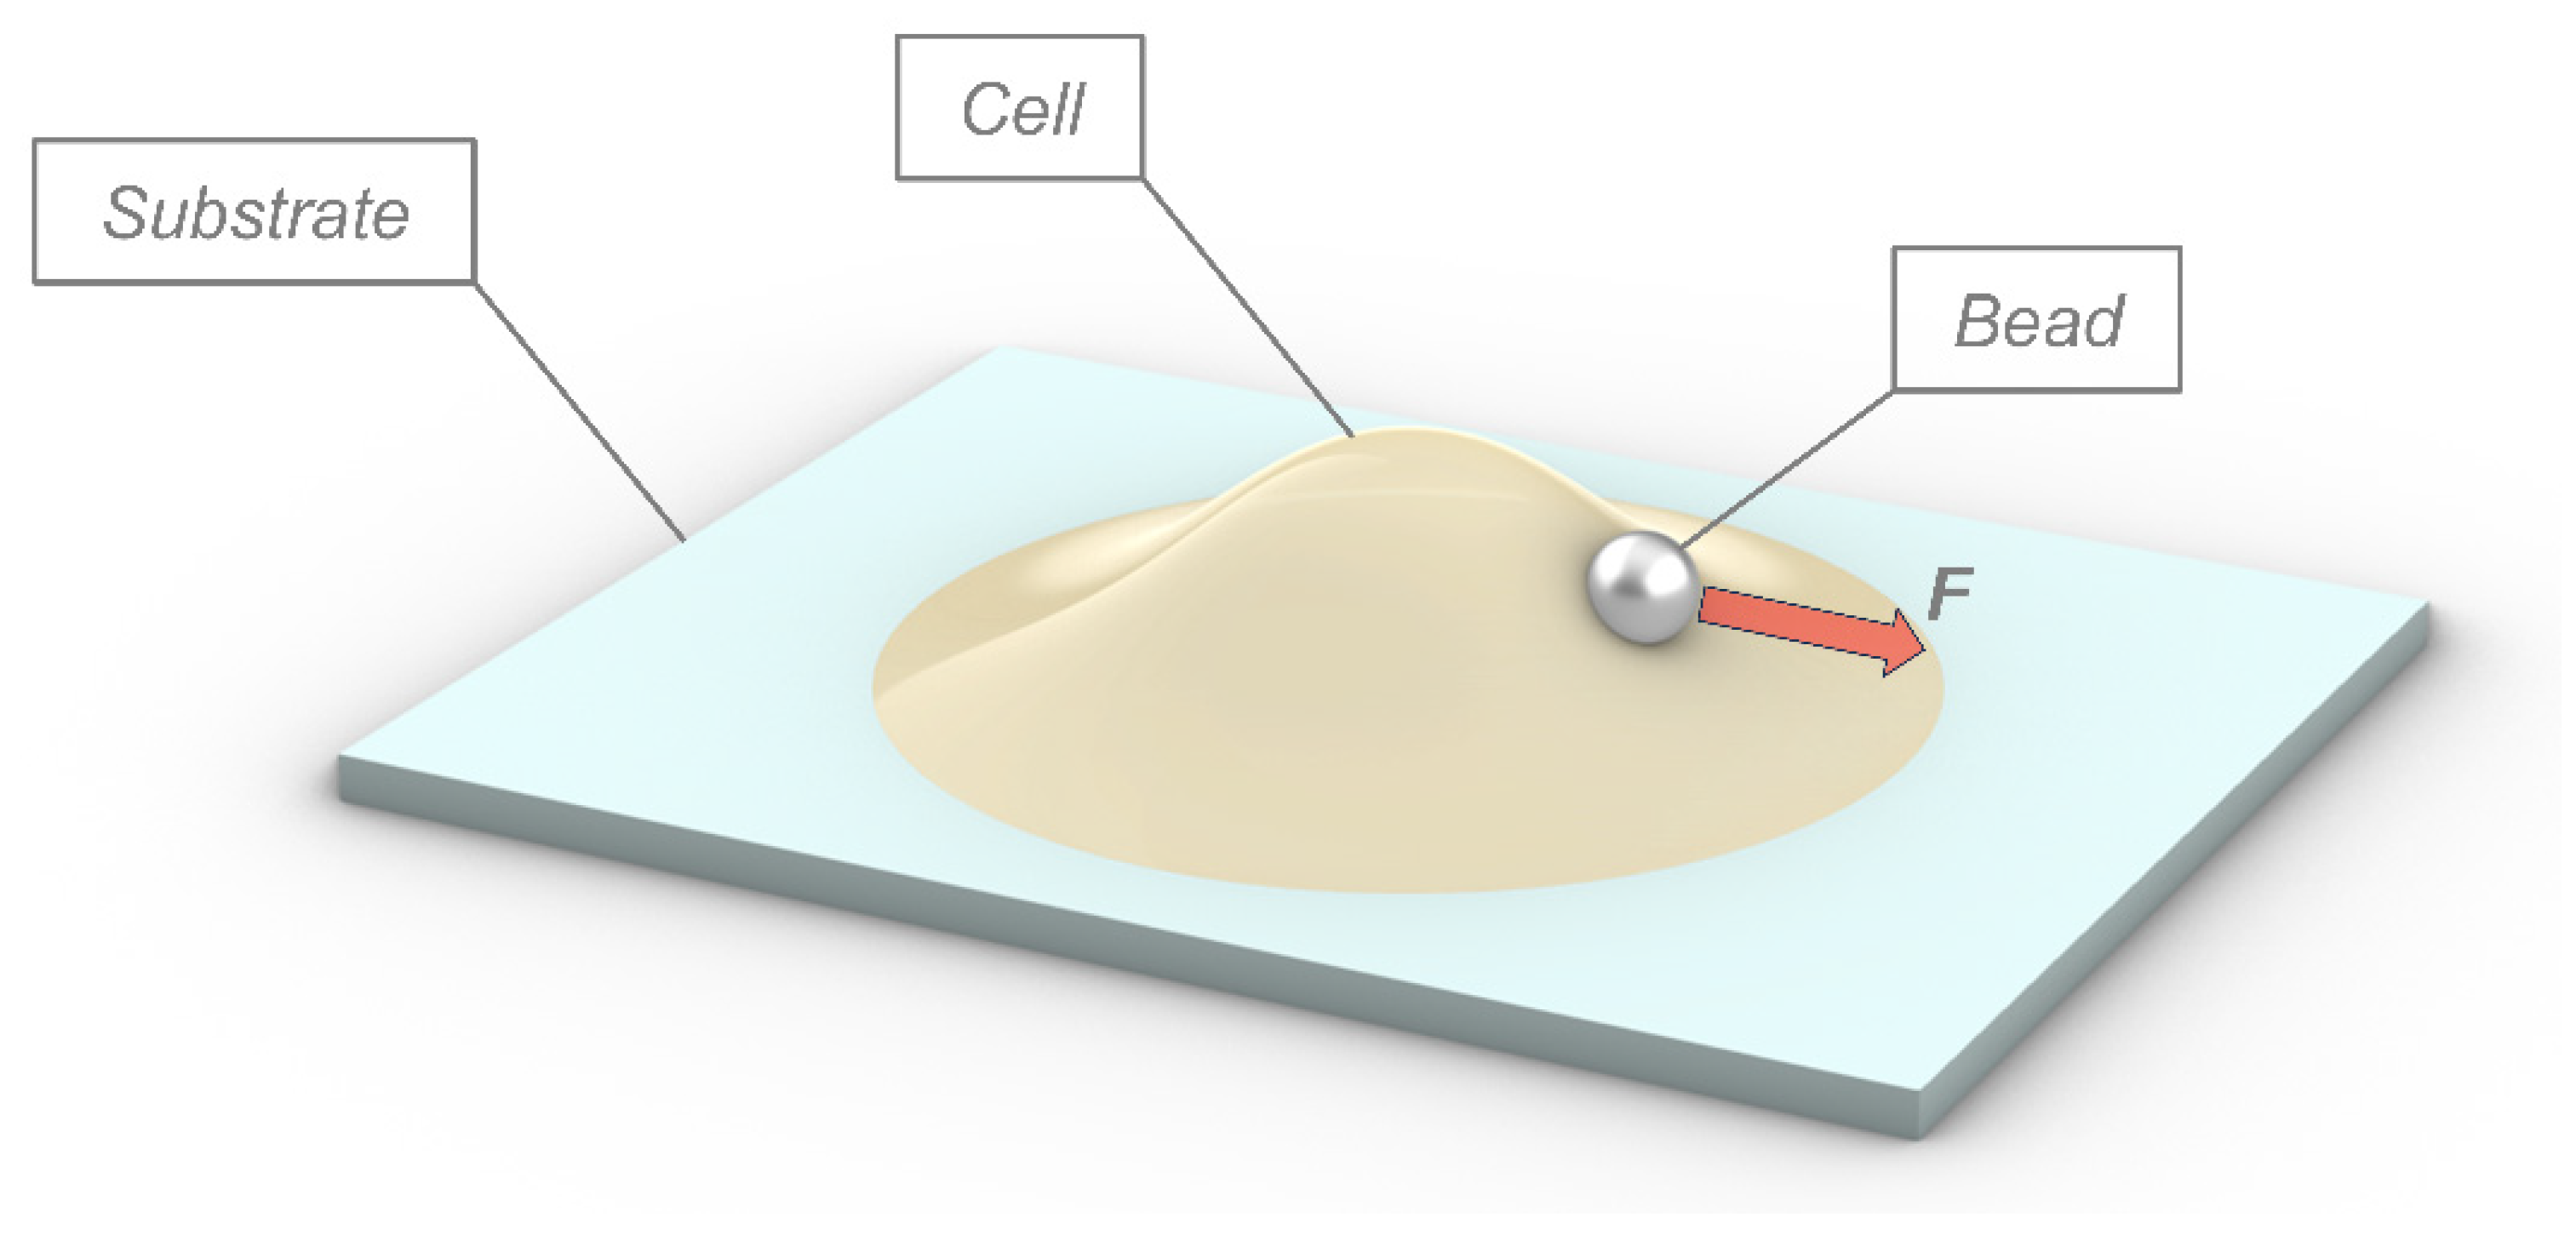
2. Physical Modeling of Cells in Adhesion Phenomena

The development of physical models schematizing cellular architecture and cell interaction with the surrounding environment underlies the realization of computational frameworks able to simulate cellular behavior by reproducing experimental findings. The definition of the most suitable physical model to analyze the adhesion phenomenon between cell and substrate is strongly influenced by the nature of the cell and by the type and conditions of the interacting environment. Based on these distinguishing phenomenological factors, and by adopting simplifications, it is possible to select the appropriate cellular physical model that will be used to build up the computational framework in the chosen simulation software platform. The numerical framework originating from the physical model relies on the definition of environment and cell morphology, constitutive equations with related material properties, and boundary conditions, as stated by the physical model. In order to maximize the reliability of numerical models in predicting the cell’s response, frameworks should be enriched by reducing the level of simplification and by adding characteristic phenomenological aspects.
In the study of cellular adhesion mechanisms, physical models of cell structure generally rely on the principles of continuum mechanics and fluid mechanics. The physical models address cell structure as a multi-region domain constituted of an inner portion surrounded by an elastic membrane or an actin-enriched envelope (elastic cortex) [66,67,68]. The inner part of the cell consists of the nuclear region, cytoskeletal region, and cytoplasm.
Differences in the nature of cells imply variations in functional and structural aspects of cellular regions. Therefore, depending on cell typology and functionality, a specific constitutive behavior can be associated with each cellular domain region. Viscous fluid mechanics can be suitable for modeling the cytoskeleton conformation of cells (e.g., white and red blood cells) lacking a defined supporting cytoskeletal architecture and whose mechanical behavior is mainly influenced by an elastic cortex enveloping the internal fluid region. Conversely, for endothelial and epithelial cells that have a well-developed cytoskeletal architecture playing a relevant role in cell mechanical response, it is more appropriate to model cell inner regions as continuum domains following elastic and viscoelastic constitutive laws [69]. Furthermore, schematizing load-carrying cytoskeletal components through an architecture consisting of prestressed cables and struts, to which continuum mechanics constitutive properties can be assigned, results in a better physical model than assuming the cytoskeleton as a whole continuum region. However, the increasing complexity of the cell’s physical model makes it more difficult to characterize material parameters. Therefore, a satisfactory balance between model accuracy and complexity must be achieved by adopting an appropriate level of simplification.
In the study by Thoumine et al. [70] on the behavior of chick fibroblasts spreading on glass microplates, a cellular physical model commonly used for leukocytes was extended to fibroblasts on the basis of a similarity in the adhesion mechanism of the two cell types. The authors highlighted that fibroblasts, just like leukocytes, may unfold packed sectors of the cellular membrane to increase cell surface area during spreading. In particular, experimental evidence in [70] showed that the surface area of spreading fibroblasts may increase up to almost 50%. The proposed fibroblast physical model schematizes the cell as a highly viscous fluid region encased in a cortical envelope behaving like an isotropic elastic membrane that undergoes a biaxial tension τ. Assuming that deformed cell configurations resemble truncated spheres that preserve the cell’s initial volume, it was supposed that, beyond a certain equilibrium value τo (evaluated through an aspiration test resulting in the formation of a cell hemispherical cap into a micropipette), the tension τ carried by the elastic cortex linearly increases with the surface area as follows:
τ = τ 0 + K α ,
where τ is the tension sustained by the cortex, K is the area expansion elastic modulus accounting for cell surface elasticity, and α is the relative difference in cell area between the initial and final configuration. The entire cellular region confined by the cortical domain, without distinction between nuclear and cytoskeletal portions, was treated as a highly viscous fluid. By fitting the theoretical physical model with experimental data, the authors were capable of reproducing adherent fibroblast behavior during tests quite well and evaluating the area expansion elastic modulus K and the apparent viscosity η.
Based on [70], to analyze the mechanical behavior of chick fibroblasts spreading onto glass substrates, Frisch et al. [71] developed a physical model describing the evolution of fibroblast contact radius at the interface between cell and glass substrates coated with glutaraldehyde. In fact, experimental behavior exhibited by fibroblasts is characterized by a regular deformation mechanism where the adhering cell’s conformation evolves during the interaction with the substrate through successive morphologies resembling truncated spheres. A similar smooth mechanical behavior is presented by liquid drops wetting an underlying surface [70,72]. Therefore, supposing that fibroblast behavior in early phases—i.e., until the depletion of folded membrane reserves—resembles that of a liquid drop, the wetting theory formulation could be adopted for studying the fibroblast spreading mechanism and finding cell contact radius time progress. In accordance with the model by Thoumine et al. [70], cell physical schematization consists of an inner region (behaving as a high-viscosity fluid) surrounded by an envelope representing the cellular cortex, which carries the cortical tension τ. The simplification adopted by Frisch et al. [71] consists of (i) neglecting variation in apparent viscosity during cell adhesion and (ii) assuming for apparent viscosity η a constant value equal to the mean of the variability range of η experimentally estimated [70,72]. In addition to the definition of η and τ as constant parameters, the developed formulation introduces another parameter (the adhesion energy per unit area wad), which is representative of the cell’s underlying surface interaction and contributes to determining the overall cell morphology resulting from the equilibrium between τ and wad. Adhesion energy is affected by local phenomena (i.e., nascent adhesion growth and mature adhesion complexes clustering) that occur at the cell–substrate interface and can increase adhesion energy in cell spreading. However, the interaction between cell and substrate was hypothesized in Ref. [71] to follow a uniform adhesion mechanism; hence, the value of adhesion energy wad can be assumed as constant during spreading. The apparent viscosity constant (i.e., taking the properties of the cytoskeleton uniform) is consistent with neglecting local effects represented by the growth and movement of focal complexes as these effects, in turn, lead to inhomogeneity in the cytoskeletal structure by inducing the aggregation of actin filaments into bundles at mature adhesion sites. Based on experimental evidence [70,72], Frisch et al. [71] hypothesized that when fibroblast spreads on the substrate, it deforms (i) while maintaining its initial volume unchanged and (ii) assuming at the macroscopic level the conformation of truncated spheres. Under these hypotheses, the cell’s spreading on the substrate leads to an increasing contact area, which can be approximately considered a circular area. Hence, the physical model developed in [71] describes at the macroscopic level the overall change in cellular morphology during adhesion by reproducing the increase in contact area experimentally observed for fibroblast spreading on glass substrates [70,72]. Localized changes in the cell profile involving curvature variations were neglected, and two geometrical parameters were used to define at the macroscopic level the cell morphologies resembling spherical caps: the contact radius R and the contact angle θ (Figure 3). The contact radius R is defined by the diameter of the contact area identified by the planar interaction region between the cell and the underlying substrate. The contact angle θ is identified by the plane tangent to the substrate’s top surface and the plane tangent to the cell’s outer profile passing through a point that in the wetting theory is called a three-phase contact point (i.e., the point where the cell’s free profile of meets substrate). In [72], contact radius R was estimated using the cell top view, from which the adhesion region can be evaluated by the projection of the cell surface area onto the substrate. Finally, the contact radius of the adhesion area was found as the root square of the projected cell area Ap divided by π (i.e., R = √(Ap/π)). The model developed by Frisch et al. [71] allows time progress curves of the contact radius to be plotted as the ratio between the parameters wad and τ changes. By fitting the physical model to experimental data, the theoretical curve that best reproduces contact radius experimental values measured during spreading was obtained, thus estimating adhesion energy wad and cortical tension τ entailed by cell–substrate adhesion mechanism.
Modeling approaches based on continuum mechanics can be successfully used to analyze the mechanical response of cells characterized by the presence of a structured cytoskeletal architecture. Epithelial cells belong to this category and exhibit an elasticity-dominated mechanical response. In order to develop a simplified FE framework to mimic the adhesion behavior of airway epithelial cells, Kamm et al. [69] implemented a plane strain 2D homogeneous continuum linear elastic model simulating the cell’s response to an external stimulus generated by magnetic tweezer micromanipulation and the corresponding induced stress–strain field. In the proposed FE framework, the external mechanical stimulus is represented by a force of 100 pN/μm acting in the Y direction (i.e., the parallel direction to the substrate on which the cell adheres) applied to the center of a rigid bead with a 0.4 μm diameter initially attached to the apical cellular region. Under the action of the external force, the bead is subjected to translation and rotation movements towards the right, while staying adherent to the cell surface. This generates a stress–strain field in the cell. The highest effective stress computed by the numerical framework (i.e., about 5 Pa) is localized at the left end of the contact interface between the bead and cell surface. Strains in the Y direction vary from 5% to 1% passing from the left to the right end of the contact region. Since increasing membrane stiffness too much would have led to an overestimated cell’s resistance to deformation, thus reducing the accuracy of simulations, the authors of Ref. [69] investigated how reduced values of membrane rigidity effect the stress–strain field in the cell.
Kamgoué et al. [73] successfully used FEM to analyze the dispersion in cell stiffness experimental values gathered from tweezing micromanipulation tests (i.e., optical and magnetic tweezers experiments). The dispersion of experimental data also occurred in tests relative to a given type of adherent cell (i.e., epithelial or endothelial cells) performed with the same probing technique. Both tweezer micromanipulation techniques induce the cell’s material response by applying an external force to the center of a solid spherical bead, which is partially embedded in the outer layers of the cellular material (Figure 4). The force acting in the direction parallel to the cell surface causes the bead translational movement until, at the equilibrium, the cell’s material counterbalances the effect of the external stimulus by resisting deformation. In general, optical tweezer micromanipulation employs silica beads with a radius ranging between 1 and 2.7 μm, whereas magnetic tweezer tests utilize ferromagnetic beads with a radius between 0.6 and 2.2 μm [74,75,76,77]. In both testing techniques, beads are coated with an RGD (Arg-Gly-Asp) peptide, enabling a connection between bead and integrin proteins, which spans the cellular membrane and ensures the interaction between beads and cytoskeletal load-carrying architecture.
At the equilibrium point of the cell–bead system, it can be assumed that in the tweezing micromanipulation, the bead is totally contained in the cell. Furthermore, the cell behaves as an infinite elastic domain of incompressible material characterized by a linear elastic constitutive relationship. In view of this, analytical formulas were developed in [78,79,80] to relate the external force F to the cell’s material stiffness E and the resulting bead displacement U or, equivalently, the corresponding associated bead rotation θ as follows:
F = 1 2 E S δ ,
F = 1 2 E S θ ,
where S is the surface area of the bead (i.e., S = 4πR2 with R bead radius) and δ is the normalized bead translation (i.e., δ = U/R). By substituting the experimental values of force and displacement in these analytical expressions, it is possible to roughly estimate the stiffness E exhibited by the cell’s material. However, this approach yields high dispersion and discrepancy in cell rigidity values when testing operations are conducted on the same cell type [79,80]. The explanation for the inhomogeneity in cell rigidity resulting from the analytical approach was identified by Kamgoué et al. [73] in the spurious nature of Young’s modulus E included in Equation (2a,b), which does not represent the actual cell Young’s modulus Ecell, rather an apparent modulus Eapp affected by geometric factors related to the experimental technique and the cell type. The bead radius R, the bead embedding half angle γ, and the cell height h were recognized in [73] as the driving geometric parameters of the deviation of the apparent Young’s modulus Eapp obtained by experimental measurements from the intrinsic cell Young’s modulus Ecell (see Figure 5).
In order to provide a valid mathematical formulation for overcoming this issue, Kamgoué et al. [73] introduced the correction functions α and β dependent on R, γ, and h. These functions establish a relationship between Ecell and Eapp and make it possible to obtain the actual cell stiffness once the bead force and the induced translation or, equivalently, the associated rotations are known as follows:
E a p p δ = α R , γ , h E c e l l ,
E a p p θ = β R , γ , h E c e l l ,
where  E a p p δ  and  E a p p θ  are the apparent cell rigidity returned by Equation (2a,b), respectively. Since the cell’s height h can be expressed as h = hu + R(1 − cosγ) using R, h, and the under-bead cell thickness hu, some authors pointed out that the mathematical formulations of functions α and β actually depend on the adimensional factor hu/2R and γ [73]. In order to quantitatively evaluate the correcting functions, an FEM framework studied the effect of geometrical factors hu, R, and γ on the cellular response induced by an external force during tweezer micromanipulation. The finite element framework considered 300 testing scenarios corresponding to different combinations of the factor’s triplet (h, R, γ), thus simulating the corresponding bead motion that can extract the force-bead displacement values useful to determine the scalar value assumed by correcting functions in every testing condition. In the parametric FE framework proposed by Kamgoué et al. [73], tweezer micromanipulation experiments were modeled by considering a deformable cell representative volume element (RVE), which interacts with a rigid spherical bead partially embedded in the cellular material (see Figure 5b). The cell RVE has a rectangular parallelepiped shape characterized by a cell length l equal to 10R, a height h, and a width w equal to l/2. By exploiting the symmetry plane perpendicular to the cell top surface passing through the bead’s center, it was possible to reduce the width of the modeled cell portion from l to l/2, thus saving computational cost. Force values used in numerical simulations by Kamgoué et al. [73] are consistent with those gathered from experimental works [74,81] and correspond to an average value of 50 pN.
Responses of epithelial and endothelial cells to micromanipulation testing were simulated by adopting a continuum mechanics modeling approach, which schematizes the cellular region as a continuum quasi-incompressible homogeneous domain whose material behavior is described by the neo-Hookean hyperelastic strain energy function W as follows:
W = a I 1 3 ,
The above mathematical formulation depends on the hyperelastic constant a and the trace I1 (i.e., the linear invariant) of the right Cauchy–Green strain tensor. According to the neo-Hookean constitutive behavior, the material intrinsic stiffness Ecell can be related to the hyperelastic constant a via the stretch ratio λ relative to the uniaxial test (i.e., λ = L/Lo, with L extended length and Lo initial length) as follows:
E c e l l = 2 a 2 + λ 3 ,
Assuming λ values close to 1, which corresponds to having a small extension of the cell’s material during the uniaxial test, Equation (5) yields Ecell ≅ 6a. For small extensions, once the external force and the actual cellular stiffness defined by the neo-Hookean law (i.e., 500 Pa [82]) were given in input to the model, the FEM framework of [73] was capable of computing bead displacement for all the geometric parameter combinations. Knowing the simulated bead motion derived from each hypothesized testing condition and the applied force, Equation (2) was used to determine the apparent cell stiffness, which represents the corresponding material rigidity analytically calculated during experimental tests. Then, Equation (3) can be rearranged in order to return the scalar value of correction functions α and β corresponding to each combination (hu/2R,γ). Having at their disposal a set of values consisting of the quantitative estimate of α(hu/2R,γ) and β(hu/2R,γ), Kamgoué et al. identified the most appropriate mathematical formulation of the correction functions α and β able to match the calculated values [73,79].
The FE framework proposed by Ohayon et al. [80] successfully described the adhesion response of epithelial cells to the external stimulus induced by magnetic twisting cytometry (MTC). Cells probed by MTC are subjected to large deformation with respect to tweezer micromanipulation, as the MTC probing technique induces a higher rotation of the ferromagnetic bead. The cellular structure was schematized by Ohayon et al. by adopting a continuum mechanics-derived homogeneous representation characterized by the neo-Hookean hyperelastic constitutive behavior. The proposed FE model allowed to quantify the intrinsic Young’s modulus of the cell by providing values of correction functions for the apparent cell stiffness, which depend on the dimensionless geometric factor hu/2R.

3. Discussion

Finite element modeling (FEM) is a powerful approach to the study of cellular adhesion phenomena due to its capability to accurately replicate shape, material properties, and environmental constraints specific to the type of cell under investigation. In order to expedite computational processes, various levels of simplification can be introduced in modeling. Symmetry features can be included in the finite element models to reduce computational cost [57,61], such as, for example, axisymmetry or modeling only a quarter of the cell [66,83]. Cell domain partitioning can be applied to allocate constitutive properties to the principal cellular elements, such as the nucleus, cytoplasm, cytoskeleton, and membrane. The continuum mechanics approach, using an isotropic linear elastic model, can effectively represent the behavior of cells with organized internal structures, such as epithelial cells [69]. The assumption of linear elastic behavior made by Kamm et al. [69] for modeling the cell’s response to tweezing micromanipulation (thus avoiding the characterization of nonlinear material parameters) was confirmed by the study of Kamgoué et al. [73]. The cell’s response to the external stimulus induced by tweezer micromanipulation is independent of geometric nonlinearity. In fact, numerical curves reporting the bead displacement with respect to bead force preserve their linear shape, regardless of having considered a linear elastic constitutive behavior or a neo-Hookean hyperelastic behavior in the finite element analyses.
The FE framework by Kamgoué et al. [73], based on the nonlinear neo-Hookean hyperelastic behavior, returned values of an effective strain induced in the cell’s material at the bead–cell contact region, which are comparable with those obtained by Kamm et al.’s [69] modeling approach (i.e., effective strain maximum values of about 2.6% localized at the left end of the contact arc vs. strain values ranging from 5% to 1% along the contact region). As stated by some authors, the models proposed by Kamgouè et al. [73] and Kamm et al. [69] do not account for the rearrangement of cytoskeletal architecture during the testing operations, as the probing force acting on the cell is applied for a limited time period, which does not allow significant modifications in filaments’ spatial arrangement. Moreover, the cell’s RVE studied by Kamgoué et al. [73] is a homogenous single-layer domain neglecting the nucleus presence in the cellular region and its effect on cell response. This modeling approach was justified by the authors in view of the presence of other studies dealing with micromanipulation techniques [84,85], which showed that models embedding the nuclear domain return a cell response to the external stimulus very close to that obtained through simplified models neglecting the nucleus. An explanation of this behavior lies in the nature of the mechanical deformation induced in the cell by the tweezer micromanipulation, which affects the outer layers of the cell’s material, thus limiting the nuclear domain contribution to the cell material activity in resisting external loads. This aspect was confirmed by the study by Mijailovich et al. [79], who pointed out how the intensity of stress–strain fields generated by magnetic twisting micromanipulation in an isotropic homogeneous cellular material decreases with the cube of the distance in the radial direction proceeding from the cell–bead interface towards the cell’s interior region. Therefore, cellular features and components approximately located at a distance greater than the bead diameter have a small effect on cell response. Similar considerations have been performed by Boccaccio et al. [66,67] and Vaiani et al. [60], who assumed approximate mechanical properties for the cell nucleus, as it is rather far with respect to the point where the nanoindenter touches the cell surface. Interestingly, Kamgoué et al. [73] pointed out that Equation (3a,b) can also be extended to the case of cells probed at different load frequency values f by replacing the scalar moduli, Ecell and Eapp, with the complex moduli, cell(f) and app(f), and maintaining the unchanged α and β formulations that depend exclusively on geometrical parameters hu, R, and γ.
By employing FE analysis, Kamgoué et al. [73] simulated several testing conditions occurring in optical and magnetic tweezer experiments. They defined correction functions that allow the establishment of a relationship between the intrinsic cell Young’s modulus and the measured apparent cellular stiffness. Other authors have pointed out that adopting a simplified description of the cell’s response to micromanipulation may introduce artifacts with respect to the actual cell–bead interaction mechanisms, thus leading to an inaccurate simulation of cell behavior. In this particular FE framework, beads directly interact with the membrane, which mainly sustains the applied load by redistributing tension across it [69]. This results in a limited transfer of stress from the bead–membrane contact interface towards the neighboring cytoskeletal region. Therefore, in the FE framework, a cell’s capability to resist deformation is driven by the membrane’s mechanical properties and is less affected by the cytoskeleton, which has to carry a lower load fraction with respect to the membrane. The leading role of the cellular membrane in the overall cell’s mechanical response was highlighted by showing that reducing membrane stiffness by 50% leads to an increase by one order of magnitude in both the cell’s maximum effective stress and strain in the Y direction. Conversely, the actual physical interaction mechanism involves bead binding to specific receptor (integrin) sites, which span the cell membrane and link to the cytoskeletal load-bearing structure. The presence of these preferential connecting loci between beads and intracellular supporting architecture allows us to exert the external load almost completely on the cytoskeletal network, unlike what was assumed in the FE framework developed by Kamm et al. [69] where the mechanical resistance exhibited by the cell is strongly determined by membranes. Therefore, the higher stiffness exhibited by the cell surface in response to a simulated mechanical load acting in correspondence with receptor sites results from the linking of receptor sites with the underlying intracellular load-bearing architecture, which opposes external stimulus [86]. When the simulated mechanical load is exerted on a receptor site neighborhood at a certain distance from the receptor site, a drop in cell surface stiffness can be observed due to the absence of these preferential gateways (i.e., receptor sites) through which an external mechanical stimulus can be canalized towards cytoskeleton load-bearing architecture, which mainly concurs to determine the cell resistance to deformation. The same approximation in the bead–cell surface interaction mechanism can also be found in more complex 3D finite element frameworks developed for studying cell stiffness in response to micromanipulation techniques involving probing beads in contact with the cell surface [73]. The main reason for simplifying cell–bead interaction, by distributing the stress generated by bead–cell membrane surface contact across the outer layers of cellular material, is to circumvent the complex FE modeling of the bead–integrin–cytoskeletal filaments interlinking chain.
As a summary for the reader, Table 1 lists the most representative studies surveyed in this review. The studies are categorized according to the types of cells analyzed.

4. Conclusions and Future Perspectives

This article presented an overview of the most relevant studies documented in the literature that have used finite element modeling to study the process of cell adhesion. The study of the interactions between the different cellular components, as well as the analysis of interactions between the cell and the extracellular environment, give useful information on how mechanical, biological, and chemical stimuli influence the cellular response and fate. Numerous studies using the FEM technique have focused mainly on mechanical and biophysical aspects; very few studies, however, attempted to address and describe biochemical and biological mechanisms with FEM. Future efforts of researchers should be directed towards such problems. Another interesting aspect that could be investigated in the future is the integration of FEM with Artificial Intelligence methods. Such an integrated approach could significantly enhance the predictive power of the FEM technique.

Author Contributions

Conceptualization, L.S., A.B. (Antonio Boccaccio) and L.L.; methodology, L.S.; software, L.S. and L.V.; formal analysis, L.S., S.C. and L.L.M.; investigation, L.S.; resources, L.L.M., A.B. (Andrea Ballini) and S.C.; data curation, L.S., L.V. and A.B. (Antonio Boccaccio); writing—original draft preparation, L.S.; writing—review and editing, L.S., A.B. (Antonio Boccaccio), L.L. and A.B. (Andrea Ballini); visualization, L.S. and L.V.; supervision, A.B. (Antonio Boccaccio) and L.L.; project administration, A.B. (Antonio Boccaccio) and L.L.; funding acquisition, A.B. (Antonio Boccaccio). All authors have read and agreed to the published version of the manuscript.

Funding

This research was funded by PNRR MUR, the “National Centre for HPC, Big Data and Quantum Computing PNRR MUR–M4C2-I 1.4”—codes CN00000013 and CUP D93C22000430001.

Conflicts of Interest

The authors declare no conflicts of interest.

References

  1. Guilak, F.; Cohen, D.M.; Estes, B.T.; Gimble, J.M.; Liedtke, W.; Chen, C.S. Control of Stem Cell Fate by Physical Interactions with the Extracellular Matrix. Cell Stem Cell 2009, 5, 17–26. [Google Scholar] [CrossRef]
  2. Engler, A.J.; Sen, S.; Sweeney, H.L.; Discher, D.E. Matrix Elasticity Directs Stem Cell Lineage Specification. Cell 2006, 126, 677–689. [Google Scholar] [CrossRef] [PubMed]
  3. Hoffmann, M.; Schwarz, U.S. A Kinetic Model for RNA-Interference of Focal Adhesions. BMC Syst. Biol. 2013, 7, 2. [Google Scholar] [CrossRef]
  4. Milan, J.-L.; Lavenus, S.; Pilet, P.; Louarn, G.; Wendling, S.; Heymann, D.; Layrolle, P.; Chabrand, P. Computational Model Combined with in Vitro Experiments to Analyse Mechanotransduction during Mesenchymal Stem Cell Adhesion. Eur. Cells Mater. 2012, 25, 97–113. [Google Scholar] [CrossRef]
  5. Paglia, E.B.; Baldin, E.K.K.; Freitas, G.P.; Santiago, T.S.A.; Neto, J.B.M.R.; Silva, J.V.L.; Carvalho, H.F.; Beppu, M.M. Circulating Tumor Cells Adhesion: Application in Biosensors. Biosensors 2023, 13, 882. [Google Scholar] [CrossRef]
  6. van Stalborch, A.-M.D.; Clark, A.G.; Sonnenberg, A.; Margadant, C. Imaging and Quantitative Analysis of Integrin-Dependent Cell-Matrix Adhesions. STAR Protoc. 2023, 4, 102473. [Google Scholar] [CrossRef]
  7. Montes, A.R.; Gutierrez, G.; BuganzaTepole, A.; Mofrad, M.R.K. Multiscale Computational Framework to Investigate Integrin Mechanosensing and Cell Adhesion. J. Appl. Phys. 2023, 134, 114702. [Google Scholar] [CrossRef]
  8. Giverso, C.; Jankowiak, G.; Preziosi, L.; Schmeiser, C. The Influence of Nucleus Mechanics in Modelling Adhesion-Independent Cell Migration in Structured and Confined Environments. Bull. Math. Biol. 2023, 85, 88. [Google Scholar] [CrossRef] [PubMed]
  9. Rasouli, M.; Soleimani, M.; Hosseinzadeh, S.; Ranjbari, J. Bacterial Cellulose as Potential Dressing and Scaffold Material: Toward Improving the Antibacterial and Cell Adhesion Properties. J. Polym. Environ. 2023, 31, 4621–4640. [Google Scholar] [CrossRef]
  10. Huber, M.; Casares-Arias, J.; Fässler, R.; Müller, D.J.; Strohmeyer, N. In Mitosis Integrins Reduce Adhesion to Extracellular Matrix and Strengthen Adhesion to Adjacent Cells. Nat. Commun. 2023, 14, 2143. [Google Scholar] [CrossRef]
  11. Nellinger, S.; Kluger, P.J. How Mechanical and Physicochemical Material Characteristics Influence Adipose-Derived Stem Cell Fate. Int. J. Mol. Sci. 2023, 24, 3551. [Google Scholar] [CrossRef]
  12. Koushki, N.; Ghagre, A.; Srivastava, L.K.; Molter, C.; Ehrlicher, A.J. Nuclear Compression Regulates YAP Spatiotemporal Fluctuations in Living Cells. Proc. Natl. Acad. Sci. USA 2023, 120, e2301285120. [Google Scholar] [CrossRef] [PubMed]
  13. Vassaux, M.; Milan, J.L. Stem Cell Mechanical Behaviour Modelling: Substrate’s Curvature Influence during Adhesion. Biomech. Model Mechanobiol. 2017, 16, 1295–1308. [Google Scholar] [CrossRef] [PubMed]
  14. Khalili, A.A.; Ahmad, M.R. A Review of Cell Adhesion Studies for Biomedical and Biological Applications. Int. J. Mol. Sci. 2015, 16, 18149–18184. [Google Scholar] [CrossRef] [PubMed]
  15. Cai, S.; Wu, C.; Yang, W.; Liang, W.; Yu, H.; Liu, L. Recent Advance in Surface Modification for Regulating Cell Adhesion and Behaviors. Nanotechnol. Rev. 2020, 9, 971–989. [Google Scholar] [CrossRef]
  16. Harjunpää, H.; Asens, M.L.; Guenther, C.; Fagerholm, S.C. Cell Adhesion Molecules and Their Roles and Regulation in the Immune and Tumor Microenvironment. Front. Immunol. 2019, 10, 1078. [Google Scholar] [CrossRef] [PubMed]
  17. Shinde, A.; Illath, K.; Gupta, P.; Shinde, P.; Lim, K.T.; Nagai, M.; Santra, T.S. A Review of Single-cell Adhesion Force Kinetics and Applications. Cells 2021, 10, 577. [Google Scholar] [CrossRef]
  18. Lin, X.; Zhang, K.; Wei, D.; Tian, Y.; Gao, Y.; Chen, Z.; Qian, A. The Impact of Spaceflight and Simulated Microgravity on Cell Adhesion. Int. J. Mol. Sci. 2020, 21, 3031. [Google Scholar] [CrossRef]
  19. Ohashi, K.; Fujiwara, S.; Mizuno, K. Roles of the Cytoskeleton, Cell Adhesion and Rho Signalling in Mechanosensing and Mechanotransduction. J. Biochem. 2017, 161, 245–254. [Google Scholar] [CrossRef]
  20. Maurer, M.; Lammerding, J. The Driving Force: Nuclear Mechanotransduction in Cellular Function, Fate, and Disease. Annu. Rev. Biomed. Eng. 2019, 21, 443–468. [Google Scholar] [CrossRef]
  21. Davidson, P.M.; Cadot, B. Actin on and around the Nucleus. Trends Cell Biol. 2021, 31, 211–223. [Google Scholar] [CrossRef]
  22. Wang, N.; Tytell, J.; Ingber, D. Mechanotransduction at a Distance: Mechanically Coupling the Extracellular Matrix with the Nucleus. Nat. Rev. Mol. Cell Biol. 2009, 10, 75–82. [Google Scholar] [CrossRef]
  23. Tan, X.; Yan, Y.; Song, B.; Zhu, S.; Mei, Q.; Wu, K. Focal Adhesion Kinase: From Biological Functions to Therapeutic Strategies. Exp. Hematol. Oncol. 2023, 12, 83. [Google Scholar] [CrossRef] [PubMed]
  24. Ren, X.; Guo, X.; Liang, Z.; Guo, R.; Liang, S.; Liu, H. Hax1 Regulate Focal Adhesion Dynamics through IQGAP1. Cell Commun. Signal. 2023, 21, 182. [Google Scholar] [CrossRef] [PubMed]
  25. Huang, Y.; Liao, J.; Vlashi, R.; Chen, G. Focal Adhesion Kinase (FAK): Its Structure, Characteristics, and Signaling in Skeletal System. Cell. Signal. 2023, 111, 110852. [Google Scholar] [CrossRef]
  26. Fujiwara, T.K.; Tsunoyama, T.A.; Takeuchi, S.; Kalay, Z.; Nagai, Y.; Kalkbrenner, T.; Nemoto, Y.L.; Chen, L.H.; Shibata, A.C.E.; Iwasawa, K.; et al. Ultrafast Single-Molecule Imaging Reveals Focal Adhesion Nano-Architecture and Molecular Dynamics. J. Cell Biol. 2023, 222, e202110162. [Google Scholar] [CrossRef]
  27. Walter, K.; Bourquin, J.; Amiri, A.; Scheer, N.; Dehnert, M.; Eichhorn, A.L.; Dietz, C. Probing Local Lateral Forces of Focal Adhesions and Cell-Cell Junctions of Living Cells by Torsional Force Spectroscopy. Soft Matter. 2023, 19, 4772–4779. [Google Scholar] [CrossRef] [PubMed]
  28. Dumbauld, D.W.; Shin, H.; Gallant, N.D.; Michael, K.E.; Radhakrishna, H.; García, A.J. Contractility Modulates Cell Adhesion Strengthening through Focal Adhesion Kinase and Assembly of Vinculin-Containing Focal Adhesions. J. Cell. Physiol. 2010, 223, 746–756. [Google Scholar] [CrossRef]
  29. Fraley, S.I.; Feng, Y.; Krishnamurthy, R.; Kim, D.-H.; Celedon, A.; Longmore, G.D.; Wirtz, D. A Distinctive Role for Focal Adhesion Proteins in Three-Dimensional Cell Motility. Nat. Cell Biol. 2010, 12, 598–604. [Google Scholar] [CrossRef]
  30. Wozniak, M.A.; Modzelewska, K.; Kwong, L.; Keely, P.J. Focal Adhesion Regulation of Cell Behavior. Biochim. Biophys. Acta Mol. Cell Res. 2004, 1692, 103–119. [Google Scholar] [CrossRef]
  31. Seetharaman, S.; Etienne-Manneville, S. Microtubules at Focal Adhesions—A Double-Edged Sword. J. Cell Sci. 2019, 132, jcs232843. [Google Scholar] [CrossRef]
  32. Bauer, M.S.; Baumann, F.; Daday, C.; Redondo, P.; Durner, E.; Jobst, M.A.; Milles, L.F.; Mercadante, D.; Pippig, D.A.; Gaub, H.E.; et al. Structural and Mechanistic Insights into Mechanoactivation of Focal Adhesion Kinase. Proc. Natl. Acad. Sci. USA 2019, 116, 6766–6774. [Google Scholar] [CrossRef]
  33. Mavrakis, M.; Juanes, M.A. The Compass to Follow: Focal Adhesion Turnover. Curr. Opin. Cell Biol. 2023, 80, 102152. [Google Scholar] [CrossRef]
  34. Chen, S.; He, T.; Zhong, Y.; Chen, M.; Yao, Q.; Chen, D.; Shao, Z.; Xiao, G. Roles of Focal Adhesion Proteins in Skeleton and Diseases. Acta Pharm. Sin. B 2023, 13, 998–1013. [Google Scholar] [CrossRef]
  35. Martino, F.; Perestrelo, A.R.; Vinarský, V.; Pagliari, S.; Forte, G. Cellular Mechanotransduction: From Tension to Function. Front. Physiol. 2018, 9, 824. [Google Scholar] [CrossRef] [PubMed]
  36. Ingber, D.E. Tensegrity I. Cell Structure and Hierarchical Systems Biology. J. Cell Sci. 2003, 116, 1157–1173. [Google Scholar] [CrossRef]
  37. Vaiani, L.; Uva, A.E.; Boccaccio, A. Structural and Topological Design of Conformal Bilayered Scaffolds for Bone Tissue Engineering. Thin-Walled Struct. 2023, 192, 111209. [Google Scholar] [CrossRef]
  38. Rodríguez-Montaño, Ó.L.; Cortés-Rodríguez, C.J.; Naddeo, F.; Uva, A.E.; Fiorentino, M.; Naddeo, A.; Cappetti, N.; Gattullo, M.; Monno, G.; Boccaccio, A. Irregular Load Adapted Scaffold Optimization: A Computational Framework Based on Mechanobiological Criteria. ACS Biomater. Sci. Eng. 2019, 5, 5392–5411. [Google Scholar] [CrossRef] [PubMed]
  39. Perier-Metz, C.; Duda, G.N.; Checa, S. A Mechanobiological Computer Optimization Framework to Design Scaffolds to Enhance Bone Regeneration. Front. Bioeng. Biotechnol. 2022, 10, 980727. [Google Scholar] [CrossRef] [PubMed]
  40. Rodríguez-Montaño, Ó.L.; Cortés-Rodríguez, C.J.; Uva, A.E.; Fiorentino, M.; Gattullo, M.; Monno, G.; Boccaccio, A. Comparison of the Mechanobiological Performance of Bone Tissue Scaffolds Based on Different Unit Cell Geometries. J. Mech. Behav. Biomed. Mater. 2018, 83, 28–45. [Google Scholar] [CrossRef] [PubMed]
  41. Byrne, D.P.; Lacroix, D.; Planell, J.A.; Kelly, D.J.; Prendergast, P.J. Simulation of Tissue Differentiation in a Scaffold as a Function of Porosity, Young’s Modulus and Dissolution Rate: Application of Mechanobiological Models in Tissue Engineering. Biomaterials 2007, 28, 5544–5554. [Google Scholar] [CrossRef] [PubMed]
  42. Pobloth, A.M.; Checa, S.; Razi, H.; Petersen, A.; Weaver, J.C.; Chmidt-Bleek, K.; Windolf, M.; Tatai, A.A.; Roth, C.P.; Schaser, K.D.; et al. Mechanobiologically Optimized 3D Titanium-Mesh Scaffolds Enhance Bone Regeneration in Critical Segmental Defects in Sheep. Sci. Transl. Med. 2018, 10, eaam8828. [Google Scholar] [CrossRef] [PubMed]
  43. Velasco Peña, M.A. Mechanobiological Model of Bone Tissue Regeneration on Scaffolds; Universidad Nacional de Colombia: Bogotá, Colombia, 2016. [Google Scholar]
  44. Sun, W.; Starly, B.; Nam, J.; Darling, A. Bio-CAD Modeling and Its Applications in Computer-Aided Tissue Engineering. CAD Comput. Aided Des. 2005, 37, 1097–1114. [Google Scholar] [CrossRef]
  45. Bahraminasab, M. Challenges on Optimization of 3D-Printed Bone Scaffolds. Biomed. Eng. Online 2020, 19, 69. [Google Scholar] [CrossRef]
  46. Zhang, S.; Vijayavenkataraman, S.; Lu, W.F.; Fuh, J.Y.H. A Review on the Use of Computational Methods to Characterize, Design, and Optimize Tissue Engineering Scaffolds, with a Potential in 3D Printing Fabrication. J. Biomed. Mater. Res. B Appl. Biomater. 2019, 107, 1329–1351. [Google Scholar] [CrossRef]
  47. Lv, Y.; Wang, B.; Liu, G.; Tang, Y.; Lu, E.; Xie, K.; Lan, C.; Liu, J.; Qin, Z.; Wang, L. Metal Material, Properties and Design Methods of Porous Biomedical Scaffolds for Additive Manufacturing: A Review. Front. Bioeng. Biotechnol. 2021, 9, 641130. [Google Scholar] [CrossRef]
  48. Castro, A.P.G.; Lacroix, D. Micromechanical Study of the Load Transfer in a Polycaprolactone–Collagen Hybrid Scaffold When Subjected to Unconfined and Confined Compression. Biomech. Model. Mechanobiol. 2018, 17, 531–541. [Google Scholar] [CrossRef]
  49. Sandino, C.; Checa, S.; Prendergast, P.J.; Lacroix, D. Simulation of Angiogenesis and Cell Differentiation in a CaP Scaffold Subjected to Compressive Strains Using a Lattice Modeling Approach. Biomaterials 2010, 31, 2446–2452. [Google Scholar] [CrossRef]
  50. Metz, C.; Duda, G.N.; Checa, S. Towards Multi-Dynamic Mechano-Biological Optimization of 3D-Printed Scaffolds to Foster Bone Regeneration. Acta Biomater. 2019, 101, 117–127. [Google Scholar] [CrossRef] [PubMed]
  51. Checa, S.; Prendergast, P.J. A Mechanobiological Model for Tissue Differentiation That Includes Angiogenesis: A Lattice-Based Modeling Approach. Ann. Biomed. Eng. 2009, 37, 129–145. [Google Scholar] [CrossRef] [PubMed]
  52. Sandino, C.; Planell, J.A.; Lacroix, D. A Finite Element Study of Mechanical Stimuli in Scaffolds for Bone Tissue Engineering. J. Biomech. 2008, 41, 1005–1014. [Google Scholar] [CrossRef] [PubMed]
  53. Bose, S.; Roy, M.; Bandyopadhyay, A. Recent Advances in Bone Tissue Engineering Scaffolds. Trends Biotechnol. 2012, 30, 546–554. [Google Scholar] [CrossRef] [PubMed]
  54. Ghosh, R.; Chanda, S.; Chakraborty, D. Application of Finite Element Analysis to Tissue Differentiation and Bone Remodelling Approaches and Their Use in Design Optimization of Orthopaedic Implants: A Review. Int. J. Numer. Method Biomed. Eng. 2022, 38, e3637. [Google Scholar] [CrossRef] [PubMed]
  55. Jin, Z. Computational Modelling of Biomechanics and Biotribology in the Musculoskeletal System: Biomaterials and Tissues; Elsevier: Amsterdam, The Netherlands, 2014; ISBN 9780857096739. [Google Scholar]
  56. Vignesh, S.; Vijayakumar, P.; Anbarasan, B. Review on Finite Element Method in Biomedical Engineering. J. Adv. Res. Dyn. Control. Syst. 2019, 11, 1028–1032. [Google Scholar]
  57. Jean, R.P.; Chen, C.S.; Spector, A.A. Finite-Element Analysis of the Adhesion-Cytoskeleton-Nucleus Mechanotransduction Pathway during Endothelial Cell Rounding: Axisymmetric Model. J. Biomech. Eng. 2005, 127, 594–600. [Google Scholar] [CrossRef] [PubMed]
  58. Huiskes, R.; Chao, E.Y.S. A Survey of Finite Element Analysis in Orthopedic Biomechanics: The First Decade. J. Biomech. 1983, 16, 385–409. [Google Scholar] [CrossRef]
  59. Barreto, S.; Perrault, C.M.; Lacroix, D. Structural Finite Element Analysis to Explain Cell Mechanics Variability. J. Mech. Behav. Biomed. Mater. 2014, 38, 219–231. [Google Scholar] [CrossRef]
  60. Vaiani, L.; Migliorini, E.; Cavalcanti-Adam, E.A.; Uva, A.E.; Fiorentino, M.; Gattullo, M.; Manghisi, V.M.; Boccaccio, A. Coarse-Grained Elastic Network Modelling: A Fast and Stable Numerical Tool to Characterize Mesenchymal Stem Cells Subjected to AFM Nanoindentation Measurements. Mater. Sci. Eng. C 2021, 121, 111860. [Google Scholar] [CrossRef]
  61. Boccaccio, A.; Frassanito, M.C.; Lamberti, L.; Brunelli, R.; Maulucci, G.; Monaci, M.; Papi, M.; Pappalettere, C.; Parasassi, T.; Sylla, L.; et al. Nanoscale Characterization of the Biomechanical Hardening of Bovine Zona Pellucida. J. R. Soc. Interface 2012, 9, 2871–2882. [Google Scholar] [CrossRef]
  62. Boccaccio, A.; Lamberti, L.; Papi, M.; De Spirito, M.; Pappalettere, C. Effect of AFM Probe Geometry on Visco-Hyperelastic Characterization of Soft Materials. Nanotechnology 2015, 26, 325701. [Google Scholar] [CrossRef]
  63. Ficarella, E.; Minooei, M.; Santoro, L.; Toma, E.; Trentadue, B.; De Spirito, M.; Papi, M.; Pruncu, C.I.; Lamberti, L. Visco-HyperelasticCharacterization of the Equine Immature Zona Pellucida. Materials 2021, 14, 1223. [Google Scholar] [CrossRef]
  64. Lin, D.C.; Shreiber, D.I.; Dimitriadis, E.K.; Horkay, F. Spherical Indentation of Soft Matter beyond the Hertzian Regime: Numerical and Experimental Validation of Hyperelastic Models. Biomech. Model Mechanobiol. 2009, 8, 345–358. [Google Scholar] [CrossRef]
  65. Hsia, C.C.W.; Chuong, C.J.C.; Johnson, R.L., Jr. Effect of Shape Distortion of Red Blood Cell on Pulmonary Capillary Diffusive Uptake of Carbon Monoxide: A Finite Element Analysis. FASEB J. 1996, 10, A362. [Google Scholar]
  66. Boccaccio, A.; Uva, A.E.; Papi, M.; Fiorentino, M.; De Spirito, M.; Monno, G. Nanoindentation Characterisation of Human Colorectal Cancer Cells Considering Cell Geometry, Surface Roughness and Hyperelastic Constitutive Behaviour. Nanotechnology 2017, 28, 45703. [Google Scholar] [CrossRef]
  67. Migliorini, E.; Cavalcanti-Adam, E.A.; Uva, A.E.; Fiorentino, M.; Gattullo, M.; Manghisi, V.M.; Vaiani, L.; Boccaccio, A. Nanoindentation of Mesenchymal Stem Cells Using Atomic Force Microscopy: Effect of Adhesive Cell-Substrate Structures. Nanotechnology 2021, 32, 215706. [Google Scholar] [CrossRef]
  68. Vargas-Pinto, R.; Gong, H.; Vahabikashi, A.; Johnson, M. The Effect of the Endothelial Cell Cortex on Atomic Force Microscopy Measurements. Biophys. J. 2013, 105, 300–309. [Google Scholar] [CrossRef] [PubMed]
  69. Kamm, R.D.; McVittie, A.K.; Bathe, M. On the Role of Continuum Models in Mechanobiology. In Proceedings of the ASME International Mechanical Engineering Congress and Exposition, Orlando, FL, USA, 5–10 November 2000; Proceedings (IMECE). Volume 2000-Z, pp. 1–11. [Google Scholar]
  70. Thoumine, O.; Cardoso, O.; Meister, J.-J. Changes in the Mechanical Properties of Fibroblasts during Spreading: A Micromanipulation Study. Eur. Biophys. J. 1999, 28, 222–234. [Google Scholar] [CrossRef] [PubMed]
  71. Frisch, T.; Thoumine, O. Predicting the Kinetics of Cell Spreading. J. Biomech. 2002, 35, 1137–1141. [Google Scholar] [CrossRef] [PubMed]
  72. Thoumine, O.; Ott, A. Time Scale Dependent Viscoelastic and Contractile Regimes in Fibroblasts Probed by Microplate Manipulation. J. Cell Sci. 1997, 110, 2109–2116. [Google Scholar] [CrossRef] [PubMed]
  73. Kamgoué, A.; Ohayon, J.; Tracqui, P. Estimation of Cell Young’s Modulus of Adherent Cells Probed by Optical and Magnetic Tweezers: Influence of Cell Thickness and Bead Immersion. J. Biomech. Eng. 2007, 129, 523–530. [Google Scholar] [CrossRef] [PubMed]
  74. Hénon, S.; Lenormand, G.; Richert, A.; Gallet, F. A New Determination of the Shear Modulus of the Human Erythrocyte Membrane Using Optical Tweezers. Biophys. J. 1999, 76, 1145–1151. [Google Scholar] [CrossRef]
  75. Lenormand, G.; Hénon, S.; Richert, A.; Siméon, J.; Gallet, F. Elasticity of the Human Red Blood Cell Skeleton. Biorheology 2002, 40, 247–251. [Google Scholar]
  76. Bausch, A.R.; Möller, W.; Sackmann, E. Measurement of Local Viscoelasticity and Forces in Living Cells by Magnetic Tweezers. Biophys. J. 1999, 76, 573–579. [Google Scholar] [CrossRef] [PubMed]
  77. Feneberg, W.; Aepfelbacher, M.; Sackmann, E. Microviscoelasticity of the Apical Cell Surface of Human Umbilical Vein Endothelial Cells (HUVEC) within Confluent Monolayers. Biophys. J. 2004, 87, 1338–1350. [Google Scholar] [CrossRef] [PubMed]
  78. Phan-Thien, N. Rigid Spherical Inclusion: The Multipole Expansion. J. Elast. 1993, 32, 243–252. [Google Scholar] [CrossRef]
  79. Mijailovich, S.M.; Kojic, M.; Zivkovic, M.; Fabry, B.; Fredberg, J.J. A Finite Element Model of Cell Deformation during Magnetic Bead Twisting. J. Appl. Physiol. 2002, 93, 1429–1436. [Google Scholar] [CrossRef] [PubMed]
  80. Ohayon, J.; Tracqui, P. Computation of Adherent Cell Elasticity for Critical Cell-Bead Geometry in Magnetic Twisting Experiments. Ann. Biomed. Eng. 2005, 33, 131–141. [Google Scholar] [CrossRef]
  81. Laurent, V.M.; Hénon, S.; Planus, E.; Fodil, R.; Balland, M.; Isabey, D.; Gallet, F. Assessment of Mechanical Properties of Adherent Living Cells by Bead Micromanipulation: Comparison of Magnetic Twisting Cytometry vs Optical Tweezers. J. Biomech. Eng. 2002, 124, 408–421. [Google Scholar] [CrossRef] [PubMed]
  82. Guimarães, C.F.; Gasperini, L.; Marques, A.P.; Reis, R.L. The Stiffness of Living Tissues and Its Implications for Tissue Engineering. Nat. Rev. Mater. 2020, 5, 351–370. [Google Scholar] [CrossRef]
  83. Cui, Q.; Liu, T.; Li, X.; Zhao, L.; Wu, Q.; Wang, X.; Song, K.; Ge, D. Validation of the Mechano-Bactericidal Mechanism of Nanostructured Surfaces with Finite Element Simulation. Colloids Surf. B Biointerfaces 2021, 206, 111929. [Google Scholar] [CrossRef]
  84. Ananthakrishnan, R.; Guck, J.; Wottawah, F.; Schinkinger, S.; Lincoln, B.; Romeyke, M.; Moon, T.; Käs, J. Quantifying the Contribution of Actin Networks to the Elastic Strength of Fibroblasts. J. Theor. Biol. 2006, 242, 502–516. [Google Scholar] [CrossRef] [PubMed]
  85. Tracqui, P.; Ohayon, J. Transmission of Mechanical Stresses within the Cytoskeleton of Adherent Cells: A Theoretical Analysis Based on a Multi-Component Cell Model. Acta Biotheor. 2004, 52, 323–341. [Google Scholar] [CrossRef] [PubMed]
  86. McGarry, J.G.; Prendergast, P.J.; Ashton, B.; Klein-Nulend, J. A Three-Dimensional Finite Element Model of an Adherent Eukaryotic Cell. Eur. Cell Mater. 2004, 7, 27–34. [Google Scholar] [CrossRef] [PubMed]
Figure 1. Schematization of the focal adhesion structure (FAs). As shown, FAs have a multilayer architecture, allowing cells to interact with the extracellular matrix (ECM). Starting from the cell–substrate interface and proceeding towards the inner part of the cell, FA structure can be schematized into two main regions: a transmembrane domain and an intracellular one. The FA transmembrane domain consists of heterodimeric proteins (i.e., integrins (IT)), which span the plasma membrane and act as receptors to ensure a high affinity bind with ECM ligands. At the cytoplasmatic side of the cell, integrins link to the FA intracellular domain consisting of a multiprotein complex which, in turn, links to the actin bundles, thus ensuring the connection between integrins and cytoskeleton structure. The components that constitute the FA intracellular domain are vinculin, talin, zyxin, paxillin, focal adhesion kinase, vasodilator-stimulated phosphoprotein, and adaptor protein p130Cas. Abbreviations in the figure are VCL (vinculin), TLN (talin), ZYX (zyxin), PAX (paxillin), FAK (focal adhesion kinase), and VASP (vasodilator-stimulated phosphoprotein). Reprinted with permission from [35], 2018 Frontiers.
Applsci 14 02596 g001
Figure 2. Schematization of the linker of nucleoskeleton and cytoskeleton (LINC) complexes binding cytoskeleton structures to the nucleoskeleton. LINC complexes consist of SUN and nesprin protein isoforms. SUN proteins span the inner nuclear membrane (INM) and bind to nesprin isoforms in the perinuclear space (PS). Nesprin isoforms, in turn, pass through the outer nuclear membrane (ONM) and connect to the cytoskeleton structures. In particular, nesprin-1/2 isoform connects directly to actin filaments, nespin-3 isoform connects to intermediate filaments (IFs) through plectin, and nesprin-4 isoform connects to microtubules (MTs) through kinesin. At the nucleoskeleton side, SUN proteins bind to the lamina of the nucleus through lamin A, which interacts with chromatin both directly and through emerin protein. Therefore, thanks to LINC complexes, the stimulus detected by FAs at the cell–substrate interface and canalized through cytoskeletal transferring channels can reach the intranuclear domain, thus resulting in chromatin reorganization and transcription program activation that affect cell behavior. Abbreviations in the figure are MTs (microtubules), IFs (intermediate filaments), PS (perinuclear space), NPC (nuclear pore complex), INM (inner nuclear membrane), and ONM (outer nuclear membrane). Reprinted with permission from [35], 2018 Frontiers.
Applsci 14 02596 g002
Figure 3. Side view of the cell that adheres and spreads on the substrate. The cell is schematized as a region consisting of a high-viscosity internal fluid domain (colored light blue) enveloped by the cortex (colored dark blue), which carries the cortical tension τ. The cell schematization in (a) refers to the initial phases of the adhesion process (i.e., after a few minutes). Cell schematization reported in (b) refers to the final phases of the adhesion process (i.e., after hours). Assuming that during spreading cell morphologies resemble truncated spheres and spherical caps means that the contact region between cell and substrate can be considered a circular area. Since the figure represents the cell side view, the contact area in the figure corresponds to the line defined by the interaction interface between cell and substrate schematizations. At the macroscopic level, cell morphology is described by two parameters: the contact radius R and the contact angle θ. The contact radius R is obtained by dividing the diameter of the circular contact area between the cell and the substrate by two (i.e., by dividing by two the length of the line defined by the contact interface between the cell and substrate in the figure). The contact angle θ is the angle identified by the plane tangent to the upper surface of the substrate and the plane tangent to the cell-free contour that passes through the point where the cell-free contour meets the substrate. Contact radius R is colored orange. Contact angle θ and planes tangent to the substrate’s top surface and the cell’s free contour are colored dark brown.
Applsci 14 02596 g003
Figure 4. Schematic of the tweezer micromanipulation technique. An adherent cell is mechanically tested by applying to the bead center an external force acting in the direction parallel to the substrate plane. The bead is partially embedded in the outer layer of the cell material, and the cell–bead interaction is ensured by the link between the RGD peptide-functionalized bead surface and membrane integrins. The substrate is highlighted in white, the cell material in beige, and the bead in light gray. F (i.e., red arrow), which is the external force acting on the bead.
Applsci 14 02596 g004
Figure 5. (a) Schematization of the probing bead partially embedded in the outer layer of the cell; (b) schematic section view of cell representative volume element (RVE) obtained by cutting the cell’s material with a perpendicular plane to the cell’s top surface passing through the center of the bead partially embedded in the cellular material. The bead is highlighted in gray, and the cell representative volume element is in beige. The bead embedding half angle γ is the angle defined by the vertical dashed line perpendicular to the cell surface and the solid line connecting the bead center with the point where the cell profile meets the cell top surface at the right end of the interaction region. The under-bead cell thickness hu is related to the cell height h by the formula h = hu + R(1 − cosγ).
Applsci 14 02596 g005
Table 1. Classification of the main studies surveyed in this review paper based on the cell type.
Cell TypeReferences
Stem Cells[4,13,40,41,49,51,54,60,67]
Endothelial Cells[49,51,57,68,73,79]
Fibroblasts[59,70,71,79,84,86]
Epithelial Cells[69,73,79,80,85]
Blood Cells[8,65,75]
Cancer Cells[66,84]
Oocytes[61,62,63]
Connective Tissue Cells (Chondrocytes, Osteoblasts)[48,64]
Bacteria[83]
Disclaimer/Publisher’s Note: The statements, opinions and data contained in all publications are solely those of the individual author(s) and contributor(s) and not of MDPI and/or the editor(s). MDPI and/or the editor(s) disclaim responsibility for any injury to people or property resulting from any ideas, methods, instructions or products referred to in the content.

