Article

The Effect of Type and Duration of Digestive Enzyme Treatment on Coffee Bean Composition

Division of Food Quality Assessment, Department of Food Technology and Assessment, Institute of Food Sciences, Warsaw University of Life Sciences (WULS-SGGW), 159C Nowoursynowska Street, 02-776 Warsaw, Poland
*
Authors to whom correspondence should be addressed.
Appl. Sci. 2024, 14(6), 2484; https://doi.org/10.3390/app14062484
Submission received: 5 February 2024 / Revised: 8 March 2024 / Accepted: 13 March 2024 / Published: 15 March 2024
(This article belongs to the Section Food Science and Technology)

Abstract

:
During kopi luwak production, coffee fruit is subjected to enzymatic and microbial treatment. While microbial modification of coffee fruit or beans is often investigated, there is little information regarding the influence of the enzymatic part of the process. In this study, green Arabica and Robusta beans were modified using basic animal digestive enzymes (pepsin or trypsin with α-amylase) and various treatment times (3, 6 or 12 h) to determine their effect on bioactive and other quality-affecting compounds. Analyses of coffee composition were performed using spectrophotometric and HPLC methods. Modified and control samples were significantly affected by the treatment. Among enzymes used, only proteases exhibited noticeable impact on target compounds by increasing soluble protein content in green beans. The most advantageous modification time was 3 h. The composition of beans was altered by the roasting step, with the effect not quite corresponding to the previous stage. In conclusion, enzymatic treatment of green coffee beans provides a way to alter coffee composition, which can further influence its quality.

1. Introduction

Main constituents of green coffee beans are carbohydrates, N-containing compounds, lipids, acids and water. During the roasting process, each of those groups undergo many changes and coffee beans acquire characteristic color and aroma. The composition of green coffee affects the roasting process and sensory characteristics of the roasted coffee beans [1]. There are numerous factors that influence chemical composition of green coffee, e.g., species and variety of coffee tree, geographical origin, cultivation processes, ripeness and post-harvest processing of coffee fruits [2,3]. Basic methods used for post-harvest processing are dry/natural method, wet method and semi-dry method [4]. There are also less conventional methods, in which production of kopi luwak needs to be included.
Coffee known as kopi luwak has been of interest to consumers and scientists for many years. The production of kopi luwak takes place in Indonesia, where a civet cat (Paradoxurus hermaphrodites ssp.) consumes ripe coffee fruits and, after digestion, excretes green coffee beans. They are later separated from manure, cleaned, dried and roasted. Kopi luwak exhibits a unique sensory profile and high market price thanks to its unique production method [5,6]. In order to increase the supply of this coffee, adulteration or cage breeding and force-feeding of civet cats are used [6].
Scientific interest regarding kopi luwak production concentrates mainly on microbiological aspects. Suhandono et al. [7] and Watanabe et al. [8] worked on the identification of microorganisms, which can participate in kopi luwak fermentation during its passage through the digestive tract. There were also experiments to produce artificial kopi luwak using microbiota from the civet digestive tract or microorganisms isolated from its manure [9,10,11]. However, there is not much information regarding the effect of digestive enzyme activity on the composition of coffee.
Proteins and carbohydrates are the main structural components in green coffee and are precursors of compounds that are very important for the quality of roasted coffee (primarily, Maillard reaction products) [1]. Pepsin (stomach) and trypsin (small intestine) are proteolytic enzymes that are active in different parts of the digestive tract. α-amylase is one of the basic amylolytic enzymes and is active in the mouth and small intestine. Digestive enzyme activity might affect carbohydrates and proteins present in green coffee beans and, therefore, change characteristics of the final product [4].
Due to limited availability of fresh coffee material and the intricate nature of digestion, reconstruction of kopi luwak production in the laboratory is not always possible. Nevertheless, by drawing inspiration from this process, it becomes feasible to investigate the effect of factors akin to those encountered in the digestive tract of civet cats on readily available coffee material. Therefore, this study investigated the effect of typical proteolytic and amylolytic enzymes present in the animal digestive tract and the duration of such enzymatic modification on compositional changes in both green and roasted coffee beans. The analysis focused on both fundamental and coffee-specific components commonly associated with coffee quality.

2. Materials and Methods

Pepsin from porcine gastric mucosa, trypsin from porcine pancreas, α-amylase from porcine pancreas, acetonitrile, sucrose, sodium dodecyl sulfate (SDS), bovine serum albumin, fructose, gallic acid (GA) and 3-caffeoylquinic acid (3-CQA) were purchased from SigmaAldrich (Buchs SG, Switzerland). HCl, glucose, Folin–Ciocalteu reagent, Na2CO3, NaOH, CuSO4∙5H2O and KNaC4H4O6∙4H2O were acquired from Chempur (Piekary Śląskie, Poland). Avantor Performance Materials Poland S.A. (Gliwice, Poland) was a provider of NaH2PO4∙2H2O, Na2HPO4∙12H2O, methanol and acetic acid. Acetone obtained from VWR International Sp. z o.o. (Gdańsk, Poland) and caffeine obtained from Alchem Group (Toruń, Poland) were used. Solutions were prepared with distilled water unless mentioned otherwise.
Green Arabica and Robusta coffee beans were purchased from local roastery LaCava sp. z o.o. All beans were produced in Rwanda using a wet processing method. The day before the experiment, green coffee beans (75 g) were combined with 100 mL of distilled water and sterilized (121 °C, 20 min, 0.1 mbar) [12,13]. Extracts were discarded and beans were rinsed with distilled water before enzyme applications.

2.1. Enzymatic Modification

Solutions of pepsin (174.2 mg/25 mL 0.01 M HCl; approximately 1000 U/mL), trypsin (0.2 mg/25 mL 0.001 M HCl; approximately 500 U/mL) and α-amylase (100 mg/100 mL water with 58.4 mg NaCl; approximately 32 U/mL), as well as HCl (0.01 M) and phosphate buffer (pH 7) solutions, were prepared on the day of experiment. To prepare phosphate buffer, solutions of NaH2PO4∙2H2O (3.48 g/100 mL) and Na2HPO4∙12H2O (7.17 g/100 mL) were mixed (195:305) and filled up to 1000 mL.
In a bottle containing prepared coffee beans, 5 mL of pepsin solution or 5 mL of trypsin solution together with 20 mL of α-amylase solution were added. HCl or phosphate buffer, respectively, were used to increase mixtures’ volume to 200 mL (to cover all coffee beans). Samples were incubated for 3, 6 or 12 h (30 °C, 125 rpm) and later dried in an air oven (40 °C) in order to preserve coffee material (until the weight of samples was less than 68 g). Control samples were prepared the same way without the addition of enzyme solutions. All samples were prepared in duplicates.
pH values of prepared mixtures were measured at the beginning (0 h) and after modifications (3, 6 or 12 h).

2.2. Preparation of Samples and Extracts

Green coffee beans (25 g) were roasted in sample roaster IKAWA Pro V2 (IKAWA Ltd., London, UK; max temperature 213 °C; total time 5.75 min). Green and roasted coffee beans (25 g) were ground using MF 10 basic laboratory grinder (IKA Poland Sp. z o.o., Warsaw, Poland; 3500 rpm) equipped with 2 mm sieve.
Ground coffee beans and methanol (80%) were combined (1:5). The mixture underwent ultrasonic treatment for 20 min and later was placed in 4 °C for the extraction (24 h). Methanolic extracts were then filtered and stored in −20 °C before analysis.
Extraction of proteins was performed as described by Figueroa Campos et al. [14] with modifications. Ground coffee beans (50 mg) were combined with 5 mL of methanol (80%) and extracted for 30 min. Next, samples were centrifuged (4075× g, 15 min, 5 °C) and supernatants were discarded. Coffee was then mixed with 1 mL of acetone. After 5 min, solvent residue was removed and 5 mL of SDS solution (1%) was added. Extraction was carried out at 4 °C for 24 h. Samples were then centrifuged, after which extracts were filtered and stored before usage at −20 °C.

2.3. Characterization of Coffee Beans

Dry matter of green and roasted coffee beans was calculated based on mass loss of ground coffee (2 g) after 4 h drying at 104 °C. It was used in later calculations. Ground bean color was analyzed in the CIELab system using Chroma Meter CR-400 (Konica Minolta Co., Ltd., Tokyo, Japan), which was calibrated using a white standard plate before analysis. Both analyses were performed four times for each prepared sample variant.

2.4. Chemical Composition of Coffee

Analyses of coffee chemical composition were divided into two groups: basic components (carbohydrates and protein contents) and bioactive compounds that are characteristic in coffee (caffeine, total polyphenols, 3-CQA).
The content of coffee carbohydrates (fructose, glucose, sucrose) was analyzed with the HPLC system (Shimadzu Europa GmbH, Duisburg, Germany) equipped with an evaporative light-scattering detector [15]. Methanolic extracts were diluted and filtered using syringe filters (diameter 25 mm, pore size 0.22 μm). Carbohydrate separation was performed on the Supelcoil LC-NH2 column (25 cm × 4.6 mm, 5 μm) at 30 °C. Injection volume was 5/10 μL for sucrose and 10–25 μL for fructose and glucose analyses. The mobile phase was acetonitrile and water (78:22), at a flow rate of 1 mL/min. Total time of analysis was 12 min. Determination of carbohydrates was based on comparison with retention times observed for standard solutions (2 mg/mL): fructose—6.767 min, glucose—7.525 min and sucrose—10.108 min. Calibration curves for each analyzed sugar were prepared in the LabSolution program and used for further calculations. Limit of detection (LOD) and limit of quantification (LOQ) were as follows: fructose—LOD 0.160 μg, LOQ 0.490 μg; glucose—LOD 0.204 μg, LOQ 0.617 μg; sucrose—LOD 0.130 μg, LOQ 0.380 μg.
Protein content was evaluated using the Lowry method [16]. The reagent mixture was prepared by combining the following solutions in 10:1:1 ratio: 2% Na2CO3 in 0.1 M NaOH, 1% CuSO4 and 2% KNaC4H4O6∙4H2O. Diluted SDS extracts (0.6 mL) were mixed with 3 mL of reagent mixture. After 10 min, 0.3 mL of Folin–Ciocalteu reagent diluted with water (1:1) was added. Samples were placed in the dark for 30 min. Absorbance was measured at 750 nm (UVmini 1240, Shimadzu, Kioto, Japan) against a reagent blank. A standard solution of bovine serum albumin in water (1.5 mg/mL) was used to prepare a calibration curve, which was used in further calculations.
Total polyphenols were analyzed with the Folin–Ciocalteu method described by Wołosiak et al. [17]. GA solution in 80% methanol (1 mg/mL) was used as a standard solution to prepare the calibration curve.
The amounts of caffeine and 3-CQA were determined using an HPLC system with a diode array detector, using a method described by Wang et al. [18] with modifications. Samples were prepared as in carbohydrate analysis. Separation was performed on the Kinetex 5u C18 100A column (150 × 4.6 mm) at 30 °C, with injection volume of 10 μL, mobile phase of acetic acid solution (0.1%) and acetonitrile mixed in an 87:12 ratio, flow rate of 1 mL/min and for a total time of 12 min. Caffeine was analyzed at 272 nm, and 3-CQA was measured at 325 nm. Determination of compounds was based on comparison of retention times with values established for standard solutions (2 mg/mL): 3.552 min and 3.072 min for caffeine and 3-CQA, respectively. Standard solutions were used for calibration curves preparation and further calculations in LabSolutions software. LOD and LOQ for caffeine were 0.005 μg and 0.151 μg, respectively, and for 3-CQA were 0.005 μg and 0.145 μg, respectively.

2.5. Statistical Analysis

Analysis of results was performed using R Statistical Software (v4.3.2) [19]. Assumptions regarding normal distribution of values and equality of variances between groups were tested using Shapiro–Wilk’s and Levene’s tests, respectively. In order to compare results of controls and modified samples, the one-way analysis of variance (ANOVA), analysis of variance with Welch correction or Kruskal–Wallis tests were used. Next, Tukey’s HSD or Wilcoxon test with Bonferroni correction was used to compare mean values for groups (when analysis of variance indicated significant differences). Each prepared modification variant was analyzed separately. For comparison of controls and modified samples at the same modification times, t-test or Wilcoxon test with Bonferroni correction were used, depending on the distribution of values in each group. For all tests, the level of significance was α = 0.05.

3. Results and Discussion

3.1. pH Values during Enzymatic Modification

At the beginning and after a specified modification time, the pH values of samples and controls were measured (Table 1). The values measured immediately after preparation of the mixtures (0 h) were comparable for beans of different species and ranged between 4.13–4.92 and 6.95–7.01 for samples with the addition of 0.01 M HCl and phosphate buffer, respectively. In the case of the former ones, an increase in pH values over time was observed, with generally higher values observed with longer times. In the case of samples prepared using phosphate buffer, the opposite trend was noted—a slight (0.2–0.5) decrease in pH values after modification was observed. In controls, a slightly decreasing trend was noticeable with prolonged duration of the process.
The applied HCl solution did not lower the pH of the coffee bean mixtures to a value close to 2, where pepsin exhibits maximum activity. However, literature data indicate that pepsin shows activity at pH values below 6.5, which is also confirmed by the data from the manufacturer of the enzyme used [20]. Overall, conditions created by usage of applied solutions (HCl and phosphate buffer) were suitable for observing the activity of selected digestive enzymes.
Literature data show that the pH value of green coffee bean extracts can be in the range of 4–5; these values vary depending on the geographical origin and processing method [21,22]. In this work, observed changes in pH values could be explained by the extraction of coffee compounds. During the sterilization process, high temperature might have led to an increase in beans’ volume and loosening of their structure, significantly affecting the extraction rate. Additionally, the applied digestive enzymes could have caused the release of additional buffering compounds (including proteins and peptides) from the coffee matrix, which could have influenced the pH of the environment.

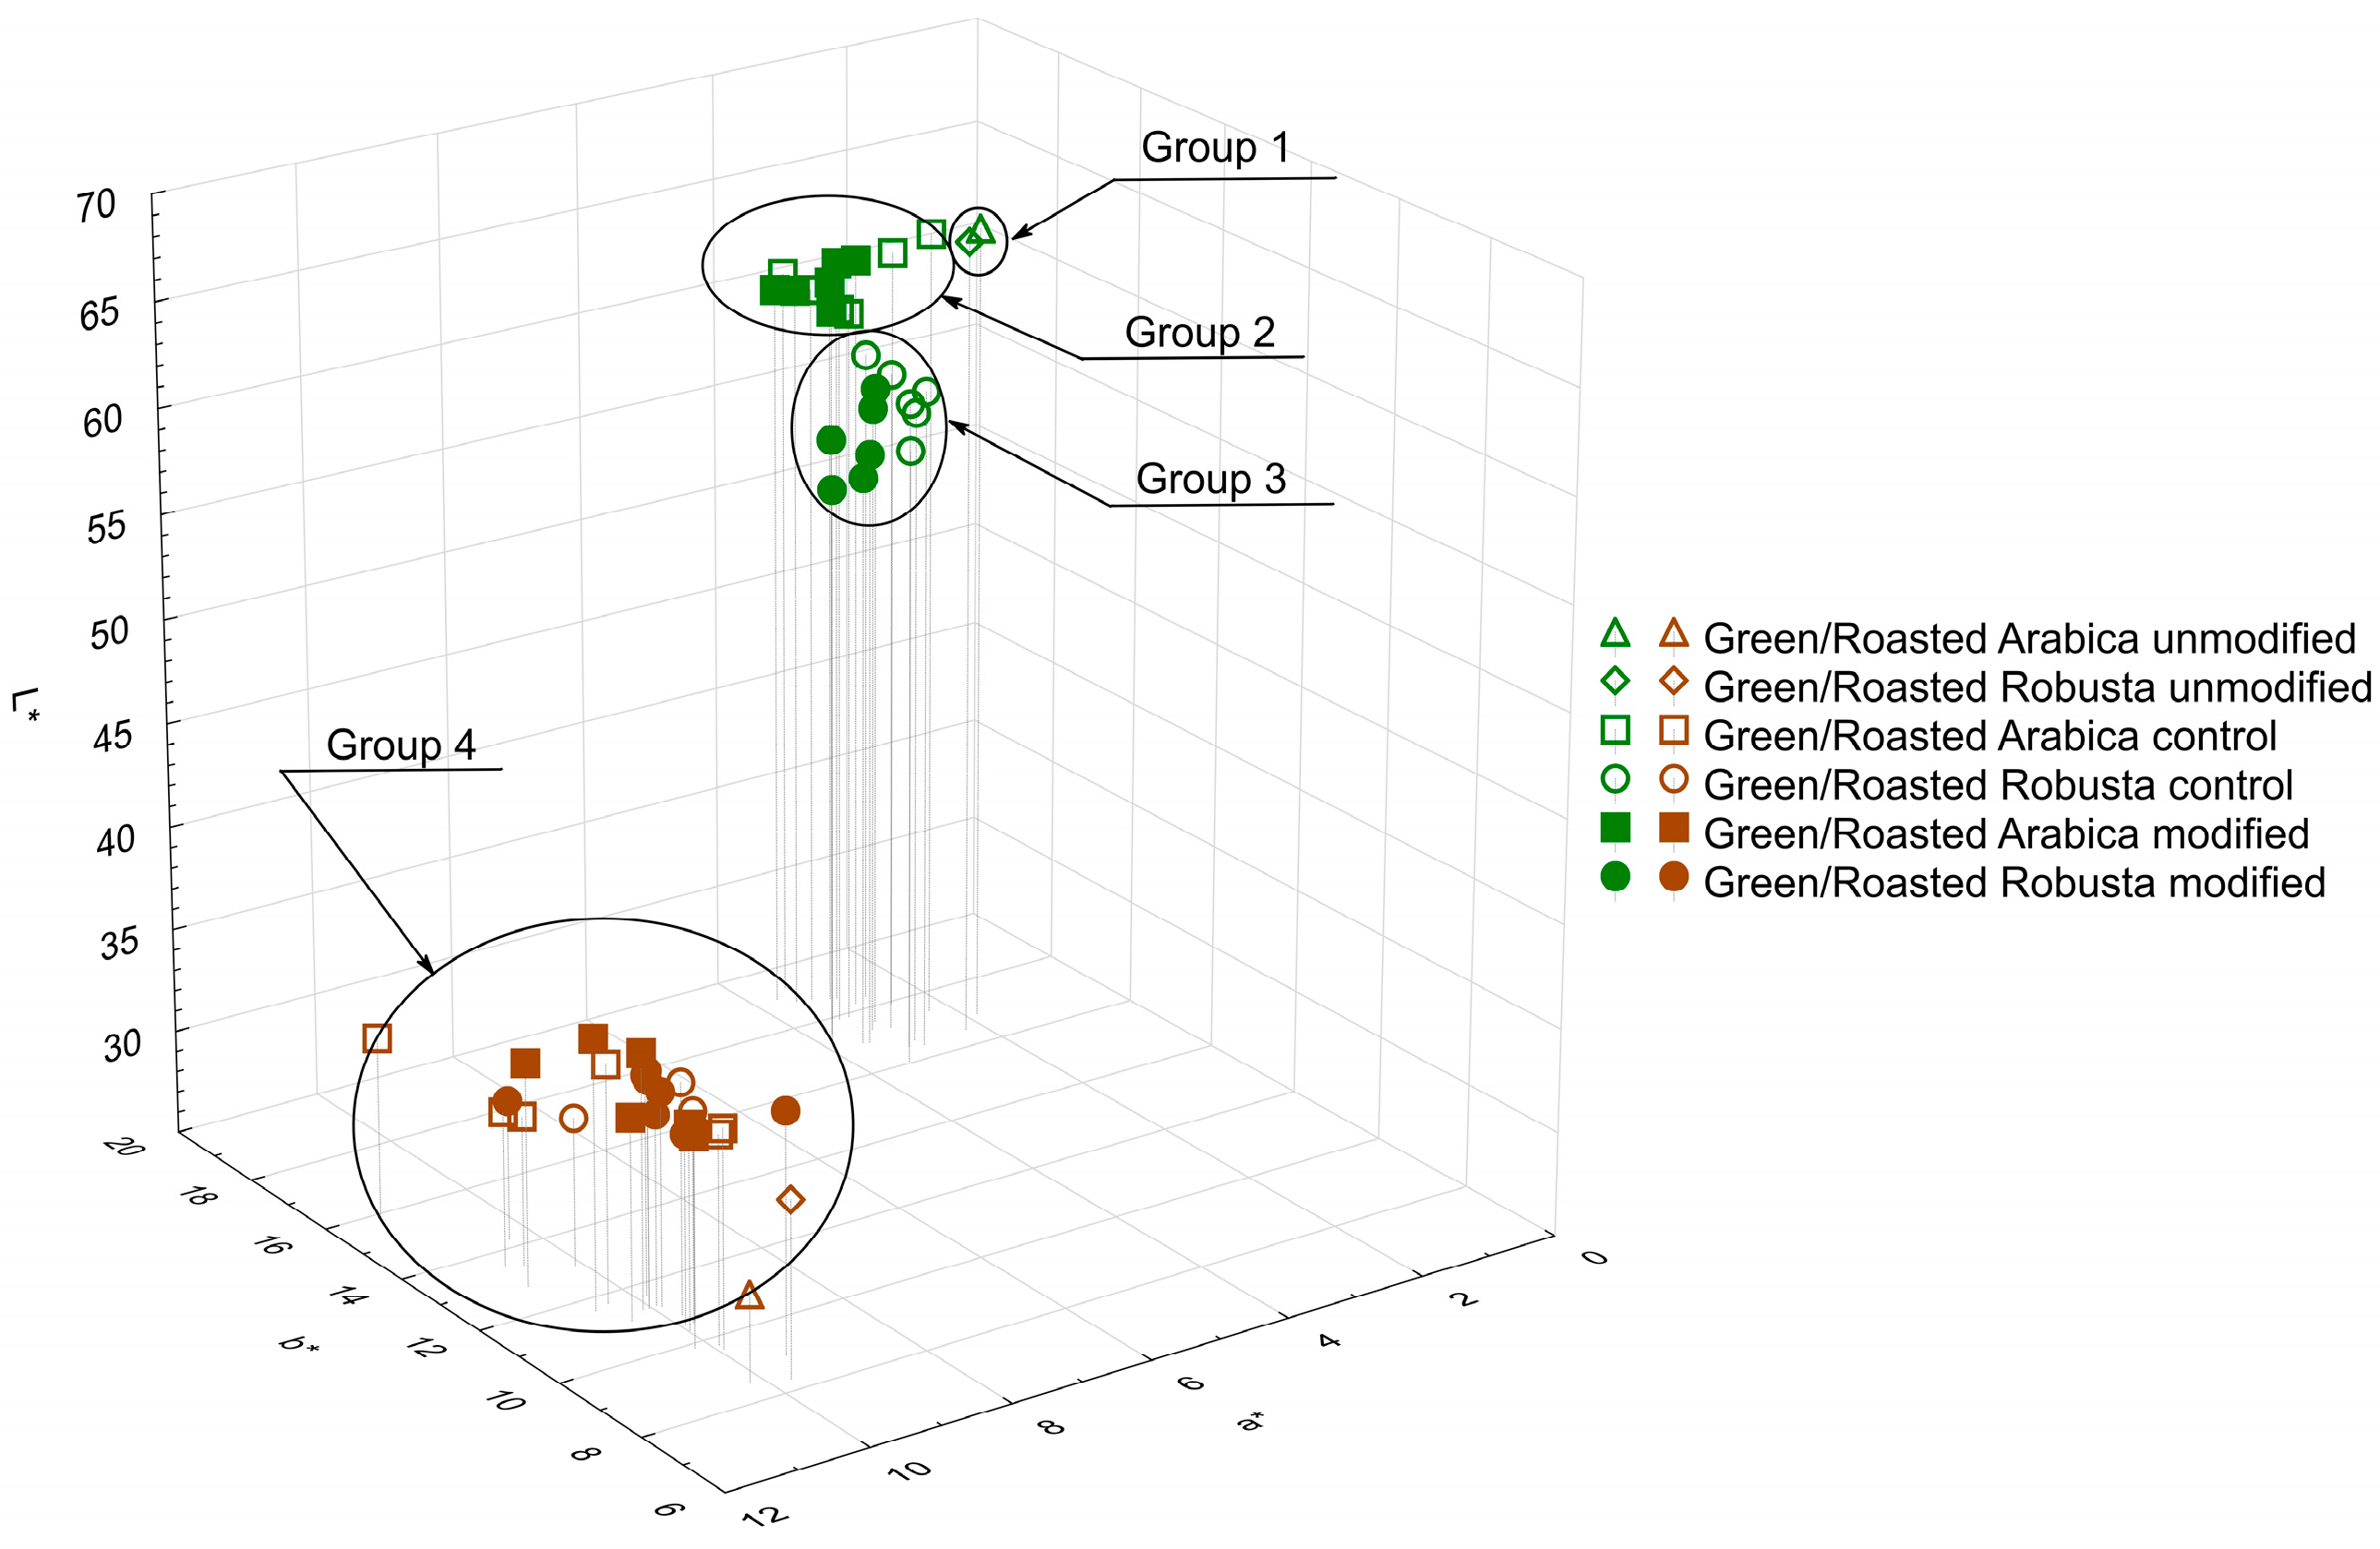
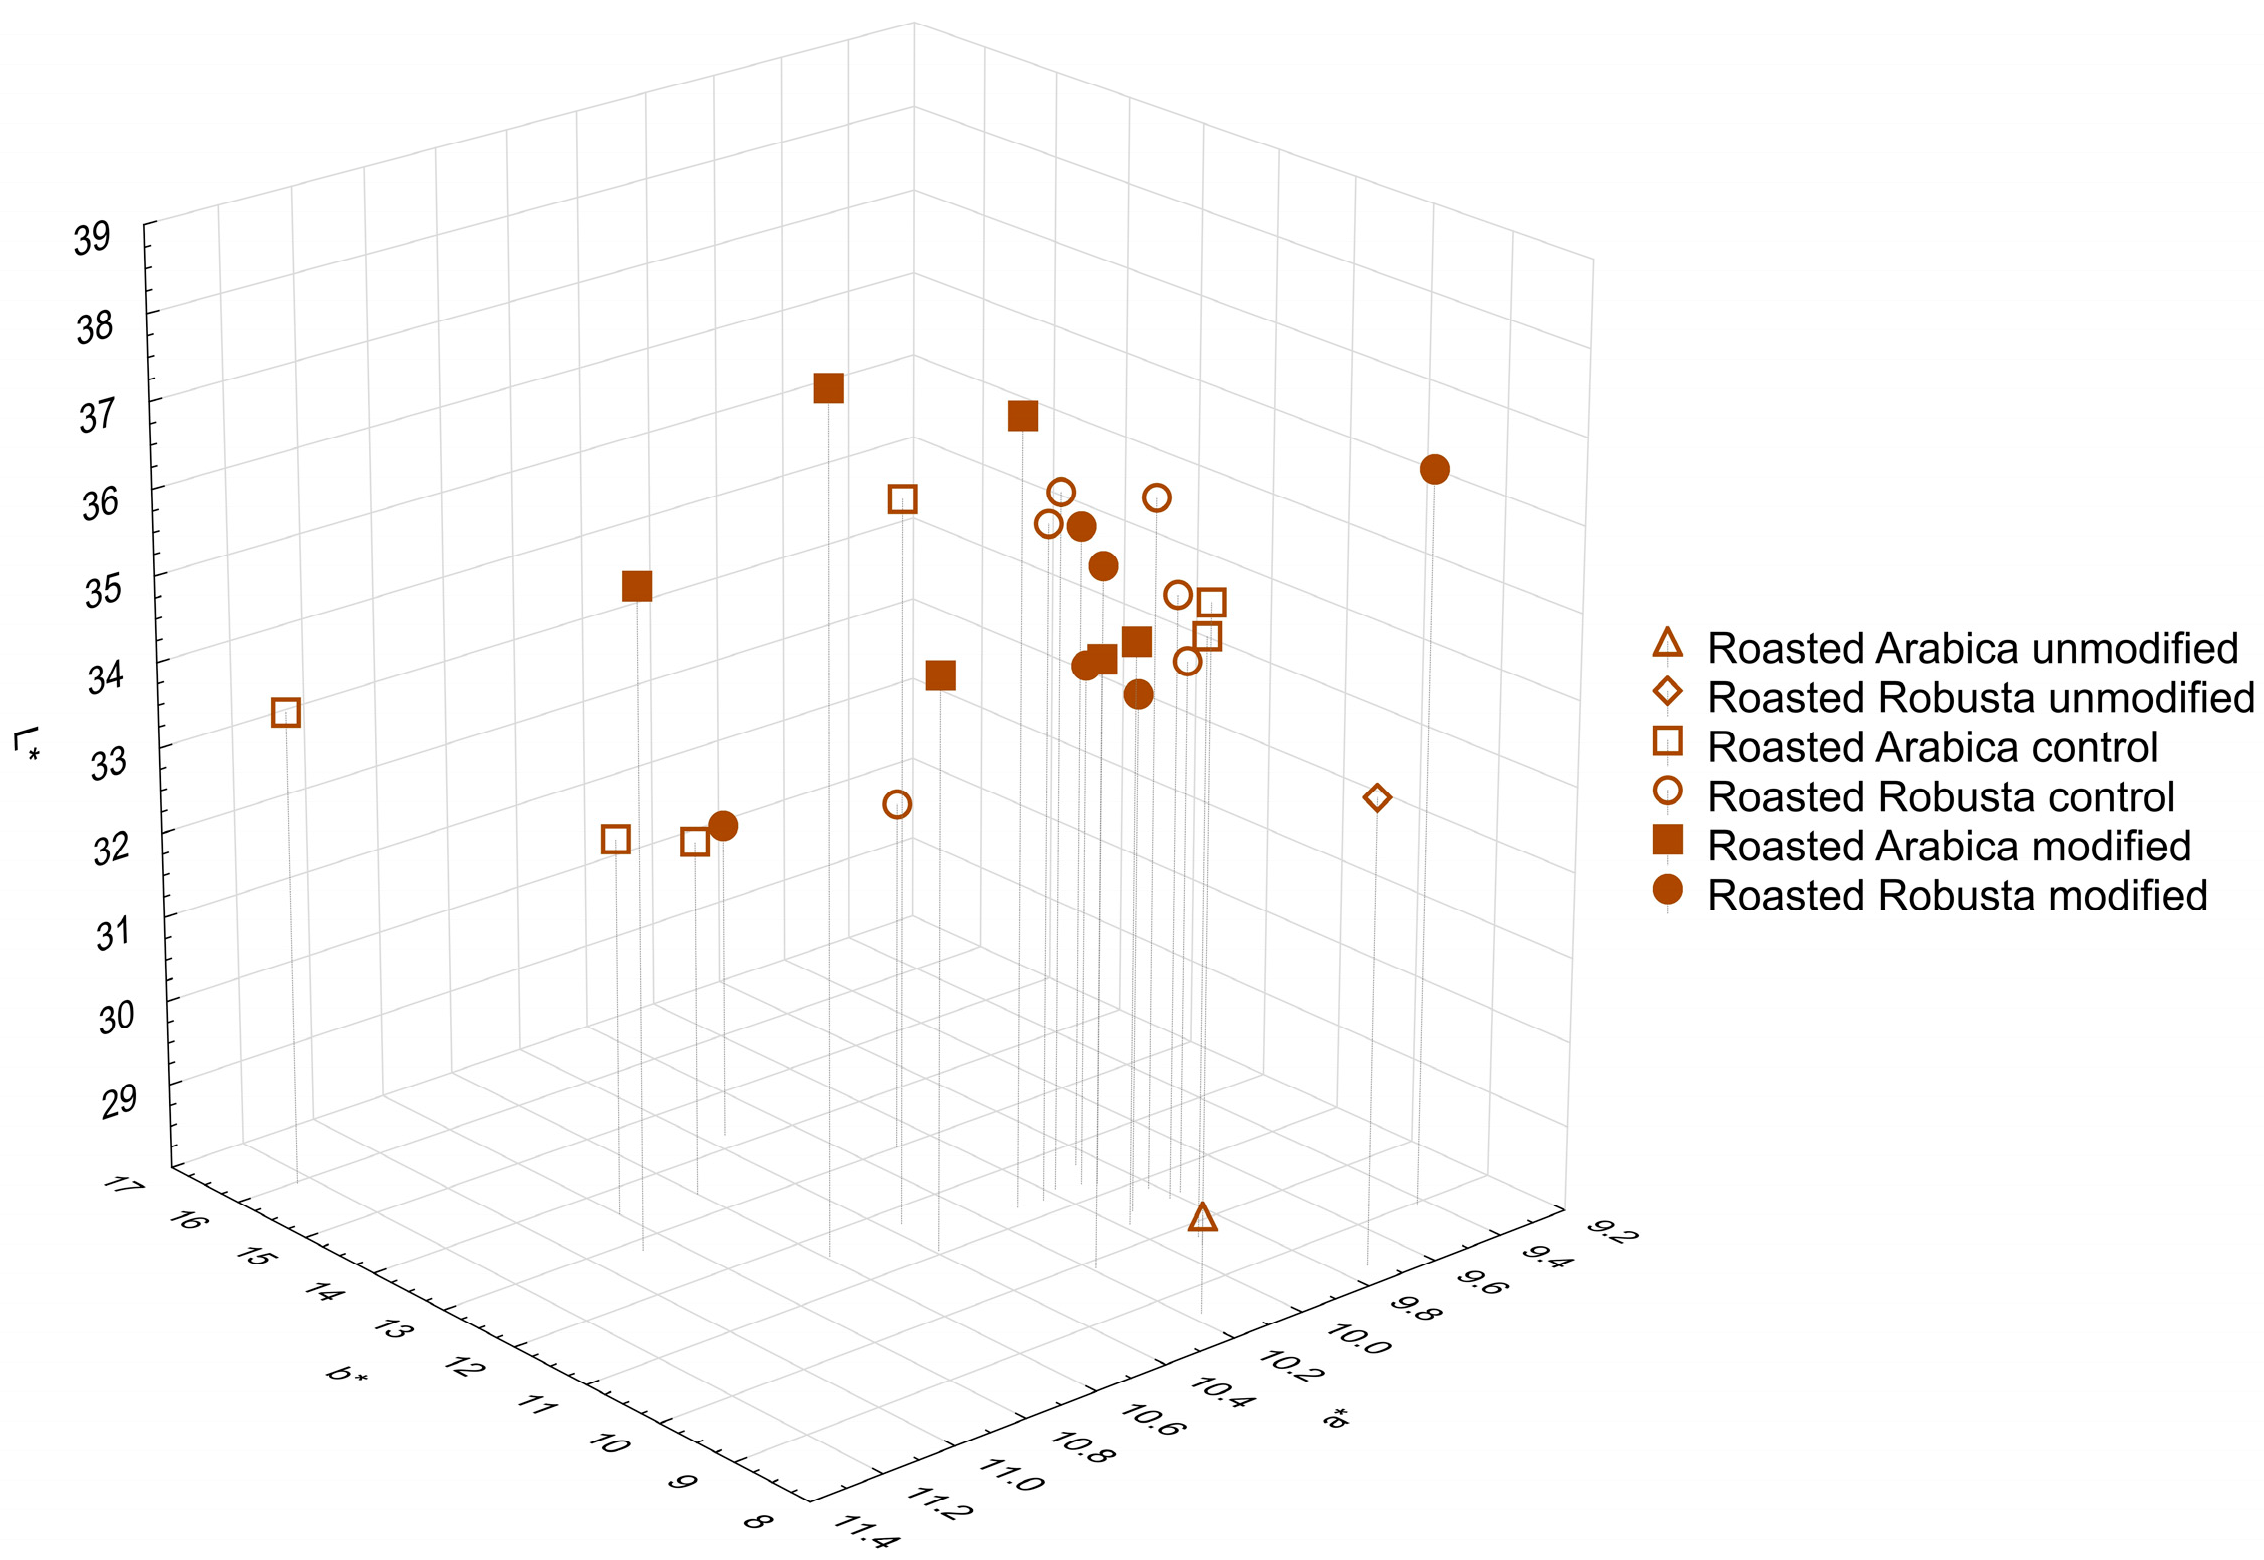
3.2. Color of the Beans

Green and roasted coffee beans were ground and subjected to color analysis in the CIELab system. Figure 1 presents a comparison of all results in the form of a 3D graph. In the case of green beans, results can be divided into three groups. Group 1 consists of untreated beans, in which color differed only in the proportion of red (+a*: 1.85 and 2.25 for untreated Arabica and Robusta beans, respectively). Group 2, with brightness (L*) similar to the first one, comprises all samples prepared with Arabica beans; group 3 includes all samples prepared using Robusta beans—their L* was slightly lower in relation to other groups. Comparing all modified samples (groups 2 and 3) with unmodified beans (group 1), it is observed that they generally had slightly higher values of red (+a*) and yellow (+b*). The color of samples after roasting (group 4) underwent significant changes: L* and b* values decreased, while a* values increased compared to green beans. Upon closer examination (Figure 2), it can be seen that, after roasting, only the color of untreated beans still clearly differed from the color of the other samples (untreated roasted Robusta beans exhibited higher L* value, lower a* value and comparable b* value in relation to Arabica). Numerical values of CIELab analysis are given in Supplementary Materials (Tables S1 and S2). It should be noted that all modified samples generally had a higher L* value, which may be due to lower Maillard reaction and caramelization ranges during the roasting process and, consequently, a lower amount of produced melanoidins [1].
Changes in the color of coffee beans due to enzymatic treatment observed in this study resemble those observed in the case of civet coffee. Marcone [23] analyzed coffee beans produced with the involvement of the Indonesian Palm civet and Ethiopian civet. Compared to untreated beans, digested beans exhibited lower brightness and higher values of the a* and b* parameters, possibly resulting from the action of enzymes and digestive juices on the surface of the material. In a study by Patria et al. [24], where the color of kopi luwak from the Gayo Highlands region was analyzed according to Specialty Coffee Association of America (SCAA) standards, the examined green beans were mainly described as yellow, in contrast to the greenish-green color reported earlier for beans produced in the same region using the semi-dry method. All of those changes in green coffee bean color might serve as an indicator of chemical transformations resulting from the biochemical processing. Currently, there is no information in the literature regarding the color of roasted kopi luwak beans. The changes observed in this study related to the roasting process—primarily, the reduction in brightness and increase in the share of red in the overall color of coffee beans—were consistent with previously published data [25,26,27]. Results of this study mostly align with previous reports on color changes in coffee during processing and indicate that additional processes (such as soaking or enzymatic treatment) may influence the range of changes in color parameters.

3.3. Carbohydrate and Protein Contents in Coffee Beans

In untreated green beans (Table 2), no presence of glucose was detected, and only trace amounts of fructose were found. The sucrose content in untreated Arabica beans was approximately 5.5 g/100 g dm, about 1.5 times higher than in untreated Robusta beans (3.5 g/100 g dm; Table 2). Despite different units, the data presented by Poisson et al. [1] regarding the content of sucrose in green beans are comparable. The significant amount of sucrose observed here and the small amount of simple sugars might be related to the processing method applied to coffee fruits after harvesting [2].
Regardless of the modification variant, small amounts of simple sugars were determined in controls and samples; sucrose content was lower than in untreated beans (Table 3). It is noteworthy that the amounts of these compounds in modified samples were the smallest among all examined samples. The quantity of each tested sugar decreased with longer modification time. This trend and the occurrence of only small amounts of simple sugars suggest structural changes and efficient extraction from examined material, which could be further enhanced by enzyme activity. A similar decreasing trend over time was previously observed and linked to the absorption of solutions and rehydration of the beans [2].
There are little literature data on carbohydrate content in digested coffee, such as kopi luwak. Muzaifa [28] reported that sucrose content in green beans of three kopi luwak coffees ranged from 5.09 to 7.70%, which was similar to the amount detected in Arabica beans.
From the presented data, it is evident that the applied amylolytic enzyme (α-amylase) had no significant impact on the glucose content in the modified beans. This could be associated with the specificity of its action and its concentration compared to other enzymes. The presence of chlorogenic acids in coffee beans could also influence the reduction of α-amylase activity [29].
After roasting, no simple carbohydrates were detected, and sucrose content could only be quantitatively determined in a few samples (Table 2 and Table 4). This indicates the loss of carbohydrates due to reactions occurring during roasting, where sugars serve as important substrates, e.g., caramelization and Maillard reactions. Melanoidins are produced during those processes—they are associated with roasted coffee color. Their lower production due to overall lower carbohydrate content in controls and modified samples could have resulted in higher L* values for roasted beans.
The content of soluble protein in unmodified samples was 14.9 g/100 g dm and 19.8 g/100 g dm for green Arabica and Robusta beans, respectively (Table 2). In the case of modified samples (18–21 g/100 g dm and 25–27 g/100 g dm for Arabica and Robusta samples, respectively), a significant increase in the content of this protein fraction was observed compared to their respective controls (3–6 g/100 g dm). Compared to untreated beans, the protein content in modified material increased by 30–40%, regardless of the enzymes used (Table 3).
These changes are the result of the use of proteolytic enzymes—pepsin and trypsin. Coffee proteins could have been released from the complex structures of the beans and part of the insoluble proteins could have undergone transformations under the enzymatic activity, increasing the pool of available soluble proteins. A similar effect of enzymes on increasing the amount of soluble proteins was confirmed in a study by Ribeiro et al. [30]. The extension of the modification time generally had a significant adverse effect on the determined content of soluble proteins.
In the case of untreated and enzyme-treated samples, a decrease in the content of soluble proteins after roasting was observed; generally, the values determined in those samples did not differ significantly from each other (Table 2 and Table 4). In controls, however, a slight increase in the content of this protein fraction was observed; it was more pronounced in Arabica beans. Observations for roasted beans were independent of the species of beans and the applied enzymes; most of the results showed a decreasing trend with the extension of the modification time (Table 4). Decrease in protein content after roasting could be again related to reactions occurring at high temperatures [1]. Protein compounds contribute to the activation of sucrose degradation processes and the formation of aromatic compounds, which are responsible for many aroma notes, e.g., earthy, nutty or honey-like [4,31]. On the other hand, proteins are considered to be responsible for the creation of compounds associated with bitterness of the final brew [11].
Previous studies on kopi luwak did not indicate a significant impact of the processing on the protein content in the beans. In the studies by Muzaifa et al. [31], the protein content in kopi luwak beans was comparable to that determined in Arabica beans. Robusta beans generally contain a higher amount of protein compounds. Nishiguchi et al. [32] pointed to a comparable protein content in samples of kopi luwak (C. canephora) and other popular coffees, Toraja Kalosi and Gayo Mountain (C. arabica), despite their different botanical origins. Those results suggest that coffee fruit processing often influences the protein content in the beans. Uliyandari et al. [11] demonstrated that, during in vitro fermentation of Robusta beans using the microflora from the palm civet’s digestive tract, the protein content decreased; the inoculum concentration was a significant factor. Combining the available literature data with the results presented in this study, it can be suggested that a higher amount of available soluble proteins in the beans, caused by the action of digestive enzymes, may contribute to better growth of gastrointestinal microorganisms, which might in turn maintain or slightly reduce the final protein content. Significant factors affecting the content of those compounds may also include the absorption process in the digestive tract, which may additionally reduce the amount of protein in the green beans. Moreover, changes in the composition of the protein fraction of coffee beans due to the action of digestive enzymes might affect antioxidant or antihypertensive activity and, thus, their overall biological activity; this might be of interest to consumers of green coffee extracts [30].

3.4. Caffeine, Total Polyphenol and 3-CQA Contents in Coffee Beans

The amount of caffeine in untreated green Robusta beans was 1 g/100 g dm, while, in Arabica beans, it was 0.7 g/100 g dm (Table 2). The caffeine content in samples and controls was generally lower than that found in unmodified beans. Controls exhibited significantly higher caffeine content compared to the respective enzyme-treated ones (Table 3). Loosening of the beans’ structure and the additional influence of the enzymes might have facilitated the extraction processes of the studied compound. The roasting process led to a reduction in caffeine content in controls and samples of both species; higher caffeine content in control beans was again observed. In the case of untreated beans, roasting resulted in a slight increase in caffeine amount (approximately 0.1 g/100 g dm regardless of bean type), which could be due to the loss of other bean components. In the case of modified green and roasted beans, a similar decreasing trend in caffeine content over time was observed (Table 2 and Table 4).
Data on caffeine content in kopi luwak are not straightforward. In the study of Muzaifa et al. [31], caffeine content in kopi luwak was approximately 1.2%, similar to the amount of caffeine determined in conventional Arabica beans from the same region. Nishiguchi et al. [32] determined the caffeine content in kopi luwak beans (C. canephora) to be 0.361% dm, which was slightly lower than that found in other popular coffee beans. The results presented by Chan and Garcia [33] showed a higher caffeine content in kopi luwak compared to conventional beans. Results presented in this study indicate a significant extraction of this compound during the digestion process. However, Chan and Garcia [33] suggested that the accumulation of this alkaloid from the diet and biosynthesis in the palm civet’s body might contribute to its higher content in green coffee beans. It is significant to note that several factors unrelated to the digestion process can affect caffeine content, which may explain the differences in data observed in the literature [24,25]. Additionally, caffeine may, to a small extent, contribute to the bitterness of the brew, so reducing its quantity may enhance the overall quality of the beverage [31]. Various changes in caffeine content observed in beans after roasting in this study were previously reported [25,34]. It is suggested that prolonged, more intense roasting might lead to a loss of caffeine due to dehydration or sublimation [31].
Total polyphenol content in untreated green Robusta beans (2.04 g/100 g dm) was approximately 15% higher than in Arabica beans (1.74 g/100 g dm). The amount of 3-CQA in unmodified green beans was comparable, although slightly higher in Arabica beans (Table 2). Results presented by Sacchetti et al. [27] and Jeszka-Skowron et al. [21] confirm a higher polyphenol content in Robusta beans. Authors also investigated the content of chlorogenic acid isomers in beans of various coffee species, demonstrating a higher overall amount in Robusta beans. The differences observed here suggest the influence of other factors, not only related to botanical origin, on the content of polyphenols in coffee beans.
When comparing untreated, control and modified samples of respective coffee species, it is noteworthy that the lowest total polyphenol and 3-CQA contents were observed in the modified samples. Robusta controls exhibited significantly higher total polyphenol content and slightly higher 3-CQA content compared to untreated beans. In the case of Arabica beans, both control and modified samples showed lower total polyphenol and 3-CQA contents than those determined in unprocessed green beans of this species. In most samples, a negative impact of the extended modification time on the content of the investigated active compounds was observed. Only in Arabica and Robusta samples modified with pepsin, a slight increasing trend was noted, mainly concerning changes in 3-CQA content (Table 2 and Table 3).
The roasting process contributed to changes in the total polyphenol content in samples—in untreated Arabica beans, this amount slightly increased, while, in Robusta beans, a decrease in polyphenol content was observed. In both cases, the content of 3-CQA significantly decreased (Table 2). The apparent increase in total polyphenol content in Arabica could be partially explained by the presence of interfering compounds formed during roasting. Regardless of the species, in all modified sample beans, the amounts of total polyphenols and 3-CQA decreased after roasting due to their transformations and degradation at high temperatures—the decrease in polyphenol content was approximately 20%, and the decrease in 3-CQA content was at least 50% compared to their content in corresponding unroasted green beans. The amounts determined in modified samples were generally lower than in controls and the time impact corresponded with that observed in green beans (Table 4). Taking into consideration both green and roasted beans, it can be stated that the changes in total polyphenol content and in their essential ingredient, 3-CQA, are not the same.
There are limited data regarding the content of chlorogenic acid isomers in coffee beans subjected to digestion. Nishiguchi et al. [32] reported that kopi luwak contained a higher amount of chlorogenic acid compared to other samples of popular conventional coffees. This difference could be associated not only with different processing methods, but also with the different botanical and geographical origins of the beans. A precise comparison of the data with the values obtained in this study is not entirely possible due to the lack of information about the material’s degree of processing (green/roasted). Other researchers showed that the chlorogenic acid content in green kopi luwak beans was around 3.7%, while, in roasted beans, it was only approximately 0.88%; these values fall below the range of this compound group for conventional beans [6,31]. Similar to the caffeine content, the quantity of polyphenols and chlorogenic acids is influenced by numerous factors unrelated to the coffee fruit processing itself, which might account for differences in the obtained results. Muzaifa et al. [31] indicated a lower content of chlorogenic acids in the investigated material, consistent with the observations reported in this study. It is also possible that processing of whole coffee fruits causes a delay in the extraction processes of the investigated compounds from the bean itself. Additionally, the reduction in the amount of chlorogenic acids can be a beneficial phenomenon—chlorogenic acids and compounds created from their breakdown may contribute to the darker color of beans and increased bitterness and astringency of the brew [6,31].
The impact of roasting on the total polyphenol and 3-CQA contents presented in this study was in line with data presented in the literature [27,35]. Loss of phenolic compounds, including chlorogenic acids, is mainly attributed to their thermolability. It is also possible that some chlorogenic acids were incorporated in melanoidins’ structure, which also reduced their content in coffee [36].

4. Conclusions

The aim of this study was to explore the impact of animal digestive enzymes on compositional changes in both green and roasted coffee beans rather than the reconstruction of the natural process of kopi luwak production. However, results obtained in this article might prove useful in further understanding of this unique process.
Usage of animal digestive enzymes resulted in three notable changes in green coffee: the change in color; the increase in soluble protein content and a significant decrease in amounts of other analyzed components. Proteolytic enzymes (pepsin, trypsin) were responsible for the observed rise in concentration of soluble proteins in green coffee, while the amylolytic enzyme (α-amylase) did not affect its chemical composition. Loss of other coffee constituents was most probably a result of the enhanced extraction during material preparation and enzymatic modification. Bearing those observations in mind, we came to the conclusion that the most favorable time of modification would be the shortest one (3 h), where the changes were already significant, but not too marked.
In the case of roasted beans, where the heating process significantly altered the composition of coffee, the effect of enzymes was miniscule compared to the effect of extraction itself. Moreover, the difference in proportions of the tested compounds in both types of modified coffee indicate that the changes resulting from enzyme activity were not limited to the coffee constituents tested in this study.
To better understand the significance of enzymatic treatment of coffee, further research should diversify the plant material used, explore additional factors that influence the modification and further examine changes in proteins and their effect on antioxidant properties, aroma composition and sensory characteristics.

Supplementary Materials

The following supporting information can be downloaded at: https://www.mdpi.com/article/10.3390/app14062484/s1, Table S1: Numerical data representing color of untreated coffee beans as measured in the CIELab system; Table S2: Numerical data representing coffee beans color of controls and modified samples as measured in the CIELab system.

Author Contributions

Conceptualization, P.P., R.W., B.D. and E.M.; methodology, P.P., R.W., B.D. and E.M.; software—validation, R.W.; formal analysis, P.P.; investigation, P.P.; resources, P.P., R.W., B.D. and E.M.; data curation, P.P.; writing—original draft preparation, P.P.; writing—review and editing, P.P., R.W., B.D. and E.M.; visualization, P.P.; supervision, R.W., B.D. and E.M.; project administration, R.W.; funding acquisition, R.W. All authors have read and agreed to the published version of the manuscript.

Funding

This research received no external funding.

Institutional Review Board Statement

Not applicable.

Informed Consent Statement

Not applicable.

Data Availability Statement

Data are contained within the article and Supplementary Materials.

Conflicts of Interest

The authors declare no conflicts of interest.

References

  1. Poisson, L.; Blank, I.; Dunkel, A.; Hofmann, T. The Chemistry of Roasting—Decoding Flavor Formation. In The Craft and Science of Coffee; Folmer, B., Ed.; Academic Press: London, UK, 2017; pp. 273–310. ISBN 978-0-12-803520-7. [Google Scholar]
  2. Knopp, S.; Bytof, G.; Selmar, D. Influence of Processing on the Content of Sugars in Green Arabica Coffee Beans. Eur. Food Res. Technol. 2006, 223, 195–201. [Google Scholar] [CrossRef]
  3. Gebrekidan, M.; Redi-Abshiro, M.; Chandravanshi, B.S.; Ele, E.; Mohammed, A.M.; Mamo, H. Influence of Altitudes of Coffee Plants on the Alkaloids Contents of Green Coffee Beans. Chem. Int. 2019, 5, 247–257. [Google Scholar] [CrossRef]
  4. Bressani, A.P.P.; Martinez, S.J.; Vilela, L.D.F.; Dias, D.R.; Schwan, R.F. Coffee Protein Profiles during Fermentation Using Different Yeast Inoculation Methods. Pesq. Agropec. Bras. 2020, 55, e01159. [Google Scholar] [CrossRef]
  5. Fitri; Tawali, A.B.; Laga, A. Luwak Coffee in Vitro Fermentation: Literature Review. IOP Conf. Ser. Earth Environ. Sci. 2019, 230, 012096. [Google Scholar] [CrossRef]
  6. Muzaifa, M.; Hasni, D.; Patria, A.; Febriani; Abubakar, A. Sensory and Microbial Characteristics of Civet Coffee. Int. J. Adv. Sci. Eng. Inf. Technol. 2018, 8, 165. [Google Scholar] [CrossRef]
  7. Suhandono, S.; Setiadi, H.; Kristianti, T.; Kusuma, A.B.; Wedaringtyas, A.W.; Djajadi, D.T.; Aryantha, I.N.P. Diversity of Culturable Bacterial in Various Parts of Luwak’s (Paradoxurus hermaprodithus javanica) Gastrointestinal Tract. Microbiol. Indones. 2016, 10, 65–70. [Google Scholar] [CrossRef]
  8. Watanabe, H.; Ng, C.H.; Limviphuvadh, V.; Suzuki, S.; Yamada, T. Gluconobacter Dominates the Gut Microbiome of the Asian Palm Civet Paradoxurus hermaphroditus That Produces Kopi Luwak. PeerJ 2020, 8, e9579. [Google Scholar] [CrossRef]
  9. Hadipernata, M.; Nugraha, S. Process Technology of Luwak Coffee through Bioreactor Utilization. IOP Conf. Ser. Earth Environ. Sci. 2018, 102, 012092. [Google Scholar] [CrossRef]
  10. Muzaifa, M.; Hasni, D.; Febriani; Patria, A.; Abubakar, A. Fermentation of Coffee Beans with Inoculation of Bacillus subtilis and Its Impact on Coffee Sensory Quality. IOP Conf. Ser. Earth Environ. Sci. 2019, 364, 012010. [Google Scholar] [CrossRef]
  11. Uliyandari, M.; Sumpono, S.; Muslim, C. The Effect of Civet Coffee Isolate and Time Fermentation on Robusta Coffee Protein Profiles. J. Phys. Conf. Ser. 2021, 1731, 012019. [Google Scholar] [CrossRef]
  12. Wang, C.; Sun, J.; Lassabliere, B.; Yu, B.; Zhao, F.; Zhao, F.; Chen, Y.; Liu, S.Q. Potential of Lactic Acid Bacteria to Modulate Coffee Volatiles and Effect of Glucose Supplementation: Fermentation of Green Coffee Beans and Impact of Coffee Roasting. J. Sci. Food Agric. 2019, 99, 409–420. [Google Scholar] [CrossRef]
  13. Afriliana, A.; Harada, H.; Khotijah, P.Q.; Jayus; Giyarto. Fermented Technology of Robusta Coffee Beans (Canephora Coffee) With Kefir Milk to Produce Specialty Coffee. In Proceedings of the 4th International Conference on Food, Agriculture and Natural Resources (FANRes 2018), Yogyakarta, Indonesia, 12–14 September 2018; Atlantis Press: Yogyakarta, Indonesia, 2018. [Google Scholar]
  14. Figueroa Campos, G.A.; Sagu, S.T.; Saravia Celis, P.; Rawel, H.M. Comparison of Batch and Continuous Wet-Processing of Coffee: Changes in the Main Compounds in Beans, By-Products and Wastewater. Foods 2020, 9, 1135. [Google Scholar] [CrossRef] [PubMed]
  15. Soyseven, M.; Sezgin, B.; Arli, G. A Novel, Rapid and Robust HPLC-ELSD Method for Simultaneous Determination of Fructose, Glucose and Sucrose in Various Food Samples: Method Development and Validation. J. Food Compost. Anal. 2022, 107, 104400. [Google Scholar] [CrossRef]
  16. Lowry, O.H.; Rosebrough, N.J.; Farr, A.L.; Randall, R.J. Protein Measurement with the Folin Phenol Reagent. J. Biol. Chem. 1951, 193, 265–275. [Google Scholar] [CrossRef] [PubMed]
  17. Wołosiak, R.; Pakosz, P.; Drużyńska, B.; Janowicz, M. Antioxidant Activity of Coffee Components Influenced by Roast Degree and Preparation Method. Appl. Sci. 2023, 13, 2057. [Google Scholar] [CrossRef]
  18. Wang, J.; Zhao, Y.-M.; Zhang, M.-L.; Shi, Q.-W. Simultaneous Determination of Chlorogenic Acid, Caffeic Acid, Alantolactone and Isoalantolactone in Inula helenium by HPLC. J. Chromatogr. Sci. 2015, 53, 526–530. [Google Scholar] [CrossRef]
  19. R Core Team. R: A Language and Environment for Statistical Computing; R Foundation for Statistical Computing: Vienna, Austria, 2023; Available online: https://www.R-project.org/ (accessed on 1 December 2023).
  20. Stanforth, K.J.; Wilcox, M.D.; Chater, P.I.; Brownlee, I.A.; Zakhour, M.I.; Banecki, K.M.R.M.; Pearson, J.P. Pepsin Properties, Structure, and Its Accurate Measurement: A Narrative Review. Ann. Esophagus 2022, 5, 31. [Google Scholar] [CrossRef]
  21. Jeszka-Skowron, M.; Sentkowska, A.; Pyrzyńska, K.; De Peña, M.P. Chlorogenic Acids, Caffeine Content and Antioxidant Properties of Green Coffee Extracts: Influence of Green Coffee Bean Preparation. Eur. Food Res. Technol. 2016, 242, 1403–1409. [Google Scholar] [CrossRef]
  22. Araújo, C.D.S.; Macedo, L.L.; Vimercati, W.C.; Ferreira, A.; Prezotti, L.C.; Saraiva, S.H. Determination of pH and Acidity in Green Coffee Using Near-infrared Spectroscopy and Multivariate Regression. J. Sci. Food Agric. 2020, 100, 2488–2493. [Google Scholar] [CrossRef]
  23. Marcone, M.F. Composition and Properties of Indonesian Palm Civet Coffee (Kopi Luwak) and Ethiopian Civet Coffee. Food Res. Int. 2004, 37, 901–912. [Google Scholar] [CrossRef]
  24. Patria, A.; Abubakar, A.; Febriani; Muzaifa, M. Physicochemical and Sensory Characteristics of Luwak Coffee from Bener Meriah, Aceh-Indonesia. IOP Conf. Ser. Earth Environ. Sci. 2018, 196, 012010. [Google Scholar] [CrossRef]
  25. Tsai, C.-F.; Jioe, I.P.J. The Analysis of Chlorogenic Acid and Caffeine Content and Its Correlation with Coffee Bean Color under Different Roasting Degree and Sources of Coffee (Coffea Arabica Typica). Processes 2021, 9, 2040. [Google Scholar] [CrossRef]
  26. Yeager, S.E.; Batali, M.E.; Lim, L.X.; Liang, J.; Han, J.; Thompson, A.N.; Guinard, J.; Ristenpart, W.D. Roast Level and Brew Temperature Significantly Affect the Color of Brewed Coffee. J. Food Sci. 2022, 87, 1837–1850. [Google Scholar] [CrossRef] [PubMed]
  27. Sacchetti, G.; Di Mattia, C.; Pittia, P.; Mastrocola, D. Effect of Roasting Degree, Equivalent Thermal Effect and Coffee Type on the Radical Scavenging Activity of Coffee Brews and Their Phenolic Fraction. J. Food Eng. 2009, 90, 74–80. [Google Scholar] [CrossRef]
  28. Muzaifa, M. Exploration Study of Kopi Luwak: Chemica Compounds and Sensory Profile. Int. J. Curr. Innov. Res. 2018, 4, 1273–1276. [Google Scholar]
  29. Narita, Y.; Inouye, K. Inhibitory Effects of Chlorogenic Acids from Green Coffee Beans and Cinnamate Derivatives on the Activity of Porcine Pancreas α-Amylase Isozyme. Food Chem. 2011, 127, 1532–1539. [Google Scholar] [CrossRef]
  30. Ribeiro, E.; Rocha, T.D.S.; Prudencio, S.H. Potential of Green and Roasted Coffee Beans and Spent Coffee Grounds to Provide Bioactive Peptides. Food Chem. 2021, 348, 129061. [Google Scholar] [CrossRef] [PubMed]
  31. Muzaifa, M.; Hasni, D.; Febriani; Patria, A.; Abubakar, A. Chemical Composition of Green and Roasted Coffee Bean of Gayo Arabica Civet Coffee (Kopi Luwak). IOP Conf. Ser. Earth Environ. Sci. 2020, 425, 012001. [Google Scholar] [CrossRef]
  32. Nishiguchi, Y.; Goromaru-shinkai, M.; Kuroda, J.; Kiuchi, S.; Ihara, H. Estimation of Protein, Total Polyphenol, Chlorogenic Acid, Caffeine, and Caffeic Acid Contents in Indonesian Palm Civet Coffee (Kopi Luwak). Int. J. Anal. Bio-Sci. 2017, 5, 53–56. [Google Scholar]
  33. Chan, S.; Garcia, E. Comparative Physicochemical Analyses of Regular and Civet Coffee. Manila J. Sci. 2011, 7, 19–23. [Google Scholar]
  34. Souza, L.D.S.D.; Carrero Horta, I.P.; De Souza Rosa, L.; Barbosa Lima, L.G.; Santos Da Rosa, J.; Montenegro, J.; Da Silva Santos, L.; Nana De Castro, R.B.; Freitas-Silva, O.; Teodoro, A.J. Effect of the Roasting Levels of Coffea Arabica L. Extracts on Their Potential Antioxidant Capacity and Antiproliferative Activity in Human Prostate Cancer Cells. RSC Adv. 2020, 10, 30115–30126. [Google Scholar] [CrossRef] [PubMed]
  35. Muñoz, A.E.; Hernández, S.S.; Tolosa, A.R.; Burillo, S.P.; Olalla Herrera, M. Evaluation of Differences in the Antioxidant Capacity and Phenolic Compounds of Green and Roasted Coffee and Their Relationship with Sensory Properties. LWT 2020, 128, 109457. [Google Scholar] [CrossRef]
  36. Rao, N.Z.; Fuller, M.; Grim, M.D. Physiochemical Characteristics of Hot and Cold Brew Coffee Chemistry: The Effects of Roast Level and Brewing Temperature on Compound Extraction. Foods 2020, 9, 902. [Google Scholar] [CrossRef] [PubMed]
Figure 1. Color of all coffee samples as measured in the CIELab system. Group 1 consists of untreated beans, group 2 contains controls and modified samples of Arabica beans and group 3 contains controls and modified Robusta beans. Group 4 encompasses values for roasted beans of all variants.
Applsci 14 02484 g001
Figure 2. Color of roasted coffee samples as measured in the CIELab system.
Applsci 14 02484 g002
Table 1. pH values of samples during enzymatic modification.
Modification Time [h]/SamplePepsinTrypsin and α-Amylase
ControlModifiedControlModified
Arabica beans
04.92 ± 0.17 a4.35 ± 0.25 a6.95 ± 0.01 a6.97 ± 0.04 a
35.64 ± 0.04 b5.00 ± 0.01 b6.76 ± 0.01 b6.73 ± 0.03 b
65.66 ± 0.02 b5.54 ± 0.09 b6.71 ± 0.02 b6.81 ± 0.02 b
125.78 ± 0.03 b5.61 ± 0.02 b6.57 ± 0.02 b6.64 ± 0.02 c
Robusta beans
04.66 ± 0.11 a4.29 ± 0.13 a6.99 ± 0.05 a6.98 ± 0.06 a
35.59 ± 0.08 b5.2 ± 0.03 b6.89 ± 0.06 b6.75 ± 0.02 c
65.64 ± 0.09 b5.28 ± 0.1 b6.83 ± 0.08 bc6.88 ± 0.04 b
125.64 ± 0.04 b5.54 ± 0.02 b6.74 ± 0.02 c6.72 ± 0.02 c
All results expressed as mean value ± standard deviation. In columns, different letters indicate statistically significant differences between results.
Table 2. Composition of green and roasted untreated Arabica and Robusta coffee beans.
Parameter [g/100 g dm]/SampleGreen BeansRoasted Beans
ArabicaRobustaArabicaRobusta
Fructosetracestracesn.d.n.d.
Glucosen.d.n.d.n.d.n.d.
Sucrose5.47 ± 0.15 a3.52 ± 0.07 bn.d.n.d.
Proteins14.91 ± 0.75 b19.84 ± 0.18 a12.78 ± 0.83 b18.87 ± 0.19 a
Caffeine0.76 ± 0.02 b1.07 ± 0.02 a0.82 ± 0.02 b1.11 ± 0.05 a
Phenols1.74 ± 0.072.04 ± 0.041.79 ± 0.031.81 ± 0.14
3-CQA1.28 ± 0.04 a1.19 ± 0.03 b0.50 ± 0.020.46 ± 0.07
All results expressed as mean value ± standard deviation; n.d.—not detected. Lowercase letters indicate statistical differences between Arabica and Robusta beans in green/roasted groups.
Table 3. Composition of green Arabica and Robusta samples.
Parameter [g/100 g dm]/SamplePepsinTrypsin and α-Amylase
36123612
ControlModifiedControlModifiedControlModifiedControlModifiedControlModifiedControlModified
Green Arabica beans
Fructose0.16 ± 0.01 a*0.13 ± 0.01 *0.15 ± 0.002 b*0.07 ± 0.002 *0.13 ± 0.01 b*0.07 ± 0.003 *0.14 ± 0.0050.14 ± 0.010.13 ± 0.01 *0.08 ± 0.003 *0.13 ± 0.01 *0.07 ± 0.004 *
Glucose0.15 ± 0.01 a0.13 ± 0.010.14 ± 0.003 a*0.07 ± 0.01 *0.12 ± 0.002 b*0.06 ± 0.003 *0.14 ± 0.01 a0.14 ± 0.010.13 ± 0.003 a0.07 ± 0.0030.09 ± 0.004 btraces
Sucrose4.24 ± 0.09 a*2.99 ± 0.75 *3.70 ± 0.05 b*2.46 ± 0.06 *2.70 ± 0.12 c*2.46 ± 0.08 *3.73 ± 0.133.78 ± 0.313.84 ± 0.12 *2.66 ± 0.04 *2.61 ± 0.02 *2.35 ± 0.08 *
Proteins4.19 ± 0.86 *21.39 ± 0.45 A*5.51 ± 1.00 *20.00 ± 1.23 AB*4.01 ± 0.84 *18.97 ± 0.37 B*6.21 ± 0.71 a*20.70 ± 0.41 A*4.69 ± 0.71 ab*19.20 ± 0.21 B*2.94 ± 0.73 b*18.72 ± 0.35 B*
Caffeine0.70 ± 0 *0.62 ± 0.06 *0.67 ± 0.001 *0.54 ± 0.01 *0.58 ± 0.001 *0.53 ± 0.04 *0.66 ± 0.001 *0.71 ± 0.03 *0.71 ± 0.001 *0.60 ± 0.01 *0.60 ± 0.001 *0.53 ± 0.01 *
Phenols1.60 ± 0.07 *1.29 ± 0.18 *1.62 ± 0.03 *1.26 ± 0.08 *1.27 ± 0.051.13 ± 0.021.49 ± 0.04 *1.74 ± 0.13 A*1.82 ± 0.07 *1.53 ± 0.01 AB*1.52 ± 0.01 *1.37 ± 0.06 B*
3-CQA1.24 ± 0.09 *0.93 ± 0.08 *1.22 ± 0.08 *1.00 ± 0.03 *1.17 ± 0.06 *1.06 ± 0.03 *1.11 ± 0.01 b1.09 ± 0.04 A1.17 ± 0.02 a*1.07 ± 0.03 AB*1.11 ± 0.02 b*1.01 ± 0.03 B*
Green Robusta beans
Fructose0.17 ± 0.01 *0.13 ± 0.01 *0.16 ± 0.01 *0.08 ± 0.004 *0.14 ± 0.01 *0.08 ± 0.004 *0.16 ± 0.01 a*0.13 ± 0.004 a*0.14 ± 0.01 ab*0.07 ± 0.02 b*0.13 ± 0.01 b*0.07 ± 0.01 b*
Glucose0.14 ± 0.0030.13 ± 0.010.15 ± 0.02 *0.07 ± 0.002 *0.13 ± 0.01 *0.07 ± 0.004 *0.15 ± 0.003 a*0.14 ± 0.0004 *0.13 ± 0.001 b*0.08 ± 0.003 *0.12 ± 0.01 c*0.06 ± 0.004 *
Sucrose2.53 ± 0.05 a*1.93 ± 0.06 *2.26 ± 0.04 a*1.90 ± 0.132.35 ± 0.17 b*2.05 ± 0.043.54 ± 0.04 *2.23 ± 0.0032.36 ± 0.062.23 ± 0.152.19 ± 0.042.01 ± 0.22
Proteins13.51 ± 0.73 a*26.91 ± 0.45 A*11.57 ± 0.86 ab*26.27 ± 0.96 AB*9.78 ± 0.80 b*25.45 ± 0.11 B*10.42 ± 0.98 b*27.47 ± 0.59 A*12.75 ± 0.79 a*25.70 ± 0.85 B*11.08 ± 0.16 ab*25.32 ± 0.45 B*
Caffeine1.17 ± 0.004 a*0.93 ± 0.03 A*1.15 ± 0.003 b*0.97 ± 0.05 AB*1.11 ± 0.003 c*1.04 ± 0.02 B*1.26 ± 0.004 *1.03 ± 0.02 *1.14 ± 0.001 *1.11 ± 0.02 *1.11 ± 0.003 *1.06 ± 0.05 *
Phenols2.61 ± 0.03 *1.50 ± 0.08 *2.39 ± 0.12 *1.68 ± 0.18 *2.43 ± 0.02 *1.81 ± 0.01 *2.61 ± 0.08 a*1.83 ± 0.05 C*2.48 ± 0.06 b*2.27 ± 0.08 A*2.07 ± 0.04 c2.09 ± 0.12 B
3-CQA1.19 ± 0.02 *0.89 ± 0.02 C*1.21 ± 0.02 *1.01 ± 0.07 B*1.24 ± 0.08 *1.13 ± 0.01 A*1.35 ± 0.01 a*1.00 ± 0.01 B*1.22 ± 0.01 b*1.15 ± 0.04 A*1.16 ± 0.01 c*1.13 ± 0.07 A*
All results expressed as mean value ± standard deviation. Lowercase letters indicate significant differences between control samples at different modification times. Uppercase letters indicate significant differences between modified samples at different modification times. * indicates significant difference between control and modified samples at the same modification time.
Table 4. Composition of roasted Arabica and Robusta samples.
Parameter [g/100 g dm]/SamplePepsinTrypsin and α-Amylase
36123612
ControlModifiedControlModifiedControlModifiedControlModifiedControlModifiedControlModified
Green Arabica beans
Fructosen.d.n.d.n.d.n.d.n.d.n.d.n.d.n.d.n.d.n.d.n.d.n.d.
Glucosen.d.n.d.n.d.n.d.n.d.n.d.n.d.n.d.n.d.n.d.n.d.n.d.
Sucrosetracestracestracestracestracestracestraces0.12 ± 0.01tracestracestracestraces
Proteins6.55 ± 0.18 b*14.11 ± 0.10 A*7.62 ± 0.18 a*13.24 ± 0.13 B*4.30 ± 0.03 c*12.05 ± 0.56 C*8.45 ± 0.07 *14.70 ± 0.09 A*7.69 ± 0.05 *13.42 ± 0.44 B*6.05 ± 0.03 *12.32 ± 0.35 C*
Caffeine0.53 ± 0.0010.52 ± 0.010.56 ± 0.001 *0.39 ± 0.01 *0.44 ± 0.001 *0.33 ± 0.003 *0.63 ± 0.002 *0.45 ± 0.04 A*0.55 ± 0.001 *0.42 ± 0.004 AB*0.50 ± 0.001 *0.37 ± 0.01 B*
Phenols1.29 ± 0.05 b*1.10 ± 0.06 A*1.42 ± 0.06 a*0.96 ± 0.04 B*1.21 ± 0.04 b*0.90 ± 0.07 B*1.64 ± 0.05 a*1.01 ± 0.06 *1.41 ± 0.02 b*0.98 ± 0.04 *1.34 ± 0.05 b*0.94 ± 0.01 *
3-CQA0.47 ± 0.01 b0.43 ± 0.001 A0.54 ± 0.01 a*0.37 ± 0.03 B*0.48 ± 0.01 b*0.38 ± 0.02 A*0.49 ± 0.06 *0.38 ± 0.02 *0.48 ± 0.06 *0.39 ± 0.02 *0.47 ± 0.06 *0.36 ± 0.02 *
Green Robusta beans
Fructosen.d.n.d.n.d.n.d.n.d.n.d.n.d.n.d.n.d.n.d.n.d.n.d.
Glucosen.d.n.d.n.d.n.d.n.d.n.d.n.d.n.d.n.d.n.d.n.d.n.d.
Sucrosetracestracestraces0.09 ± 0.0040.10 ± 0.010.09 ± 0.01traces0.10 ± 0.01traces0.12 ± 0.01traces0.10 ± 0.01
Proteins13.44 ± 0.17 *18.81 ± 0.45 *13.15 ± 0.17 *19.14 ± 0.48 *12.86 ± 0.32 *18.75 ± 0.46 *13.28 ± 0.86 *19.33 ± 0.16 B*13.18 ± 0.33 *20.25 ± 0.23 A*12.46 ± 0.24 *19.09 ± 0.51 B*
Caffeine0.93 ± 0.01 *0.77 ± 0.03 A*0.84 ± 0.01 *0.67 ± 0.04 B*0.82 ± 0.005 *0.58 ± 0.03 C*0.95 ± 0.01 a*0.79 ± 0.06 A*0.87 ± 0.01 b*0.76 ± 0.04 AB*0.77 ± 0.005 c*0.64 ± 0.05 B*
Phenols1.79 ± 0.03 a*1.22 ± 0.11 *1.54 ± 0.08 b*1.13 ± 0.11 *1.51 ± 0.004 b*1.05 ± 0.02 *1.66 ± 0.03 *1.28 ± 0.11 *1.60 ± 0.03 *1.30 ± 0.05 *1.40 ± 0.03 *1.17 ± 0.10 *
3-CQA0.60 ± 0.02 a0.56 ± 0.010.55 ± 0.01 b0.46 ± 0.030.51 ± 0.08 b*0.41 ± 0.01 *0.52 ± 0.080.43 ± 0.01 B0.55 ± 0.02 *0.49 ± 0.01 A*0.51 ± 0.010.42 ± 0.02 B
All results expressed as mean value ± standard deviation; n.d.—not detected. Lowercase letters indicate significant differences between control samples at different modification times. Uppercase letters indicate significant differences between modified samples at different modification times. * indicates significant difference between control and modified samples at the same modification time.
Disclaimer/Publisher’s Note: The statements, opinions and data contained in all publications are solely those of the individual author(s) and contributor(s) and not of MDPI and/or the editor(s). MDPI and/or the editor(s) disclaim responsibility for any injury to people or property resulting from any ideas, methods, instructions or products referred to in the content.

