Article

Impact Fracture Resistance of Fused Deposition Models from Polylactic Acid with Respect to Infill Density and Sample Thickness

University of Zagreb Faculty of Graphic Arts, 10000 Zagreb, Croatia
*
Author to whom correspondence should be addressed.
Appl. Sci. 2024, 14(5), 2035; https://doi.org/10.3390/app14052035
Submission received: 26 January 2024 / Revised: 23 February 2024 / Accepted: 27 February 2024 / Published: 29 February 2024

Abstract

:
Fused deposition modeling (FDM) is widely employed in prototyping due to its cost-effectiveness, speed, and ability to produce detailed and functional prototypes using a variety of materials. Simultaneously, consideration for the use of biodegradable polymers and a general reduction in their usage while enhancing the production of polymer-based products is at the forefront of sustainable practices and environmental consciousness. This study investigates the impact fracture resistance of FDM models fabricated from Polylactic Acid (PLA), examining the influence of infill density (50% and 100% infill) and sample thickness (2 mm, 3 mm, and 5 mm). Optical microscopy, FTIR spectroscopy, and SEM analysis of PLA filament and fractured FDM PLA surfaces in impacted samples were conducted to ascertain the influence of process parameters on impact damage and failure mechanisms. The results indicate that a 100% infill profile with a 2 mm thickness should be avoided due to unpredictable behavior under impact. Conversely, a 5 mm thickness demonstrates significantly higher durability in comparison to a 50% infill profile. Optimal impact strength is observed in samples with a 3 mm thickness, suggesting potential material savings with 50% infill without compromising mechanical properties. The findings contribute valuable insights for refining FDM parameters and advancing the understanding of material behaviors in sustainable manufacturing practices.

1. Introduction

The production of structural elements can be achieved through various methods such as turning, casting, and milling. In recent years, additive manufacturing (AM) or three-dimensional (3D) printing has emerged as an alternative to these traditional methods. The choice of manufacturing technology depends on the type of pattern desired, the quantity being produced, time constraints, available resources, and other factors. If a high-quality pattern is required, particularly for industrial purposes, turning, casting, or milling is a probable choice. However, if a prototype or a small number of elements is needed, 3D printing may be a more suitable option. Another promising aspect of using AM lies in the reduction of material waste, the implementation of a lightweight design, high-strength truss geometries, and the opportunity of personalized customization and the creation of specific add-ons tailored to the requirements of the application [1]. Regardless of the manufacturing technology used, computer simulations can be used to calculate stresses and optimize the design.
One area of research that needs to be constantly monitored is materials. The most used materials in 3D-printed constructions are polymer-based materials. The selection of materials for production depends on many factors and there are advantages and disadvantages to consider. One specific drawback of polymer materials is their sensitivity to damage caused by exposure to UV radiation and the general ageing of the material [2]. The ageing of polymer materials refers to the process of their properties changing over time under the influence of various external factors. Polymer materials are preferred due to their flexibility, durability, and cost-effectiveness. However, prolonged exposure to UV radiation, high temperatures, chemical substances, and mechanical loads can lead to the degradation of the polymer and changes in their properties [3].
The most used 3D printing techniques include vat photopolymerization, fused filament fabrication (FFF), direct ink writing (DIW), Inkjet printing or material jetting, and polymer powder bed fusion [1]. Fused filament fabrication (FFF) or fused deposition modeling (FDM), considered one of the most promising additive manufacturing methods due to its versatility, reliability, and affordability, involves the direct deposition of a thermoplastic polymer filament in a layer-by-layer fashion [1,4]. The most commonly used polymers in the FFF technique are acrylonitrile butadiene styrene (ABS) and polylactic acid (PLA) [4]. Using this technique, the material is selectively dispensed through a nozzle.
With the increasing and widespread use of AM in various applications, increased demands are placed on the parameters of the construction process and the performance of the finished object. Overall, the shortcomings of AM can be seen as areas of opportunity and development [5]. One of them may be the increased demand for polymers used in AD itself. It is generally known that polymers, due to their good mechanical properties, are a very desirable material for the construction of various products. On the other hand, they represent a serious environmental problem due to their inability to biodegrade. Therefore, in today’s context, there is an increasing consideration of the possibility of using biodegradable polymers and, in general, reducing their usage while optimizing the production of polymer-based products. This aims to enhance the efficiency of the process and minimize the generation of waste and discarded materials during the production of the final product.
Poly (lactic acid) (PLA) is a biodegradable aliphatic polyester resin and a sustainable alternative to current petroleum-based materials generally used for different industrial applications [6].
The quality of 3D-printed components, and thus their mechanical characteristics, is affected by various parameters like interlayer fusion, porosity, and swelling from natural fibers and particles. In contrast, additive technology allows designers more autonomy, addressing specific challenges, such as varying infill density [7]. Additive manufacturing builds materials layer by layer and relies heavily on input parameters. The mechanical behavior of 3D-printed materials is influenced by factors such as nozzle diameter, material composition [8], added filler [9,10,11], layer orientation [12,13] and thickness [14,15,16], nozzle feed rate [15], grid angle [7,16] and width [17], and, notably, filler density [7].
Impact strength refers to a material’s capacity to withstand cracking, fracturing, or plastic deformation when subjected to sudden and intense impact or shock loads. This crucial property gauges the material’s ability to endure abrupt forces. As the layer thickness increases, the impact strength of PLA materials declines. A reduced layer thickness will enhance the bonding between layers and boost their capacity to absorb energy [18]. As for the influence of infill orientation on the impact strength, research carried out by Miron et al. [19] showed that for 0°- and 45°-oriented specimens, the impact strength was nearly identical, while for z-oriented specimens, the impact strength was lower due to the weaker layer interface, which is in agreement with the research of Rajpuronit et al. [20]. Moreover, Harshit et al. showed that a rectilinear pattern and increased infill density of printed PLA samples exhibited greater impact strength [21]. Even though there are numerous studies regarding the impact strength of PLA-based FDM samples, none of them deals with the problem of the sample thickness as a crucial parameter of the impact fracture resistance with respect to infill density and layer surface.
This comprehensive study seeks to provide insights into how the layer surface, infill density, and sample thickness influence the localized impact absorption capabilities, as evidenced by the outcomes of Charpy testing. Additionally, optical microscopy, FTIR spectroscopy, and SEM analysis will contribute to a thorough understanding of the microstructural changes, chemical composition, and surface morphology of the printed samples, further enhancing our understanding of their performance and behavior in response to impact forces.
Die-cutting tools used in the printing industry and other manufacturing sectors are designed to cut and shape various materials. The cutting surface of the die is typically made of hardened steel strips, known as steel rules, which are used to cut materials such as paper, cardboard, plastics, wood, cork, felt, fabrics, and paperboard. The cutting surface of the die is the edge of hardened steel strips, and these steel rules are usually located using saw or laser-cut grooves in plywood. The mating die can be a flat piece of hardwood or steel, a male shape that matches the workpiece profile, or it can have a matching groove that allows the rule to nest into it. This research opens up possibilities for utilizing additive technology in the production of die-cutting beds in the printing industry.

2. Materials and Methods

2.1. Fused Deposition Modeling

The process of creating tiles for printing with a thicknesses of 2 mm, 3 mm, and 5 mm involved several steps. A 3D computer program, Blender 4.1.0., was used for tile fabrication. The tiles were precisely modeled according to the specified dimensions and in three types: 2 mm, 3 mm, and 5 mm thickness. After the models were completed, preparation for export was carried out. This involved checking the dimensions and ensuring that the topology was suitable for export. In the process of preparing the models for 3D printing, the Ultimaker Cura slicer was used. The models were imported into the computer program and properly (optimally) arranged on the virtual printer’s bed.
PLA filament (Fillamentum, PLA Extrafill, 1.75 mm diameter) was selected for printing, with the nozzle temperature set to 190 °C, while the bed heating temperature was set to 60 °C. The layer height was set to 0.14 mm to achieve high precision (Table 1). For strength and print quality, four layers were chosen for the side walls, as well as for the initial and final layers. The infill was set to 50% in a grid pattern with ±45° raster orientation to achieve an ideal balance between strength and material consumption and mimic default parameters which are mostly used [22]. For comparison, samples with 100% infill were also produced under the same conditions. Grid infill geometry minimizes voids between layers when dealing with 100% infill [20]. The print speed was set to 45 mm/s to ensure a stable layer-by-layer print. When addressing infill and side walls, various settings were selected to achieve the highest quality and an efficient printing speed. The print speed for the infill was set to 60 mm/s, while the speed for the side walls was set to 22.5 mm/s to ensure the detailed and precise rendering of the model’s outer contours. The models were printed using the Creality Ender 3 Pro 3D (Creality, Hong Kong) printer which is cost-effective, easily accessible, and simple to operate, utilizing FDM (fused deposition modeling) technology. Before printing, the printer was properly calibrated to ensure dimensional accuracy and print precision.
After subjecting the samples to a controlled environment set at standard room conditions (22 ± 1 °C and 50% humidity) for a duration of 24 h, the determination of their weight was carried out. This specific conditioning period ensures that the samples reach thermal and moisture equilibrium with the surrounding environment, providing a stable baseline for accurate mass measurements.

2.2. Fracture Resistance Testing

The modification of the Charpy test was used for measuring the energy expended during the fracture of samples under dynamic loading. The device can be adjusted to measure dynamic loads for various samples. The Charpy test involves exposing a specimen to three-point flexural impact loading from a swinging pendulum. The energy absorbed is precisely quantified as the change in potential energy, correlating with the pendulum’s height difference before release and its maximum height after passing through the specimen. Adequate energy is applied to ensure complete fracture [23]. In this research, samples with dimensions of 10 mm × 10 mm × 2 mm, 10 mm × 10 mm × 3 mm, and 10 mm × 10 mm × 5 mm were used. The samples were fixed into grips and positioned so that the moment of action was maximal (in the middle of the sample). The impact force was applied at the apex of the pyramid on a pendulum. The energy required to fracture the samples, J, was read from the measurement scale.
Ten samples were used for each measurement, and they were either 50% or 100% filled. The samples were positioned such that the impact force was either on the first layer of the sample or the last layer of the sample.

2.3. Optical Microscopy

Optical microscopy was performed using the USB Dino Lite AMT413T optical microscope, which features a 3-megapixel CMOS detector. The microscope’s magnification ranges from 5× to 200×, while the integrated CMOS camera has a resolution of 3 megapixels.

2.4. SEM Microscopy

SEM micrographs were obtained with JEOL JSM-6460 (Jeol, Tokyo, Japan) scanning electron microscope. Prior to testing, the samples were gold-coated by the Baltec SCD 005 sputtering unit. The obtained micrographs were further processed with ImageJ 1.54 software in order to analyze inter-layer boundaries.

2.5. Fourier-Transform Infrared Spectroscopy

The ATR spectra of the samples surface were measured using the Shimadzu FTIR IRAffinity-21 (Shimadzu, Kyoto, Japan) spectrometer with the Specac Silver Gate Evolution as a single reflection ATR sampling accessory with a ZnSe flat crystal plate (index of refraction 2.4). The IR spectra were recorded in the spectral range between 4000 and 500 cm−1 at a 4 cm−1 resolution and averaged over 15 scans.

3. Results and Discussion

3.1. Mass Determination of Printed Samples

The additive manufacturing of a 2 mm thick sample yields a 14% reduction in material consumption when producing objects with a 50% infill. Elevating the sample thickness by 1 mm results in a 22% reduction in material usage for objects with 50% infill compared to those with 100% infill. Furthermore, opting for a 50% infill for samples with a 5 mm thickness translates to a 27% reduction in material usage compared to full-scale printing, as presented in Table 2.

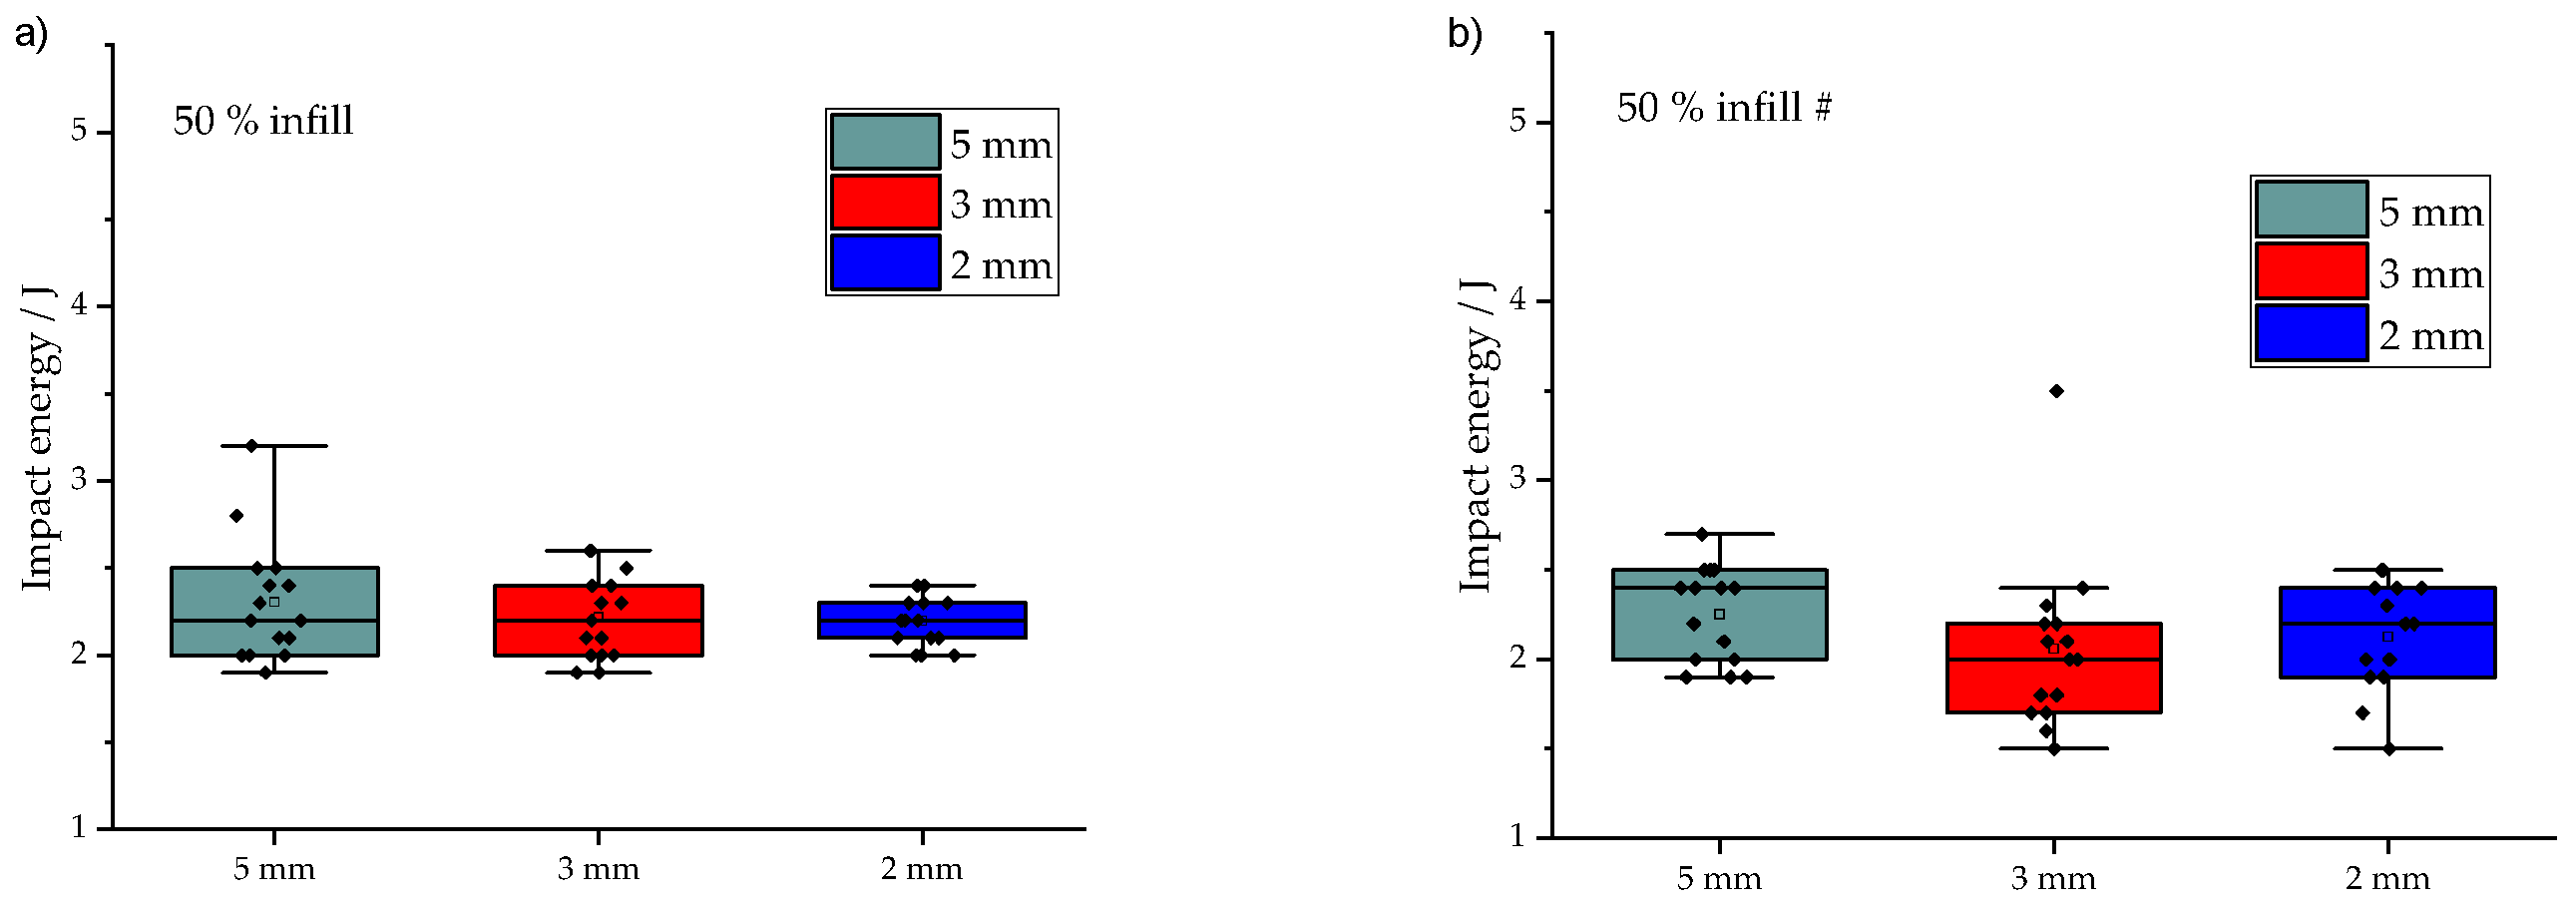
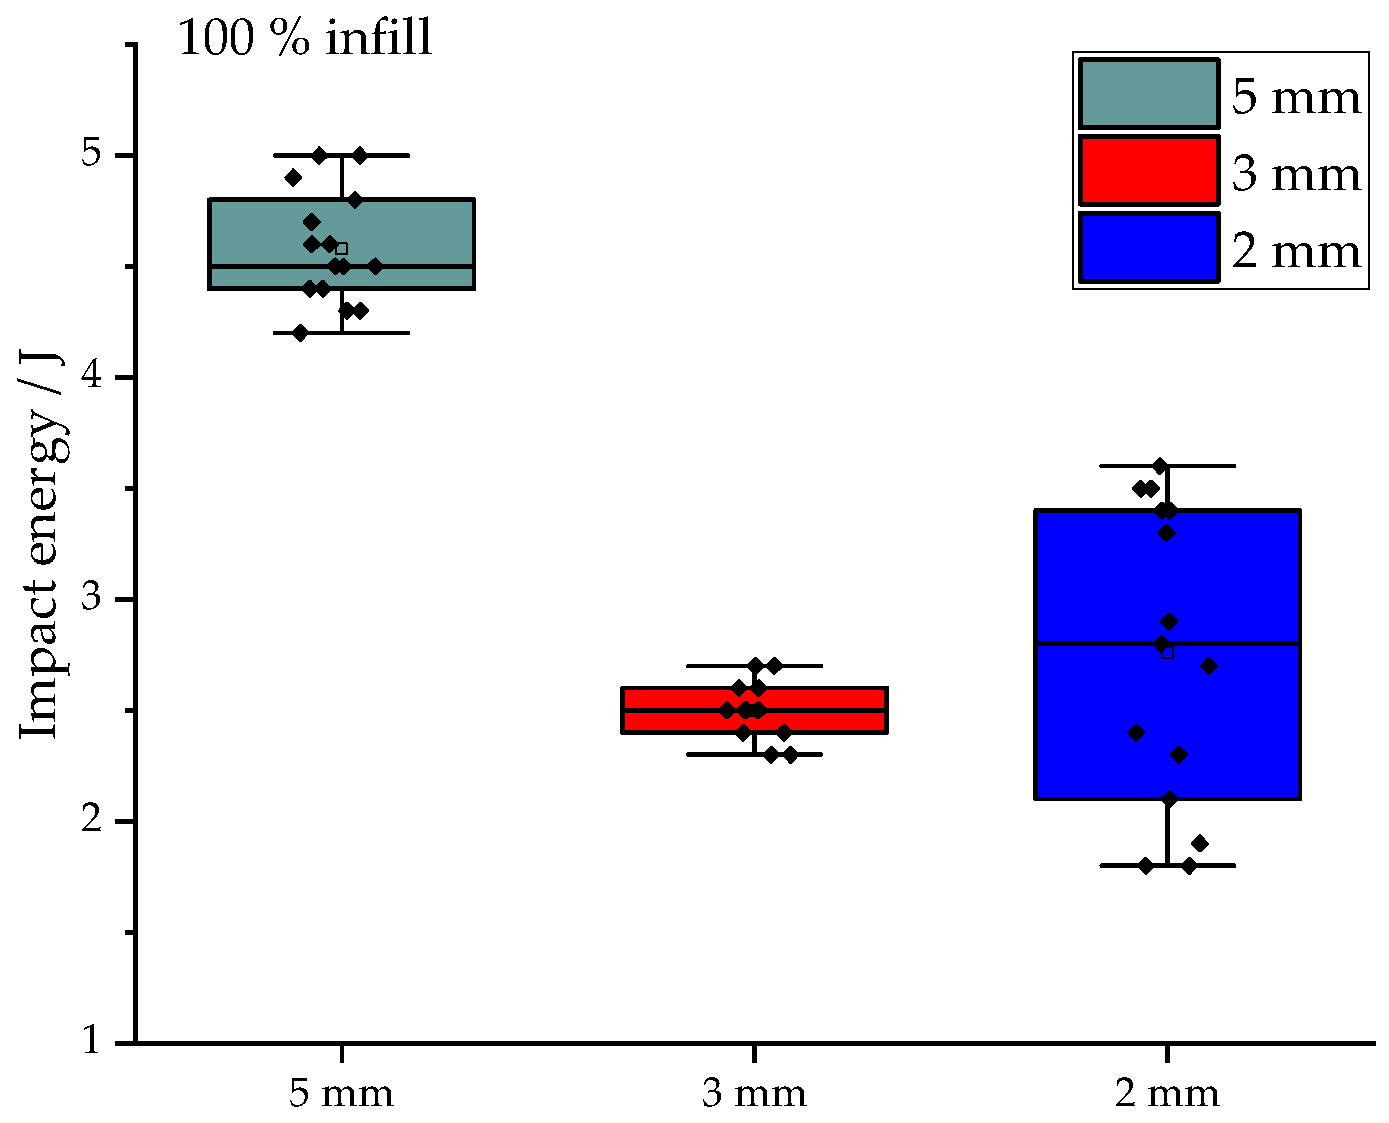
3.2. Fracture Resistance Testing

The results of fracture resistance testing are given in Figure 1 and Figure 2. The key values are graphically represented with the box chart. The box is determined by the 25th and 75th percentiles. The whiskers are determined by the 5th and 95th percentiles. The mean value is represented with a transparent rectangle, while the separation line between the 25th and 75th percentiles represents the median. When the 50% infill samples are studied, there is no significant deviation in impact energy values between them, regardless of their thickness.
If the angle at which the sample is penetrated is compared (0 degrees or 180 degrees), it is observed that the mean values of impact energy and the medians are nearly identical when the sample is impacted at an angle of 0 degrees, with a slightly higher dispersion of values for samples with a thickness of 5 mm. On the other hand, for samples tested at an angle of 180 degrees, there are fewer differences within the samples, as evidenced by almost identical box sizes. If one measurement with a significant jump in value (3 mm at 50% infill and 180 degrees impact angle) is disregarded, it can be observed that the change in position does not have a significant impact on the values of consumed energy for fracture. Although all samples have four upper and lower layers with layers in-between filled to 50%, it is evident that upper/lower layers absorb most of the impact energy.
Due to this conclusion, the experiment with 100% fill samples was conducted without observing the impact on the first impact surface (Figure 2). Consistency in most results was observed, as depicted in the diagram. Earlier research indicated that increasing the number of layers enhances strength due to a higher temperature gradient and improved diffusion between the layers [24]. Nevertheless, this may also result in distortion, interlayer cracking, and the separation of parts due to frequent heating and cooling cycles, potentially causing a decline in strength over time [25].
It was shown by the results that the profile of 100% infill with a thickness of 2 mm should be avoided. The argument is made based on the significant data dispersion in the 100% infill profile compared to the 50% infill profile, indicating that the construction of such profiles exhibits unpredictable behavior when subjected to impact. Another extreme of different values is the thickness of 5 mm. At this thickness, a significant difference in medians was observed for the 100% full profile (4.5 J) and the 50% fill profile (2.2 J/2.4 J). The full profile was proven to be incomparably more durable and suitable for application. It can be concluded that, in terms of impact strength, samples with a thickness of 3 mm are optimal. This suggests that significant material savings can be achieved by using 50% infill without compromising the mechanical properties of the PLA sample.

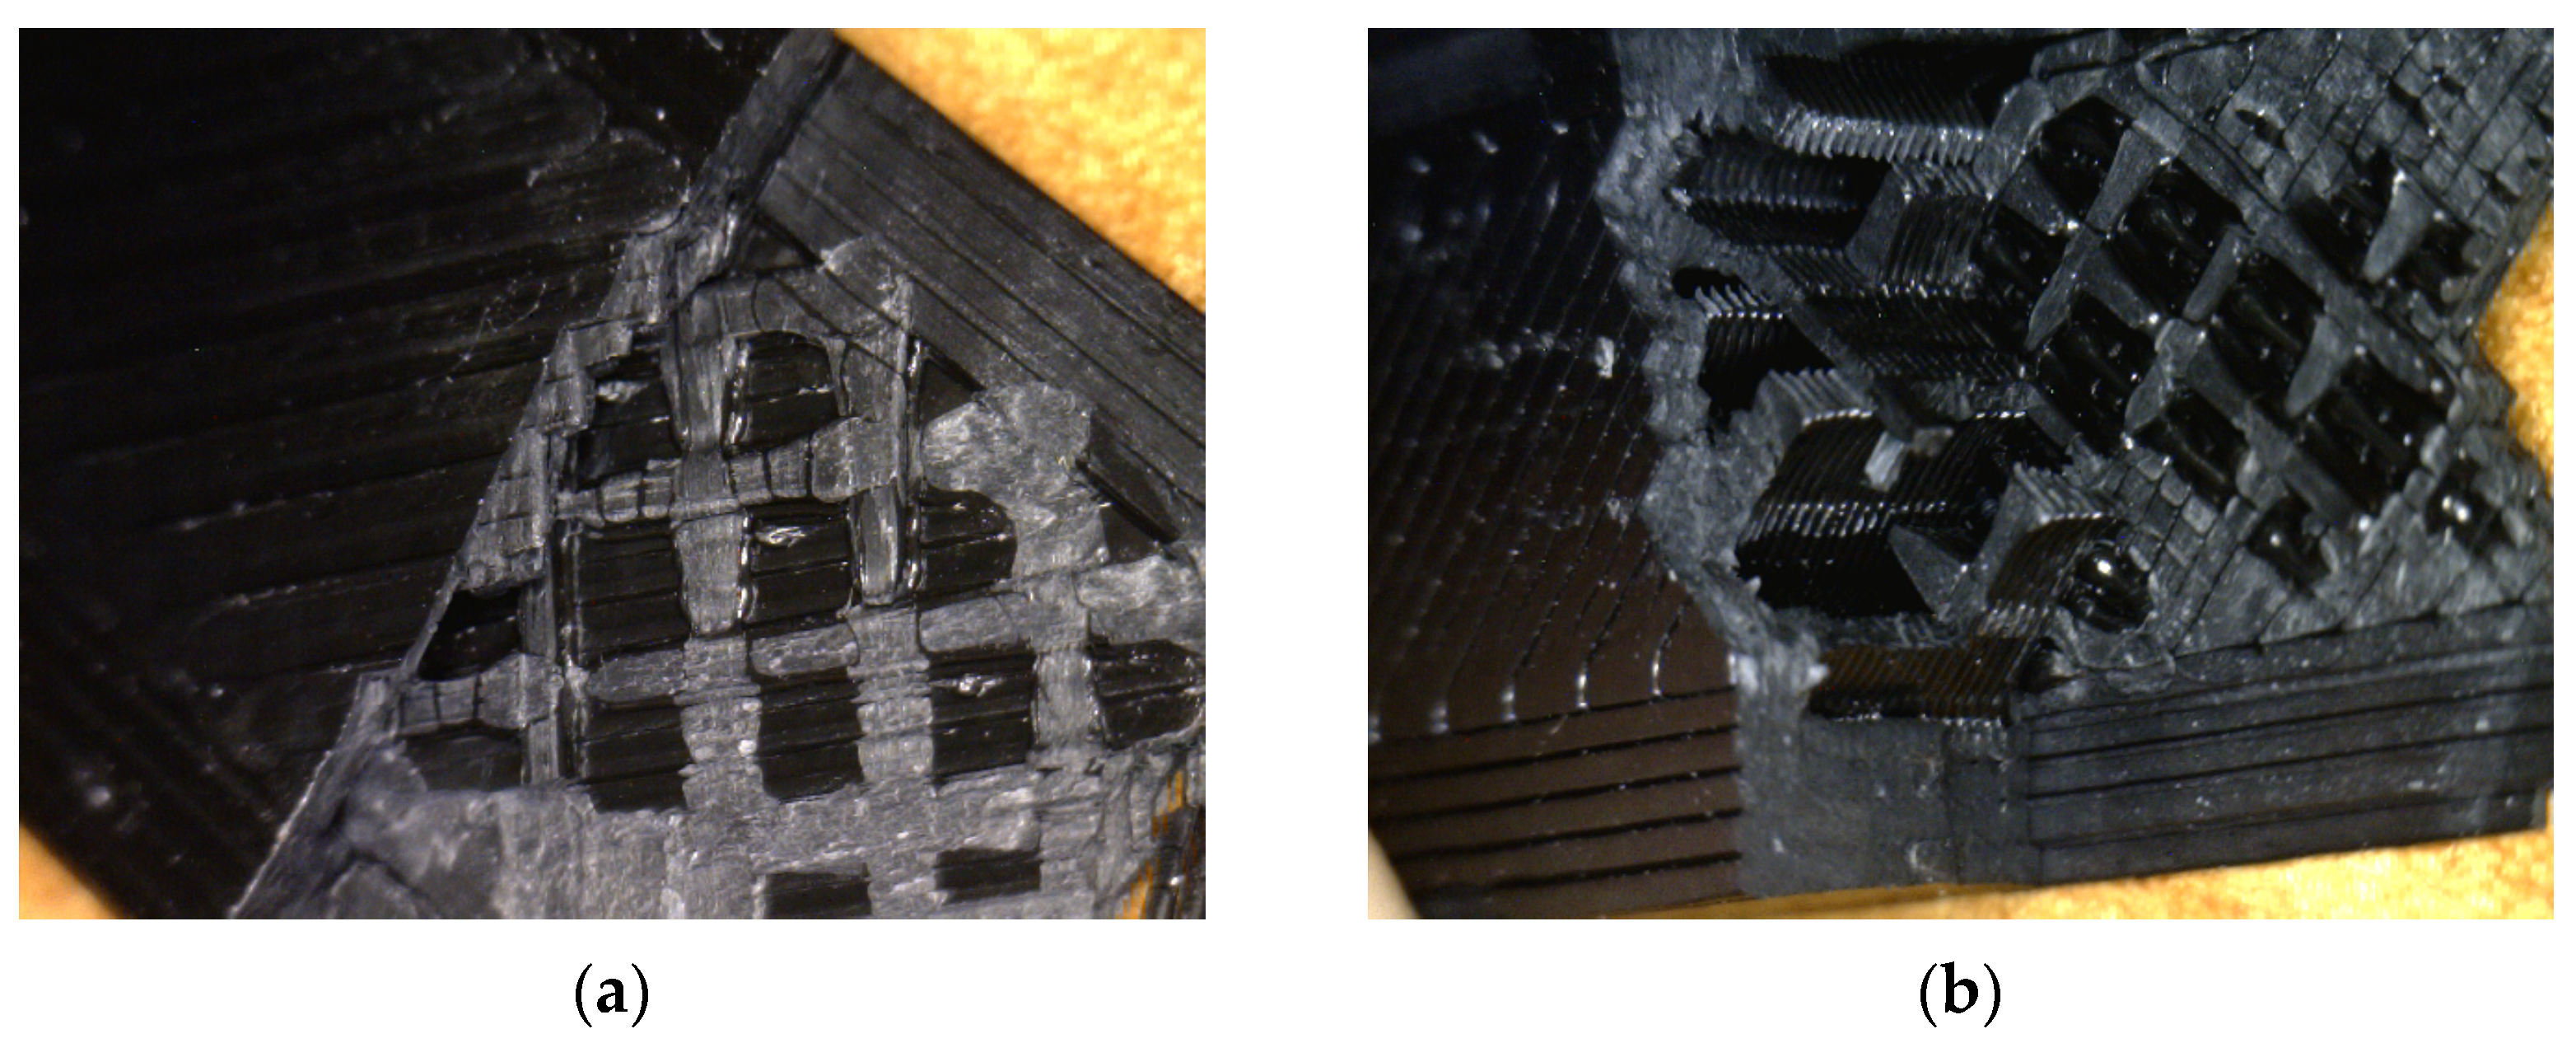
3.3. Optical Microscopy
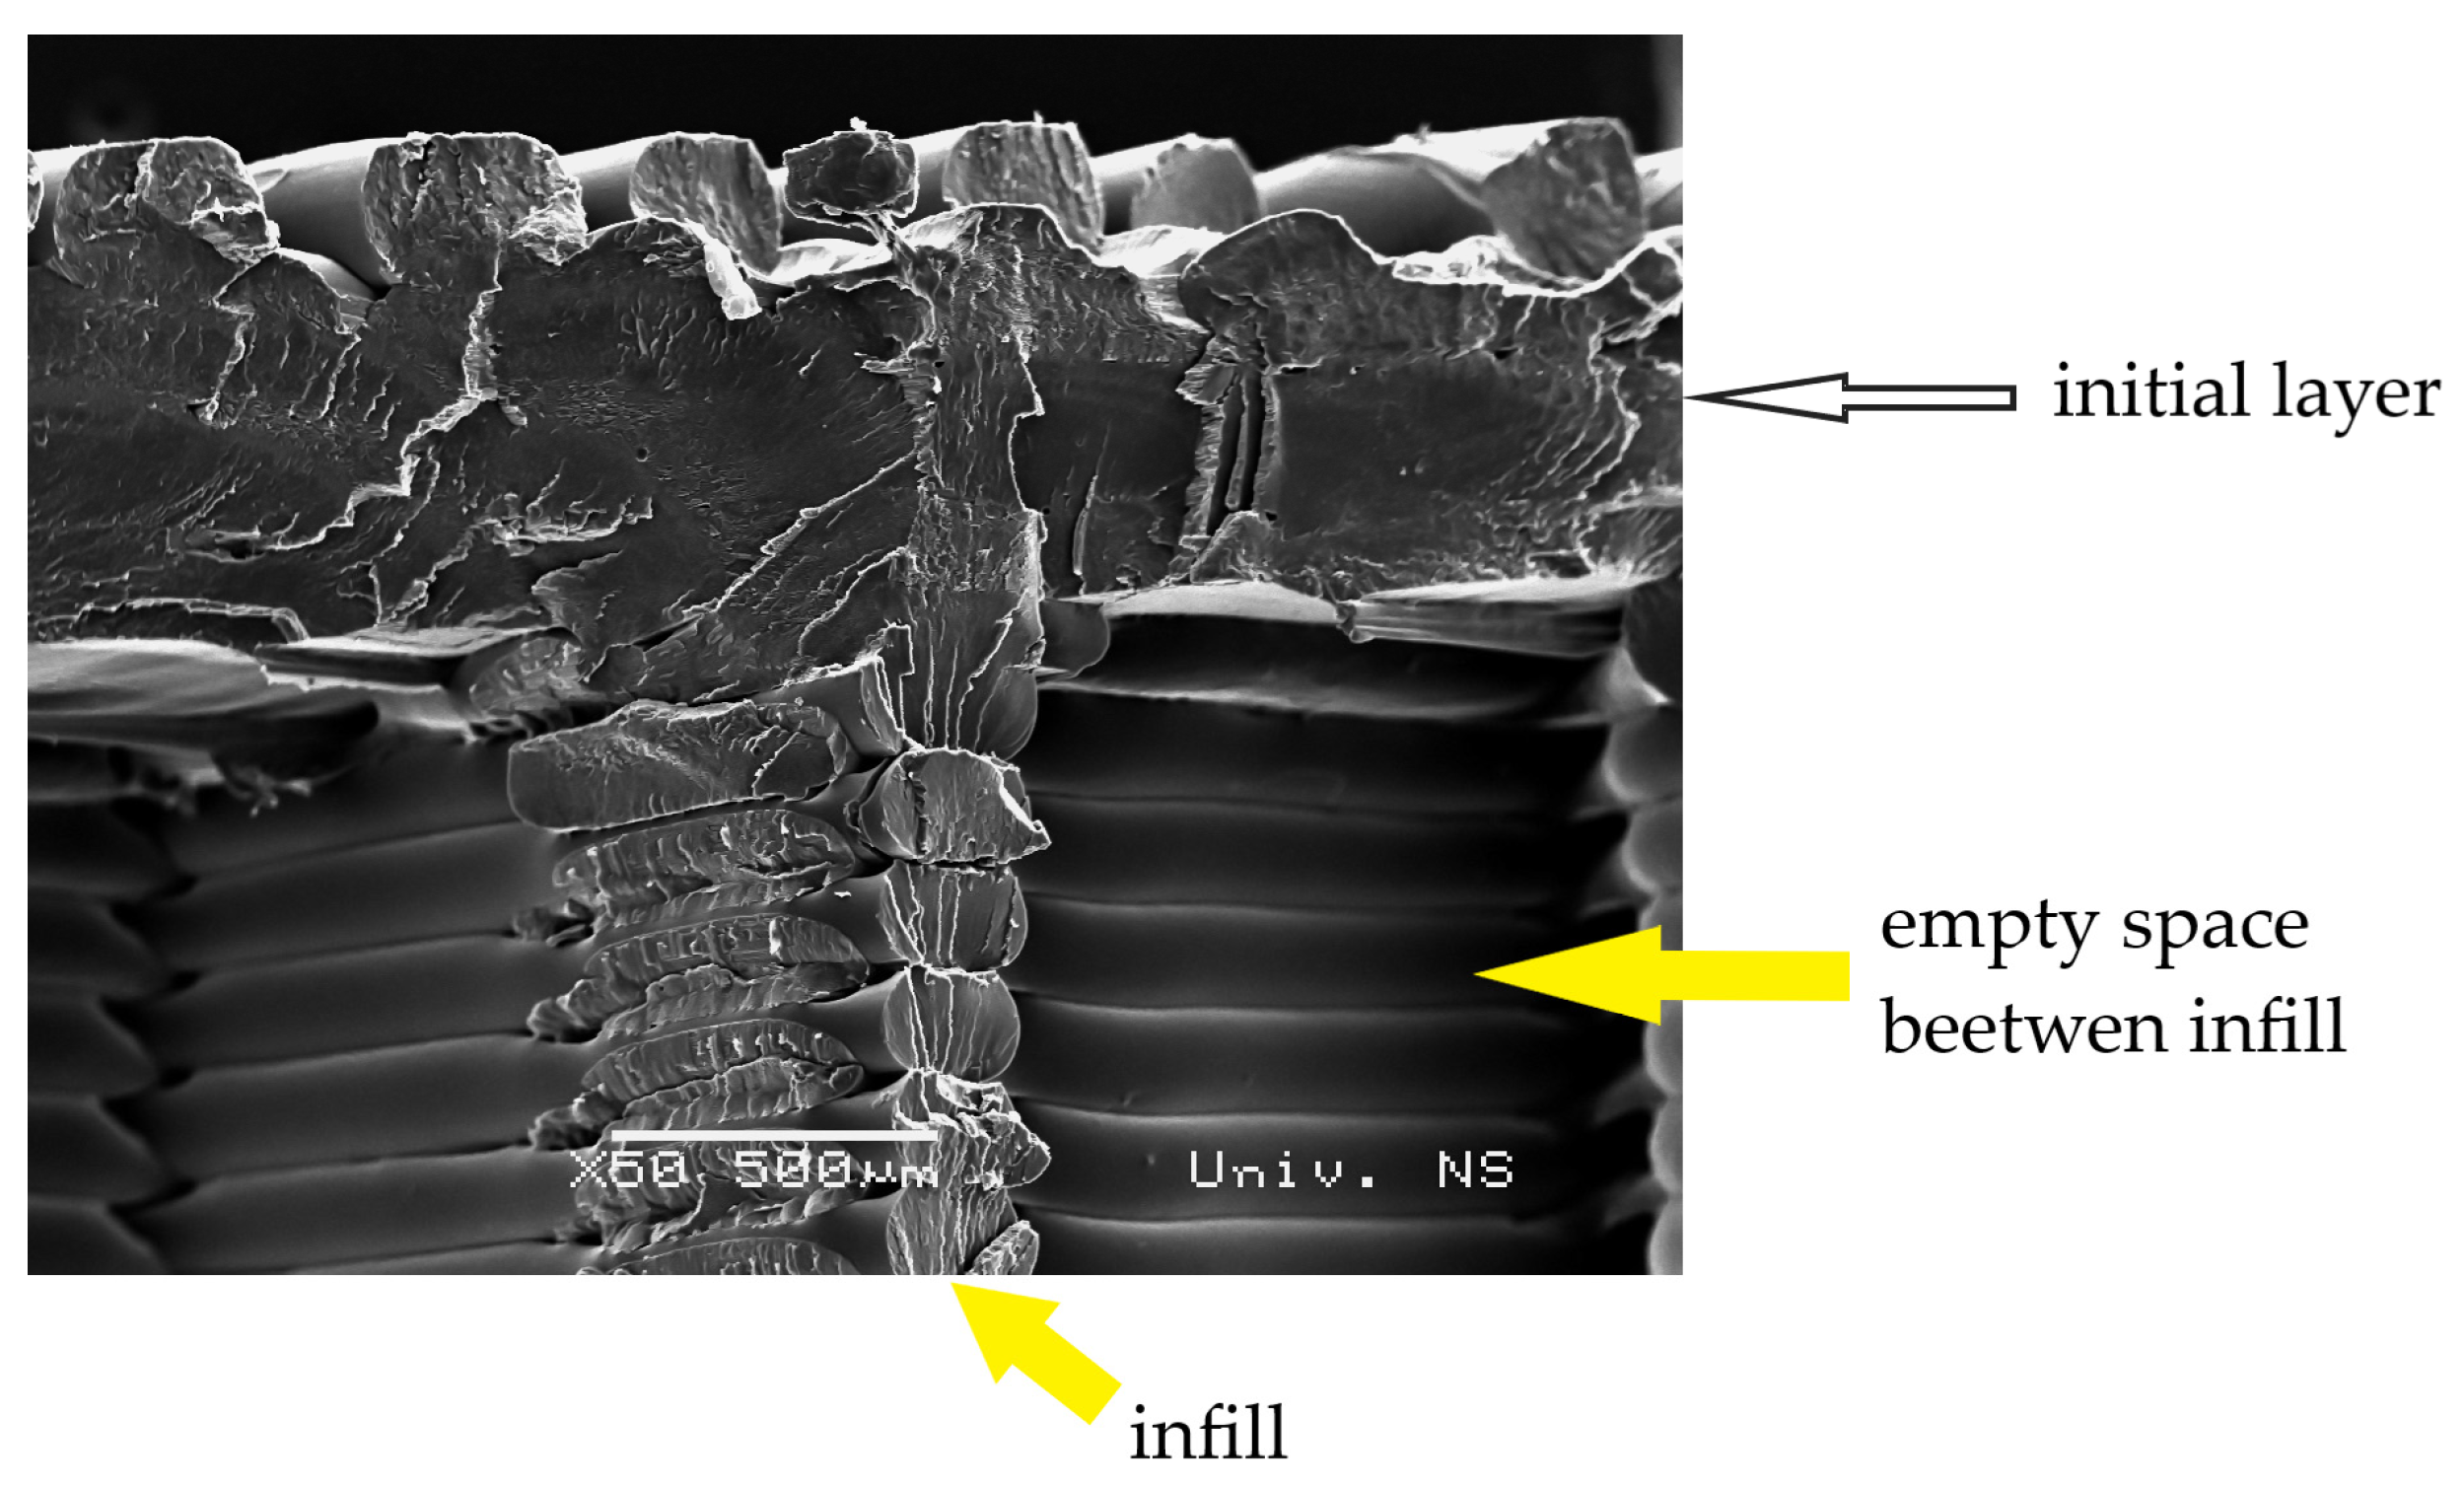
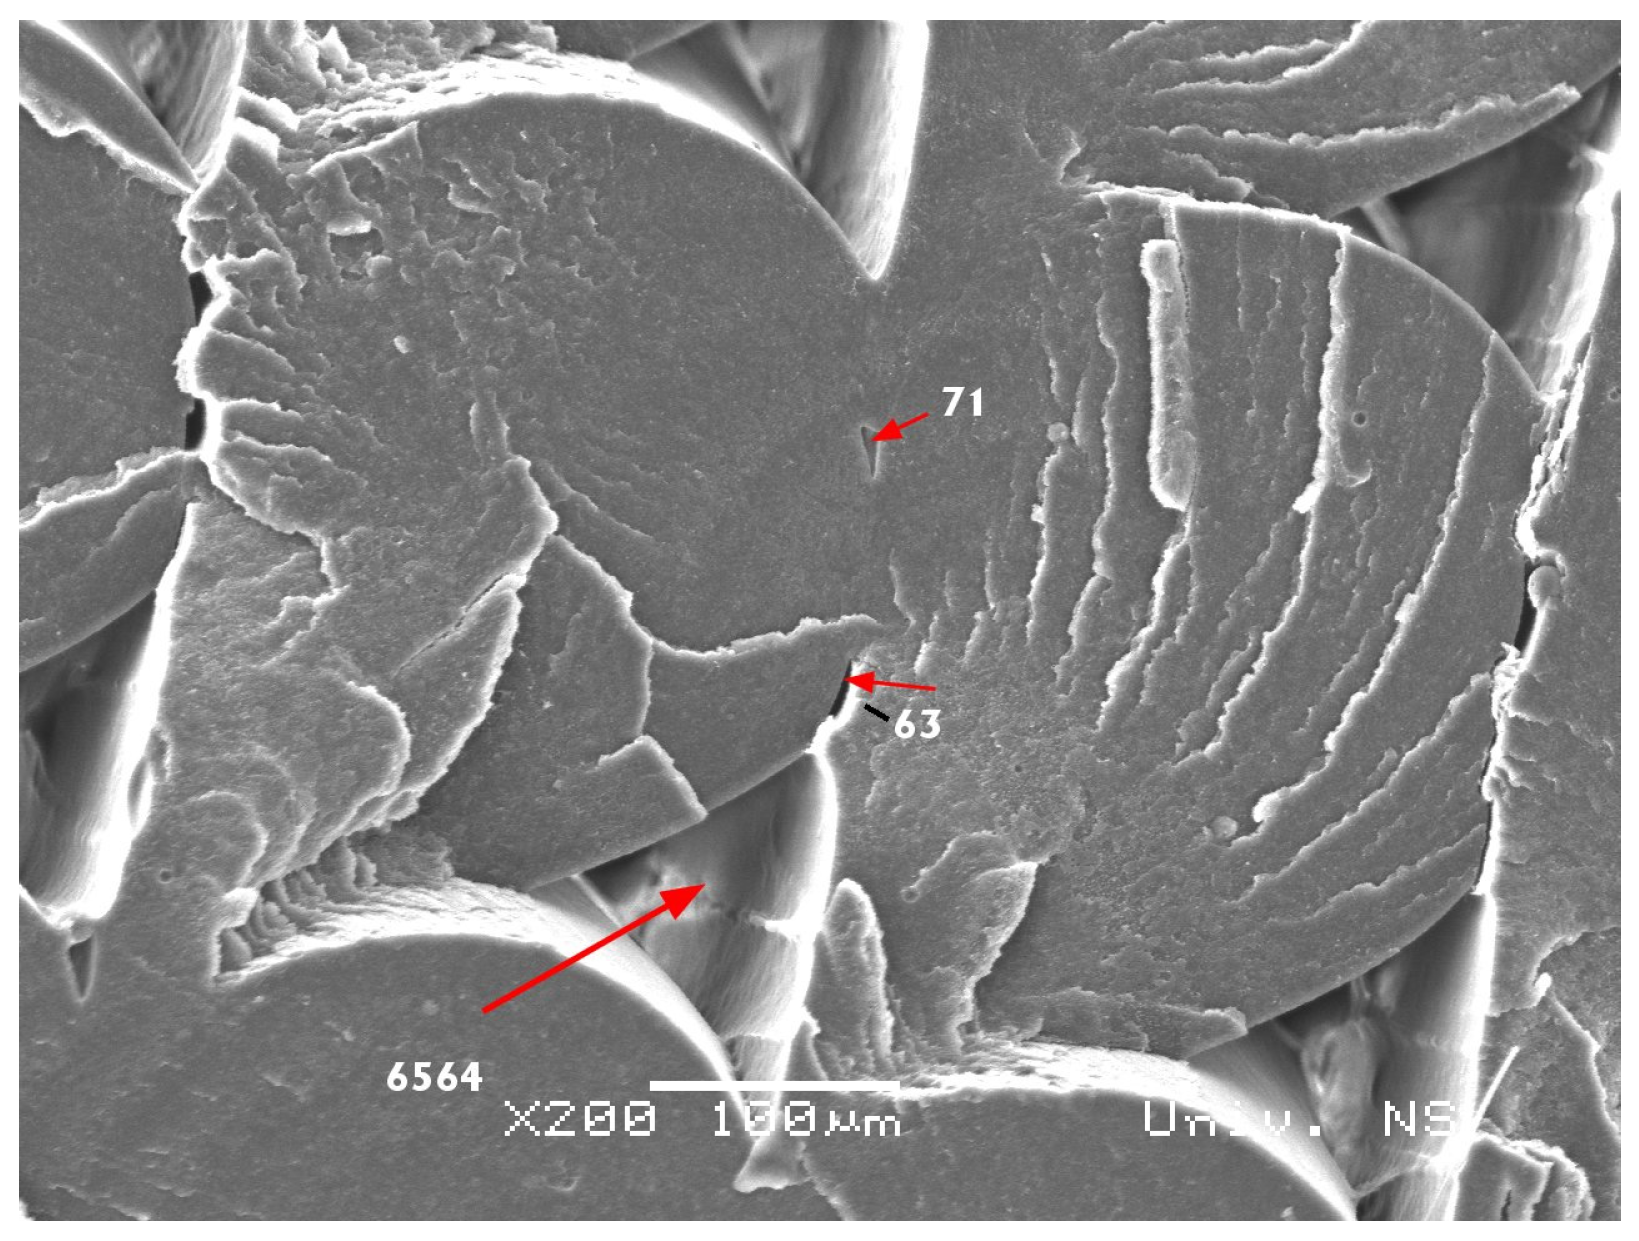
Optical microscopy images show that the crack propagated from one layer to the adjacent layer, tearing them apart one by one (Figure 3). Also, the delamination of the layers can be observed. The 5 mm samples made with 50% infill show different fracture behavior than the rest of the samples (Figure 3b). Crack propagation in the infill pattern for the 5 mm 50% infill sample is discontinuous, primarily resisted by crack nucleation. The higher porosity of the structure and larger void areas decreased interlayer bonding which caused irregular crack propagation within the structure, resulting in an irregular fracture pattern.

3.4. SEM Microscopy

The SEM micrograph of the PLA filament cross-section shows a brittle fracture which results in smooth surfaces (Figure 4). In addition, the presence of some inorganic additives in the filament structure can be seen, presented as white spots [26]. The presence of air voids in the filament structure probably occurs due to the filament technology process, i.e., the filament extrusion process and the presence of moisture [27].
The SEM micrograph of the interior of the 3D print made with 50% infill shows the transition from the initial layer to the 50% infill area (Figure 5). The fracture, upon closer examination, presents discernible irregularities and rough edges, providing clear indications of a fracture mode characterized by brittleness or partial brittleness. The observable jagged features on the fracture’s surface further underscore the nature of the breakage, suggesting a lack of ductility and a tendency toward brittle behavior during the impact.
Figure 6a shows layers in the printed model made with 100% infill, while Figure 6b shows an enlarged micrograph of the layers’ structure. It is obvious that the layers have a fibrous structure.
The printing was carried out using the FFF process in which a 3D print is formed through layer-by-layer deposition. In this process, the filament melts and extrudes through the nozzles. By leaving the nozzles, the filament is placed onto the printing bed. Due to its softness, the lower part is flattened while the top part forms convex structures, forming triangular voids (Figure 6c) [28]. These voids can cause an uneven bonding of the layers [29].
Figure 7 shows the cross-section view of the 3D print made with 100% infill under a magnification of 200×. Triangular inter-track voids are formed at inter-layer boundaries due to neck growth phenomena during the solidification and sintering processes when molten tracks merge [30]. Additionally, irregular micro voids at the inter-layer boundaries can be observed. The average surface area values of the micro voids (71 µm2, 63 µm2) are 100× smaller compared to the area of the triangular inter-track voids (6564 µm2) (Figure 7).

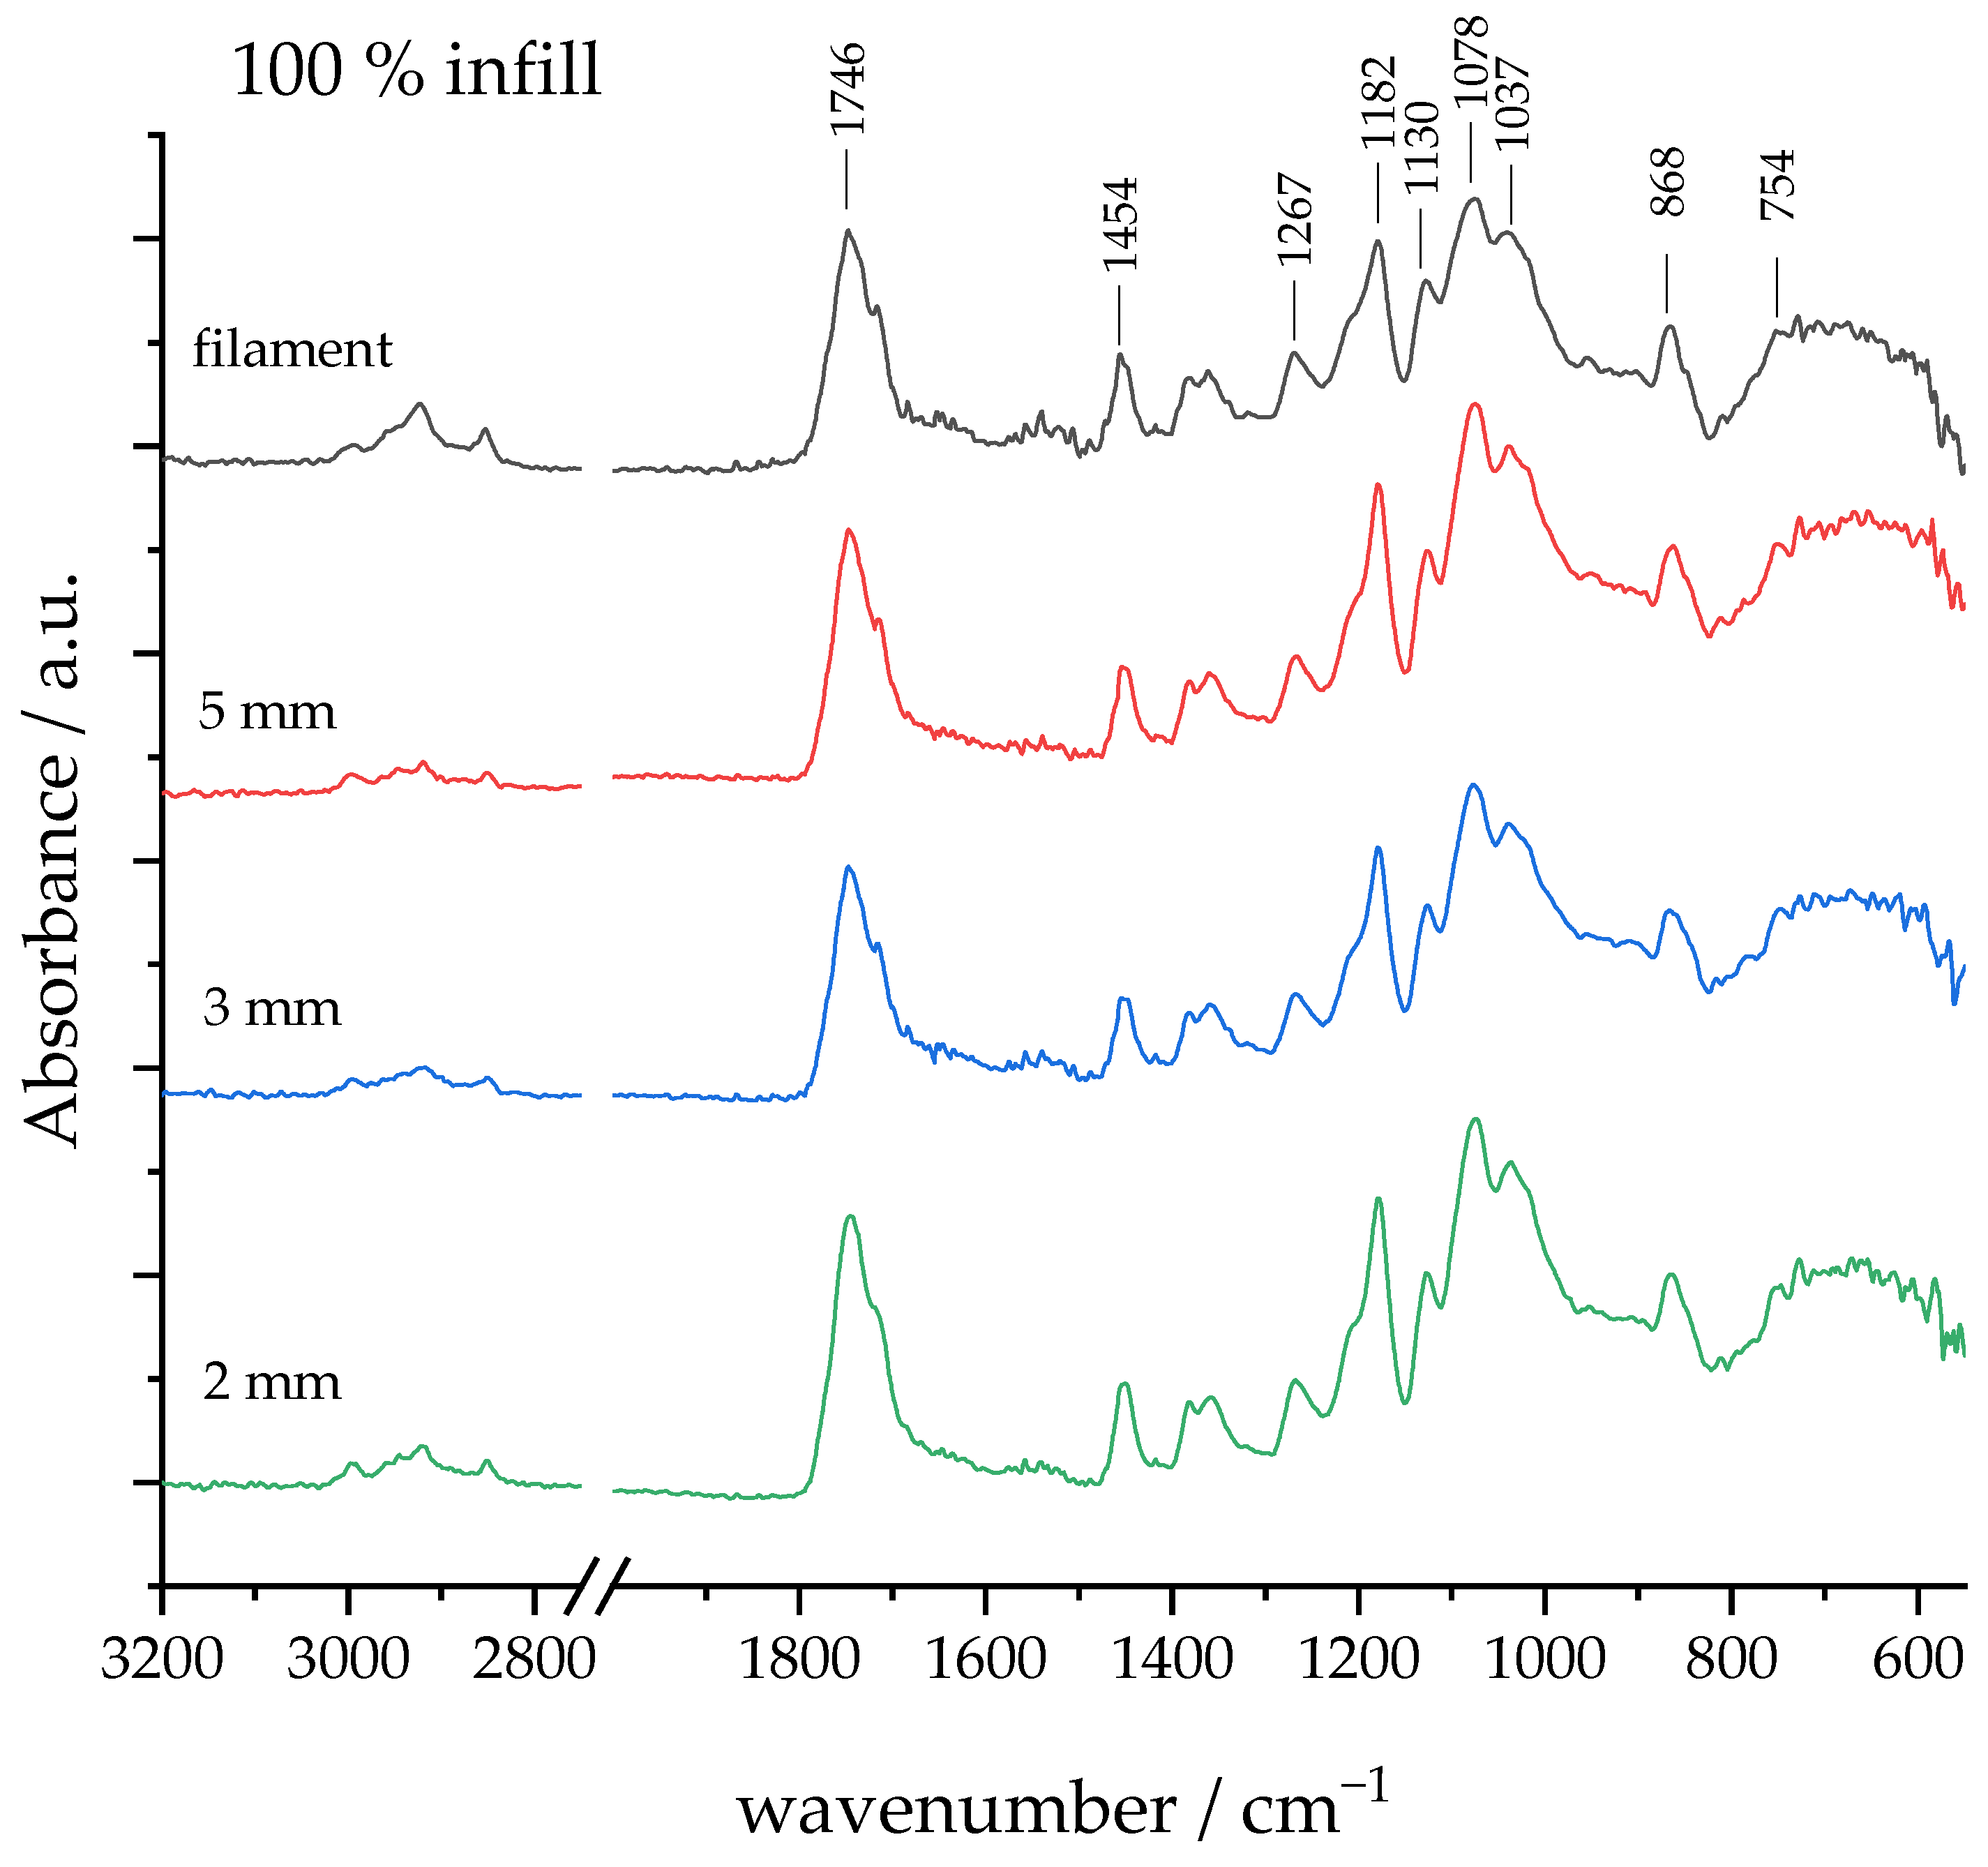
3.5. FTIR Spectroscopy

In order to analyze the influence of the fused deposition modeling process on the PLA material due to various thermal processes with a high temperature gradient (melting and extrusion followed by cooling and solidification), FTIR spectra of both the neat filament and the 100% infill FDM samples were recorded (Figure 8 and Table 3). Spectra were acquired from the lower layer. The neat filament shows characteristic peaks of PLA. The vibrational bands of the PLA filament and their assignations are given in Table 2. Strong carbonyl (-C=O) stretches are observed at a wave number of 1746 cm−1. Additionally, there are symmetric and asymmetric vibrations of the alkyl groups -CH and -CH2 between 2800 and 3000 cm−1. Furthermore, there is an asymmetric tension band of the aliphatic C-O-C group at 1182 cm−1 and -C-O-C- asymmetric stretch at ~1078 cm−1.
The FTIR spectra of the fused deposition modeling (FDM)-printed samples display identical vibrational bands, indicating that there are no substantial structural changes in the surface resulting from the cooling and solidification processes. This consistency in the spectra implies that the molecular composition and arrangement of the printed material remain largely unchanged during the transition from the melted to the solid state. The absence of significant alterations in the surface structure underscores the stability of the FDM printing process in preserving the material’s chemical integrity and overall composition.
PLA is a semi-crystalline polymer; thus, it is important to monitor the change in crystallinity during a processing method utilizing heat, since the crystallization speed of PLA is slower than the extruding process [34]. Liao et al. [34] showed the anisotropy of 3D-printed objects due to the occurrence of orientation phenomena during the filament deposition and the formation both of ordered and disordered crystalline forms. The determination of polymer crystallinity is of major concern since it influences many polymer properties (hardness, modulus, tensile strength, stiffness, crease, and melting points) [35]. The crystallinity index of PLA could be calculated as the ratio between the two band areas A754/A868 [36]. The ATR-FTIR results indicate that there are no significant changes in the surface chemistry of PLA filaments during FDM printing, except for molecular reorientations and a decrease in crystallinity, which can be attributed to a combination of thermal, mechanical, and structural changes that occur during the printing process (Table 4), which is in agreement with previous research [36].

4. Conclusions

FDM is widely embraced in prototyping due to its cost-effectiveness, speed, and versatility in creating intricate and functional prototypes using various materials. Concurrently, the growing emphasis on sustainable practices and environmental consciousness highlights considerations for utilizing biodegradable polymers and reducing their overall usage while optimizing the production of polymer-based products. This study delved into the impact fracture resistance of FDM models constructed from Polylactic Acid (PLA), specifically exploring the effects of infill density (50% and 100% infill) and sample thickness (2 mm, 3 mm, and 5 mm). In-depth analyses, including optical microscopy, FTIR spectroscopy, and SEM examinations of both the PLA filament and fractured FDM PLA surfaces, were conducted to elucidate the influence of process parameters on impact damage and failure mechanisms.
The results of the impact fracture resistance test indicate that a 100% infill profile with a 2 mm thickness should be avoided due to significant data dispersion, suggesting unpredictable behavior under impact. For 5 mm thickness, the 100% infill profile showed a significantly higher median compared to the 50% infill profile, demonstrating superior durability. Optimal impact strength was observed in samples with a 3 mm thickness, implying that material savings can be achieved with a 50% infill without compromising mechanical properties. The SEM analysis of the PLA filament showed a brittle fracture, inorganic additives, and air voids from extrusion, while the FDM models with 100% infill showed triangular voids and micro voids at inter-layer boundaries. FTIR spectroscopy showed no alterations in PLA filament surface chemistry during FDM printing, except for molecular reorientations and decreased crystallinity, which is in line with previous research.
Future research will be directed towards investigating the impact of exposing FDM samples to UV radiation and various chemicals to explore their stability under different conditions.

Author Contributions

Conceptualization, D.B. and K.I.I.; methodology, D.B.; software, K.I.I.; validation, D.B. and K.I.I.; formal analysis, D.B., K.I.I. and M.V.; investigation, D.B., K.I.I., and T.C.; resources, D.B.; data curation, K.I.I. and D.B.; writing—original draft preparation, D.B., K.I.I. and M.V.; writing—review and editing, T.C.; visualization, D.B. and K.I.I.; supervision, D.B.; funding acquisition, D.B. All authors have read and agreed to the published version of the manuscript.

Funding

The APC was funded by the University of Zagreb.

Institutional Review Board Statement

Not applicable.

Informed Consent Statement

Not applicable.

Data Availability Statement

Data is contained within the article.

Conflicts of Interest

The authors declare no conflicts of interest.

References

  1. Herzberger, J.; Sirrine, J.M.; Williams, C.B.; Long, T.E. Polymer Design for 3D Printing Elastomers: Recent Advances in Structure, Properties, and Printing. Prog. Polym. Sci. 2019, 97, 101144. [Google Scholar] [CrossRef]
  2. Shah, A.A.; Hasan, F.; Hameed, A.; Ahmed, S. Biological degradation of plastics: A comprehensive review. Biotechnol. Adv. 2008, 26, 246–265. [Google Scholar] [CrossRef] [PubMed]
  3. Lucas, N.; Bienaime, C.; Belloy, C.; Queneudec, M.; Silvestre, F.; Nava-Saucedo, J.E. Polymer biodegradation: Mechanisms and estimation techniques—A review. Chemosphere 2008, 73, 429–442. [Google Scholar] [CrossRef] [PubMed]
  4. Tao, Y.; Kong, F.; Li, Z.; Zhang, J.; Zhao, X.; Yin, Q.; Xing, D.; Li, P. A review on voids of 3D printed parts by fused filament fabrication. J. Mater. Res. Technol. 2021, 15, 4860–4879. [Google Scholar] [CrossRef]
  5. Ligon, S.C.; Liska, R.; Stampfl, J.; Gurr, M.; Mülhaupt, R. Polymers for 3D Printing and Customized Additive Manufacturing. Chem. Rev. 2017, 117, 10212–10290. [Google Scholar] [CrossRef] [PubMed]
  6. Cipriano, T.F.; Silva, A.L.N.D.; Silva, A.H.M.D.; Sousa, A.M.F.D.; Silva, G.M.D.; Rocha, M.G. Thermal, rheological and morphological properties of poly (lactic acid) (PLA) and talc composites. Polímeros Ciência Tecnol. 2014, 24, 276–282. [Google Scholar] [CrossRef]
  7. Fernandez-Vicente, M.; Calle, W.; Ferrandiz, S.; Conejero, A. Effect of Infill Parameters on Tensile Mechanical Behavior in Desktop 3D Printing. 3D Print. Addit. Manuf. 2016, 3, 183–192. [Google Scholar] [CrossRef]
  8. Wang, Z.; Xu, J.; Lu, Y.; Hu, L.; Fan, Y.; Ma, J.; Zhou, X. Preparation of 3D printable micro/nanocellulose-polylactic acid (MNC/PLA) composite wire rods with high MNC constitution. Ind. Crops Prod. 2017, 109, 889–896. [Google Scholar] [CrossRef]
  9. Kariz, M.; Sernek, M.; Obućina, M.; Kuzman, M.K. Effect of wood content in FDM filament on properties of 3D printed parts. Mater. Today Commun. 2018, 14, 135–140. [Google Scholar] [CrossRef]
  10. Tiwary, V.K.; Arunkumar, P.; Kulkarni, P.M. Micro-particle grafted eco-friendly polymer filaments for 3D printing technology. Mater. Today Proc. 2020, 28, 1980–1984. [Google Scholar] [CrossRef]
  11. Mishra, R.; Wiener, J.; Militky, J.; Petru, M.; Tomkova, B.; Novotna, J. Bio-Composites Reinforced with Natural Fibers: Comparative Analysis of Thermal, Static and Dynamic-Mechanical Properties. Fibers Polym. 2020, 21, 619–627. [Google Scholar] [CrossRef]
  12. Azadi, M.; Dadashi, A.; Dezianian, S.; Kianifar, M.; Torkaman, S.; Chiyani, M. High-cycle bending fatigue properties of additive-manufactured ABS and PLA polymers fabricated by fused deposition modeling 3D-printing. Forces Mech. 2021, 3, 100016. [Google Scholar] [CrossRef]
  13. Patterson, A.E.; Pereira, T.R.; Allison, J.T.; Messimer, S.L. IZOD impact properties of full-density fused deposition modeling polymer materials with respect to raster angle and print orientation. Proc. Inst. Mech. Eng. Part C J. Mech. Eng. Sci. 2021, 235, 1891–1908. [Google Scholar] [CrossRef]
  14. Tanikella, N.G.; Wittbrodt, B.; Pearce, J.M. Tensile strength of commercial polymer materials for fused filament fabrication 3D printing. Addit. Manuf. 2017, 15, 40–47. [Google Scholar] [CrossRef]
  15. Chacón, J.M.; Caminero, M.A.; García-Plaza, E.; Núñez, P.J. Additive manufacturing of PLA structures using fused deposition modelling: Effect of process parameters on mechanical properties and their optimal selection. Mater. Des. 2017, 124, 143–157. [Google Scholar] [CrossRef]
  16. Yao, T.; Deng, Z.; Zhang, K.; Li, S. A method to predict the ultimate tensile strength of 3D printing polylactic acid (PLA) materials with different printing orientations. Compos. Part B Eng. 2019, 163, 393–402. [Google Scholar] [CrossRef]
  17. Le Duigou, A.; Castro, M.; Bevan, R.; Martin, N. 3D printing of wood fibre biocomposites: From mechanical to actuation functionality. Mater. Des. 2016, 96, 106–114. [Google Scholar] [CrossRef]
  18. Kholil, A.; Syaefuddin, E.A.; Supardi, F.; Wulandari, D.A. The Effect of Layer Thickness on Impact Strength Characteristics of ABS and PLA Materials. J. Phys. Conf. Ser. 2022, 2377, 012001. [Google Scholar] [CrossRef]
  19. Miron, V.M.; Bräuer, G.; Lämmermann, S.; Major, Z. Instrumented Charpy Impact Tests of Additively Manufactured Specimens. In Proceedings of the 10th International Symposium on Impact Engineering 2019—ISIE 2019, Gmunden, Austria, 2–5 July 2019; pp. 242–247. [Google Scholar]
  20. Rajpurohit, S.R.; Dave, H.K. Impact strength of 3D printed PLA using open source FFF-based 3D printer. Prog. Addit. Manuf. 2021, 6, 119–131. [Google Scholar] [CrossRef]
  21. Harshit, D.K.; Naushil, P.H.; Shilpesh, R.R.; Ashish, P.R.; Harit, R.K. Investigation on impact strength of 3D printed PLA: Effect of part orientation, infill pattern and infill percentage. Int. J. Manuf. Technol. Manag. 2023, 37, 580–598. [Google Scholar] [CrossRef]
  22. Bergonzi, L.; Vettori, M.; Stefanini, L.; D’Alcamo, L. Different infill geometry influence on mechanical properties of FDM produced PLA. IOP Conf. Ser. Mater. Sci. Eng. 2021, 1038, 012071. [Google Scholar] [CrossRef]
  23. Caminero, M.A.; Chacón, J.M.; García-Moreno, I.; Rodríguez, G.P. Impact damage resistance of 3D printed continuous fibre reinforced thermoplastic composites using fused deposition modelling. Compos. Part B Eng. 2018, 148, 93–103. [Google Scholar] [CrossRef]
  24. Prajapati, A.R.; Dave, H.K.; Raval, H.K. Effect of fiber volume fraction on the impact strength of fiber reinforced polymer composites made by FDM process. Mater. Today Proc. 2021, 44, 2102–2106. [Google Scholar] [CrossRef]
  25. Sood, A.K.; Ohdar, R.K.; Mahapatra, S.S. Parametric appraisal of mechanical property of fused deposition modelling processed parts. Mater. Des. 2010, 31, 287–295. [Google Scholar] [CrossRef]
  26. Reverte, J.M.; Caminero, M.Á.; Chacón, J.M.; García-Plaza, E.; Núñez, P.J.; Becar, J.P. Mechanical and Geometric Performance of PLA-Based Polymer Composites Processed by the Fused Filament Fabrication Additive Manufacturing Technique. Materials 2020, 13, 1924. [Google Scholar] [CrossRef]
  27. Rehmani, M.A.A.; Jaywant, S.A.; Arif, K.M. Study of Microchannels Fabricated Using Desktop Fused Deposition Modeling Systems. Micromachines 2020, 12, 14. [Google Scholar] [CrossRef]
  28. Polychronopoulos, N.D.; Vlachopoulos, J. The role of heating and cooling in viscous sintering of pairs of spheres and pairs of cylinders. Rapid Prototyp. J. 2020, 26, 719–726. [Google Scholar] [CrossRef]
  29. Mofokeng, J.P.; Luyt, A.S.; Tábi, T.; Kovács, J. Comparison of injection moulded, natural fibre-reinforced composites with PP and PLA as matrices. J. Thermoplast. Compos. Mater. 2012, 25, 927–948. [Google Scholar] [CrossRef]
  30. Chandra, S.; Bag, S.; Das, P.; Bhattacharya, D.; Pramanik, P. Fabrication of magnetically separable palladium-graphene nanocomposite with unique catalytic property of hydrogenation. Chem. Phys. Lett. 2012, 519–520, 59–63. [Google Scholar] [CrossRef]
  31. Doganay, D.; Coskun, S.; Kaynak, C.; Unalan, H.E. Electrical, mechanical and thermal properties of aligned silver nanowire/polylactide nanocomposite films. Compos. Part B Eng. 2016, 99, 288–296. [Google Scholar] [CrossRef]
  32. Viskadourakis, Z.; Perrakis, G.; Symeou, E.; Giapintzakis, J.; Kenanakis, G. Transport properties of 3D printed polymer nanocomposites for potential thermoelectric applications. Appl. Phys. A Mater. Sci. Process. 2019, 125, 159. [Google Scholar] [CrossRef]
  33. Cuiffo, M.A.; Snyder, J.; Elliott, A.M.; Romero, N.; Kannan, S.; Halada, G.P. Impact of the fused deposition (FDM) printing process on polylactic acid (PLA) chemistry and structure. Appl. Sci. 2017, 7, 579. [Google Scholar] [CrossRef]
  34. Liao, Y.; Liu, C.; Coppola, B.; Barra, G.; Di Maio, L.; Incarnato, L.; Lafdi, K. Effect of Porosity and Crystallinity on 3D Printed PLA Properties. Polymers 2019, 11, 1487. [Google Scholar] [CrossRef] [PubMed]
  35. Farah, S.; Anderson, D.G.; Langer, R. Physical and mechanical properties of PLA, and their functions in widespread applications—A comprehensive review. Adv. Drug Deliv. Rev. 2016, 107, 367–392. [Google Scholar] [CrossRef]
  36. Pop, M.A.; Croitoru, C.; Bedő, T.; Geaman, V.; Radomir, I.; Coșnița, M.; Zaharia, S.M.; Chicoș, L.A.; Miloșan, I. Structural changes during 3D printing of bioderived and synthetic thermoplastic materials. J. Appl. Polym. Sci. 2019, 136, 47382. [Google Scholar] [CrossRef]
Figure 1. Fracture resistance of PLA FDM models with 50% infill: (a) impact on bottom layer, and (b) impact on upper layer.
Applsci 14 02035 g001
Figure 2. Fracture resistance of PLA FDM models with 100% infill.
Applsci 14 02035 g002
Figure 3. Micrograph of PLA FDM models after mechanical testing; (a) 2 mm sample made with 50% infill (front view under a magnification of 5×), (b) 5 mm sample made with 50% infill (front view under a magnification of 5×), (c) 3 mm sample made with 100% infill (cross-section view under a magnification of 5×), and (d) 5 mm sample made with 100% infill (front view under a magnification of 5×).
Applsci 14 02035 g003aApplsci 14 02035 g003b
Figure 4. SEM micrograph of PLA filament cross-section.
Applsci 14 02035 g004
Figure 5. SEM micrograph of the interior of the 3D print made with 50% infill.
Applsci 14 02035 g005
Figure 6. SEM micrograph of 3D print made with 100% infill; (a) side view under a magnification of 50×, (b) side view under a magnification of 200×, and (c) cross-section view under a magnification of 50×.
Applsci 14 02035 g006
Figure 7. SEM micrograph of 3D print made with 100% infill (cross section view under magnification of 200×).
Applsci 14 02035 g007
Figure 8. FTIR spectra of PLA FDM models made with 100% infill and neat PLA filament.
Applsci 14 02035 g008
Table 1. Printing conditions.
Nozzle Temperature 190 °C
Bed temperature60 °C
Layer thickness0.14 mm
Layer print speed45 mm/s
Number of side walls4
Wall print speed22.5 mm/s
Number of initial (bottom) and final (top) layers4
Infill50%
Infill print speed60 mm/s
Table 2. Mass of printed samples.
Sample Sample Mass/g
100% infill 5 mm 5.88 ± 0.02
100% infill 3 mm3.56 ± 0.01
100% infill 2 mm2.25 ± 0.01
50% infill 5 mm 4.28 ± 0.01
50% infill 3 mm2.792 ± 0.009
50% infill 2 mm1.928 ± 0.0001
Table 3. Vibrational bands of PLA filament and their assignations.
Peak Position/cm−1Assignation According to Refs. [26,27,31,32,33]
2922C-H stretching
2850C-H stretching
1746C=O stretching
1454-CH3 asymmetric bending
1384-C–H symmetric bending
1359-C–H symmetric bending
1267-C–H bending
-C–O–C stretching
1182-C-O-C symmetric stretching
1078CH3 deformation
C–O-C stretching
1037C–CH3 stretching
868C–COO vibration
754C=O stretching
Table 4. Crystallinity index of PLA filament and printed FDM samples with 100% infill.
SampleCrystallinity Index
filament1.23
100% infill 5 mm 0.69
100% infill 3 mm0.97
100% infill 2 mm0.57
Disclaimer/Publisher’s Note: The statements, opinions and data contained in all publications are solely those of the individual author(s) and contributor(s) and not of MDPI and/or the editor(s). MDPI and/or the editor(s) disclaim responsibility for any injury to people or property resulting from any ideas, methods, instructions or products referred to in the content.

