Article

Evaluating Turkey-Derived Lactic-Acid-Producing Bacteria as Potential Probiotics for Use in Commercial Turkeys

1
Department of Veterinary and Biomedical Sciences, College of Veterinary Medicine, University of Minnesota, Saint Paul, MN 55108, USA
2
Department of Animal Science, College of Food, Agricultural and Natural Resource Sciences, University of Minnesota, Saint Paul, MN 55108, USA
*
Author to whom correspondence should be addressed.
Appl. Sci. 2024, 14(5), 2010; https://doi.org/10.3390/app14052010
Submission received: 5 February 2024 / Revised: 22 February 2024 / Accepted: 27 February 2024 / Published: 29 February 2024
(This article belongs to the Special Issue Applied Microbial Biotechnology for Poultry Science)

Abstract

:
Lactic-acid-producing bacteria (LAB) are widely used in the poultry industry, and they are positively associated with gut health and growth performance. Despite their wide use in poultry production, LAB appear to be highly variable in their ability to modulate poultry gut health and growth performance. Furthermore, most commercially available LAB probiotics are not host specific; thus, few poultry-specific and even fewer turkey-specific probiotics exist. The objective of this study was to use probiotic screening assays to compare relevant phenotypic differences amongst different species of turkey-derived LAB, in an effort to identify potential probiotics for use in turkey production. Different in vitro assays were used to compare the probiotic potential (phenotype) of each turkey-derived LAB isolate. Twenty-four isolates representing eight different species and five different genera were used for our experiments. These assays included acid tolerance, bile tolerance, and adhesion ability. There was variability in assay performance across many individual strains in every assay performed. Isolates between species and, in some cases, isolates within the same species, differed in their performance between the assays. Some isolates that were identified performed favorably in all the assays in this study. In conclusion, high-performing isolates were identified in this study, which hold potential for influencing turkey health and productivity.

1. Introduction

Increased consumer demand for poultry raised without antibiotics, coupled with increased federal regulation surrounding the use of antibiotics in food animals, has led to a decrease in antibiotic use in commercial poultry production [1]. Antibiotics have historically been used in commercial poultry production because they have been effective at preventing and treating disease and improving animal performance [2]. The recent decrease in the ability to use antimicrobials in commercial poultry production has led to a need for effective alternatives to antibiotics. Ideally, antibiotic alternatives should be able to both increase poultry growth performance and improve overall bird health.
Many different antibiotic alternative supplements are currently being utilized in poultry production. Some of these include prebiotics, probiotics, postbiotics, vaccines, or combinations thereof [3]. Of these broad categories, probiotics (often referred to in food animals as directly fed microbials or DFMs) are live beneficial bacteria that can be supplemented to enhance the intestinal microbiome [4]. Probiotic supplementation and its corresponding microbiome modulation have been shown to mitigate pathogenic bacteria capable of causing poultry disease [5]. Probiotic supplementation with some species of bacteria in livestock and poultry have also been associated with increased weight gain and growth performance [6]. Since probiotics are live cultures, they need certain attributes for maximal efficacy. A successful probiotic needs to survive the transit through the poultry gastrointestinal tract, including the acidic environments of the proventriculus and gizzard [7]. Probiotics must also be able to survive in the presence of bile salts produced by the host [7]. Finally, to avoid the need for continuous administration, a probiotic should be able to persist in the host; thus, they should have strong host cell adhesion and colonization properties [7]. Ideally, optimal probiotics are also able to inhibit pathogens, either indirectly through nutrient and space acquisition or by producing molecules that directly target pathogens [3].
Lactic acid bacteria (LAB) are some of the most frequently used types of probiotic bacteria in poultry [3]. LAB are widely used because they are natural inhabitants of the animal gastrointestinal tract, and they can withstand the harsh environment of the digestive system [3]. LAB are defined by their ability to produce lactic acid as the major metabolic product of carbohydrate fermentation [8]. They are mostly made up of organisms found in the family Lactobacillaceae. LAB have been linked to beneficial gut health and development in poultry [6]. Supplementation with LAB has also been linked to increased growth performance in poultry [4,6,9,10,11]. Many commercially produced LAB probiotics are currently on the market. In fact, poultry probiotics is an industry valued at over $100 million USD worldwide and is forecasted to double in value by 2030 [12].
Despite the popularity of poultry probiotics, scientific evidence regarding their meaningful impacts on poultry health and growth performance seems to be highly varied. One aspect of probiotics often overlooked is host specificity [4]. There is evidence that host specificity may have a positive impact on the success of LAB in a respective host species, including specificity between chicken and turkey hosts [4]. This suggests that coevolution and adaptation of the host and its microbiome may provide a niche advantage for naturally occurring host-specific bacterial strains [4]. Currently, most probiotics marketed for use in poultry are not poultry derived at all. Of those that are poultry sourced, most are derived from chickens. Therefore, there is a need for turkey-sourced probiotic options that have stronger specificity for colonizing the turkey host. This study was performed in an effort to identify turkey-sourced probiotics with potential for use in commercial turkey production.

2. Materials and Methods

2.1. Bacterial Isolates

LAB isolates were collected from the ileal and cecal contents of commercial and research turkey flocks in a previous study [4]. Briefly, samples were collected from birds aged 0–10 weeks from two high-performing flocks housed at the University of Minnesota and from a high-performing commercial turkey flock in Iowa. Birds in these flocks were fed standard corn:soybean diets. The isolates were derived from ileal and cecal contents, which were diluted and plated on De Man, Rogosa, and Sharpe (MRS) agar (BD Difco, Franklin Lakes, NJ, USA). The isolates were stored in 20% glycerol at −80 °C until further use.
For initial speciation of the turkey LAB isolates, PCR was performed with F342 and 518R 16S rRNA universal primers, 5′-CCTACGGGAGGCAGCAG-3′ and 5′-ATTACCGCGGCTGCTGG-3′, following a previously described protocol (Human Microbiome Project, 2012). Sanger sequencing was performed on each amplicon at the University of Minnesota Genomics Center. Following sequencing, each forward and reverse read was quality trimmed and aligned using DNASTAR version 9.0 software (Lasergene, Madison, WI, USA). The sequences were then searched against NCBI reference genomes using BLASTN for the best hit analysis to identify the closest matching bacterial species. Species were identified based on >95% sequence similarity. The isolates were later sequenced using Illumina MiSeq technology, as previously described [4]. The assembled sequences were then compared to an existing database for speciation using the entire genome’s average nucleotide identity (ANI) [13].
Reference genomes of LAB were also used to create a phylogenetic tree depicting the relationships among the isolates used in this study and existing isolates of known bacterial species. For this, the full 16S rRNA reference sequences were downloaded from NCBI and aligned with the full 16S rRNA sequences from the isolates within this study using MUSCLE [14] in the MEGA 11 software [15]. Phylogenetic analyses were performed using Maximum Likelihood with the GTR model with 1000 bootstrap iterations.

2.2. Acid Tolerance

A 1 μL loopful from the glycerol stock of each isolate of LAB (n = 24) was grown in 10 mL of MRS broth at 37 °C for 18 h with shaking in aerobic conditions to reach 108 CFU/mL. The MRS broth was prepared, the pH was adjusted to 2.0, 3.0, and 4.0 using 0.1 N HCl, and this was then filter sterilized using a 0.2 μm filter. Two hundred μL of MRS broth was then added into designated wells of a 96-well plate reader microtiter plate. For matched controls, 200 μL of MRS broth without pH adjustment (pH 6.0) was added into designated wells of the same plate. Five μL of overnight culture was inoculated into the designated wells of the microtiter plate containing the pH-adjusted and control pH MRS. Representative wells containing all 4 media types were left uninoculated for blank subtraction. Using the Epoch 2 plate reader (BioTek Instruments, Winooski, VT, USA), the plate was incubated for 18 h at 37 °C with shaking in aerobic conditions. OD600 measurements were taken every 10 min for the duration of the incubation. Blank subtraction and the area under the curve were calculated for pH 2.0, 3.0, 4.0, and 6.0 using 18-h growth curves for each isolate (Gen5 v 3.08; “growthcurver” package in R v 4.0.3). Area under the curve differences between pH 2.0, 3.0, or 4.0, and pH 6.0 18-h growth curves were compared between isolates. These experiments were run in replicates of 2 with 2 biological replications for a total of 4 replicates per isolate.

2.3. Bile Salt Tolerance

A 1 μL loopful from the glycerol stock of each isolate of LAB (n = 24) was grown in 10 mL of MRS broth at 37 °C for 18 h with shaking in aerobic conditions to reach 108 CFU/mL. The MRS broth was prepared, and the pH was adjusted to 8.0 (using 1 N NaOH). Bile salts were added at concentrations of 0.3%, 0.15%, and 0.03% w/v (Bile Salts, #3, Criterion). The bile salt containing MRS was then filter sterilized using a 0.2 um filter. Two hundred μL of MRS broth containing 0.3%, 0.15%, and 0.03% w/v bile salts were added into designated wells of a 96-well plate reader microtiter plate. For matched controls, 200 μL of MRS broth without added bile salt, pH adjusted to 8 (using 1 N NaOH), was added into designated wells of the same plate. A protocol matching that used for the acid tolerance assays was used for this study to compare treatments with different bile concentrations.

2.4. Bile Salt Hydrolase Activity

A 1 μL loopful from the glycerol stock of each isolate of lactic acid bacteria (n = 24) was grown in 10 mL of MRS broth at 37 °C for 18 h with shaking in aerobic conditions to reach 108 CFU/mL. MRS agar plates were prepared containing 0.5% (w/v) taurodeoxycholic acid sodium salt (MilliporeSigma, Burlington, MA, USA). MRS agar plates without supplements were also prepared for the controls. Each overnight bacterial culture was streaked onto individual MRS agar plates with and without taurodeoxycholic acid sodium salt. The streaked plates were incubated anaerobically (grown in Rubbermaid containers with AnaeroPack™ Anaerobic Gas Generator sachets inside) at 37 °C for 48 h. Using colony morphology, bile salt hydrolase activity was identified for each isolate grown on taurodeoxycholic acid sodium salt positive plates following a previously established protocol [16]. Two replications were performed per isolate.

2.5. Avian Cell Association Assay

Budgerigar Abdominal Tumor Cells (BATCs) [17] were grown in a complete Dulbecco’s Modified Eagle Medium (DMEM) (Thermo Fisher Scientific, Waltham, MA, USA), supplemented with 20% Fetal Bovine Serum (Thermo Fisher Scientific, Waltham, MA, USA). The cells were grown in 75 cm2 cell culture flasks (CellBIND surface; Corning Inc., Corning, NY, USA) and incubated at 37 °C under 5% CO2. The cells were cultured to reach >95% confluence. The confluent cells were seeded into 24-well tissue culture plates (Corning Inc., Corning, NY, USA) containing 1 mL of complete medium and were grown for 48 h to reach >95% confluence (105 cells/wells) in the wells. Each strain tested (n = 24) was first grown in MRS broth at 37 °C for 18 h with shaking in aerobic conditions to reach 108 CFU/mL. These bacteria were centrifuged at 4000× g for 10 min at 25 °C, washed once, and resuspended in PBS. An initial OD600 reading was taken for each isolate prior to inoculation. The BATC cells in the 24 wells (105 cells/wells) were washed three times with PBS. The BATC cells immersed in 1 mL of PBS were then inoculated with 106 CFU/mL of each test strain separately and were incubated for 2 h at 37 °C under 5% CO2.
Following incubation, the cells were washed three times with PBS to remove the unattached bacterial cells. The cells were then incubated in 1 mL of 0.1% Triton X-100 for 15 min at 37 °C under CO2 for host cell lysis. The cell lysates were then serially diluted in PBS, and appropriate dilutions of lysates were plated on MRS plates and incubated for 48 h at 37 °C in anaerobic conditions. The plates were counted for CFU/mL determination. To calculate the initial CFU/mL for each isolate, the individual OD600 reading was inserted into to a calibration curve equation determined for a representative strain from each genus. Isolate ID UMNLJ21 was selected for the Lactobacillus genus: CFU/mL initial = (((1 × 10⁸) × OD600) − (5 × 10⁶)). Isolate ID MOF2W3B1T3 was selected for the Ligilactobacillus genus: CFU/mL initial = (((2 × 10⁸) × OD600) − (4 × 10⁷)). Isolate ID MOF2W3B1C8 was selected for the Limosilactobacillus genus: CFU/mL initial = (((7 × 10⁸) × OD600) − (1 × 10⁸)). Isolate ID MOF2W1LC6 was selected for the Pediococcus genus: CFU/mL initial = (((3 × 10⁹) × OD600) − (1 × 10⁹)). Isolate ID MOF2W2LT2 was selected for the Weissella genus: CFU/mL initial = (((1 × 10⁷) × OD600) + (132,508)). Percent adherence was calculated by dividing the final CFU/mL by the initial CFU/mL and multiplying by 100 for each replicate. Prior to statistical comparison, outliers were identified and removed. Outliers were defined as a single isolate replicate > 15% different from all the other replicates of the same isolate. N = 8 outliers were identified and removed from the dataset prior to statistical comparison. The isolates that had outliers removed from their dataset were MOF2W1B3C5, MOF2W1LC6, MOF2W3B1T2, MOF2W3B5T3, MOF2W3LC2, MOF2W5B1C1, MOF2W6B4C10, and SNF2W3B2M2.

2.6. Statistical Analysis

Area under the curve percent differences between bile-positive and bile-negative 18-h growth curves were determined for each isolate and were compared between species using a one-way ANOVA (randomized design) [18]. Similarly, for acid tolerance assays, the percent difference in the area under the curve between the pH-adjusted (pH 2.0, 3.0, and 4.0) and non-pH-adjusted (pH 6.0) growth curves were compared between species. For BATC association assays, species and individual isolate differences were calculated in a similar manner. Post hoc comparisons were performed for all comparisons using Tukey’s tests. Statistical analyses were performed using R v.4.3.1.

3. Results

3.1. Isolation and Species Identification of Turkey-Sourced Lactic Acid Bacteria

A total of 1268 LAB isolates were obtained. From these, 24 turkey-sourced isolates were selected for the probiotic phenotypic assays (Table 1). These isolates represented eight different species and five different genera. The isolates were selected based on being species associated with positive probiotic performance from both previous research studies that our laboratory and other research groups have conducted [9,19,20]. A phylogenetic tree of the Lactobacillus and Lactobacillus-like species, based on 16S rRNA sequences, was also created to better understand the relatedness of the isolates to known LAB species (Figure 1) and agreed with the ANI results.

3.2. Turkey-Sourced LAB Vary in Their Ability to Grow in Acidic Conditions

To compare the candidate probiotic strains in their ability to survive the acidic conditions of the turkey gastrointestinal tract, each stains’ ability to grow in MRS agar was tested following pH adjustment to 2.0, 3.0, or 4.0. At a pH of 2.0, isolate percent growth ranged from 5–8% (Table S1). There was little variability between the species in growth at a pH of 2.0, with no statistically significant differences (Figure S1). When the pH was increased to 3.0, the percent growth ranged from 9–49% (Table S1). P. acidilactici had a higher mean growth compared to most other species (Figure 2). L. gallinarum had the lowest mean growth. Percent growth ranged from 11–90% (Table S1) when the pH was increased to 4.0. L. vaginalis had higher mean growth than almost all other species (Figure 2). P. acidilactici had higher mean growth than four out of seven other species. L. johnsonii had the lowest mean growth.

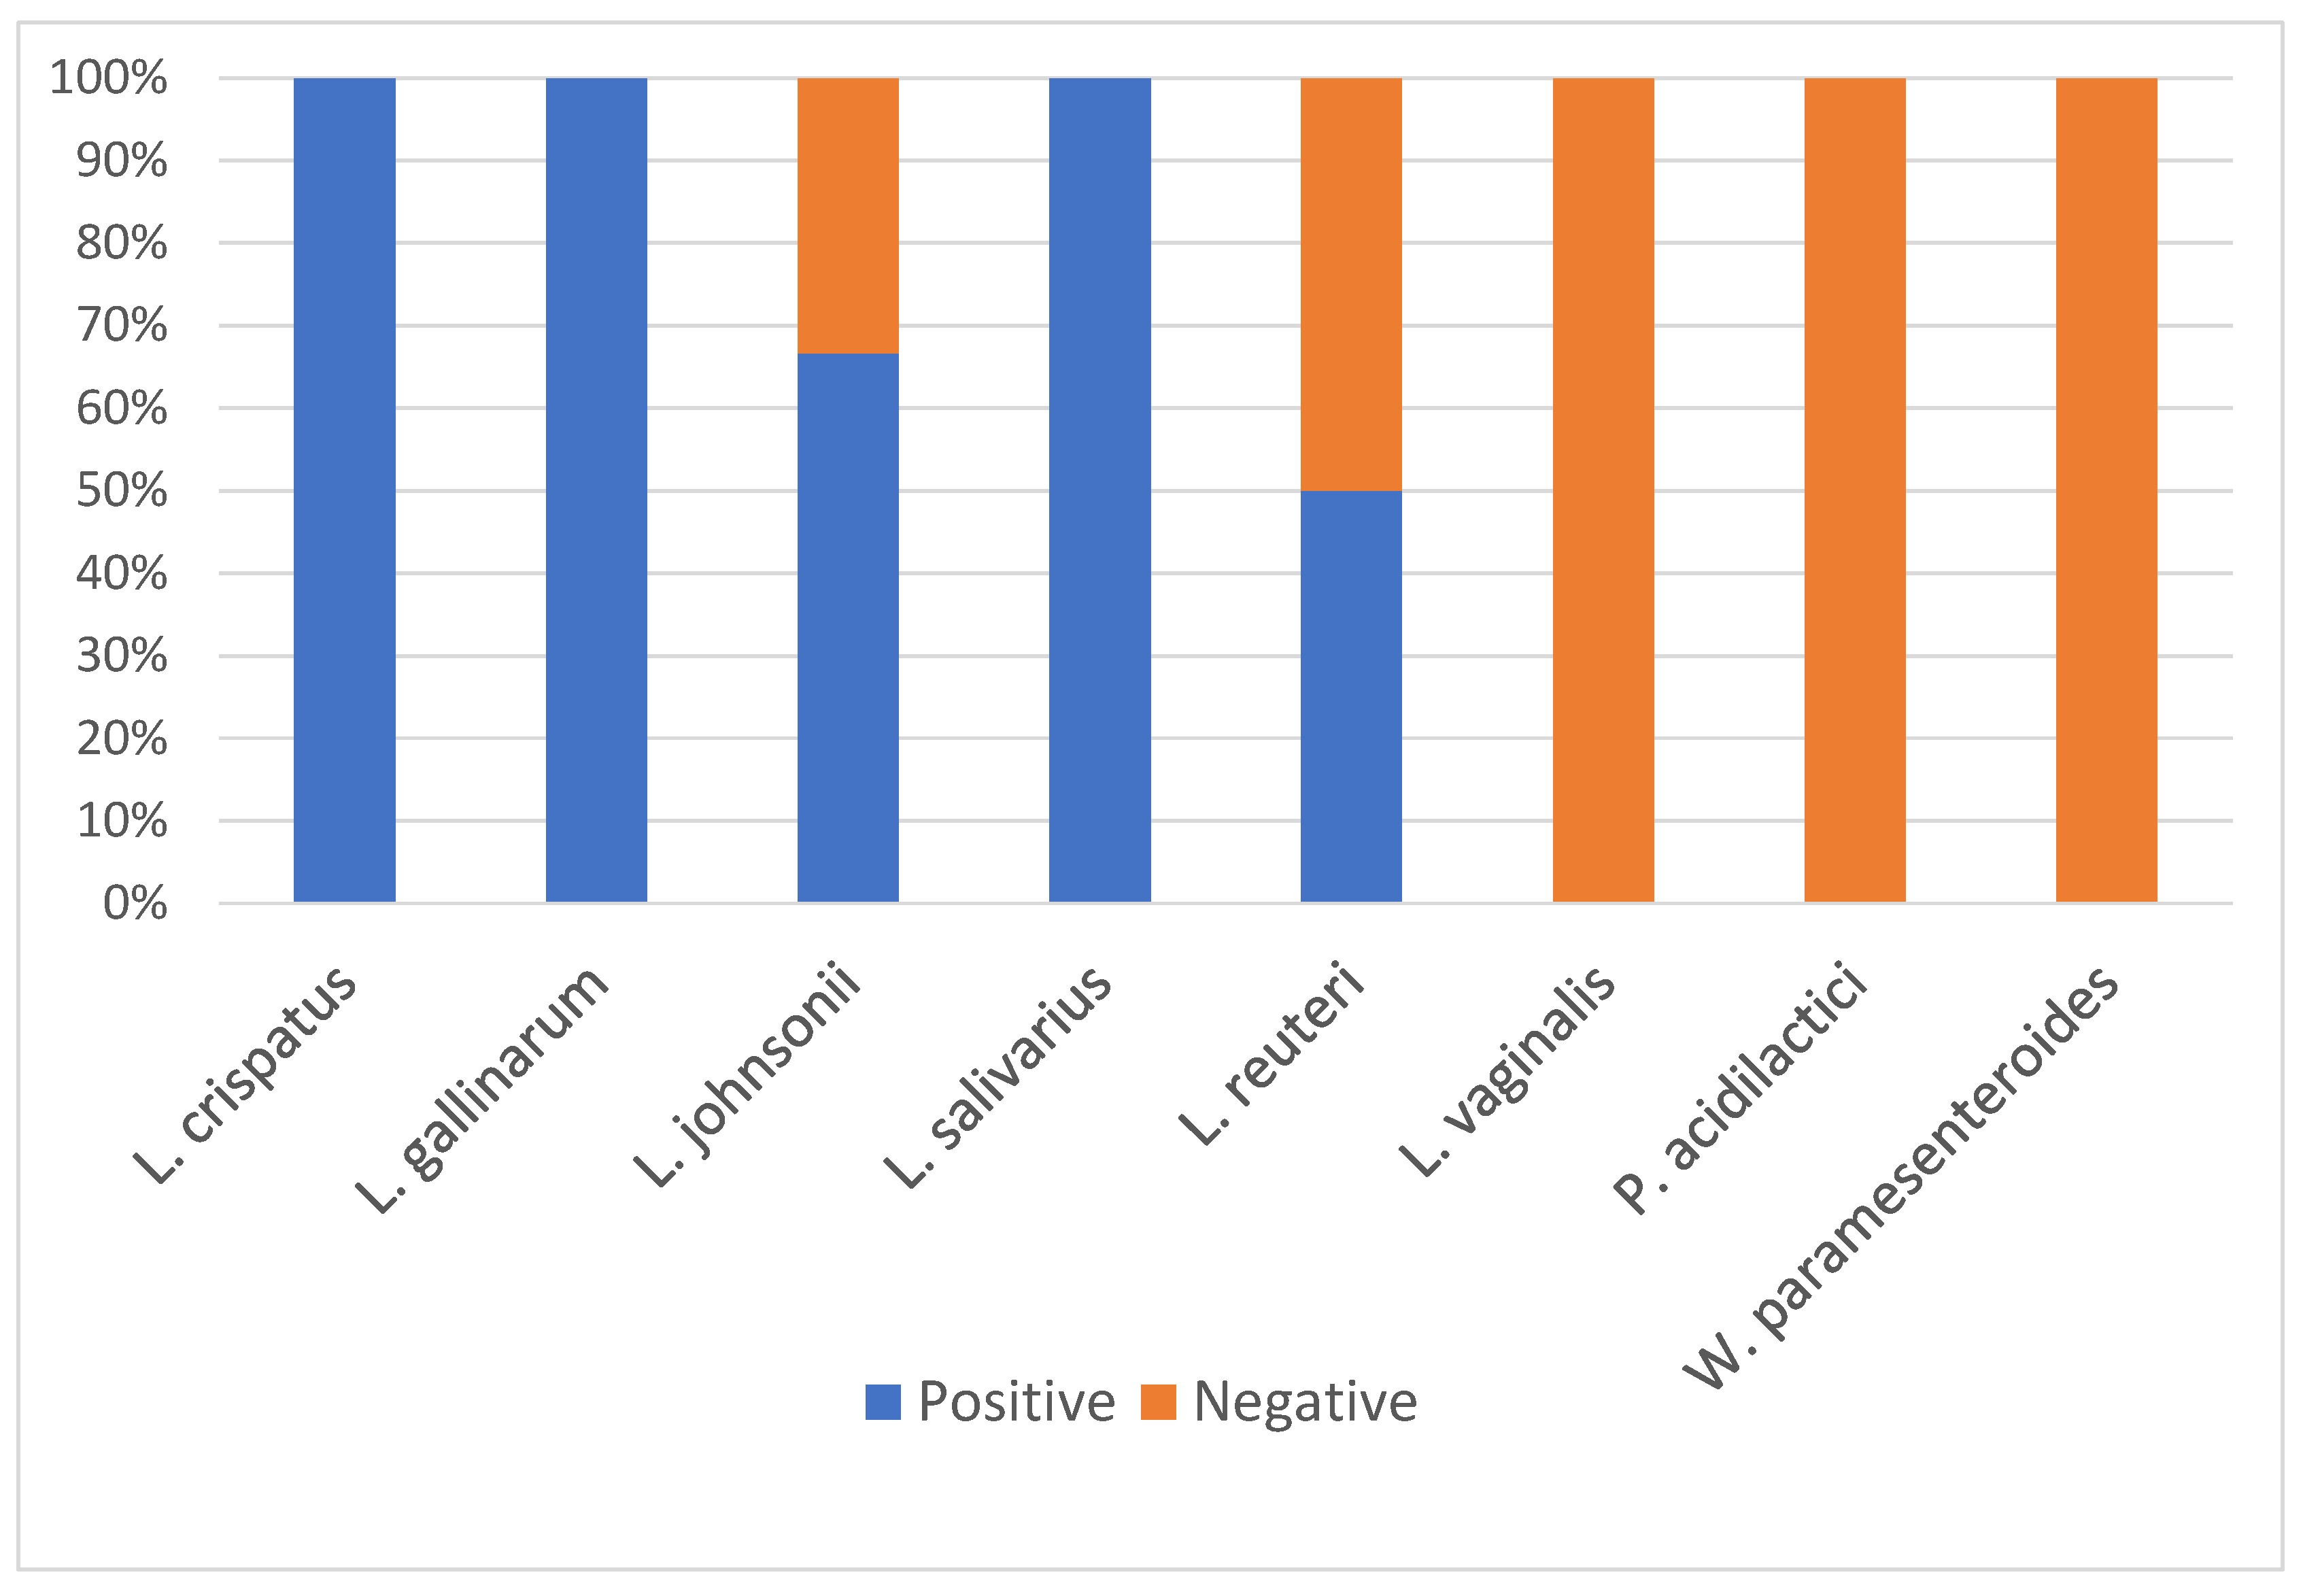
3.3. Turkey-Sourced LAB Vary in Their Response to Bile

To test each isolate’s ability to survive in the turkey small intestine and withstand the effects of bile, each isolate was first tested for the presence of bile salt hydrolase (BSH) activity. BSH is an enzyme that deconjugates bile salts and aids in tolerance to bile. BSH activity can be detected when unconjugated bile acid precipitates in agar and forms a powdery halo around the bacterial colonies when grown on agar containing bile salts (Figure S2). All L. crispatus, L. gallinarum, and L. salivarius isolates were positive for BSH activity (Figure 3, Table S1). All L. vaginalis, W. paramesenteroides, and P. acidilactici isolates were negative for BSH activity (Figure 3, Table S1). One L. reuteri was positive and one was negative for BSH activity (Figure 3, Table S1). One L. johnsonii was negative and two were positive for BSH activity (Figure 3, Table S1).
In addition to testing BSH activity, the growth of the isolates was also examined in mixed bile salts to determine whether BSH activity correlated with growth in bile. When grown in bile containing 0.03% w/v bile salts, isolate percent growth ranged from 41–104% (Table S1). There was little variability between species growth in media containing 0.03% w/v bile, with 22/24 isolates having percent growth over 80% (Table S1, Figure S3). The single L. vaginalis that was tested had statistically significantly decreased growth in media containing 0.03% w/v bile, with 41% growth. When the bile concentration was increased to 0.15% w/v, the percent growth range was 24–90% (Table S1). All P. acidilactici isolates were numerically higher in percent growth than all the other isolates and were statistically significantly higher in percent growth than three out of seven species (Figure 4). W. paramesenteroides was the second highest percent growth species numerically. Most of the other species had similar percent growth in bile to each other (Figure 4). The L. crispatus group had significant variability at this concentration of bile (Figure 4). Interestingly, the two low-performing L. crispatus (MOF2W6B4C10 and MOF2W6B4C8; percent growth 24.7% and 24.9%, respectively) and the three higher-performing L. crispatus (SNF2W3B2M1, SNF2W6B1L3, and MOF2W3B1T2; percent growth 43%, 58%, and 60%, respectively) formed cluster sub-groupings in the phylogenetic tree (Table S1, Figure 1). When comparing percent growth in 0.3% w/v, the highest bile concentration tested, the range of percent growth was 0.32–76% (Table S1). All Lactobacillus and Lactobacillus-like isolates had percent growth of <17%. P. acidilactici had statistically significantly higher growth than all other species (Figure 4). W. paramesenteroides had numerically higher growth than all species except P. acidilactici and statistically significantly higher growth than five out of seven other species (Figure 4).
When comparing percent growth to BSH activity, it is interesting to note that the high-performing species W. paramesenteroides and P. acidilactici both had isolates that were all negative for BSH (Figure 3 and Figure 4). In the BSH tests, the L. reuteri isolate MOF2W3B1C8 was negative for BSH activity, and SNF2W3B2M2 was positive for BSH activity (Table S1). Even though these isolates had different results for BSH activity, their percent growth was very similar. MOF2W3B1C8 had a percent growth of 14% and 49% for 0.3% and 0.15% bile, respectively, and SNF2W3B2M2 had a percent growth of 16% and 53% for 0.3% and 0.15% bile, respectively (Table S1).

3.4. Turkey-Sourced LAB Vary Individually, but Not by Species in Their Ability to Adhere to Avian Intestinal Cells

In order to test the ability of the turkey-sourced LAB to colonize the gastrointestinal tract in an avian host, their abilities to adhere to an avian intestinal cell line, called Budgerigar Abdominal Tumor Cells (BATCs), were compared. Percent cell adhesion ranged from 45–90% (Table S1). There were no statistically significant differences between the species in percent adhesion (Figure 5). L. johnsonii, P. acidilactici, L. vaginalis, and L. reuteri exhibited the highest and most similar numerical mean percent adhesion, ranging from 86–89%. The four species with numerically lower percent adhesion had increased variability both between and within species (Figure 5, Table S1). W. paramesenteroides had the highest variability in percent adhesion (Figure 5). Isolate MOF2W3LC2 had a percent adhesion of 45% and isolate MOF2W1LC8 had a percent adhesion of 88% (Table S1, Figure S4). W. paramesenteroides isolate MOF2W3LC2 had statistically significantly lower percent adhesion than all the other isolates (Figure S4). L. crispatus isolate SNF2W3B2M1 (percent adhesion 67%) had statistically significantly lower percent adhesion than 16/23 other isolates (Figure S4).

4. Discussion

When comparing turkey-sourced LAB isolates for their ability to grow in acidic conditions, isolates at the species level displayed variability in growth at a pH of 4.0, with L. vaginalis and P. acidilactici showing the highest growth. These results are consistent with other studies performed on isolates of these species derived from host sources other than poultry [21,22]. When the pH was decreased to 3.0, the variability in performance between species decreased, but P. acidilactici had higher growth than most other isolates. Although P. acidilactici has previously been shown to survive in rather acidic conditions, others evaluating this species from non-poultry sources have shown that it was not able to grow well at all when the pH was decreased to 3.0 [21]. This suggests that our turkey-sourced P. acidilactici isolates have properties that allow them to survive in the acidic environment of the poultry digestive tract.
In our study, we were able to show that P. acidilactici and W. paramesenteroides had consistently high growth in bile compared to all the other species of LAB. The tolerance of P. acidilactici to higher bile concentrations is consistent with other findings in the literature regarding non-poultry-derived isolates [23]. However, W. paramesenteroides non-poultry-derived isolates had varying ability to grow in bile, with many falling into moderate to poor categories of bile growth performance [24,25]. Some of these grew much poorer in bile compared to Lactobacillus species in the same test, although none were the same species of Lactobacillus used in our study [25]. When comparing these results to our BSH activity assay, we found that although P. acidilactici and W. paramesenteroides had the highest growth in bile, they were all negative for BSH activity. When looking at the results of BSH activity and growth in bile from other species, BSH activity did not seem to affect bile growth performance. In some cases, the presence or absence of BSH activity seemed to have an inverse relationship with increased bile growth. Differences between BSH activity and growth in bile could be due to the use of a single pure bile salt (taurodeoxycholic acid sodium salt), whereas growth in bile involved a mixture of bile salts. P. acidilactici and W. paramesenteroides are potentially able to deconjugate other forms of bile salts found in the bile salt mixture. Other possibilities could be that P. acidilactici and W. paramesenteroides have other mechanisms to survive and grow in bile or have overall increased fitness. When investigating the NCBI gene database, bile salt hydrolase genes have currently been identified in other Pediococcus and Weissella species, but not in the species evaluated in this study [26]. Even though BSH activity is a common probiotic screen method, our results suggest that a more thorough phenotypic evaluation is necessary when assessing an isolate’s ability to survive in bile.
When comparing the ability of different LAB species to adhere to avian intestinal cells, no significant variation was observed. There was some within-species variability found within this assay, especially in the W. paramesenteroides species. Varied adherence ability in W. paramesenteroides isolates is consistent with another study investigating mucin adhesion [27]. This assay can help to inform which specific isolates should be avoided due to potentially low colonization ability when selecting probiotic candidates.
These phenotypic assays can be helpful in narrowing down a large collection of probiotic candidates based on probiotic relevant screenings. However, a limitation of this approach is that it is unclear whether such in vitro differences translate to positive effects in the bird. Bird performance studies are needed to better evaluate and understand the performance differences between different turkey-sourced LAB. Since the isolates of P. acidilactici had consistently high performance in all of our in vitro assays, these isolates are candidates to test in live turkeys for their impact on gut health or growth performance. Studies in chickens that linked P. acidilactici supplementation with increased growth performance, gut health, and decreased pathogen burden further support the use of these probiotics in future turkey performance trials [28,29]. Also, since the microbiome contains many species of bacteria living synergistically, mixed species of these strains with probiotic potential could provide synergistic effects [9]. Importantly, all of these bacteria were isolated from the natural turkey microbiome and have displayed at least genus-level correlations with positive performance; thus, they are assumed to have already co-adapted to exist and function together. Previous work describing L. johnsonii host adaptation to poultry, and even specifically to chickens and turkeys, reinforces the concept that host-specific LAB are a potentially important area of research and development within poultry probiotic production [4]. Combining host-adapted strains within a multi-strain probiotic cocktail could lead to a probiotic product with the consistently positive results that turkey producers are seeking and a product that does not necessitate continuous administration in feed.

Supplementary Materials

The following supporting information can be downloaded at: https://www.mdpi.com/article/10.3390/app14052010/s1, Table S1: A table containing each isolate ID, species, and result for each probiotic performance assay; Figure S1: Percent growth in pH 2.0 using percent area under the curve compared to matched controls by species (n = 24). Significance was set at p ≤ 0.05; Figure S2: An example of a bile-salt-hydrolase-activity-positive L. johnsonii isolate with powdery halo (left) and a bile-salt-hydrolase-activity-negative W. paramesenteroides isolate (right); Figure S3: Percent growth using percent area under the curve compared to matched controls by species in 0.03% w/v (n = 24). Significant differences are depicted with distinct letters. Significance was set at p ≤ 0.05; Figure S4: Percent of starting inoculum adhesion to BATC cells by individual isolate. Individual replicates of each isolate are depicted (four replicates of 24 isolates, n = 96). Significant differences are depicted with distinct letters. Significance was set at p ≤ 0.05.

Author Contributions

Conceptualization, A.J. and T.J.J.; methodology, A.J., T.J.J., A.K.J. and D.T.N.; software, A.J. and T.J.J.; validation, A.J., B.P.W. and T.J.J.; formal analysis, A.J. and T.J.J.; investigation, A.J., B.P.W. and T.J.J.; resources, T.J.J., R.S.S. and A.K.J.; data curation, T.J.J.; writing—original draft preparation, A.J. and T.J.J.; writing—review and editing, A.J., B.P.W., D.T.N., R.S.S., A.K.J. and T.J.J.; visualization, A.J. and T.J.J.; supervision, T.J.J., R.S.S. and A.K.J.; project administration, T.J.J.; funding acquisition, T.J.J. All authors have read and agreed to the published version of the manuscript.

Funding

This research was funded in part by a research contract from Cargill Health Technologies, Cargill Inc.

Institutional Review Board Statement

Not applicable.

Informed Consent Statement

Not applicable.

Data Availability Statement

The raw data supporting the conclusions of this article will be made available by the authors on request.

Acknowledgments

We wish to thank Briana Kozlowicz for their helpful discussions related to this work.

Conflicts of Interest

The authors declare no conflicts of interest. The funders had no role in the design of the study; in the collection, analyses, or interpretation of data; in the writing of the manuscript; or in the decision to publish the results.

References

  1. Singer, R.S.; Porter, L.J.; Thomson, D.U.; Gage, M.; Beaudoin, A.; Wishnie, J.K. Raising Animals Without Antibiotics: U.S. Producer and Veterinarian Experiences and Opinions. Front. Vet. Sci. 2019, 6, 452. [Google Scholar] [CrossRef]
  2. Dibner, J.J.; Richards, J.D. Antibiotic growth promoters in agriculture: History and mode of action. Poult. Sci. 2005, 84, 634–643. [Google Scholar] [CrossRef]
  3. Abd El-Hack, M.E.; El-Saadony, M.T.; Salem, H.M.; El-Tahan, A.M.; Soliman, M.M.; Youssef, G.B.A.; Taha, A.E.; Soliman, S.M.; Ahmed, A.E.; El-Kott, A.F.; et al. Alternatives to antibiotics for organic poultry production: Types, modes of action and impacts on bird’s health and production. Poult. Sci. 2022, 101, 101696. [Google Scholar] [CrossRef]
  4. Johnson, A.; Miller, E.A.; Weber, B.; Figueroa, C.F.; Aguayo, J.M.; Johny, A.K.; Noll, S.; Brannon, J.; Kozlowicz, B.; Johnson, T.J. Evidence of host specificity in Lactobacillus johnsonii genomes and its influence on probiotic potential in poultry. Poult. Sci. 2023, 102, 102858. [Google Scholar] [CrossRef]
  5. Manes-Lazaro, R.; Van Diemen, P.M.; Pin, C.; Mayer, M.J.; Stevens, M.P.; Narbad, A. Administration of Lactobacillus johnsonii FI9785 to chickens affects colonisation by Campylobacter jejuni and the intestinal microbiota. Br. Poult. Sci. 2017, 58, 373–381. [Google Scholar] [CrossRef]
  6. Gao, P.; Ma, C.; Sun, Z.; Wang, L.; Huang, S.; Su, X.; Xu, J.; Zhang, H. Feed-additive probiotics accelerate yet antibiotics delay intestinal microbiota maturation in broiler chicken. Microbiome 2017, 5, 91. [Google Scholar] [CrossRef]
  7. Nair, D.V.T.; Kollanoor Johny, A. Characterizing the Antimicrobial Function of a Dairy-Originated Probiotic, Propionibacterium freudenreichii, Against Multidrug-Resistant Salmonella enterica Serovar Heidelberg in Turkey Poults. Front. Microbiol. 2018, 9, 1475. [Google Scholar] [CrossRef] [PubMed]
  8. Abedi, E.; Hashemi, S.M.B. Lactic acid production-producing microorganisms and substrates sources-state of art. Heliyon 2020, 6, e04974. [Google Scholar] [CrossRef] [PubMed]
  9. Ward, T.L.; Weber, B.P.; Mendoza, K.M.; Danzeisen, J.L.; Llop, K.; Lang, K.; Clayton, J.B.; Grace, E.; Brannon, J.; Radovic, I.; et al. Antibiotics and Host-Tailored Probiotics Similarly Modulate Effects on the Developing Avian Microbiome, Mycobiome, and Host Gene Expression. mBio 2019, 10, e02171-19. [Google Scholar] [CrossRef] [PubMed]
  10. Casas, I.; Edens, F.; Parkhurst, C.; Dobrogosz, W. Probiotic Administrations of Lactobacillus Reuteri Moderate Avian Growth Depression in Turkeys. Biosci. Microflora 1998, 17, 125–131. [Google Scholar] [CrossRef]
  11. Khabirov, A.; Khaziakhmetov, F.; Rebezov, Y.; Gorelik, O.; Derkho, M.; Fedoseeva, N.; Lykasova, N.; Kuznetsov, A.; Samorodvoa, I. Effect of Feeding Diet Containing Probiotics on Growth Rate and Hematological Changes in the Blood of Turkeys. Int. J. Pharm. Res. 2020, 12, 1454. [Google Scholar]
  12. Partners, T.I. Poultry Probiotic Market to Reach $188 Million by 2030-Exclusive Report by the Insight Partners. Available online: https://www.globenewswire.com/news-release/2023/11/08/2776279/0/en/Poultry-Probiotic-Market-to-Reach-188-Million-by-2030-Exclusive-Report-by-The-Insight-Partners.html (accessed on 10 January 2024).
  13. Rodriguez, R.L.; Gunturu, S.; Harvey, W.T.; Rosselló-Mora, R.; Tiedje, J.M.; Cole, J.R.; Konstantinidis, K.T. The Microbial Genomes Atlas (MiGA) webserver: Taxonomic and gene diversity analysis of Archaea and Bacteria at the whole genome level. Nucleic Acids Res. 2018, 46 (W1), W282–W288. [Google Scholar] [CrossRef]
  14. Edgar, R.C. MUSCLE: Multiple sequence alignment with high accuracy and high throughput. Nucleic Acids Res. 2004, 32, 1792–1797. [Google Scholar] [CrossRef] [PubMed]
  15. Kumar, S.; Stecher, G.; Li, M.; Knyaz, C.; Tamura, K. MEGA X: Molecular Evolutionary Genetics Analysis across Computing Platforms. Mol. Biol. Evol. 2018, 35, 1547–1549. [Google Scholar] [CrossRef] [PubMed]
  16. Owusu-Kwarteng, J.; Tano-Debrah, K.; Akabanda, F.; Jespersen, L. Technological properties and probiotic potential of Lactobacillus fermentum strains isolated from West African fermented millet dough. BMC Microbiol. 2015, 15, 261. [Google Scholar] [CrossRef] [PubMed]
  17. Thomas, J.V.; Nair, D.V.T.; Noll, S.; Johnson, T.J.; Cardona, C.; Johny, A.K. Effect of Turkey-Derived Beneficial Bacteria Lactobacillus salivarius and Lactobacillus ingluviei on a Multidrug-Resistant Salmonella Heidelberg Strain in Turkey Poults. J. Food Prot. 2019, 82, 435–440. [Google Scholar] [CrossRef] [PubMed]
  18. Sprouffske, K.; Wagner, A. Growthcurver: An R package for obtaining interpretable metrics from microbial growth curves. BMC Bioinform. 2016, 17, 172. [Google Scholar] [CrossRef]
  19. Johnson, T.J.; Youmans, B.P.; Noll, S.; Cardona, C.; Evans, N.P.; Karnezos, T.P.; Ngunjiri, J.M.; Abundo, M.C.; Lee, C.W. A Consistent and Predictable Commercial Broiler Chicken Bacterial Microbiota in Antibiotic-Free Production Displays Strong Correlations with Performance. Appl. Environ. Microbiol. 2018, 84, e00362-18. [Google Scholar] [CrossRef]
  20. Danzeisen, J.L.; Calvert, A.J.; Noll, S.L.; McComb, B.; Sherwood, J.S.; Logue, C.M.; Johnson, T.J. Succession of the turkey gastrointestinal bacterial microbiome related to weight gain. PeerJ 2013, 1, e237. [Google Scholar] [CrossRef]
  21. Zhao, M.; Liu, K.; Zhang, Y.; Li, Y.; Zhou, N.; Li, G. Probiotic characteristics and whole-genome sequence analysis of Pediococcus acidilactici isolated from the feces of adult beagles. Front. Microbiol. 2023, 14, 1179953. [Google Scholar]
  22. Diaz, M.; Del Rio, B.; Ladero, V.; Redruello, B.; Fernandez, M.; Martin, M.C.; Alvarez, M.A. Histamine production in Lactobacillus vaginalis improves cell survival at low pH by counteracting the acidification of the cytosol. Int. J. Food Microbiol. 2020, 321, 108548. [Google Scholar] [CrossRef]
  23. Olajugbagbe, T.E.; Elugbadebo, O.E.; Omafuvbe, B.O. Probiotic potentials of Pediococuss acidilactici isolated from wara; A Nigerian unripened soft cheese. Heliyon 2020, 6, e04889. [Google Scholar] [CrossRef]
  24. Sulistiani; Novarina, I.; Inawati; Dinoto, A.; Julistiono, H.; Handayani, R.; Saputra, S. Assessment of Potential Probiotic Lactic Acid Bacteria from Tempe and Tape. IOP Conf. Ser. Earth Environ. Sci. 2020, 572, 012026. [Google Scholar] [CrossRef]
  25. Li, L.; Zhang, N.; Kong, L.; Zhao, W.; Xiao, Y.; Li, B.; Han, X. Identification and Selection of Lactic Acid Bacteria Resistance to Acid and Bile Salt Isolated from Corn Silage. J. Pure Appl. Microbiol. 2015, 9, 13–23. [Google Scholar]
  26. Sayers, E.; Bolton, E.E.; Brister, J.R.; Canese, K.; Chan, J.; Comeau, D.C.; Conner, R.; Funk, K.; Kelly, C.; Kim, S.; et al. Database Resources of the National Center for Biotechnology Information. Nucleic Acids Res. 2022, 50, D20–D26. [Google Scholar] [CrossRef]
  27. Pabari, K.; Pithva, S.; Kothari, C.; Purama, R.K.; Kondepudi, K.K.; Vyas, B.R.M.; Kothari, R.; Ambalam, P. Evaluation of Probiotic Properties and Prebiotic Utilization Potential of Weissella paramesenteroides Isolated From Fruits. Probiotics Antimicrob. Proteins 2020, 12, 1126–1138. [Google Scholar] [CrossRef] [PubMed]
  28. Merati, R.; Mohamed, A.A.A.-F.; Berrama, Z.; Aggad, H.; Hammoudi, A.; Temim, S. The effects of Pediococcus acidilactici and Saccharomyces cerevisiae on broiler chickens challenged with Clostridium perfringens induced subclinical necrotic enteritis. Vet. Arh. 2021, 91, 389–397. [Google Scholar] [CrossRef]
  29. Rahmani Alizadeh, M.; Aliakbarpour, H.-R.; Hashemi Karouei, S.M. Effect of dietary supplementation of Iranian multi-strain probiotic or P. acidilactici of camel milk isolate on broilers performance, blood parameters, intestinal histology, and microbiota. Ital. J. Anim. Sci. 2023, 22, 660–665. [Google Scholar] [CrossRef]
Figure 1. A phylogenetic tree of the different Lactobacillus and Lactobacillus-like species included in our study (colored blue) based on full-length 16S rRNA sequences, compared to known species representatives (colored black). The scale is based upon 1628 nucleotide positions in the final dataset.
Applsci 14 02010 g001
Figure 2. Percent growth using percent area under the curve compared to matched controls by species. Growth in pH 3.0 (top) and growth in pH 4.0 (bottom), n = 24. Significant differences are depicted with distinct letters. Significance was set at p ≤ 0.05.
Applsci 14 02010 g002
Figure 3. Percent of isolates that were positive and negative for bile salt hydrolase activity by species (n = 24).
Applsci 14 02010 g003
Figure 4. Percent growth using percent area under the curve compared to matched controls by species. Growth in 0.15% w/v bile (top) and growth in 0.3% w/v (bottom), n = 24. Significant differences are depicted with distinct letters. Significance was set at p ≤ 0.05, denoted by letter differences above boxes.
Applsci 14 02010 g004aApplsci 14 02010 g004b
Figure 5. Percent of starting inoculum adhesion to BATC cells, n = 24. Significance was set at p ≤ 0.05.
Applsci 14 02010 g005
Table 1. A list of the isolates selected for our study and species identification using whole-genome ANI.
Closest Species MatchANI (%)
MOF2W3B1T2Lactobacillus crispatus98.0
MOF2W6B4C10Lactobacillus crispatus97.8
MOF2W6B4C8Lactobacillus crispatus97.7
SNF2W3B2M1Lactobacillus crispatus97.8
SNF2W6B1L3Lactobacillus crispatus97.9
MOF2W10B1T3Lactobacillus gallinarum97.7
MOF2W1B3C5Lactobacillus gallinarum97.7
MOF2W3B5T3Lactobacillus gallinarum97.9
MOF2W5B1C1Lactobacillus gallinarum98.1
SNF2W3B1L8Lactobacillus gallinarum97.8
UMNLJ21Lactobacillus johnsonii97.5
SNF2W1B5L4Lactobacillus johnsonii97.7
SNF2W3B3L6Lactobacillus johnsonii97.8
MOF2W3B1T3Ligilactobacillus salivarius97.2
MOF2W6B4C3Ligilactobacillus salivarius97.2
MOF2W3B1C8Limosilactobacillus reuteri95.8
SNF2W3B2M2Limosilactobacillus reuteri96.0
SNF2W3B1L7Limosilactobacillus vaginalis98.8
MOF2W1LC6Pediococcus acidilactici98.6
MOF2W1LT10Pediococcus acidilactici98.7
MOF2W5B3T3Pediococcus acidilactici98.5
MOF2W1LC8Weissella paramesenteroides98.0
MOF2W2LT2Weissella paramesenteroides98.2
MOF2W3LC2Weissella paramesenteroides98.0
Disclaimer/Publisher’s Note: The statements, opinions and data contained in all publications are solely those of the individual author(s) and contributor(s) and not of MDPI and/or the editor(s). MDPI and/or the editor(s) disclaim responsibility for any injury to people or property resulting from any ideas, methods, instructions or products referred to in the content.

